
Abstract
Penalty kicks are key moments in soccer, yet their success depends not only on strategic shot placement but also on a player’s ability to execute accurately under pressure. This study investigates how variability in kicking accuracy affects optimal aim during penalty kicks. Using data from 4299 penalties in Danish youth leagues and 1060 laboratory-measured kicks from academy players, we modeled the bivariate distribution of shot placement and applied Monte Carlo simulations to identify optimal aiming strategies. Results show that while top corners yield the highest scoring percentages on average, players with higher shot variability achieve better outcomes by aiming for more central and lower zones of the goal. Conversely, players with greater consistency can exploit more challenging placements for higher success rates. Additionally, the orientation of shot variability—horizontal versus vertical—affects the location of the optimal aim point. These findings suggest that effective penalty strategies should be individualized, taking into account each player’s performance profile. By bridging statistical models with practical execution data, this study provides actionable insights for players, coaches, and analysts aiming to improve penalty kick outcomes through tailored strategies.
Introduction
Penalty kicks in soccer often represent key moments in soccer matches. Accordingly, these have been studied extensively.1–8 The apparent simplicity of the task, a direct shot from 11 m with only the goalkeeper to beat, results in conversion rates of 78% during match play and 69%–77% during penalty shoot-outs.9,10
The outcome of a penalty kick in soccer is shaped by a complex interplay of perceptual, psychological, technical, and situational factors. Among these, attention and gaze behavior play a crucial role; for instance, focusing too much on the goalkeeper has been shown to increase the likelihood of saves. 5 Psychological stress and anxiety also contribute, as high-stakes moments, such as the tense walk to the penalty spot, can disrupt both focus and motor control. 6 In terms of decision-making, the kicker’s chosen strategy, whether keeper-dependent or keeper-independent, is equally effective at the elite level. 7 Spatial influences, such as the goalkeeper’s initial position, may bias shot direction, although they do not consistently determine outcomes in professional play. 2 Beyond these immediate factors, broader contextual elements, including league characteristics, match status, timing, and player experience, further affect success rates. Evidence indicates that experienced and regularly selected players tend to perform better under pressure, and that penalty success is often higher during matches, when the score is tied, particularly when kicks occur in the middle or later stages of a match. 1 Taken together, these findings emphasize that penalty success arises from a dynamic interaction between cognitive focus, emotional regulation, strategic choice, and situational context.
Irrespective of the above, there is consensus that scoring percentages vary across different sections of the goal, with high and wide placements often yielding the highest success rates due to their difficulty for goalkeepers to reach.11,12 Central placements carry a higher risk if the goalkeeper anticipates the trajectory correctly. These patterns have been well-documented, providing players and coaches with valuable insights into the probabilities associated with various shot placements. 13
However, the translation of these probabilities into successful execution is not straightforward. While a player may aim for an optimal section of the goal, the actual placement of the ball often deviates from the desired placement. 14 The extent to which variations in shot placement influence where a player should aim has not been investigated previously. The inherent variation introduces a layer of uncertainty, emphasizing that the outcome of a penalty kick is influenced, not only by where the player aims, but also by the consistency of their strike and the movement of the goalkeeper. 3
Youth players differ from adult players in specific respects. They are, of course, smaller in both height and body mass. However, their precision in shooting does not differ substantially. No significant differences in shot accuracy are observed between Under 15 and Under 19 players. 15 In contrast, shooting velocity increases with age.15,16 At the same time, goalkeepers’ reach increases with age as a function of their greater body height. The extended goalkeeper-reach increases the accuracy demands placed on older players, although these demands may be diminished by their higher shot speed.
The purpose of the present study is to find the optimal shot placement for youth players, given variations in actual ball placement during a soccer penalty. By combining statistical analysis of scoring percentages with variation in shot accuracy, we aim to provide a more comprehensive understanding of how to optimize penalty kick strategies. In doing so, we hope to bridge the gap between theoretical optimality and practical execution, offering actionable insights for players, coaches, and analysts.
Methods
Conceptual overview
Establish empirically, through real-match observations, the goal scoring probability in different zones of the goal.
Measure, under laboratory conditions, the distribution of kick locations relative to an aiming point and establish a bivariate accuracy distribution for groups of players.
Combine (a) and (b) to simulate kicks at aiming points across the entire goal to estimate the goal scoring probability for each aiming point.
Change the angle of the kick variation (enclosing ellipse) and estimate goal scoring probability as in (c).
Penalty conversion rate for shots in different zones of the goal
Since 2021, drawn matches in the top Danish youth soccer leagues (Boys: Under 15 to Under 19, Girls: Under 16 to Under 19) were decided by penalty shootouts. During these shootouts, a member of the staff from each team noted the placement of the shots from their own team and whether they resulted in a goal. 17 The goal was divided into 15 sections, and data from 4299 penalty kicks were collected. 17
The kicks included both right- and left-footed shots. All left-footed kicks were mirrored, as right-footed kickers tend to place the ball to the left and left-footed kickers to the right. 2 An overview of the results can be seen in Figure 1, where the scoring percentage in each zone of the goal is summarized. From the figure it can be seen that all shots that were directed towards the top left corner of the goal resulted in a goal, whereas shots directed towards the middle of the goal resulted in a goal in 80.3% of the shots. The overall conversion rate was 76.8%.
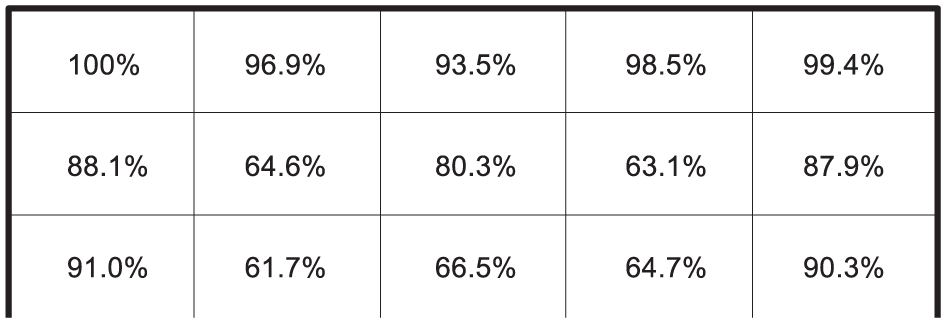
Scoring percentages in different goal zones calculated from 4299 observed penalty kicks (Modified from Noe and Porse 2024 to exclude shots that did not hit the goal). The goal is viewed from the kicker’s perspective.
Bivariate distribution of kicks
Kicking performance was assessed for all players from an elite academy (Under 15 to Under 19, n = 53). All subjects, or their legal guardians, gave their written informed consent to participate in the study. The study was approved by the Aarhus University Ethics Committee (approval number 2025-0799558).
Testing took place in an indoor biomechanics laboratory equipped with an artificial grass surface (GreenFields MX NF v.2.0, Netherlands), utilizing a Select Brilliant Super ball inflated to 0.9 bar (Select Brillant Super Season 2024-25, Select Sport A/S, Denmark). Participants wore their regular soccer boots in line with findings from Sterzing and Hennig. 18 Prior to testing, a standardized warm-up protocol was conducted, comprising 5 min of cycling at a self-selected intensity, 20 leg swings with the kicking leg (10 in the sagittal plane and 10 in the transverse plane), and 3 warm-up kicks performed at a self-selected intensity.
After the warm-up, the participants performed three kicks from a distance of 11 m, where the aim was to produce the highest maximal ball speed. If the maximal ball speed was found in the final kick, a further kick was performed to determine the maximal ball speed. The ball speed was measured using a Doppler-radar (Supido Sports Speed Radar, United States).
Kicking accuracy was assessed exclusively for the dominant leg, independently of kicking speed, in accordance with findings by Andersen and Dörge 19 and was conducted similarly to Carstensen et al. 20 Accuracy was measured using a two-camera system to determine the distance from the ball to a target, represented by a cross suspended at a height of 1.60 m. On two separate days, participants performed 10 kicks from a distance of 11 m, with 30-s rest intervals between attempts. 21 This resulted in a total of 20 kicks per subject, used to determine variation in kicking accuracy (Figure 2). Consistent with the protocol described by Radman, Wessner, 21 the ball was rolled forward and kicked while in motion. Based on the findings of previous studies, participants were instructed to kick at no less than 75% of their measured maximum ball speed. Kicks that did not meet this speed threshold were excluded from the accuracy analysis, and the participant repeated the attempt. Ball speed was recorded using the same radar system as in the maximal ball speed test.
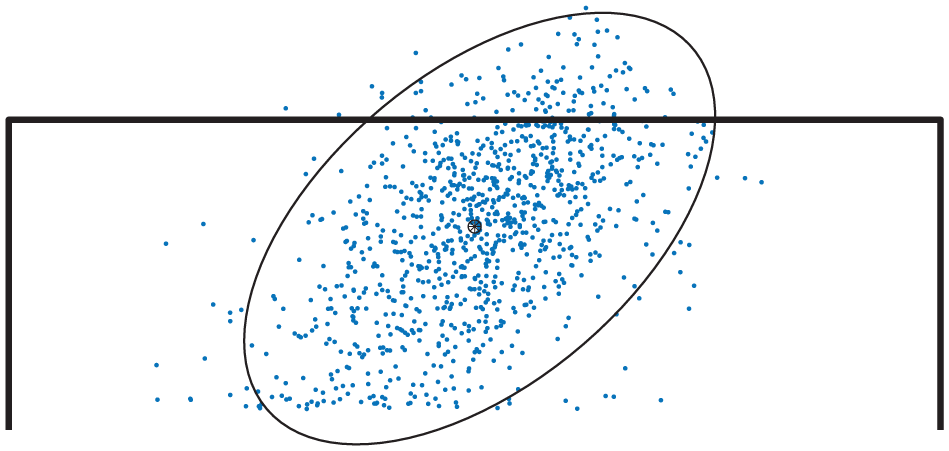
All 1060 measured kicks from the kicking accuracy experiments. All shots were aimed at the middle of the goal at a height of 1.6 m (marked with a black circle). The goal is illustrated with black lines and the black ellipse illustrates the 95% confidence region of the bivariate distribution.
The placement of the shots was used to calculate a covariance matrix describing the bivariate distribution. The bivariate distribution can be illustrated by an enclosing ellipse, describing the 95% confidence region (Figure 2).
All kicks from left-footed players were mirrored because right-footed kickers tend to miss below and left of the target or above and to the right and left-footed kickers along a reflected axis. 14 The bivariate distribution was calculated for all shots for all subjects (Mean variation), for all shots from the five subjects with the smallest variance (Small variation) and for all shots from the five subjects with the largest variance (Large variation).
Conversion rate depending on the aim of shots
A Monte Carlo method was used to determine the scoring percentage when aiming at different points in the goal. 22 The bivariate distribution found in the kicking experiments was used to simulate 10,000 kicks in each of 10,000 points in the goal (200 horizontal by 50 vertical). A Matlab function (mvnrnd.m) was used to generate multivariate random numbers based on the bivariate distribution found in the kicking experiments. An example of 1000 simulated kicks aimed just inside the top left corner of the goal is seen in Figure 3. In this example, some of the simulated kicks hit outside the goal which corresponds to a scoring percentage of zero and some of the kicks hit inside the goal with a scoring percentage given by its placement in the different zones of the goal, according to Figure 1. For shots aimed at each point, the scoring percentage was calculated as the mean scoring percentage of all the simulated kicks aimed at that position.
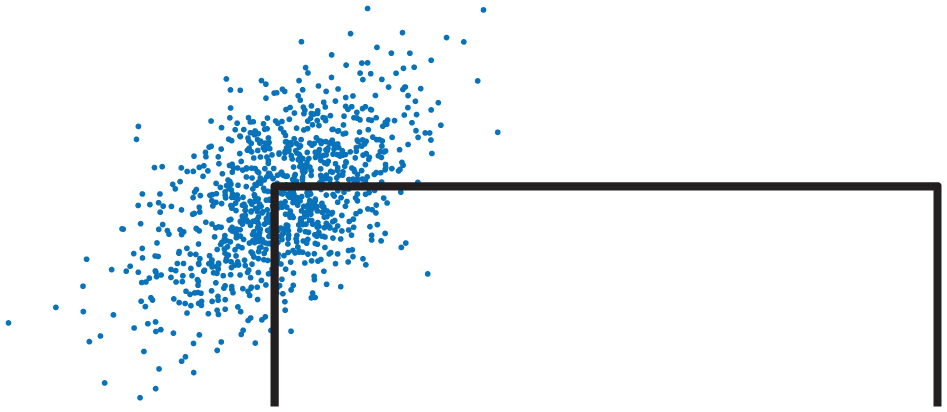
An example of 1000 simulated kicks aimed just inside the top left corner of the goal. The simulated kicks were generated from the bivariate distribution that was calculated from the laboratory kicking experiments (see Figure 2). The goal is illustrated with black lines.
Changes in angle enclosing ellipse of bivariate distribution
Depending on the distribution of individual kicks, the orientation of the enclosing ellipse will vary. It is conceivable that this angle depends on the type of kick or individual differences. We have also attempted to simulate different types of kicksby varying the angle of the enclosing ellipse from 0° (horizontal distribution) to 90° (vertical distribution). Subsequently, and in the same manner as described in the previous section, we calculated the conversion rate within the goal for varying ellipse angles.
Results
The maximal goal conversion rate, based on the distribution from the whole group of subjects (Mean variation) was 78.4% (Figure 4). This rate was found for shots aimed 2.26 m to the left of the goalkeeper (the middle of the goal) and aimed at a height of 1.22 m (Table 1). The players with less variation (Small variation) should aim further away from the goalkeeper and a bit higher, resulting in a conversion rate of 86.2%. In contrast, players with larger shot variation (Large variation) should aim for a point closer to the goalkeeper at a lower height,. resulting in a conversion rate of 75.3%.
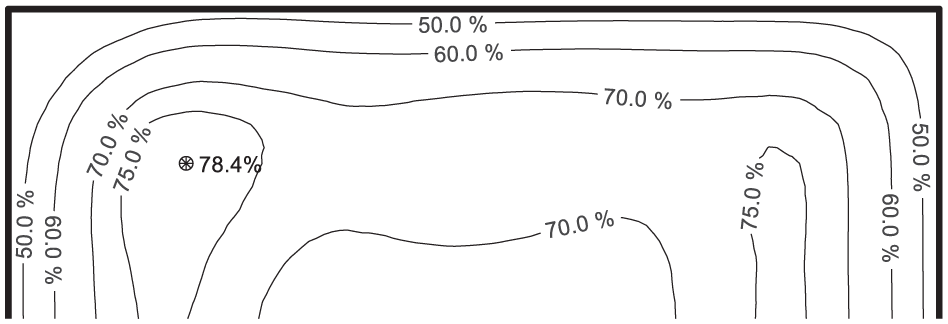
Goal conversion rates in the goal, which is illustrated with black lines. The maximal rate is indicated and marked with a circle. The lines, and the corresponding percentages, are iso-lines. This distribution is based on the average of all players.
Maximal goal conversion rates and coordinates of the maximal goal conversion rates for the groups with different shot variation.
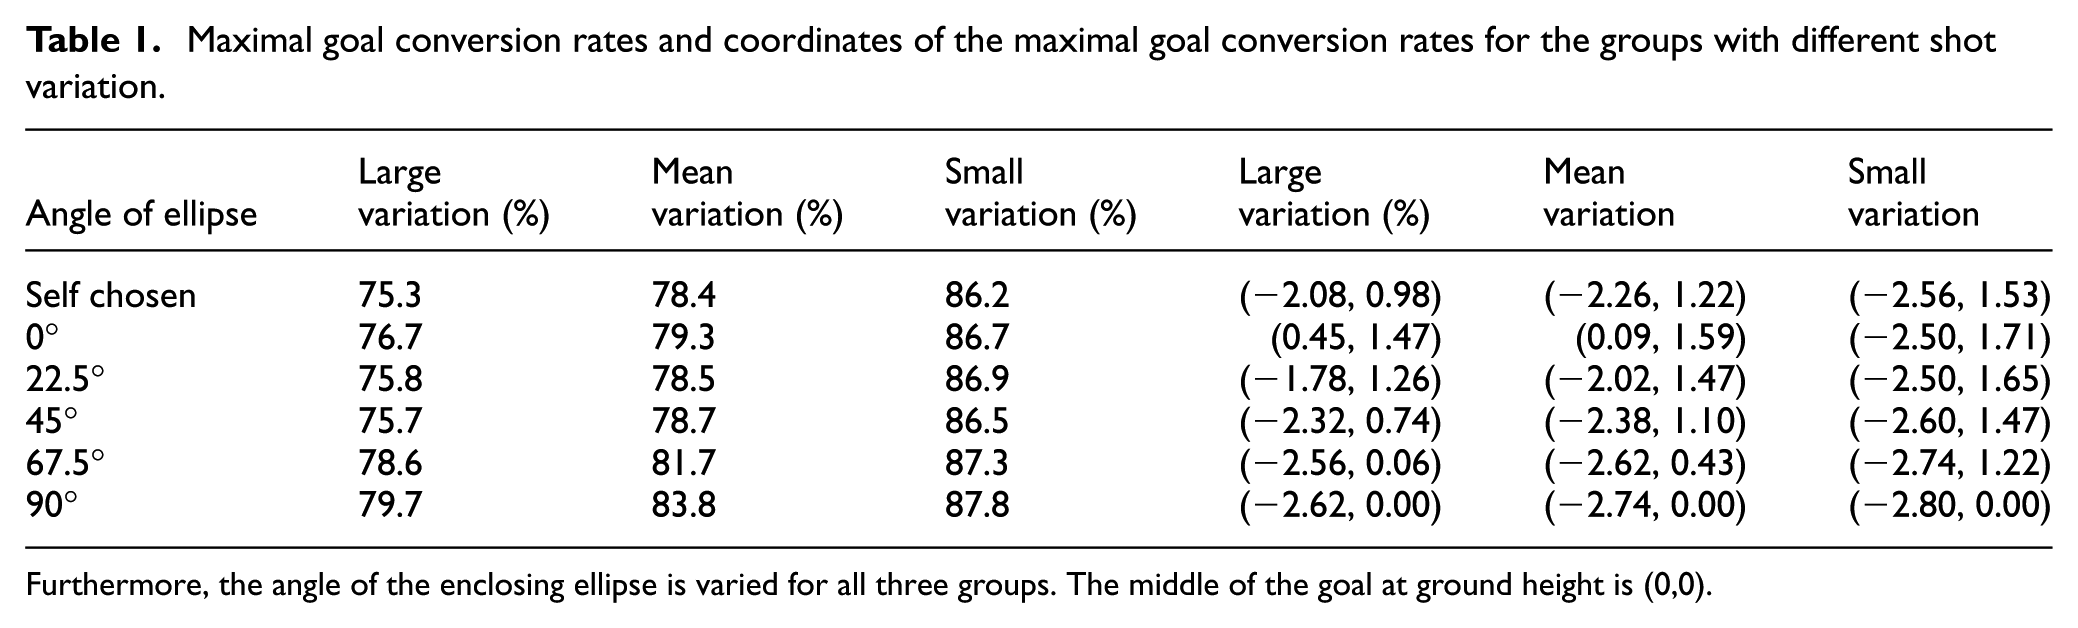
Furthermore, the angle of the enclosing ellipse is varied for all three groups. The middle of the goal at ground height is (0,0).
When varying the angle of the enclosing ellipse, the point of maximal conversion rate shifts within the goal. When the enclosing ellipse is horizontal, then the optimal point lies higher and in the middle of the goal, whereas a vertical ellipse corresponds to an optimal point close to the ground in the side of the goal (Figure 5 and Table 1).
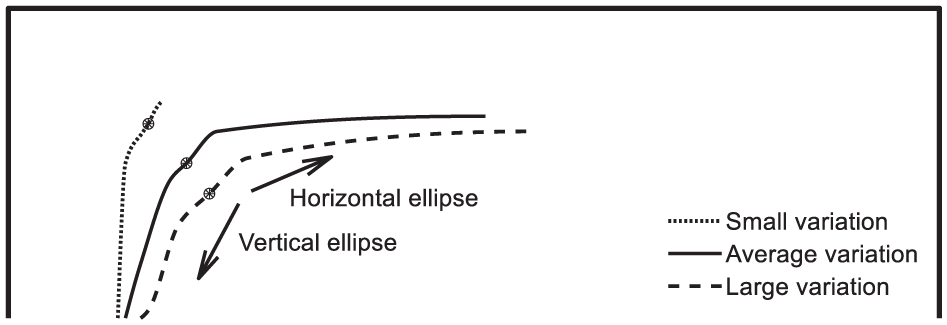
The point of maximal goal conversion rate for the three different groups when varying the angle of the enclosing ellipse. When the enclosing ellipse is more vertical, the optimal point of aim is moved towards the left and lower, whereas a more horizontal ellipse moves the optimal point higher to the right. The solid line is based on the data from all subjects, the dashed line is based on data from the subjects with the largest kicking variability and the dotted line from the subjects with the smallest kicking variability. The circles indicate the optimal aiming point, based on the non-rotated ellipse.
Discussion
The results of this study confirm that the optimal aim point for penalty kicks is not fixed across all players but depends significantly on the variation in kicking accuracy. Players with low shot variation benefit from aiming further toward the top corners of the goal, while players with greater variability in their kicks achieve higher conversion rates by targeting more central, lower-risk zones. These differences reflect a fundamental trade-off in soccer penalty strategy: while some locations are statistically associated with higher scoring percentages (Figure 1), the effectiveness of aiming at these points is strongly modulated by a player’s individual ability to consistently place the ball there.
The Monte Carlo simulations used in this study highlight the importance of incorporating execution variability into shot placement strategies. While prior work has demonstrated that high and wide placements yield the best outcomes on average due to the goalkeeper’s limited reach, 13 our findings demonstrate that the practical benefits of aiming at these zones diminish when kicking accuracy is low. This phenomenon aligns with earlier biomechanical modeling studies, such as Hunter et al., 14 which show how variability in two-dimensional shot accuracy alters the effectiveness of any fixed aim strategy.
Interestingly, the orientation of the bivariate distribution (modeled here through elliptical rotations) significantly influenced the optimal aim point. A more horizontal distribution favored higher and more central placements, while a vertical orientation shifted the optimal location downward and laterally. The change in elliptical angle supports the notion that both technical factors (e.g. foot positioning and body posture) and individual biomechanics influence shot dispersion patterns and, consequently, strategic decisions.
The observed differences in simulated maximal goal conversion rates across player subgroups (ranging from 73.8% to 87.5%) further emphasize that a universal penalty strategy is suboptimal. This variation reinforces the need for individualized training and tactical preparation. For example, top-level players may aim for higher-risk zones, while less consistent players might benefit from more conservative strategies. Our results are in line with Almeida et al. 11 and Bar-Eli and Azar 13 who find that, for adult elite players, shooting at the top corners, given that the ball does not hit the goalpost or crossbar, is optimal.
Moreover, the findings extend prior work by Jordet et al.,23,24 who linked stress and situational pressure to performance under penalty conditions. They found that the importance of a penalty kick influences the outcome negatively, whereas our data simplifies the task to focus on the aim of a shot rather than consequences of where the ball will hit. However, our laboratory study was conducted under standardized conditions, where real-game environments introduce psychological noise that could further amplify execution variability. In our laboratory experiments only one subject and one researcher were present. Although this setting minimizes the possible stress, our subjects might have experienced experimental stress simply by being observed. However, this stress is most likely far lower than during an actual penalty shootout. The real match observations in this study were conducted in youth matches with a limited number of spectators present. Conversely, in our laboratory experiments, the subjects kicked a non-stationary ball, which possibly increases shot variability. Future research may benefit from integrating psychological stressors into similar simulation models to assess the robustness of recommended strategies under pressure.
Lastly, while our method effectively models general trends, it assumes a consistent distribution for each player, ignoring intra-individual variance between kicks (e.g. fatigue and decision-making under stress). Further refinement may include real-time adaptive modeling or player-specific profiles that can dynamically adjust optimal aim points based on recent performance metrics.
In summary, our study demonstrates that the best penalty kick strategies must strike a balance between statistical optimality and individual execution capacity. The integration of shot distribution data into simulation models offers a valuable approach for bridging theory and practice, helping players and coaches design data-driven strategies that are tailored to individual performance profiles.
Conclusion
This study demonstrates that optimal penalty kick strategy in soccer cannot be determined solely by static scoring probabilities across goal zones. Instead, the effectiveness of a given shot placement is highly dependent on the player’s individual execution variability. By integrating scoring data with bivariate models of shot dispersion, we show that players with greater shot consistency can aim for riskier, higher-reward zones, while those with greater variability achieve better outcomes by targeting more central, conservative regions of the goal.
Furthermore, the angle of an individual player’s enclosing ellipse—whether more horizontal or vertical—significantly influences the optimal aim point. These insights underscore the importance of personalized training and strategic planning in high-pressure scenarios like penalty shootouts.
In practical terms, this study offers coaches and analysts a framework for tailoring penalty strategies to individual players, balancing the pursuit of high-probability zones with performance variability. Future research may further enhance these recommendations by incorporating psychological stress and real-time performance data into adaptive simulation models.
Footnotes
Acknowledgements
The authors would like to thank the Danish Football Federation (DBU), and especially Nicolai Noe, Rasmus Porse, and Søren Bennike, for giving us access to their data and modifying it to suit our project.
A Large Language Model, ChatGPT o4-mini, was used for language improvement before submission of the manuscript.
Ethical considerations
The study was approved by the Aarhus University Ethics Committee (approval number 2025-0799558) on March 03, 2025.
Consent to participate
All subjects, or their legal guardians, gave their written informed consent to participate in the study.
Funding
The authors received no financial support for the research, authorship, and/or publication of this article.
Declaration of conflicting interests
The authors declared no potential conflicts of interest with respect to the research, authorship, and/or publication of this article.
Data availability statement
Data from the laboratory experiments is available upon reasonable request, by contacting the authors.