
Abstract
Modern, open-wheeled racing cars rely heavily on downforce generated by underbody Venturi tunnels to gain a competitive advantage. While these tunnels are critical to aerodynamic efficiency, their interaction with other components - particularly the rear wing - remains an area worth exploring. This study uses computational fluid dynamics (CFD) to investigate how changing the rear wing’s angle of attack (AoA), defined as the angle between the wing’s chord line and the oncoming airflow, vertical and longitudinal position influences the aerodynamic performance of the underbody and total downforce production. CFD allows for detailed analysis of pressure distribution and flow behaviour, offering insight into how the rear wing affects the efficiency of the Venturi tunnels. Results show that it is important to analyse the underbody and rear wing, both as a system and as separate components, because their individual behaviours do not always reflect their combined effect. In addition, the longitudinal position of the rear wing had the largest impact on the underbody’s performance when compared to the AoA and vertical position. Shifting the rear wing’s position from 5.0 to 5.1 m resulted in an increase in the underbody’s −CL from 1.55 to 2.00. These findings can help engineers to understand better the aerodynamic relationship between the rear wing and underbody, aiding the development of higher-performing race cars. In a competitive motorsport environment where small aerodynamic gains can make a big difference, refining these interactions is key to improving handling, lap times, and sporting performance.
Keywords
Introduction
Improving aerodynamic performance through generating downforce not only increases the competitiveness of the car through increased grip, but also driver safety. Due to the competitive nature of motorsport, there is a lack of openly accessible literature regarding the aerodynamic performance of modern open-wheel competition cars. In competitive racing, small aerodynamic improvements can lead to significant performance gains and, therefore, improved sporting results. 1 Current generation open-wheel competition cars generate a significant amount of their aerodynamic downforce via the underbody. Increasing the understanding of underbody aerodynamic flows and rear wing interactions can increase downforce and help reduce lap times, whilst also benefiting driver safety. 2
Modern, open-wheel competition cars exploit the use of ground effect aerodynamics to maximise downforce generation. The objective is to create low pressure under the car, which is the largest aero-surface available for that purpose. One way to achieve this objective is to accelerate the airflow under the car, provided viscous effects are negligible. Understanding the interaction between pressure and velocity is key to sporting design improvements, which will increase competitiveness. With this increased reliance on underbody downforce generation, the interaction of the underbody with the rear wing has received renewed interest. Due to the position of the rear wing at the exit of the flow from the underbody, there are clear interactions here that can be exploited to improve sporting performance.
There is limited published knowledge covering race car aerodynamics, particularly where underbody flows are concerned in motorsport. Katz and Dykstra, 3 Katz and Largman, 4 and Katz and Dykstra 5 investigated race car aerodynamics, emphasising rear wing, and underbody interactions. Race car models generated a lift coefficient (CL) of −0.08 without a wing, and −1.865 with a wing. This difference in CL values highlighted the increase in downforce due to the addition of the rear wing and emphasised its impact on ground effects. However, these studies did not isolate the effects of the rear wing and the underbody, leaving scope to investigate how much of the downforce was generated via the wing or via the increased aerodynamic performance of the underbody. Whilst the studies are still valid, further study is of interest due to the rapid advancements in motorsport and changes in vehicle shape. This interest was highlighted by Katz 6 where advancements in race car aerodynamics over the last century, and the influence of regulations on design are discussed. However, this study does not include specific insights into rear-wing and underbody interactions. The Katz study underscores the need for modern, detailed research to address this gap and refine aerodynamic understanding. Further studies have also reported how regulation changes drive aerodynamic developments within motorsport. Ravelli 7 investigated Formula 1 aerodynamic packages pre- and post- the 2017 Formula 1 rule changes. Ravelli’s work involved a computational fluid dynamics (CFD) study of downforce and wake generation around individual components, such as the rear wing and underbody, directly relating to this study. Ravelli’s work highlights that updates to the aerodynamic regulations created different wake structures and therefore the aerodynamic performance of the underbody and rear wing. This Ravelli study has high relevance to modern Formula 1 safety and aerodynamic development. Technical regulations are crucial within race car design, as proven by Frostad 8 during their research on aerodynamic improvements of a Formula 1 front wing design from 2018 to 2022. Frostad focussed on new Formula 1 regulations aimed at reducing turbulence and enabling closer racing. Using CFD simulations to replicate wind tunnel tests, Frostad demonstrated the impact of regulatory changes on racing conditions, whilst highlighting innovation within constraints. Frostad’s work suggests further optimisation opportunities in other components, such as diffusers and rear wings. These are particularly pertinent for the overall aerodynamic performance of modern, open-wheel competition cars.
The integration of CFD within motorsport for aerodynamic design complements traditional wind tunnel testing due to its ability to show airflow behaviour and measure forces on individual aerodynamic surfaces. The fact that these airflow and force visualisations can be completed before any manufacturing takes place provides an advantage to designers and aerodynamicists. Several studies highlight the strengths and limitations of CFD in race-car design. Desai et al. 9 examined the aerodynamics of wings, wheels, and underbodies, assessing standalone “fast-turnaround CFD” for predicting aerodynamic coefficients. Desai et al. were able to predict lift coefficients reliably, thus validating the use of CFD for downforce generation. Both Guerro Lorente and Castilla Lopez 10 and Tang 11 explored CFD as a standalone tool without wind tunnels. They focussed on Formula 1 car wake structures and effects to verify CFD’s feasibility. 10 Similarly, Tang confirmed CFD’s reliability in race car analysis, noting that finer meshing around critical areas would enhance accuracy. 11 In addition, Christoffersen 12 analysed wing-diffuser interaction on a Lotus Evora Type 124 Sports Car and emphasised the importance of using prismatic layers during meshing to achieve accurate y+ values, ideally between 0 and 5. The study also validated CFD as a standalone methodology tool, whilst calling for research on more generalised race car models.
Based on this review of the literature, a gap remains in understanding the interactions between underbody Venturi tunnels and rear wings in the most recent generation of open-wheeled competition cars. While prior studies aimed to develop knowledge of aerodynamic interactions, advancements in computational methods and evolving regulations demand updated analysis. By analysing pressure distributions, this study uses CFD to investigate how the vertical and longitudinal positioning and angle of attack (AoA) of the rear wing affect the downforce generation of the underbody Venturi tunnels. In this study, the AoA of the rear wing is defined as the inclination of the wing’s mean chord line relative to the oncoming free-stream airflow, which is assumed to be aligned with the car’s longitudinal axis at 0° yaw. For the two-element rear wing considered, changes in AoA refer specifically to adjustments of the flap (second) element. This research will provide engineers with critical knowledge on the behaviour of the rear wing, underbody Venturi tunnels, and their combined impact for varying parameters, thus enhancing race-car aerodynamic downforce, safety, and overall competitiveness and performance.
Methodology
Geometry
The vehicle model, depicted in Figure 1, was produced in the spirit of modern F1 vehicle shapes published in the 2026 regulations. The frontal cross-sectional area for the vehicle model was 1.97 m2. The model was simplified and used generic dimensions to keep the findings relevant to the wider motorsport community. The model featured two Venturi tunnels, which ran the length of the vehicle body. A simple front wing was used such that obstruction of the airflow to the Venturi tunnels was minimised.
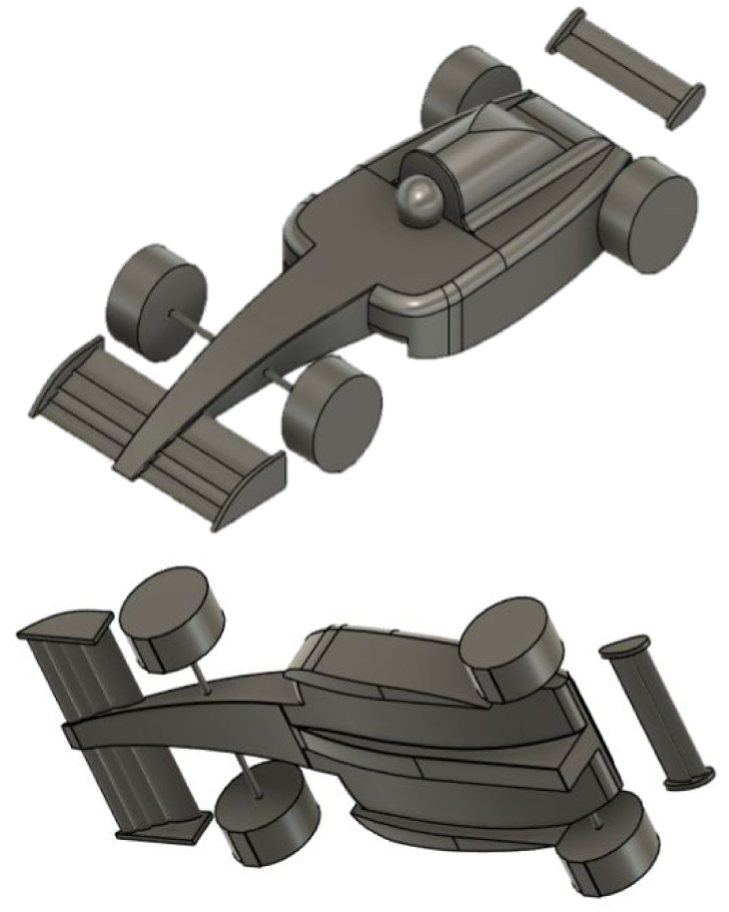
CAD Model Geometry constructed using Autodesk.
The rear-wing profiles selected for both the main and second elements were NACA 2408 and NACA 4412, respectively. 13 These profiles were selected as they are highly cambered, which is a typical quality of aerofoils used in Formula 1 applications. The span and chord of the wing were selected to comply with the rear-wing bounding box restrictions within the Formula 1 technical regulations, including a 350 mm total chord length. The slot gap between the two elements was 12 mm. The wing profile was untwisted along the span, which differs from modern competition cars (particularly at higher levels). However, the trends observed would remain the same. Further optimisation of the wing profile to enhance downforce generation was beyond the scope of this work. To understand the effect of the rear wing on underbody downforce generation several parameters were tested whilst remaining compliant with the Formula 1 technical regulations. The reference area used to determine the lift coefficient from the rear wing was the plan area. The methodology firstly included adjustment of the rear wing angle of attack from 15° to 55°, increasing in 10° increments. The change in rear wing angle of attack was done first as it is a well-documented performance parameter for aerofoils within both motorsport and aerospace applications. Following the setting of the angle of attack, the vertical placement of the wing was investigated between 730 and 930 mm from the ground plane, increasing in 40 mm increments. Finally, the longitudinal placement of the wing was investigated between 4.9 and 5.3 m from the reference origin (front of the car), increasing in 0.1 m increments.
Computational fluid dynamics
Mesh generation and independence
The enclosure for the vehicle model was generated to minimise the blockage ratio to avoid any near-wall effects that would negatively impact the results. A flow inlet area of 100 m2 was selected to give a total blockage ratio of less than 2%. To allow the flow to settle, three car lengths were included before the car. To fully capture the wake development, five car lengths were included after the car before the end of the fluid domain. Following the creation of the computational enclosure (10 m × 10 m × 40 m), a symmetry plane was applied to reduce the computational demand by only modelling half of the car. Whilst it is acknowledged that flow separation around a body can create asymmetrical and time-dependent flow, the symmetry plane was still used as the key analysis for this work and was focussed along the centre line of the vehicle, where asymmetrical flow effects would not be as prevalent. 14
A mesh independence study was completed to confirm that the solution was not influenced by the mesh resolution. This process helped identify an appropriate mesh size. As illustrated in Figure 2, both the drag and negative lift coefficients stabilised at a mesh size of 1,147,930 elements, which finds agreement with similar studies. 15 The result of the mesh independence study indicates that further mesh refinement would provide negligible benefit whilst incurring greater computational expense. Therefore, this mesh size was utilised for the remainder of the study. In addition, 20 inflation layers were applied around the car’s surface to capture boundary layer development and separation effects accurately. The mesh type used was a tetrahedral mesh, which is well-suited for CFD around complex geometries as it conforms well to the shape, supports automated and adaptive meshing, and integrates well with prismatic boundary layer elements to balance accuracy and computational efficiency. 16 The final mesh provided a sufficient resolution level of the CAD geometry and good tetrahedralisation of the volume mesh.
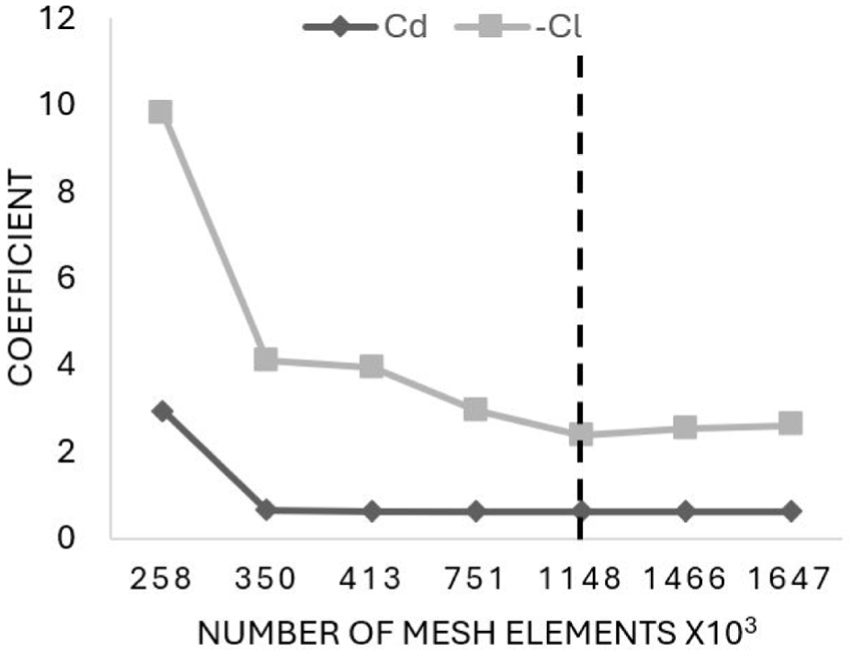
Mesh independency study.
Boundary Conditions
The inlet velocity was set to 96 m/s, which corresponded to a vehicle speed of 346 km/h. This speed was selected as it is representative of Formula 1 speeds. The car was presented to the flow with a 0° yaw angle. This yaw angle was chosen because steering locks on Formula 1 cars are relatively low due to the propensity of the drivers to follow the racing line, therefore minimising yaw angle. Furthermore, for corners that do require a high steering angle and yaw, vehicle speeds are typically lower, such that aerodynamic effects are less influential.
A limitation of the CFD analysis includes the wheels and ground plane of the model being stationary instead of having a rolling roadbed and rotating wheels, which could be used in a wind tunnel. To minimise this limitation, all walls of the enclosure, including the ground, were set to a specified shear stress of 0 N/m2. This zero-shear condition was selected to model the interactions between the ground and the car to be more representative of on road conditions. The surfaces of the car were set to a no-slip boundary condition.
Solver set-up
ANSYS Fluent was chosen as the selected solver setup software. Using the inlet conditions as described in Boundary Conditions Section, the flow was identified as turbulent with transition occurring between 15 and 1,530 mm along the length of the vehicle (based on flat plate boundary layer theory). This approach is valid as it has been confirmed to match experimental data. 15 Furthermore, under typical race car conditions, the flow to the vehicle could be assumed to be turbulent due to the disturbance of the flow from other vehicles. Consequently, an appropriate turbulence model was selected. After evaluating several turbulence models, including variants of the k–ε and k–ω groups, the k–ω Shear Stress Transport (SST) model was chosen due to its superior near-wall treatment and improved capability in predicting flow separation, which is essential when determining flow behaviour around a race car. 17 Due to the 20 inflation layers around the car, the y+ value ranged between 1.3 and 4.7, and the advanced near-wall treatment method was applied to model the boundary layer behaviour. For modelling the boundary layer y+ values below 5 are desired, as the model can accurately predict boundary layer effects. 18
Results and discussion
Rear wing angle of attack
The relationship between rear-wing AoA and its effect on the −CL for the whole car and the individual contributions for both the rear wing and the body is presented in Figure 3. The total −CL of the car increased with increasing AoA up until 45°. This increase in −CL was further investigated by considering the difference in response between the rear wing and vehicle body to understand the interactions between them. Notably, the trends for the wing and body differed as the AoA was adjusted. Specifically, the rear wing exhibited a steady increase in downforce as the AoA increased, peaking at 35°. Beyond this point, the rear wing produced less downforce. This reduction in downforce was attributed to the occurrence of aerodynamic stall of the flow on the suction surface of the wing due to boundary layer separation, caused by the increased adverse pressure gradient. 19
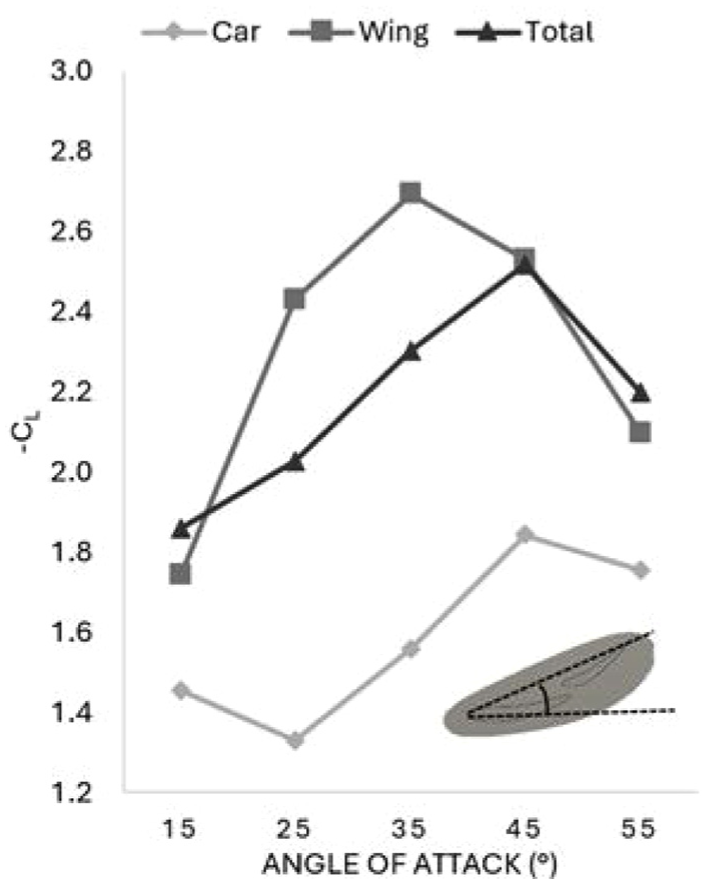
Effect of wing angle of attack on the total car lift coefficient and the wing and body lift coefficients.
The downforce generated by the vehicle body demonstrated a different trend as downforce continued to increase as the rear-wing AoA increased beyond 35°. The aerodynamic interaction between the underbody and the rear wing drives this difference in trends. Although the rear wing’s downforce decreased beyond stall (45°), increasing its AoA continued to reduce the pressure in the wake region behind the car. This reduction in static pressure at the diffuser exit reduces the adverse pressure gradient through the diffuser section of the Venturi tunnels. This more favourable pressure gradient promotes higher velocity through the underbody, further reducing the pressure under the car. Figure 4 supports this discussion by illustrating how the pressure coefficient changes through the Venturi tunnels for some of the selected rear wing AoA values tested.
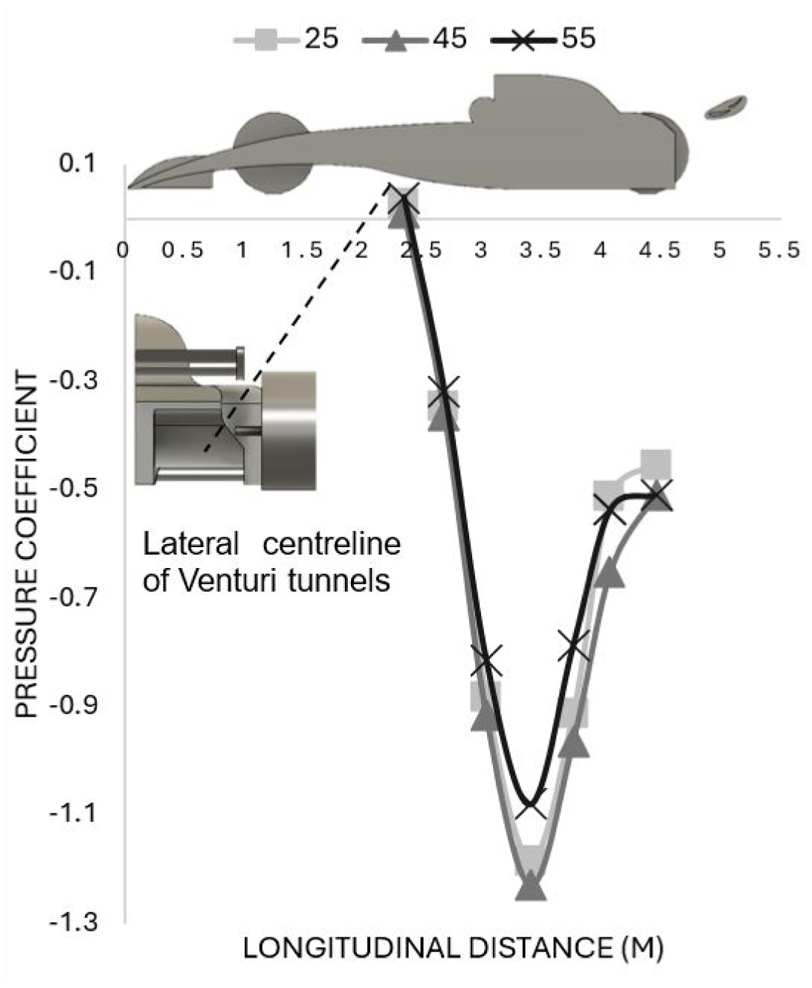
Pressure coefficient trace along underbody for varying AoA.
Notably, the 45° AoA setup produced the lowest pressure coefficients throughout the underbody, with the influence of the wing being seen at the throat and diffuser sections of the Venturi tunnel. Figure 4 demonstrates how increasing AoA from 25° to 45° further generated a stronger low-pressure zone beneath the rear wing, which effectively “pulls” more air through the underbody tunnels. As a result, the airflow speeds up, pressure drops even further, and the car experiences an increase in downforce. On the other hand, at 55°, the rear-wing performance is inhibited to such an extent that it begins to affect the underbody flow negatively. As the AoA of the wing increased further, the stalling of the flow increased, and the area of disturbed turbulent flow created by the rear wing increased. This flow disturbance further disrupts the low-pressure zone at the tunnel exit that was assisting to “pull” air through the underbody at the lower AoA. With less suction from the rear wing, the airflow under the car slows down, pressure builds up, and the ground effect becomes less effective.
The effect of the rear wing AoA on the underbody performance highlights just how interconnected the car’s aerodynamic components really are. Adjusting the rear wing’s angle does not just impact the wing itself but has a knock-on effect on the underbody flow. In this case, a greater rear wing angle AoA, up to 45°, enhances the suction effect downstream, which in turn improves the efficiency of the Venturi tunnels. This improvement in underbody flow influenced by the rear wing AoA also could provide engineers with the option of increased diffuser angles before the underbody flow would stall 4 and, as a result, increasing the amount of downforce generated by the underbody.
Rear wing vertical placement
Using a rear wing AoA of 45°, the effects of vertical rear wing placement on downforce generation were investigated. Figure 5 presents the −CL for the total car with the individual coefficients for both the wing and body. Wing heights were tested between 730 and 930 mm from the ground plane.
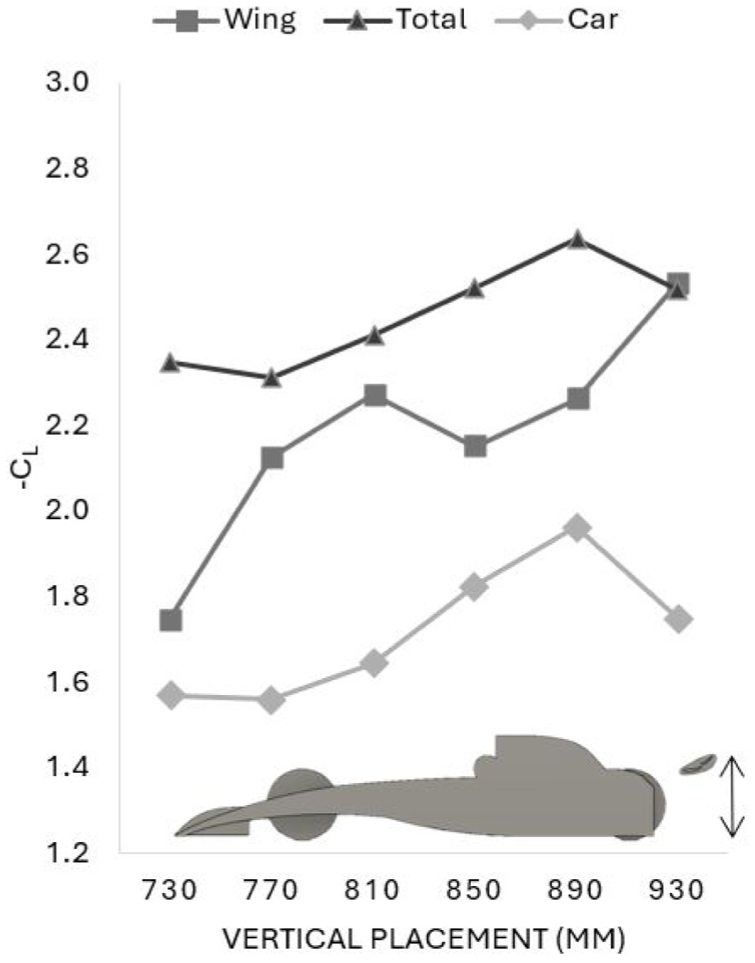
Effect of wing vertical placement on the total car lift coefficient and the wing and body lift coefficients.
The total downforce coefficient of the car increased with increasing vertical placement of the rear wing, up until 890 mm. This improvement in downforce was further investigated by considering the difference in response between the rear wing and vehicle body to understand the interactions between them. As demonstrated in Figure 5, the flow behaviour for the wing and body differed as the vertical placement was adjusted. It is clear that the rear wing exhibited a steady increase in downforce as its height increased, peaking at the highest placement of 930 mm. The enhanced wing performance is because as the height of the rear wing increases, the subsequent clean and undisturbed air flow to the wing is maximised, increasing the pressure differential across the aerofoil surfaces, and hence increasing the wing efficiency. 20 In contrast, the body displayed a different trend, achieving peak downforce at a height of 890 mm before reducing at 930 mm. This difference stems from the aerodynamic interaction between the rear wing and underbody. The difference can be understood by analysing the changes in pressure through the underbody.
Figure 6 shows the pressure trace through the Venturi tunnels for varying rear-wing vertical placements. As the wing height reduced from 890 mm, the static pressure through the underbody increased, this increase in static pressure weakens the overall ground effect. The cause of this increase in static pressure results from the reduction in flow velocity through the underbody as the wing is moved closer to the ground. The lower placement of the rear wing inhibits the wing’s performance as the disturbance of the oncoming flow by the vehicle body reduces the quality of airflow to the wing. This observation is supported by Figure 5, as the −CL of just the wing improved with increasing height. On the other hand, when the wing was placed at 930 mm, it was too far away from the diffuser to have much influence on the flow coming out from under the car. This lower performance at higher wing heights is supported by the pressure trace, showing that the static pressure was greatest at the diffuser outlet for 930 mm. This increase in static pressure at the outlet of the Venturi tunnel is because the wing becomes aerodynamically disconnected from the underbody, so it cannot reinforce the low-pressure region at the rear of the car that helps draw air through the Venturi tunnel. However, at 890 mm, the wing sits at a more ideal height - close enough to strengthen the suction effect of the wing on the diffuser, but high enough for the wing to receive undisturbed flow. This placement keeps the flow attached through the diffuser, maintains a strong pressure gradient under the car, and ultimately delivers the highest downforce.
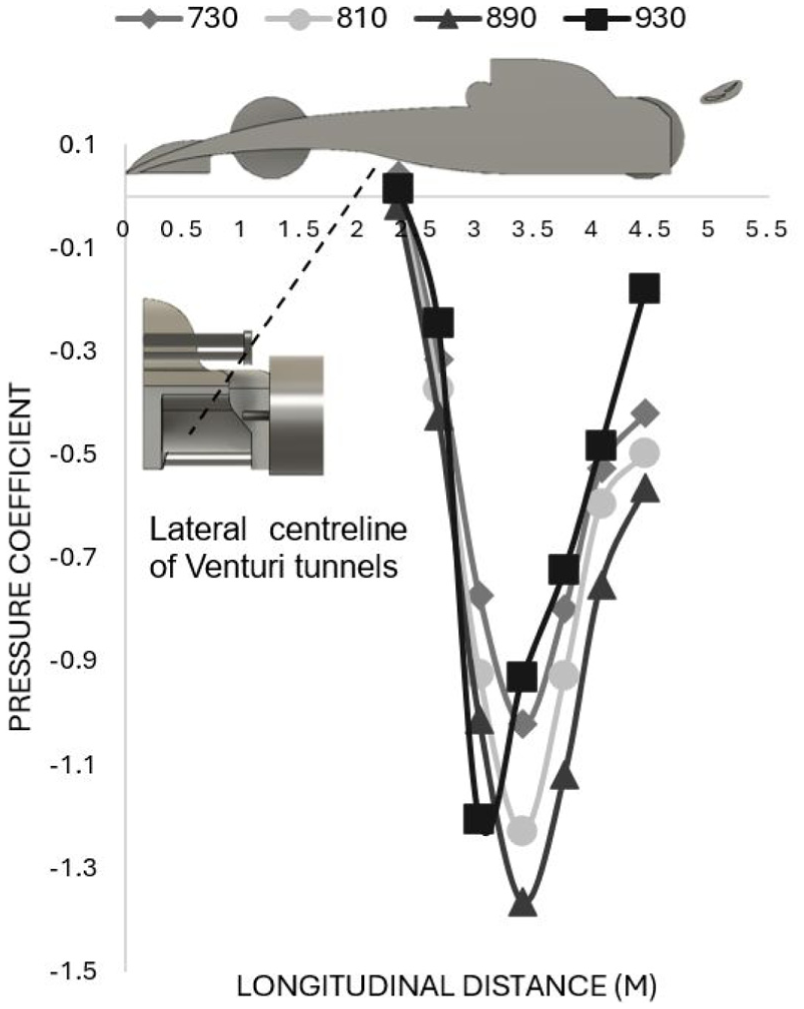
Pressure coefficient trace along the underbody for varying vertical placements.
The car body has a larger impact than the wing on the overall downforce generated by the combined unit of the wing and car, hence why 890 mm generated the largest total downforce. It produced a balance between the wing remaining exposed to clean airflow, whilst still effectively lowering the pressure at the diffuser exit to enhance the ground effect beneath the car. These findings highlight that the wing vertical position must be considered along with the vehicle underbody flow to produce a competitive car design.
Rear wing longitudinal placement
Using an AoA of 45° and a vertical position of 890 mm from the ground plane, the influence of wing longitudinal placement was investigated and is presented in Figure 7. The total downforce coefficient of the car was maximised at a longitudinal distance of 5.1 m. This higher level of downforce generation was further investigated by considering the difference in response between the rear wing and vehicle body to understand the interactions between them. The rear wing’s lift coefficient, −CL, remained relatively consistent across all tested positions, varying between 2.4 and 2.6. This lower variation in −CL compared to the vertical placement suggests that the wing’s performance is less dependent upon its longitudinal placement. Because the wing has a constant AoA and vertical height, it experiences similar airflow characteristics across all tested longitudinal placements. As a result, the wing continues to generate a stable pressure differential for each longitudinal placement. However, while the wing’s own aerodynamic output does not change significantly, it has a large influence on the overall car performance - particularly through its interaction with the diffuser and underbody flow. Depending on how well-aligned the wing is with the diffuser wake, the wing can either enhance or weaken underbody suction.
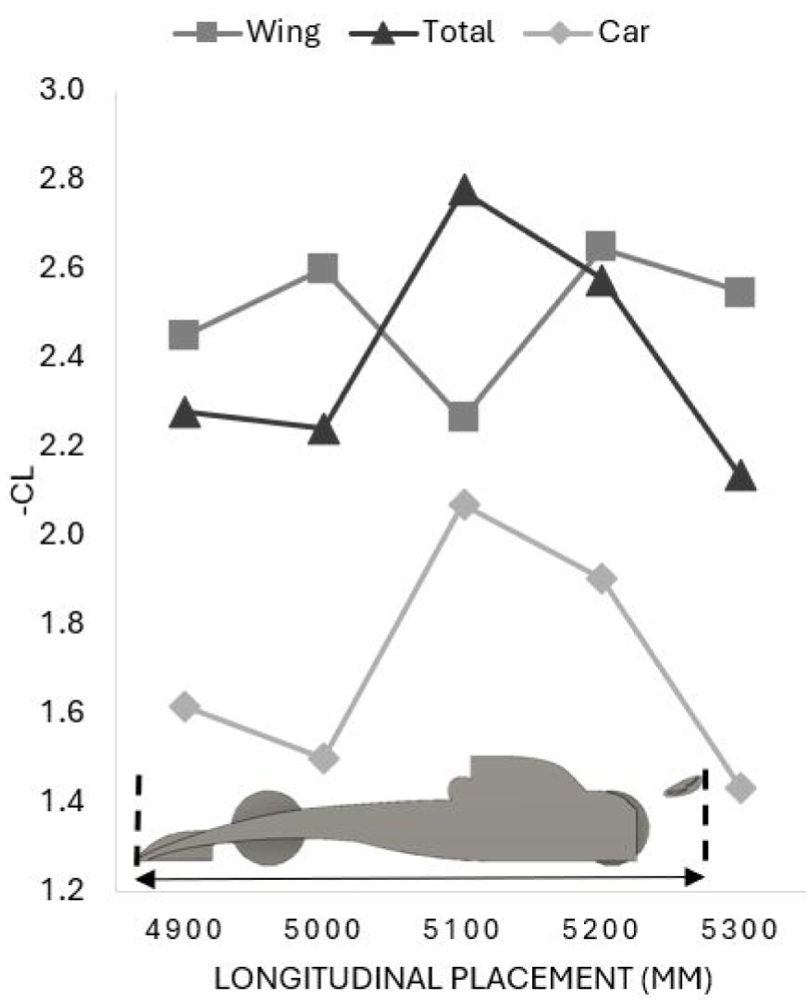
Effect of wing longitudinal placement on the total car lift coefficient and the wing and body lift coefficients.
The car body’s total downforce, which includes contributions from the underbody and Venturi tunnels, is highly sensitive to the rear wing’s longitudinal position. A particularly significant change occurs between 5.0 and 5.1 m, where the car’s −CL increases sharply from approximately 1.55 to nearly 2.0. This enhancement indicates a point of strong aerodynamic coupling between the rear wing and the diffuser flow. At 5.1 m, the wing is aligned with the diffuser wake and underbody flow structures, reinforcing the suction effect at the rear of the car. This suction effect accelerates the flow through the Venturi tunnels, increasing underbody velocity and lowering static pressure. 21
Figure 8 shows the pressure trace through the Venturi tunnels at varying longitudinal rear wing placements. Figure 8 supports Figure 7, which shows 5.1 m to be the position that generates the highest car body downforce. In Figure 8, it is seen that the 5.1 m configuration generates the lowest pressure coefficients along the length of the underbody. These pressure levels reflect maximum flow velocity, confirming that this position delivers peak ground effect and total downforce. 22 In contrast, when the wing is positioned at 4.9 m, it sits too far forward to interact effectively with the flow exiting the diffuser. This less synergistic placement weakens the suction effect under the car, resulting in higher underbody pressure and reduced aerodynamic efficiency. At 5.3 m, the wing is positioned too far rearward, beyond the effective influence zone of the underbody flow. Although it still generates downforce independently, its ability to support diffuser performance is diminished, leading to higher pressure in the Venturi tunnels and again, a reduction in total downforce. These findings highlight the importance of aerodynamic coupling in race car design. Although the wing’s individual performance is relatively insensitive to longitudinal placement, its ability to augment underbody performance is strongly dependent on positioning. Effective integration of rear wing and underbody design is therefore essential for maximising total downforce and sporting performance.
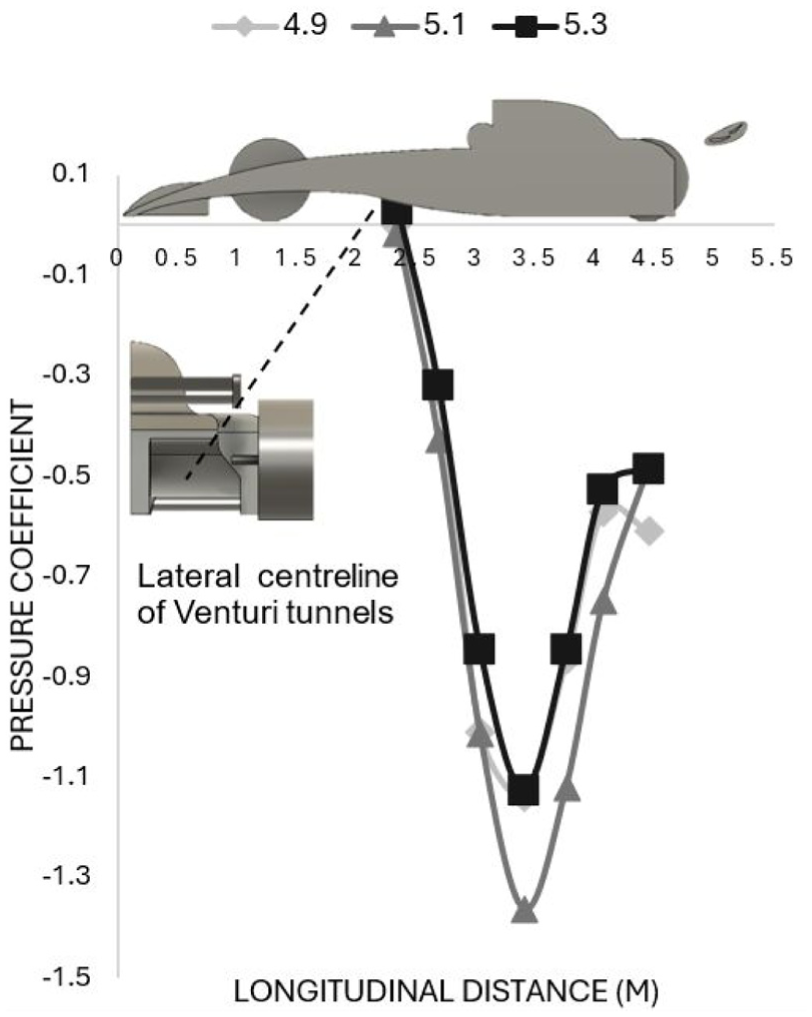
Pressure coefficient trace along underbody for varying longitudinal positions.
In summary, the combination of a 45° AoA, 890-mm vertical placement, and 5.1-m longitudinal positioning produced the most effective aerodynamic configuration. This setup resulted in the lowest pressure beneath the car and the strongest aerodynamic interaction between the rear wing and diffuser. For engineers, these findings reinforce the importance of viewing the car’s aerodynamics as a fully integrated system. Whilst modern F1 regulations heavily restrict the longitudinal placement of the rear wing, these results demonstrate that within the regulations there is still scope for substantial aerodynamic performance gains. Precisely positioning the rear wing not only optimises its own performance, but also significantly boosts underbody aerodynamic efficiency - leading to improved cornering grip, vehicle stability, and overall performance on the track.
Effect of drag reduction system operation
In Formula 1 race cars the DRS (Drag Reduction System) is used to reduce aerodynamic drag. This reduction in drag is achieved through reducing the AoA of the second element (flap) of the rear wing. Thus, reducing drag through minimising the induced drag component allows for higher straight-line speeds. In motorsport, it’s primarily used to aid overtaking by giving cars a temporary speed advantage without permanently compromising downforce in corners. The influence of a DRS on rear wing performance is well documented, with several studies reporting the effects. 23 However, the influence of DRS operation on underbody flows of open wheel competition cars is not well reported. Hence, the airflow behaviour through the underbody was investigated. The wing was positioned at 890 mm vertical position and 5100 mm longitudinal position, as this location was empirically found to generate the most downforce. In addition, an AoA of 45° was used as it provided the highest downforce generation. This wing placement was analysed in comparison to using a deployed DRS AoA of 0° for the second wing element. Figure 9 shows the pressure coefficient trace along the centre line of the underbody Venturi tunnel for both the DRS in the active and inactive position.
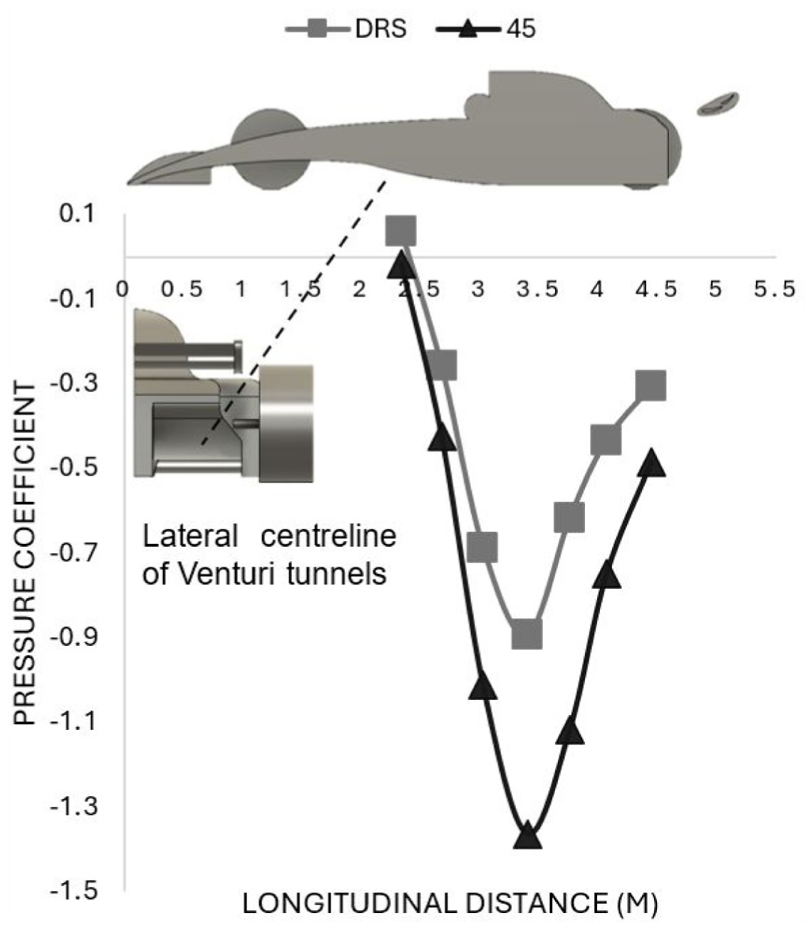
Pressure coefficient trace along the underbody for active and inactive DRS.
When the DRS is not active, the wing creates a low-pressure region at the diffuser exit. This low pressure draws air more effectively through the Venturi tunnels, accelerating the flow and lowering the pressure beneath the car. The effect is most noticeable between 3 and 4 m, where the pressure coefficient reaches its minimum, indicating peak ground effect. In contrast, when the DRS was activated, the downforce generated by the wing reduced. DRS operation reduced the area of low pressure under the wing at the diffuser outlet. This reduced area of low pressure inhibited the suction effect at the diffuser outlet, leading to a slower underbody flow, higher underbody pressure, and a drop in downforce generated by the underbody. The total reduction in −CL was 55.2% when the DRS was active. This result finds agreement with other published data for similar open-wheel competition car models. 24 At 45°, the rear wing −CL was 2.26. However, when the DRS was activated, its −CL dropped to 0.30, an 86.7% reduction. This large reduction was expected due to the well documented relationship between AoA and CL for aerofoils. However, the car body also witnessed a decrease in downforce coefficient; falling from 2.07 to 1.37 which equates to a 33.8% drop. This impact on the downforce generated by the body is mainly because higher wing angles produce a larger pressure gradient between the pressure and suction surfaces of the aerofoil, which helps to drive the underbody flow through the Venturi tunnels. 25 Activating the DRS reduces that pressure difference, which can limit the underbody’s ability to generate ground effect. Together, these changes lower the total downforce on the car. This comparison highlights how the rear wing, even though mounted at the outlet of the diffuser, plays a critical role in enhancing the performance of the underbody Venturi tunnels, and why its configuration must be carefully considered as part of the overall aerodynamic package. A further effect of DRS operation is the shift in aerodynamic balance. When the DRS is closed, the rear wing accounted for 37.1% of the total downforce, whereas with the DRS open, it accounted for 26.8%. This effect would shift the aerodynamic balance forward. DRS operation is typically limited to the straights where aerodynamic balance is less crucial. However, as active aerodynamic surfaces become a more prevalent feature in top-level motorsport, the effects of active aerodynamic devices on the aerodynamic balance will be of further interest.
Conclusion
This study investigated the aerodynamic interaction between the rear wing and underbody Venturi tunnels of an open-wheel competition car, using CFD to explore how variations in wing placement and angles affect underbody downforce generation. By analysing the effects of the AoA, vertical height, and longitudinal position of the rear wing, this research highlights how wing placement can lead to significant differences in overall aerodynamic performance driven by the underbody flow.
The rear wing’s AoA was found to be the most influential factor in determining downforce. This study demonstrated that the downforce generated by the wing and underbody responded differently depending on the AoA. Analysing the wing and underbody separately was essential for understanding the behaviour of airflow. While the rear wing began to stall at angles greater than 35°, higher angles created a low-pressure region beneath the wing, which accelerated the flow under the car, leading to maximum downforce at 45°.
The vertical position of the rear wing plays a key role in the total downforce generated by the entire car. Variations particularly influenced the wing’s downforce generation in access to clean, undisturbed airflow. The results showed that a vertical height of 890 mm provides the best aerodynamic coupling with the diffuser, demonstrating that even small changes in height can result in large variations in total downforce. This aerodynamic coupling between the rear wing and underbody flow highlights the importance of treating the car as an integrated system, as the wing and underbody respond differently to changes in height but must work cohesively to achieve maximum downforce.
The longitudinal placement of the rear wing also affects the total downforce. While the wing’s own downforce generation remained largely unchanged, the airflow through the underbody experienced notable changes. This study revealed that a longitudinal position of 5.1 m offers the best airflow cohesion between the wing and underbody, allowing the wing to complement the diffuser and enhance the ground effect. This result further underscores the importance of considering both the individual behaviour of the wing and car components as well as considering them as part of an integrated system.
The impact of the Drag Reduction System (DRS) highlights the trade-off between straight-line speed and downforce. Reducing AoA enhances top speed but compromises underbody performance, illustrating the delicate balance engineers must strike between drag reduction and maintaining downforce for stability. The significant increase in underbody pressure further supports the conclusion that rear wing AoA has the greatest effect on downforce generation - an essential consideration for engineers in their designs.
The configuration for peak aerodynamic performance was found to be a rear wing with a 45° AoA, 890 mm vertical height, and 5.1 m longitudinal placement. This setup generated the highest velocity through the Venturi tunnels, linking to the lowest static pressure and hence, the highest overall downforce. Whilst this study has presented general trends and relationships, there is further scope for future work to consider the effects of ground clearance and the impact of rear wing placement on this, but also the vortex flows generated by the front wing and wheels.
These findings highlight the critical importance of aerodynamic integration between the rear wing and underbody Venturi tunnels. For engineers, particularly in high-performance motorsport, this insight is invaluable. Carefully tuning rear wing parameters not only affects the wing’s output but also has cascading effects across the car’s entire aerodynamic system. In an environment where every millisecond counts, understanding and enhancing these interactions can lead to meaningful improvements in lap time, grip, and stability - ultimately driving the design of faster, safer, and more competitive race cars.
Footnotes
Appendix
Funding
The authors received no financial support for the research, authorship, and/or publication of this article.
Declaration of conflicting interests
The authors declared no potential conflicts of interest with respect to the research, authorship, and/or publication of this article.