
Abstract
Concussions are common in ice hockey and often result from the head impacting the glass shielding. Risk for concussion during head-to-shielding impacts depends on the stiffness of the shielding. The cantilever design of the shielding likely causes the stiffness of the shielding and the magnitude of head impacts to vary depending on the proximity of the impact to the cap rail and the post connecting adjacent shielding panels. Understanding how shielding stiffness varies with proximity to the cap rail and post is important to designing safer hockey rinks. In this project, a portable test device was used to measure shielding stiffness. The results showed that shielding stiffness was associated significantly with height from the cap rail (p = 0.0006) and location on the ice (p = 0.0473), but not with horizontal distance from the post (p = 0.82). Stiffness at a height of 20 cm above the cap rail was 2.8-fold greater than at 63 cm and 1.8-fold greater than at 44 cm. Stiffness in the corner was 1.8-fold greater than at the side boards. These findings indicate that there is considerable regional variation in shielding stiffness and support the need for standardised methods for assessing and regulating shielding stiffness in ice hockey.
Keywords
Introduction
Concussions are common in ice hockey, and up to 37% of cases are caused by the head striking the shielding (or ‘glass’; Figure 1(a)). 1 Evidence shows that the forces generated during these collisions, and the corresponding risk for traumatic brain injury, depend in part on the stiffness of the object colliding with the head. 2 For example, laboratory studies have shown that the peak force generated during body impacts to the shielding was reduced by lowering the stiffness of the shielding.3,4 Furthermore, Tuominen et al. 5 found that transitioning from traditional, higher stiffness tempered glass to more flexible acrylic shielding was associated with a reduction of 29% in injuries during World Championship ice hockey games. Based on this evidence, in 2011 the National Hockey League (NHL) adopted flexible acrylic shielding systems to replace tempered glass installations in practice and game rinks. 6 However, many recreational hockey rinks continue to use tempered glass shielding, due to its lower cost, durability and scratch resistance. 7
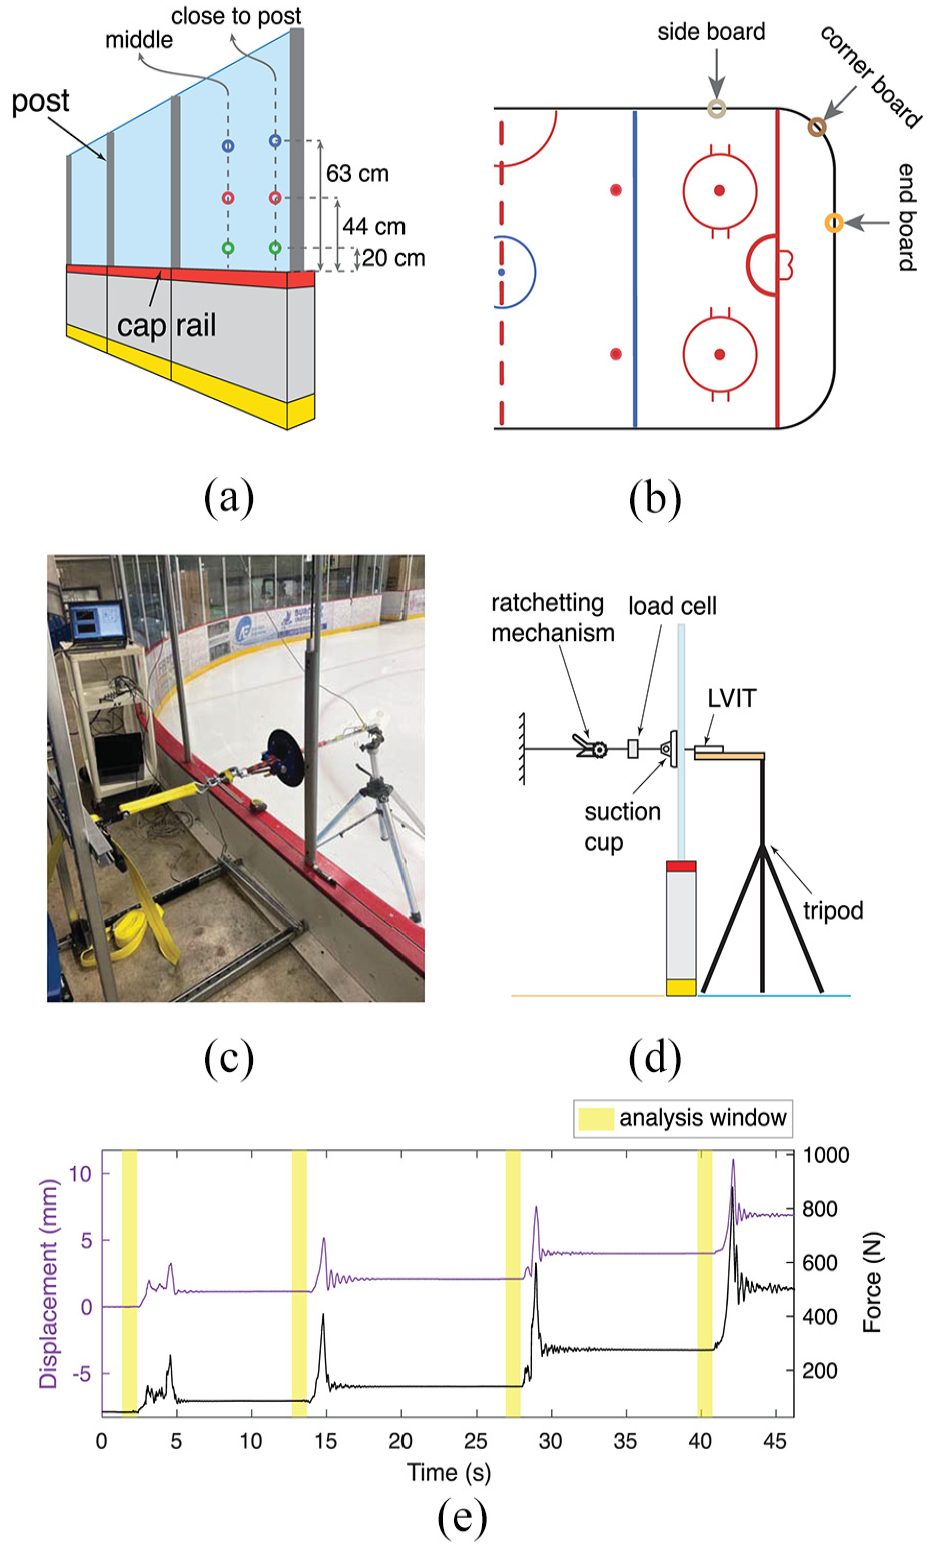
Apparatus used for on-ice measures of the force-deflection behaviour of shielding: (a) illustration of the dasher board and shielding, showing the locations on the shielding panel where we acquired force deflection measures, (b) top view of the ice surface, showing the three locations around the periphery of the ice where we acquired force-deflection measures, (c) photo of the apparatus used for on-ice measures of the force-deflection behaviour of shielding, (d) labelled diagram of the apparatus and (e) sample traces of raw data (force shown by the black trace and displacement shown by the purple trace) with analysis windows highlighted in yellow.
One concern in the design of shielding is the possibility for substantial regional variations in the stiffness of the shielding due to its cantilever construction. The shielding is secured at its bottom end to the cap rail (of the boards) and is free in space at its other end. Furthermore, adjacent shielding panels are secured to each other, often by metal posts. Accordingly, one would expect the stiffness to vary depending on the proximity to the cap rail and the post. Moreover, the stiffness of the shielding may differ between the corners, where the shielding is curved, and the side and end boards, where the shielding is straight. There is a lack of understanding of how the magnitude of head impacts depends on the proximity of the head impact to the cap rail and post, and the location on ice. This lack of understanding is a barrier to the design of reduced-injury ice hockey rinks.
Furthermore, evidence is limited on the number of head impacts and injuries in different regions of the shielding and at different levels of play. Aguiar et al. 8 found that, in men’s university hockey, 37% of all head impacts involved head-to-shielding impacts. However, no details were provided on the playing zone or the location of impacts relative to the cap rail and post. Hutchison et al. 1 analysed video footage of head impacts leading to diagnosed concussions in the NHL, and found that 37% of concussions involved the head impacting the shielding or boards. Among these, 46% occurred along the side boards, 39% in the corners and 25% along the end boards. Unfortunately, impacts to the shielding and boards were grouped together, and no information was available on the total number of head impacts in each region. Clearly, additional studies are required to provide a more complete picture of injury risk for different regions of the shielding.
Our goal in the current study was to examine how the stiffness of the shielding is influenced by the proximity to the cap rail or posts, as well as the location of the shielding on ice. We used a portable test device to measure the force-deflection characteristics of the shielding at different heights from the cap rail, different horizontal distances from the post and different regions of the rink (corners, end boards and side boards). We hypothesised that stiffness would decrease with increasing height above the cap rail and increasing distance from the post. We also hypothesised that the stiffness of the shielding would differ between the corners, end boards and side boards.
Methods
Data were collected at two rinks in the City of Burnaby, British Columbia, Canada, each having standard North American rink dimensions (60.9-m long × 25.9-m wide, with a corner radius of 8.5 m). In both rinks, the shielding was made of 5/8-in (15.9-mm) thick tempered glass panels. Each shielding panel had a width of 152 cm, and a height of 182 cm. The panels were vertically supported by aluminium posts that were secured to traditional (nonflexible) dasher boards (Figure 1(a)). Shielding systems in both facilities were manufactured and installed by Cascadia Sport Systems (Port Moody, British Columbia).
In each of the two rinks, we measured the shielding stiffness at 18 different locations (Figure 1). In particular, measures were acquired at three regions of the rink (side boards, end boards and corner; Figure 1(b)), three heights above the cap rail (20, 44 and 63 cm; Figure 1(a)), and two distances from the post connecting adjacent shielding panels (middle of the shielding panel, and as close as possible (15 cm) to the post; Figure 1(b)). The heights above the cap rail of 20, 44 and 63 cm correspond to the 10th, 50th and 90th percentiles of all head-to-shielding impacts observed among Simon Fraser University Hockey Players (unpublished data, related to Aguiar et al. 8 ). At each of the 18 locations, we acquired three repeated measures.
Shielding stiffness was measured with a custom-designed, portable device that characterised the static force-deflection behaviour of the shielding over a force range of 10–1000 N (Figure 1(c)–(e)). The device incorporates a cable that attaches at one end to a ratchet and at the other end to a suction cup (IMT-A600, IMT, China). The suction cup was attached firmly to the shielding, thereby transmitting the cable tension to the shielding. The cable tension was measured with a load cell (MLP-500, Transducer Techniques, Temecula, USA) located in series with the cable. Displacement was measured with a spring-loaded linear variable inductance transducer (LVIT; LRS-18 Series, Alliance Sensors Group, Pennsauken, USA), aligned with the midpoint of the suction cup, on the opposite side of the shielding (Figures 1(c) and (d)). We tested the accuracy of the LVIT calibration over a range of 0–10 cm, and found a root mean square error (RMSE) of 0.031 mm. We tested the accuracy of the load cell calibration over a range of 0–735 N, and found an RMSE of 0.362 N.
Measures were acquired at different force levels by using the ratchet to increase the shielding displacement incrementally. The onset of each increment caused transient oscillations in both displacement and force (Figure 1(e)). We waited for these oscillations to subside before using the ratchet to apply the next increase in displacement. At each level, we calculated the mean force and displacement over the 1000 ms prior to the onset of the next increment (Figure 1(e)). A best-fit straight line was fit to the resulting pairs of force-deflection data over the entire measurement range (Figure 2(a)), using MATLAB (version R2023b, MathWorks, Natick, USA). The stiffness of the shielding at a given location was taken as the slope of the line, averaged over the three repeated trials.
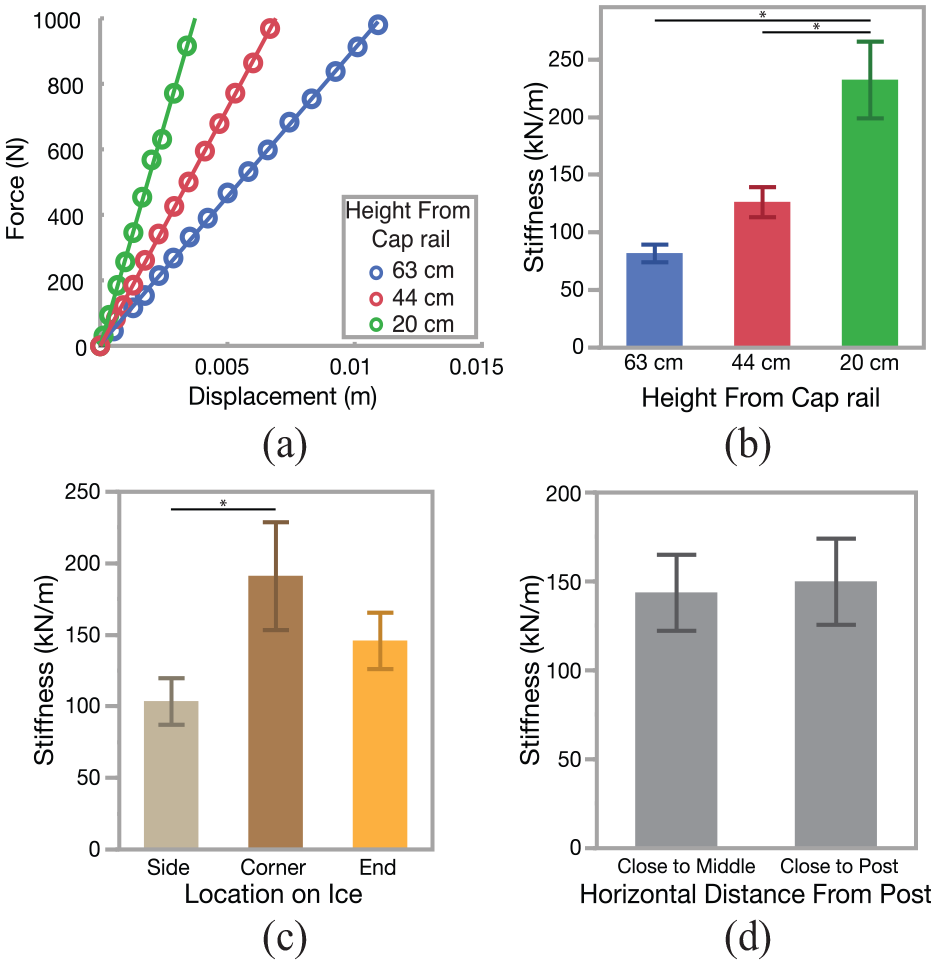
(a) Force–deflection behaviour of the shielding, measured at the end boards near the post, (b) shielding stiffness at different heights above the cap rail (20, 44 and 63 cm). The bars show mean values (with error bars showing standard errors), averaged across the three examined locations on the ice (end boards, side boards and corners) and the two examined horizontal distances from the post (close to middle and close to post). (c) Shielding stiffness at different locations around the rink (end boards, side boards and corners). The bars show mean values averaged across the three examined heights above the cap rail and two examined horizontal distances from the post. (d) Shielding stiffness at different horizontal distances from the post (close to middle and close to post). The bars show mean values averaged across the three examined heights above the cap rail and three locations on the ice.
For hypothesis testing, we used three-factor analysis of variance (ANOVA) and post hoc Tukey honestly significant difference (HSD) tests to examine whether stiffness depended on height from the cap rail, horizontal distance from the post and location on the ice. These tests were conducted with JMP (version 17, SAS Institute Inc., Cary, USA) using a significance level of α = 0.05.
Results
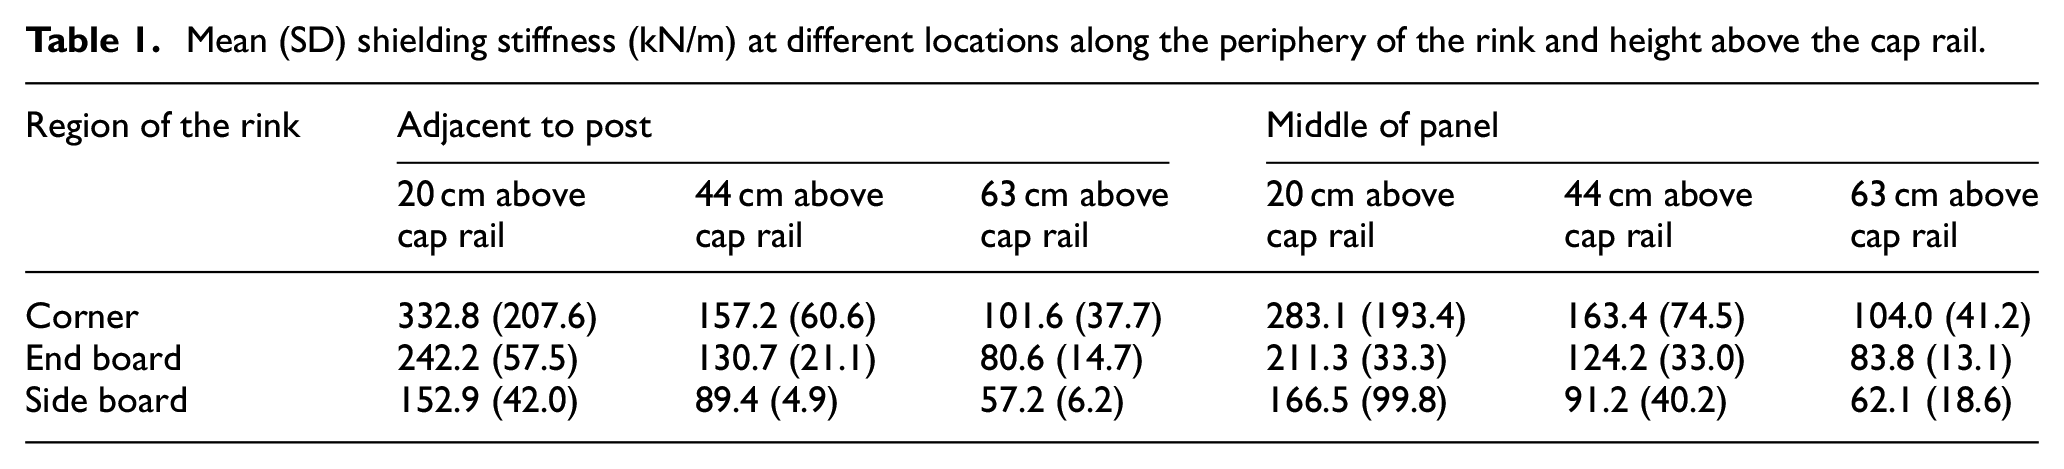
The stiffness of the shielding ranged from 57.2 to 332.8 kN/m (Table 1). The force-deflection relationship across all trials was highly linear, with coefficients of determination (r2) for first-order polynomials ranging from 0.92 to 1.0 (Figure 2(a)). The standard deviation across the three repeated trials acquired at a given location, in a given arena, averaged 8.2 kN/m. The standard deviation across arenas, for measures in a given location, averaged 55.5 kN/m.
Mean (SD) shielding stiffness (kN/m) at different locations along the periphery of the rink and height above the cap rail.
Shielding stiffness was associated significantly with height from the cap rail (p = 0.0006; Figure 2(b)) and location on the ice (p = 0.0473; Figure 2(c)) but not with horizontal distance from the post (p = 0.82; Figure 2(d)). Average values of stiffness at a height of 20 cm above the cap rail were 2.8-fold greater than at a height of 63 cm (231.5 kN/m vs 126.1 kN/m) and 1.8-fold greater than at 44 cm (231.5 kN/m vs 81.5 kN/m). Average values of stiffness in the corner were 1.8-fold greater than at the side boards (190.3 kN/m vs 103.2 kN/m). There were no significant two-way or three-way interactions between the explanatory variables.
Discussion
In support of our hypothesis, we found that shielding stiffness decreased with increasing height above the cap rail. We also found that shielding stiffness was higher in the corners than on the side boards. These results suggest that head impacts closer to the cap rail, and in the corner regions, are likely to produce higher forces, and may be more likely to cause head injuries, including concussion than other shielding locations. Of particular concern is the likelihood that younger or shorter players may tend to impact their heads closer to the cap rail, where the shielding is stiffest.
We did not find that shielding stiffness was influenced by horizontal distance from the posts connecting adjacent shielding panels. This uniformity in stiffness across horizontal locations would appear to be a desirable feature, and likely a goal for manufacturers in the design of shielding installations.
To our knowledge, ours is the first study to examine regional variations in shielding stiffness. The simplicity and high repeatability of our approach for measuring shielding stiffness make it attractive for incorporating into standards that may be adopted by manufacturers to ensure reduced-injury playing environments for hockey players.
Our measured values of shielding stiffness, which ranged between 57 and 332 kN/m, are consistent with previous findings by Poutiainen et al., 3 who measured shielding stiffness in the laboratory environment, using a 60 kg impact pendulum, and reported a range of 51–502 kN/m. The differences between our measured stiffness values and the upper range reported by Poutiainen may relate to differences in measurement techniques and to differences in the dasher boards and shielding setups.
Limitations
Our study has several limitations. First, we quantified shielding stiffness based on the measured force-deflection behaviour of the shielding under static conditions. Force generation under dynamic conditions will depend on the stiffness of the shielding and also on the mass and damping characteristics of the shielding. Future research should focus on quantifying the mass and damping characteristics of the shielding and on identifying their contributions to force generation. Second, we focussed only on rinks with tempered glass shielding supported by vertical aluminium posts and dasher boards. Additional research is required to measure the stiffness of acrylic plexiglass shielding and different types of shielding installations. Finally, the risk for head injury posed by a given region of the shielding depends not only on the stiffness of the shielding, but also on other factors which we did not measure, including the frequency of impacts, and the average velocity of the impacts to a given region of the shielding.
Conclusions
We found that shielding stiffness was higher near the cap rail and in the corners than in other regions of ice hockey rinks. This locally higher stiffness may be a concern for younger or shorter players, who may be more likely to impact the shielding closer to the cap rail. Our method offers a reliable approach for assessing shielding stiffness in rinks to reduce player injury and inform future innovations in ice hockey arena design.
Footnotes
Acknowledgements
We thank Rickie Ma for assisting with data collection and Bill Copeland Sports Centre staff for providing the space and support for data collection.
Declaration of conflicting interests
The author(s) declared no potential conflicts of interest with respect to the research, authorship, and/or publication of this article.
Funding
The author(s) disclosed receipt of the following financial support for the research, authorship, and/or publication of this article: This research was supported by the Natural Sciences and Engineering Research Council of Canada (NSERC RGPIN Discovery Grants to S. Robinovitch and M. Donelan). O. Vakili was also supported by graduate scholarship awards from the Canadian Standards Association (CSA) and ASTM International.