
Abstract
Ski jumping is a highly competitive sport, where the distance jumped is greatly dependent on the aerodynamic effects of the athlete’s posture. In the current paper a wind tunnel experiment was conducted to generate a parametric database of the effects of posture on aerodynamics and to compute the aerodynamic force coefficients. The parameters considered were varied over ranges representative of modern ski jumping and included the ski incidence angle, the ski V-angle, the leg-to-ski angle, and the hip angle. Measured force data were then used to simulate ski jumping flightpaths via a numerical model, allowing for the effects of posture on jump distance to be investigated. The model was able to simulate single and multi-posture flights to suggest both static and dynamic optimums. It was found that the ski jumping system generated lift in previously unreported, non-linear methods, enabling the flow to stay attached at much larger incidences than traditional wings. When optimizing posture for distance, it was found that neither lift nor efficiency (lift-to-drag ratio) should be maximized, due to the reliance on both qualities for a successful jump. However, when considering multi-posture flight, it was found that the lift-to-drag ratio should be maximized immediately after take-off, to maintain horizontal velocity. Lift should be maximized as the athlete approaches landing, due to the highly curved flightpath reducing the negative impact of drag. Realistic recommendations have been made on the postures that athletes should utilize to improve their performance. This includes a single position optimum, a “safe” optimum which allows some variation in an athlete’s ability to hold posture, and a further optimum should the athlete be skillful enough to dynamically alter posture as the jump progresses.
Introduction
Ski jumping is a highly competitive sport where points are awarded for both style and distance. A maximum of 60 points are available for style with a further 60 points awarded for reaching the “K-point” of a hill. The latter is known as the critical point, or calculation point, and indicates where the steepest part of the hill ends and the slope begins to flatten out from an average of 35°. The distance to the “K-point” can be viewed as the average distance (or par) in which jumpers aim to land. Additional points are awarded (or docked) for every meter beyond (or below) the “K-point”: 1.8 pts/m in “Large Hill” competitions.
The currently preferred jumping style is the “V style,” which was pioneered by Boklöv in 1985 (Figure 1). Since the introduction of the “V style” jump numerous studies have been undertaken with the aim of increasing distance through maximizing aerodynamic performance. As with many high-level sports much focus has been placed on equipment (such as suits 1 and skis 2 ), but to maintain the fairness of competition the FIS (International Ski Federation) introduced new regulations, restricting the design of equipment which could be viewed as performance differentiators. 3 Regulation was also introduced to penalize athletes seeking to improve performance by losing weight, limiting the maximum ski length in relation to an athlete’s BMI. 4 These regulatory changes left jumping style and posture as the only real performance differentiator. Indeed, the effects of posture on aerodynamic performance have been the subject of several studies, using both experiments and Computational Fluid Dynamics.1,5,6
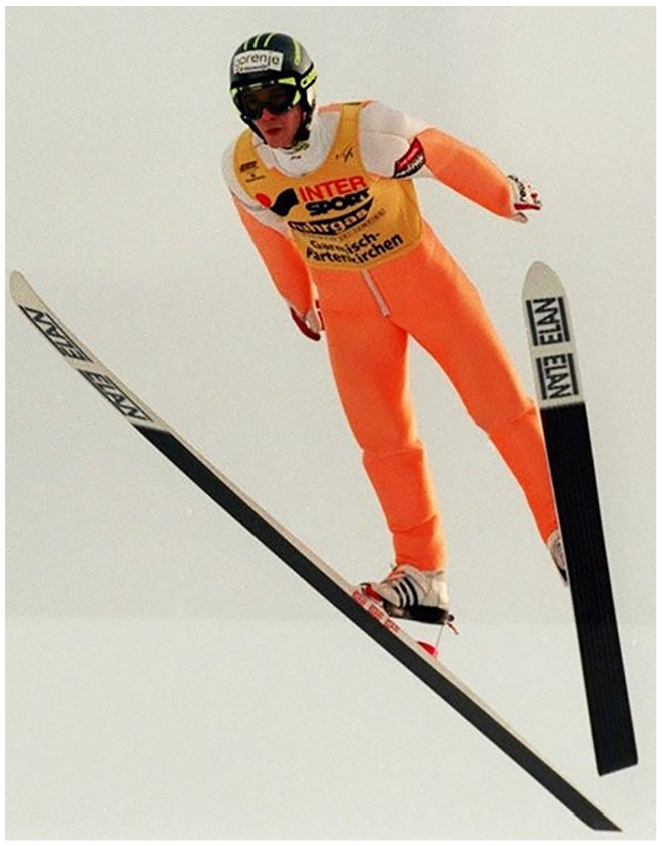
Primož Peterka in Garmisch-Partenkirchen 1997 by Nelinjo (licensed under the Creative Commons Attribution-Share Alike 4.0 International).
Early studies7–9 typically focused on determining postures with the highest aerodynamic efficiency, lift-to-drag ratio (L/D), as it was incorrectly assumed at that time that this would maximize jump distance. However, it was shown10–12 that the optimum posture changes with time, from one with maximum efficiency (L/D) to one with maximum lift. Seo et al. 12 optimized the leg-to-ski angle and the ski V angle for flight distance showing that the V angle should initially increase, but then remain constant in the second half of the jump. They suggested that the correct manipulation of the V angle could increase jump distance by up to 8 m. However, Seo et al. 12 considered the two variables independently, without considering any possible interaction. Furthermore, they did not consider the effect of hip angle, testing only 180° hip-to-body angle, and only considering V angles below 25°. Other studies (e.g. Meile et al. 1 ) have since shown these angles to be sub-optimal.
Much of the existing data linking posture to jump distance have been gained from in-competition field studies (e.g. Virmavirta et al. 10 and Schmölzer and Müller 13 ). These give useful information on the parameters that define posture, but as positional data were taken from video footage the level of uncertainty is unclear. Furthermore, in field studies it is not clear how controlled the changes in posture were. Clearly it is a dynamic process full of human variability. These existing studies do correlate the observed position versus jump length. However, they do not address intent versus control. Are the positions exactly the athlete’s intent and how/what does an athlete target? To try to understand this, we consulted a current athlete, Bolton and Bolton. 14 Bolton’s desire was to have target position(s) they could train for which would limit variability. He also suggested that, although possible, it was undesirable to vary leg-to-ski angle in flight, and to leave the equipment to set this. Similarly, their opinion was that athletes generally avoid altering ski incidence greatly during flight as it can trigger instabilities in flight. In general, elite athletes will produce an angular momentum during the take- off. This allows them to rotate forward right after take-off and once the rotation is finished, the skis are close to the horizontal. Most athletes try to keep the ski incidence angle relative to the horizontal constant (or decrease it a bit) to avoid instability problems. However, the ski incidence angle relative to the air stream increases inevitably with increasing flight path angle. See also Müller et al. 15
Data from Schmölzer and Müller 13 suggested that the flight technique reproducibility of elite athletes during the Winter Olympic Games 2002 appeared to be remarkably high. However, other than this there has been little consideration in contemporary research literature for an athlete’s ability to consistently realize exact postures in practice. Therefore, motivation exists to find not only optimal postures but also postures where the distance penalty for adopting marginally sub-optimal positions is minimal. Hence, this paper:
i. uses wind tunnel experiments to produce a database of lift and drag values for a range of athlete postures and then,
ii. develops a flight dynamics model which applies the measured parameters to the various flight phases of the ski jump to compute distance.
In this way the effect of posture can be examined from the perspective of both the optimum evolution of posture throughout the jump but also a more practical posture which allows the athlete some margin for error without overly compromising distance.
Key geometrical parameters
The key parameters of a ski jumper are shown in Figure 2, and these can be split between those affecting (i) the skis and (ii) the body.
(i) Ski angles:
• α, the ski incidence angle, and
• V, the ski opening (or V) angle.
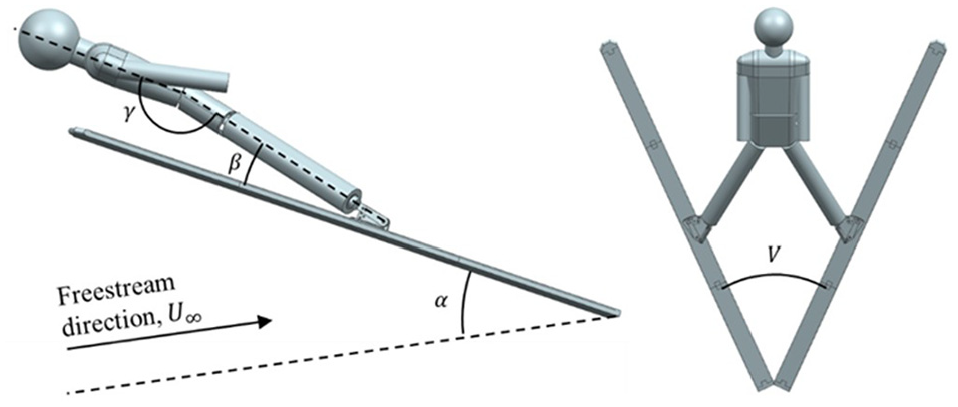
Key geometrical parameters.
Skis are basically flat plates and many studies6,16 assume they act similarly to a classic thin aerofoil theory. 17 Fundamentally, for a 2D uncambered aerofoil (or flat plate) it can be shown that lift is directly proportional to incidence so increasing α will, up to the point of stall, increase lift (but also drag). However, care must be taken here as in this respect the ski would be a very low aspect ratio wing and 3D effects would be large. 17 Furthermore, with V angles increasing from zero it is more likely that skis start to act in a manner akin to delta wing. Here lift is generated via a phenomenon known as vortex lift which also produces more drag than a standard wing. With reference to Figure 3 the flow separates from the wing leading edge and rolls up to form vortices. These leading-edge vortices are strong and stable and due to the high rotational velocity, produce large regions of low static pressure which contribute greatly to the lift. Increasing the V angle further has been shown to increase efficiency (L/D) for a given .6,16,18 Previous studies have not clearly described why this is the case, but it is likely to be due to the fact that at higher V angles skis will start to generate lift and drag more like a traditional wing (as opposed to delta wing vortex lift). Most studies are limited to V angles from 30° to 35° and fail to find a peak in performance, however anatomically the V angle is clearly limited by the athlete’s flexibility.
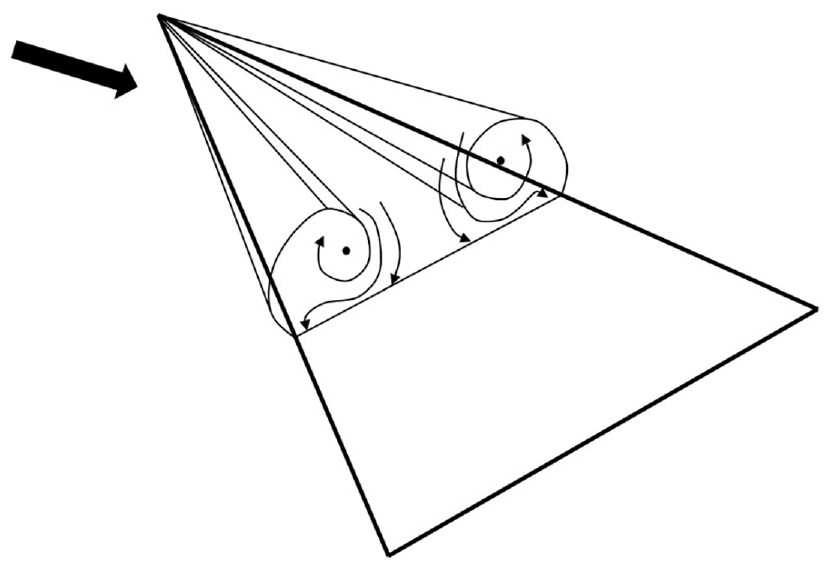
Schematic of vortex lift on a delta wing.
Some authors have suggested that the skis can be examined independently of the body but interaction of the flow from the ski and body mean this is not the case. Meile et al. 1 tested with and without the skis and found that for small values of α the forces on the skis were independent from the body. However, this broke down when α ≥ 40°. For the current study the interaction of skis and the body will be included over the entire map of postures examined.
(ii) Body angles:
• β, the leg-to-ski angle, and
• γ, the hip angle.
In general, previous studies only concentrated on β and γ when varying posture10,16,18 as they can be used to define the incidence and camber of the body when equating it to a wing. (Note that aerofoil theory 17 shows that lift is governed by the incidence and the camber of the aerofoil). Seo et al. 6 and Marqués-Bruna and Grimshaw 16 showed that increasing β increases L/D, but advances the onset of stall, because α+β gives the incidence of the lower body. Interestingly, it has been reported that α+β describes the aerodynamic optimum of the whole system rather than individual variables, with Meile et al. 1 reporting maximum efficiency with 30° < α + β < 40° and maximum lift where 50° < α + β < 55°. This suggests that the body is more important than the skis aerodynamically, but no hard conclusions have been drawn on this in the literature. By measuring postures of top athletes in competition, Schmölzer and Müller 13 found that an angle of 160° is typical for γ. This was confirmed to be close to the aerodynamic optimum by Meile et al., 1 who showed that γ is most effective between 160° and 170°. Seo et al. 12 only considered 180° so this does bring into question their overall conclusions and that of any studies that use their force data.
Other parameters include the spread of the arms and the head tilt, both measured by Meile et al., 1 but these were found to have negligible effects. Furthermore, ski jumpers typically use their arms for stability, so would find it difficult to fix them in a single position in flight. Hence these parameters have not been included herein.
Wind tunnel methods
Experimental testing was performed in the Loughborough University Large Wind Tunnel (Figure 4), which has a working section size of 1.92 m × 1.32 m × 3.60 m (W × H × L), a design speed of 40 m/s and a low turbulence intensity of 0.15%. A more detailed description is given by Johl et al. 19
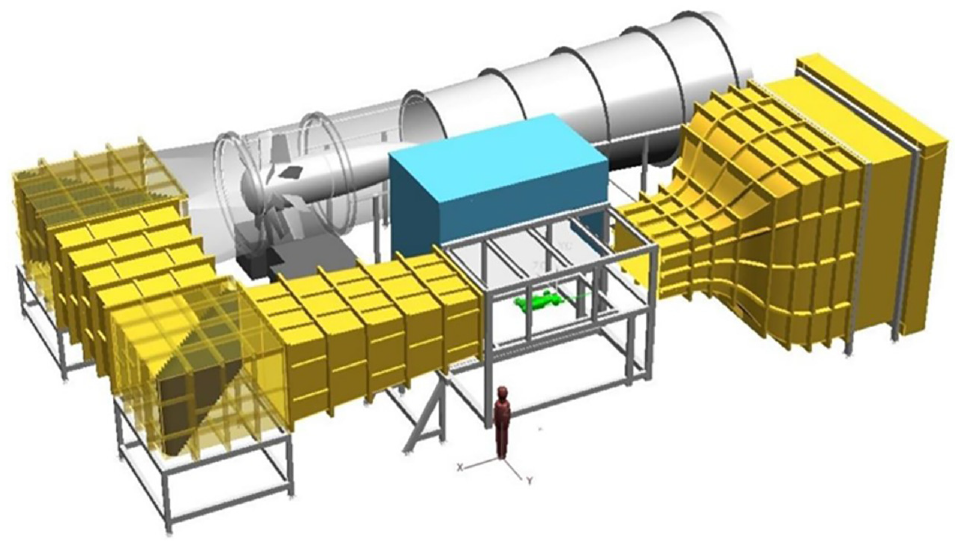
Loughborough University large wind tunnel. 19
Seo et al. 6 used a full-size and fully featured mannequin equipped with commercially available ski equipment. However, the complexity of their mannequin meant it could not be easily adjusted. Conversely, Reisenberger et al. 20 showed that a scale model made of simple prismatic shapes was valid for the range of flight conditions encountered by ski jumpers. They also showed that modeling a suit is unnecessary and inclusion did not change any aerodynamic trends. They also compared their results to studies which used full-size models, and found that they were in reasonable agreement, which would suggest that the simplified model concept gives a high enough accuracy for the results to be meaningful. Of note, neither Seo et al. 6 or Reisenberger et al. 20 accounted for blockage effects, even though the blockage ratio of the model to tunnel was >10%, which would have reduced the accuracy of their results.
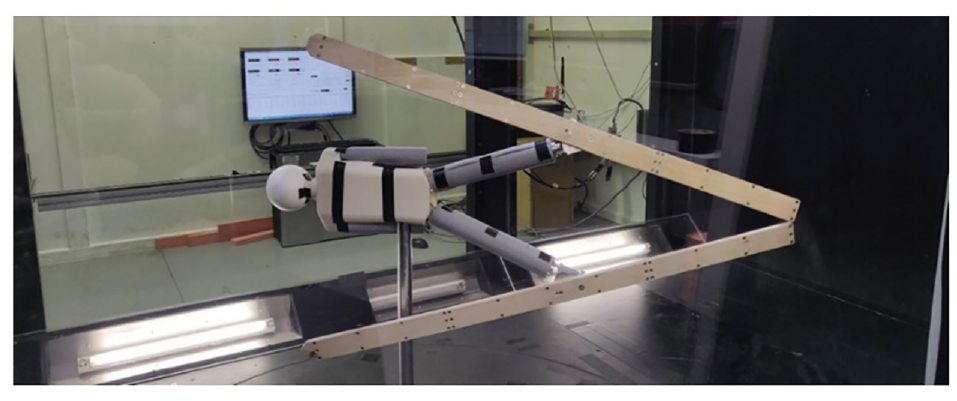
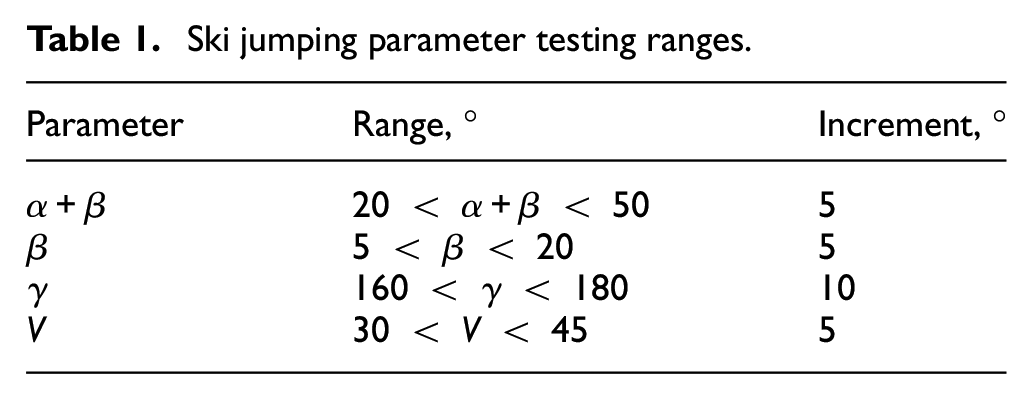
The current study adopted the approach of Reisenberger et al. 20 with the final design of the model ski jumper shown in Figure 5 (note that the model is mounted sideways due to the aspect ratio of the tunnel). The model comprised of an internal skeleton and cladding to form the aerodynamic surface (Figure 6(a)) with the scaled skis manufactured from marine ply, carbon fiber and acrylic. The model was articulated by joints at the torso, arms, hips, and ankles (Figure 6(b)) enabling the main four parameters to be altered in range shown in Table 1.
Model ski jumper.
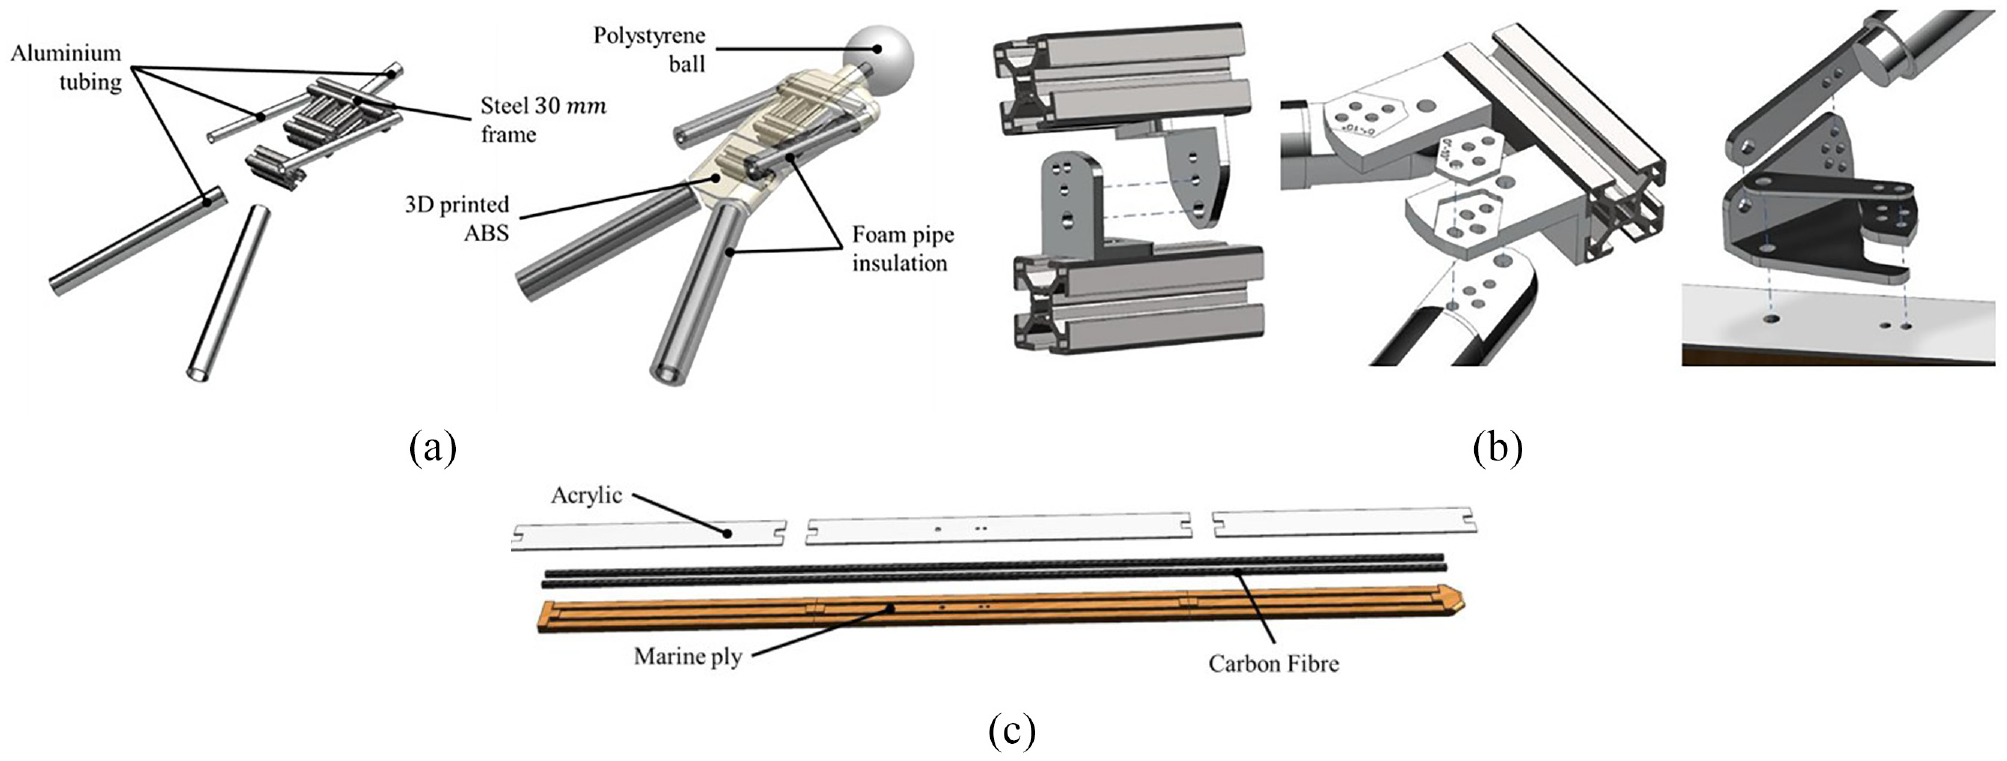
Model construction: (a) skeleton frame, (b) joints (torso, hips, ankle), and (c) skis.
Ski jumping parameter testing ranges.
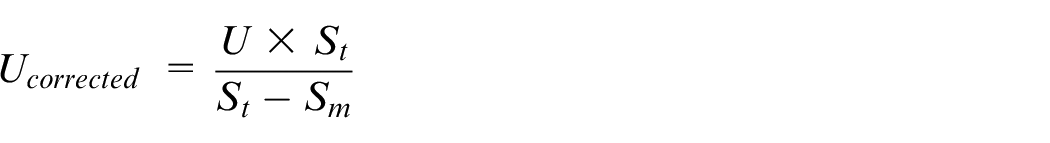
Both Virmavirta et al. 10 and Schmölzer and Müller 13 found that the optimum posture varies by athlete’s anthropometry hence the current model was scaled on a specific athlete (Bolton and Bolton 14 ). The actual scale of the model was determined by several key constraints. The blockage presented by the model in the tunnel had to be below 10% with the aim being 5%, minimizing its influence on the freestream tunnel flow and the need for corrections to measured lift and drag. 20 The overall aerodynamic loading was limited by the tunnel balance, as outlined in Table 2. Both these factors limited the size of the model. However, care was taken to ensure that the combination of the model size and tunnel velocity still yielded a representative Reynolds number. Given these constraints the final model used was 40% scale giving a maximum blockage ratio of 4.9%. A blockage correction was applied using:
Balance ranges and accuracy. 19
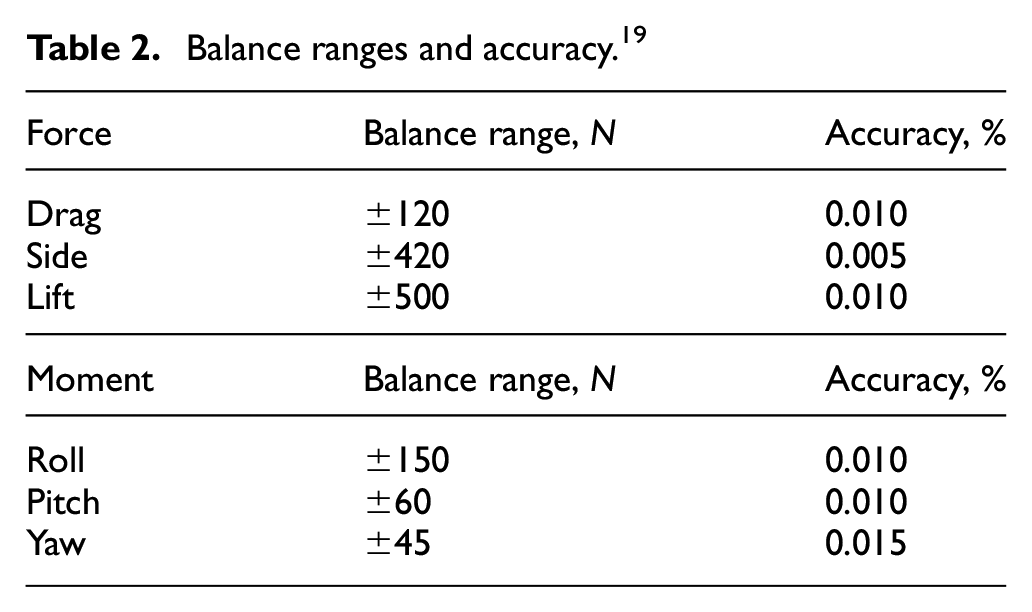
where S t is the cross-sectional area of the working section, S m is the frontal area of the model and U is tunnel velocity.
Typically, full scale velocities during the jump range from 25 to 35 m/s1,5,6 so with the maximum safe tunnel velocity of 50 m/s (set by the force balance limits) the model Reynolds number was a little low (70%–80% of full scale). However, the work of Meile et al. 1 suggests that exact Reynold’s matching is not necessary. They conducted a Reynolds sweep which showed that force coefficients were invariant over the range tested (±20% from the full-size take-off case). It is worth noting that at 40% scale, the Reynolds number for the head and torso was greater than 105 suggesting fully turbulent flow and Reynold’s invariance. This meant that the surface finish was not critical, and parts were 3D printed for ease of manufacture and accuracy. However, the Reynolds number for the arms and legs did not meet this requirement, suggesting that boundary layer transition could have a have large effect on the flow. To avoid this and promote early transition the arms and legs were clad in foam pipe insulation which had a relatively rough surface. Indeed, Figure 7 shows results from a Reynold sweep illustrating that the force coefficients were Reynolds invariant from velocities as low as ∼30 m/s, or Re ≅ 2 × 10⁶ (based on ski length). Reynold’s invariance also held true over a range of postures. Results are presented in terms of a force-area (SCl and SCd) as the exact projected areas for each posture were unknown. A reference area, S, of 0.16 m2 was used. In Figure 6, the first posture had α = 15°, β = 5°, γ = 180°, and V = 30°, whilst the second posture had α = 0°, β = 20°, γ = 160°, and V = 45°.
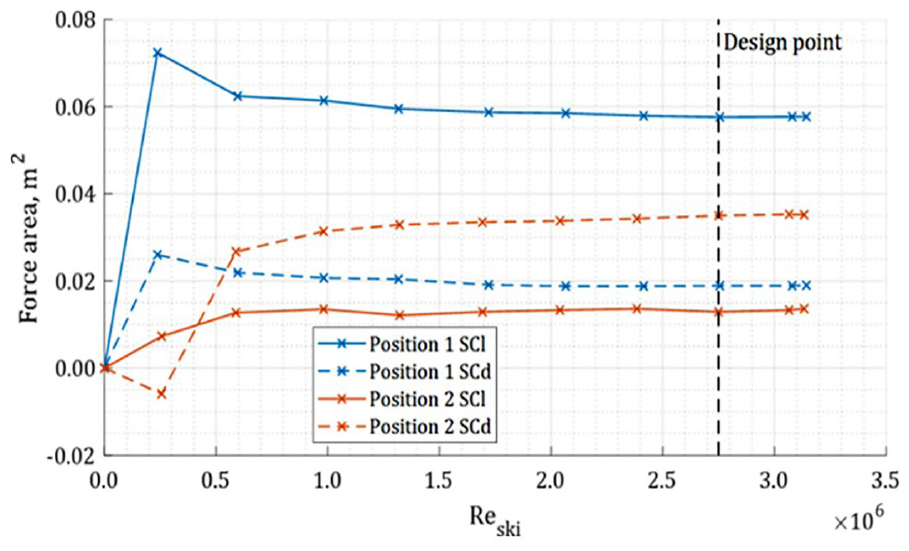
Effects of Reynolds number on force data.
The accuracy of the wind tunnel and balance (Table 1) are discussed in detail by Johl et al. 19 Figure 8 illustrates these documented errors applied to a typical sweep of α+β and Figure 9 illustrates the repeatability of the system. Both illustrate that the measurement uncertainty is negligible in comparison to the measured values.
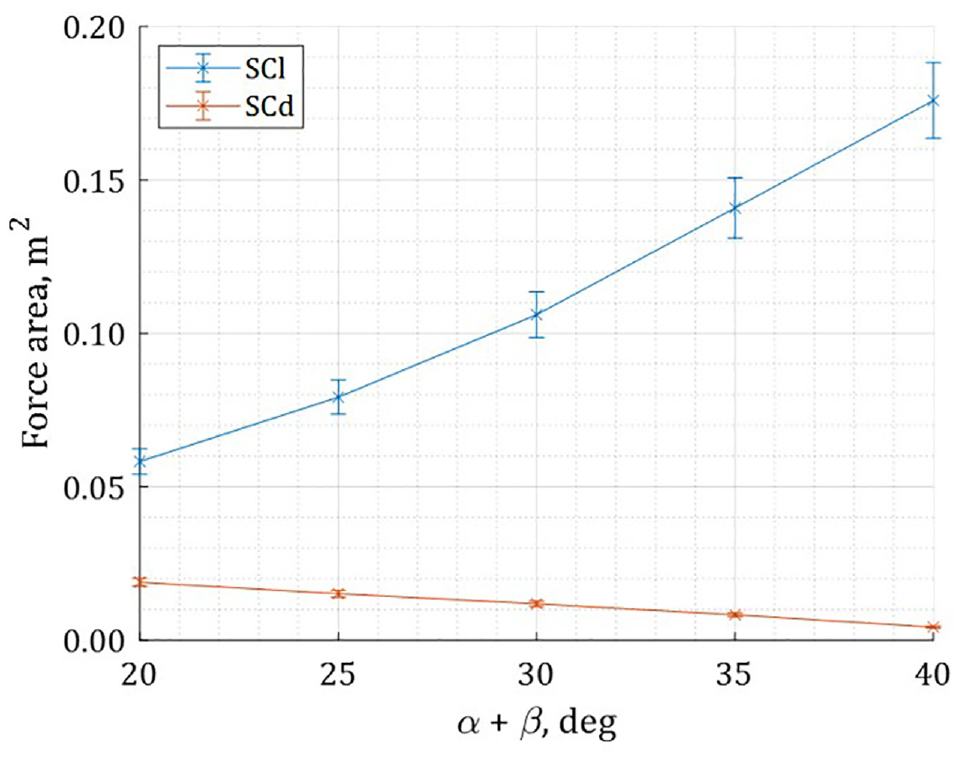
Typical experimental uncertainty.
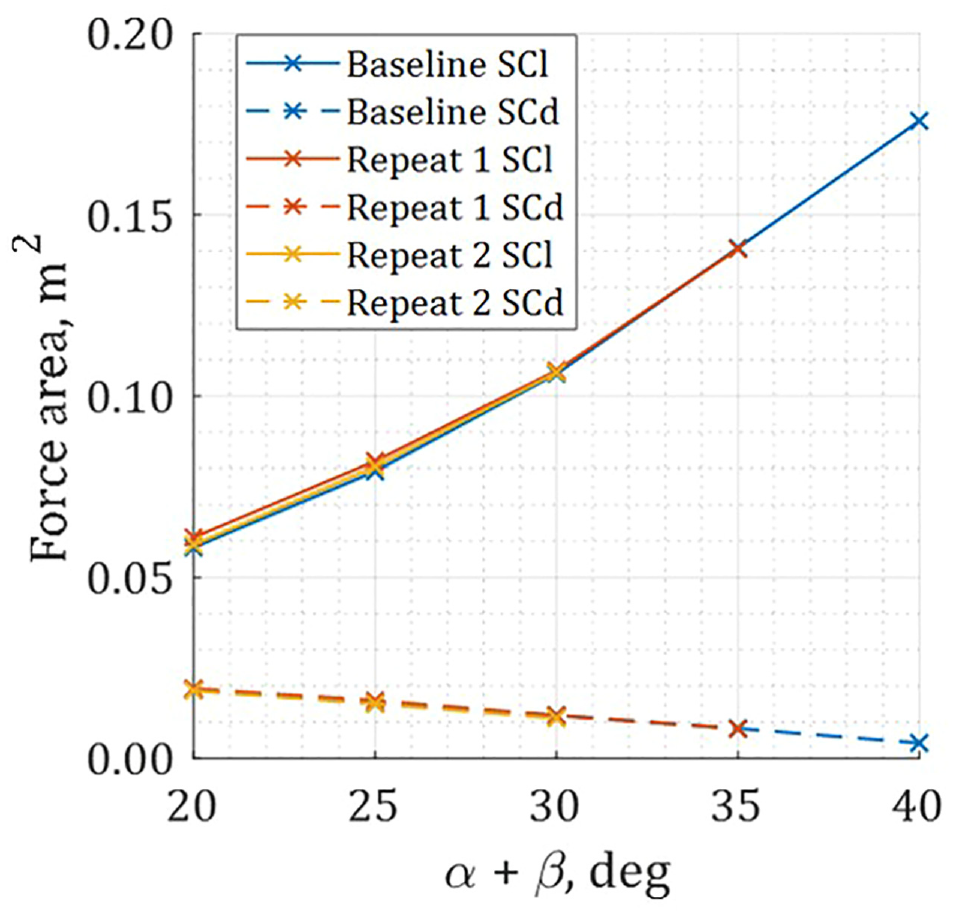
Experimental repeatability.
Numerical methods
There have been several other studies that use numerical methods in an attempt to determine optimal position. Seo et al. 12 integrated simple equations of motion and force data from Seo et al. 6 to compute flightpath and jump distance. However, they limited their study to angle of forward lean and ski V angle (with the latter also limited to 25°). Jung et al. 21 employed an algorithm based on Pontryagin’s minimum principle to determine the optimum flight position. They considered a similar range of parameters to the current study, but their approach differs in that their algorithm was designed to identify an optimum, whereas the current paper presents performance maps to provide a better understanding of the trade-off between an athlete’s ability to attain the optimum position and the penalty for straying from this. This led to identifying both a “true” optimum but also a “safe” optimum (with a larger margin for error) that an athlete may opt to use, for example, if they were less experienced, or in qualifying, or if the conditions were less than ideal.
The current work uses a two degree-of-freedom (DOF), point center of gravity (CG) model to simulate the flight of a ski jumper and only considers movement in the horizontal jump direction (x) and vertical (z) direction (see Figure 10). Horizontal movement perpendicular to flight direction is not considered; this is mainly caused by side wind or athlete error. Additionally, pitch (or rotation about y) is also not considered.
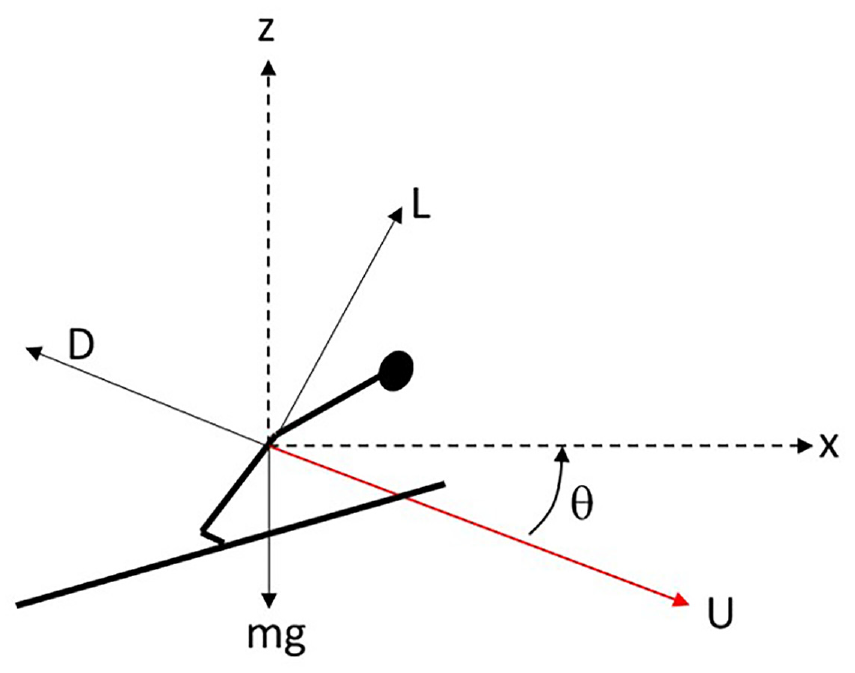
Numerical coordinate system.
For the governing equations of motion, the lift and drag forces were computed from the experimental data, SCl and SC
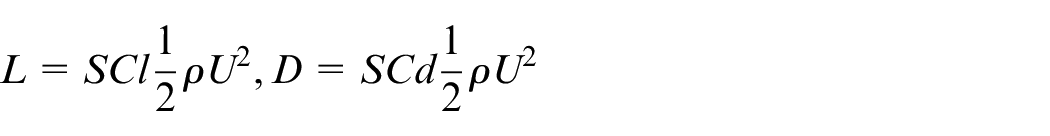
These were then converted from the experimental coordinate system to the flight coordinate system by:
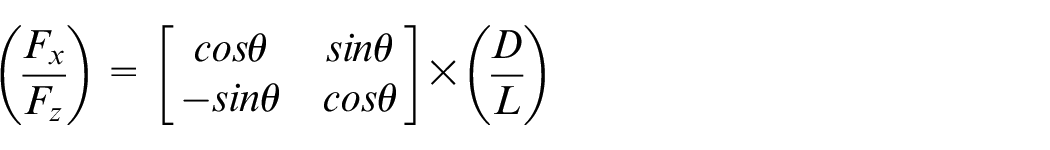
Where
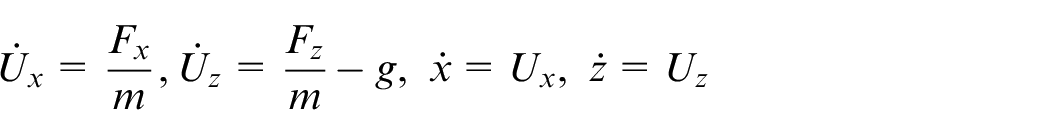
A time-marching approach was employed, coded within MATLAB, to solve the governing equations of motion given above. This is similar to the approach used in the Aquila ski jumping simulator by Virmavirta and Kivekäs. 22 In competition ski jumps are measured to an accuracy of 0.5 m so a timestep of 1 × 10⁻³ s was used as this offered an accuracy better greater than ± 0.25 m. For comparison, Virmavirta and Kivekäs 22 used a timestep of 2 × 10⁻² s.
Initial conditions were defined from both competition data and previous studies on take-off kinematics. The athlete’s velocity parallel to the take-off platform (the “in-run velocity”) was taken from the 2018 Pyeong Chang Winter Olympics official results, with a velocity of 25 m/s being typical. The perpendicular velocity component (which is supplied by the athlete’s jump) was taken from a study conducted by Virmavirta and Kivekas, 22 who showed that a typical perpendicular velocity component is 2.5 m/s. The ambient conditions were taken at the altitude of the chosen landing slope (Alpensia Ski Jumping Centre Large Hill, in Pyeong Chang), and the total mass of the athlete was set at 65 kg to match the mass of a specific athlete. 14 Note that although time is required to transition from the take-off position to flight, and from flight to landing, these were not modeled, assuming instantaneous take-off and landings. This was deemed acceptable, because the take-off transition phase has been documented to take 0.4 s, 12 over which the athlete will only travel ∼10 m, and the landing posture is predetermined by regulations, 1 so there is little scope for aerodynamic gains in the transition phases, and their effects on jump distance are small.
The flight was split into three discrete phases, with instantaneous posture changes between each. The end of the first flight phase (“early flight”) was defined from industry best practices, at 40 m after take-off. 10 The transition between the final two (“acceleration” and “parachute”) phases was defined mathematically, at the location where the flightpath angle is steep enough so that the resultant aerodynamic force provides a forward component; this typically occurs at flightpath angles of ∼30°, or at distances of ∼60 m. To calculate the intersection with the landing slope the profile of the hill was approximated by a cubic spline defined using five points used by the FIS in the venue certification process. 23 An example flightpath for multi-phase flight can be seen in Figure 11. Note that although the middle phase only covers a small distance (∼20 m or ∼0.8 s), it was confirmed with ski jumping athlete (Bolton and Bolton 14 ) that this was reasonable before implementing in the numerical model.
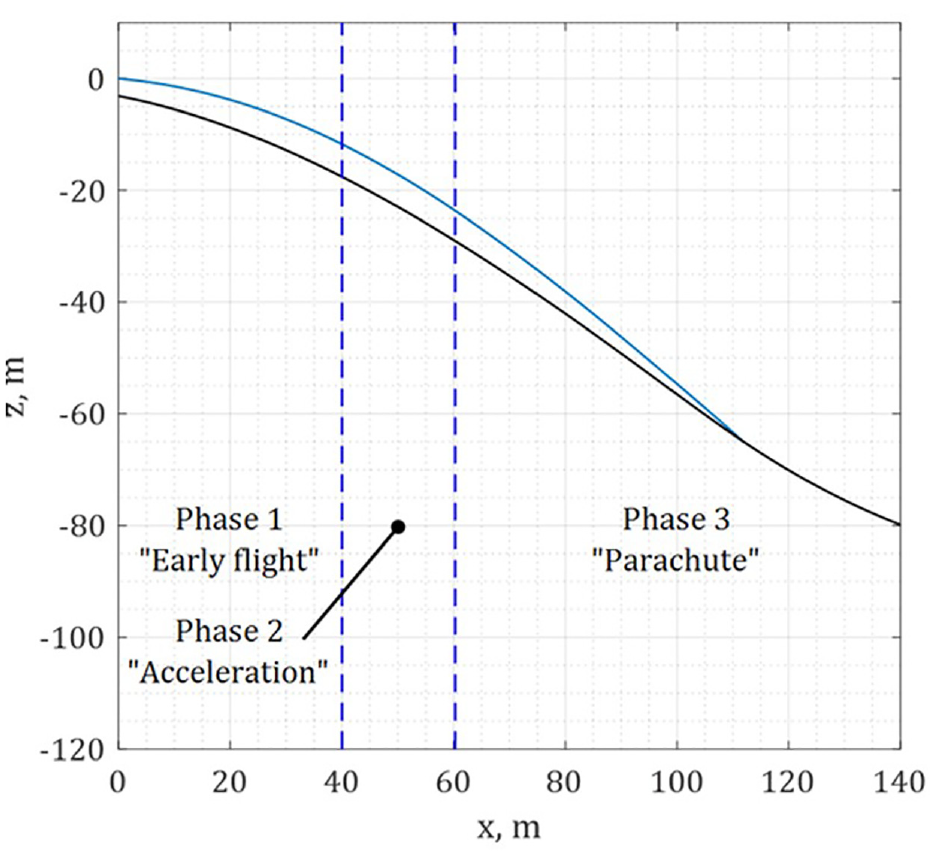
Example multi-phase flight profile.
Experimental results
A total of 297 postures were tested in the wind tunnel for ranges of α (ski incidence), β (leg-to-ski angle), γ (hip bend) and V (ski opening angle) shown in Table 1. Results are presented in terms of the lift-area, SCl, and the lift-to-drag ratio, L/D.
When considering the system, it is important to determine whether the ski or body incidence was of greater importance to generating lift and maintaining a high aerodynamic efficiency. Figure 12 shows 2D contours maps of SCl and L/D varying α and β with fixed γ (170°) and V (35°). Points in a vertical line describe the effects of increasing α but maintaining body position relative to the airflow. Points in a horizontal line describe the effects of increasing β but maintaining ski position relative to the airflow, and points lying on a diagonal describe the effects of increasing α with constant β. At low incidences increasing α is a more efficient method of gaining lift than increasing β, because both SCl and L/D increase with increasing α. This is not the case at higher incidences, where increasing α decreases L/D. However, changing α is still more efficient than increasing β, because the L/D contour lines are closer to vertical. Interestingly, where 25° < α + β < 45°, there is an optimum β between 10° and 15° for both lift and efficiency, suggesting interaction exists between the skis and the body.
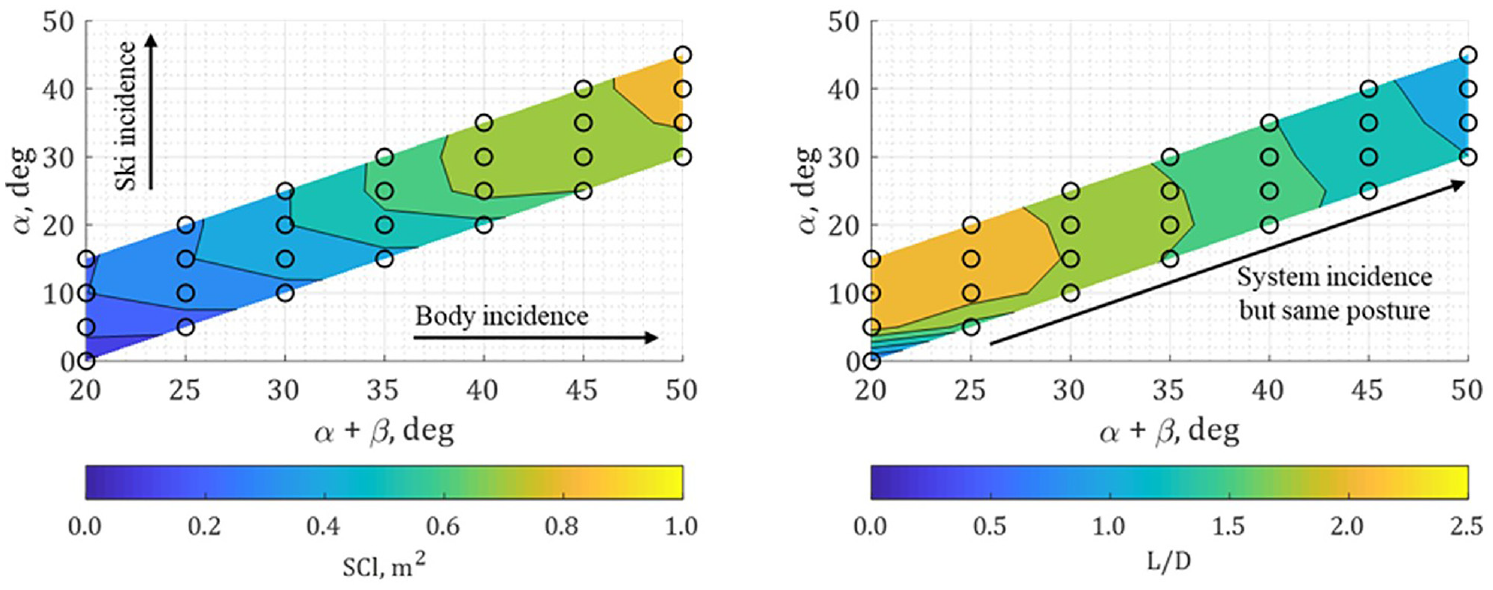
Effects of ski and body incidence on lift and efficiency (γ = 170°, V = 35°).
Figure 12 shows no indication of stall but does suggest the system is nearing stall; at higher incidences the lift curve slope is non-linear. Clearly, the incidences are much higher than expected for stall for classic aerofoil theory 17 (12°–16°) which suggests lift is not generated conventionally, as previously assumed.6,16 This is most likely because the lift generated by the skis is via vortex lift (as per delta wings), where low pressure vortices roll up at the leading edge of a swept wing at high angles of attack. For the torso the delayed stall is likely a phenomenon akin to classic wing-tip vortices causing a non-linear affect. Torres and Mueller 24 previously found that for wings with very low aspect ratios stall can be delayed until incidences of over 40° by the tip vortices.
The effect of the ski opening angle, V, is shown in Figure 13 with the body incidence held constant (α + β = 40°). Generally, increasing the V angle produces lift as it is analogous to decreasing the sweep of a delta wing. Interestingly, L/D was near constant (within ±0.15) for all ski incidences and opening angles, whereas it has previously been reported to increase with increasing V angle.6,18 This suggests that the body was less efficient at generating lift than the skis, because increasing the total system incidence (Figure 12) once in the region of non-linear lift resulted in noticeable reductions in L/D.
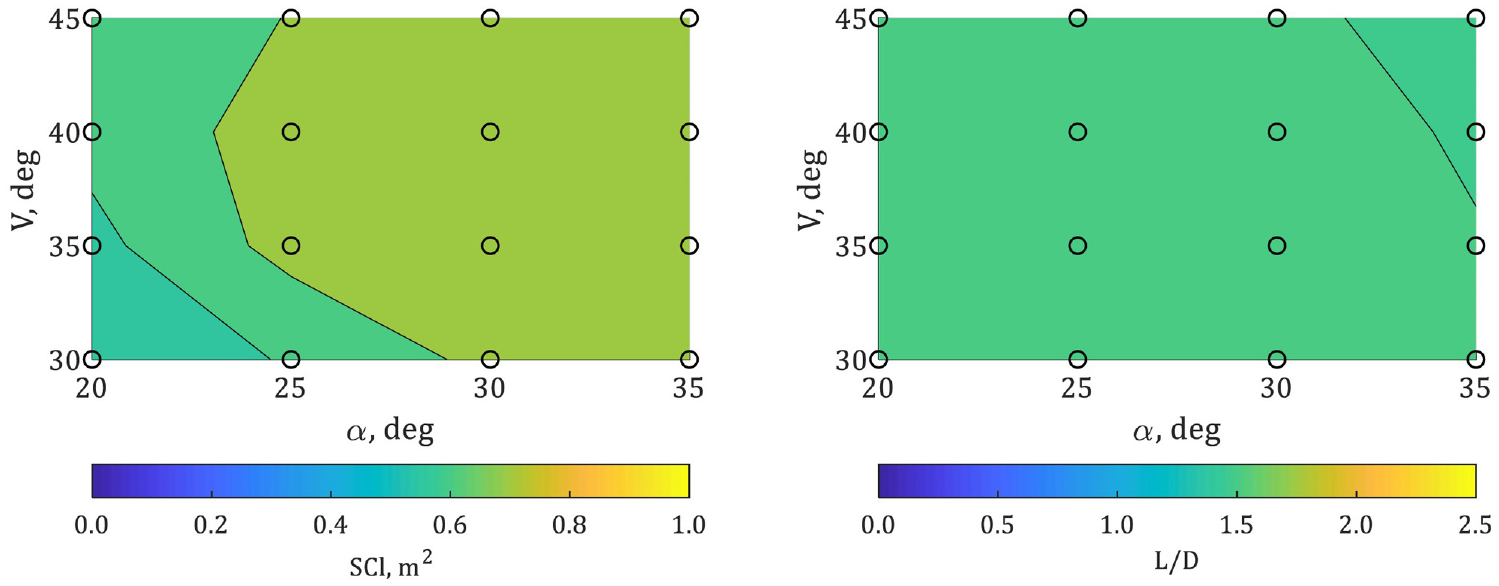
Effects of ski position (V) on lift and efficiency (α + β = 40°, γ = 170°).
It was not possible to measure the forces on the skis and body individually and hence impossible to quantify any interaction between the legs and skis. However, Figure 14 shows that trends relating to V angle were relatively constant with changing β. This suggests interactions were small and the main contribution when changing β came from increasing the incidence of the body. If any conclusions were to be drawn, then the effect of increasing the V angle is amplified at higher β angles, where the legs and skis are farthest apart, and the interaction minimized. This suggests that the leg-ski interaction regulates the strength of the leading-edge vortices on the skis.
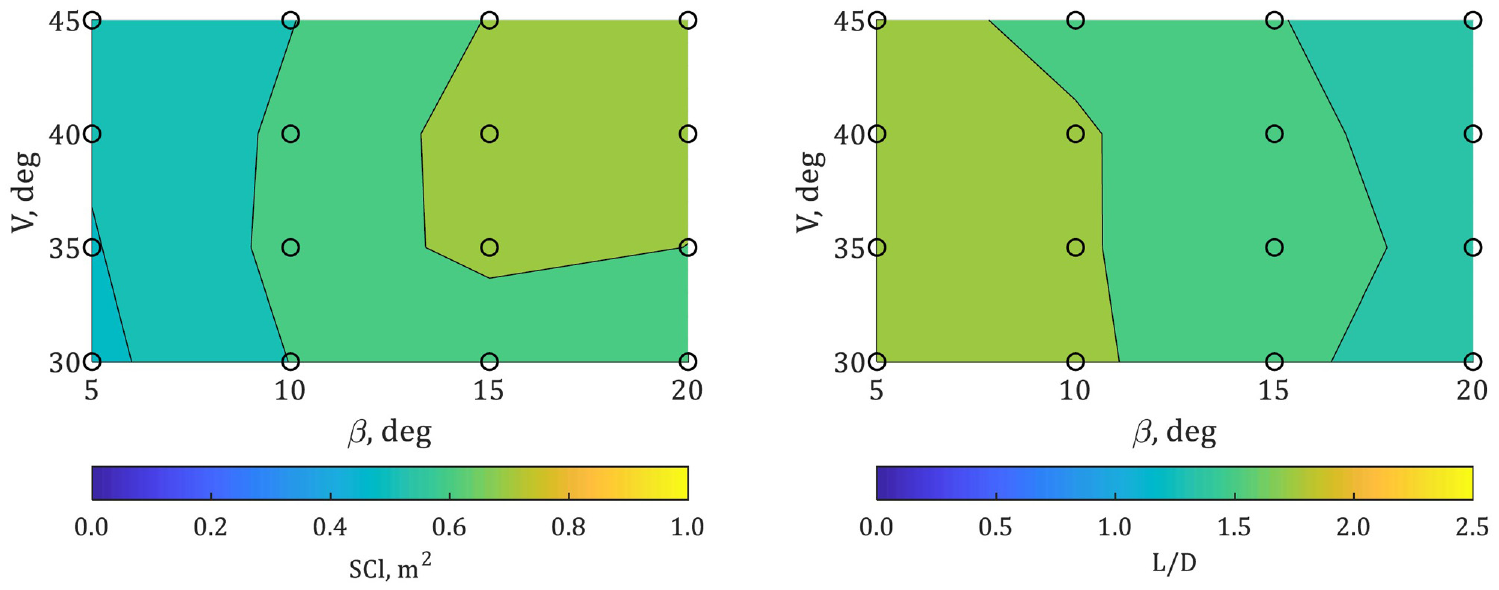
Effects of ski-body interactions on lift and efficiency (α = 25°, γ = 170°).
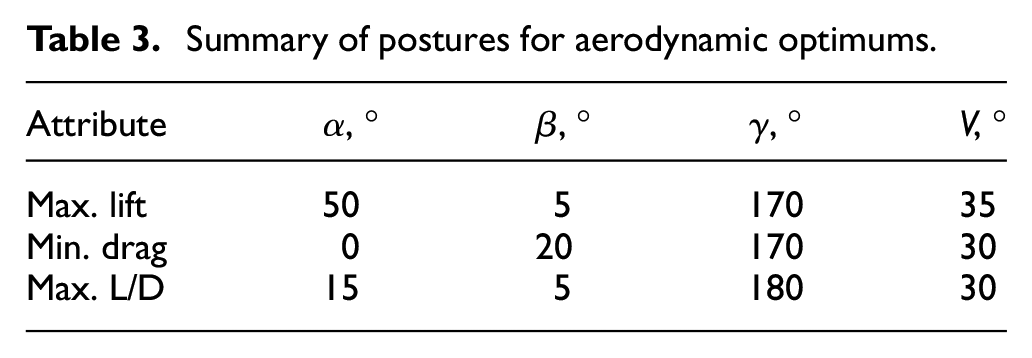
The effect of the hip angle is shown in Figure 15, where (180 – γ) represents the body’s camber (if equated to an aerofoil wing), and [α + β − (180 − γ)] represents the incidence of the body. As can be expected for a cambered geometry, increasing the camber (reducing γ) increases lift, but decreases L/D. Although the latter is more than would be expected for simple aerofoil theory. This may be due to the body being hinged at the hip rather than a gradual camber. Effectively there was a corner between the fore and aft body sections, which could have caused the flow to separate on the aft body at smaller incidences than if a gradual camber had been applied. Additionally, if the body does act as a cambered wing, then it has such a low aspect ratio that the effect of “wing-tip” vortices would be quite significant in producing lift-induced drag. From all the data gathered the optimum positions are shown in Table 3 and these agree favorably with other studies (e.g. Meile et al. 1 ). However, the minimum drag, and maximum L/D positions were not comparable to those reported in the literature, due to the larger range of postures tested in the current work.
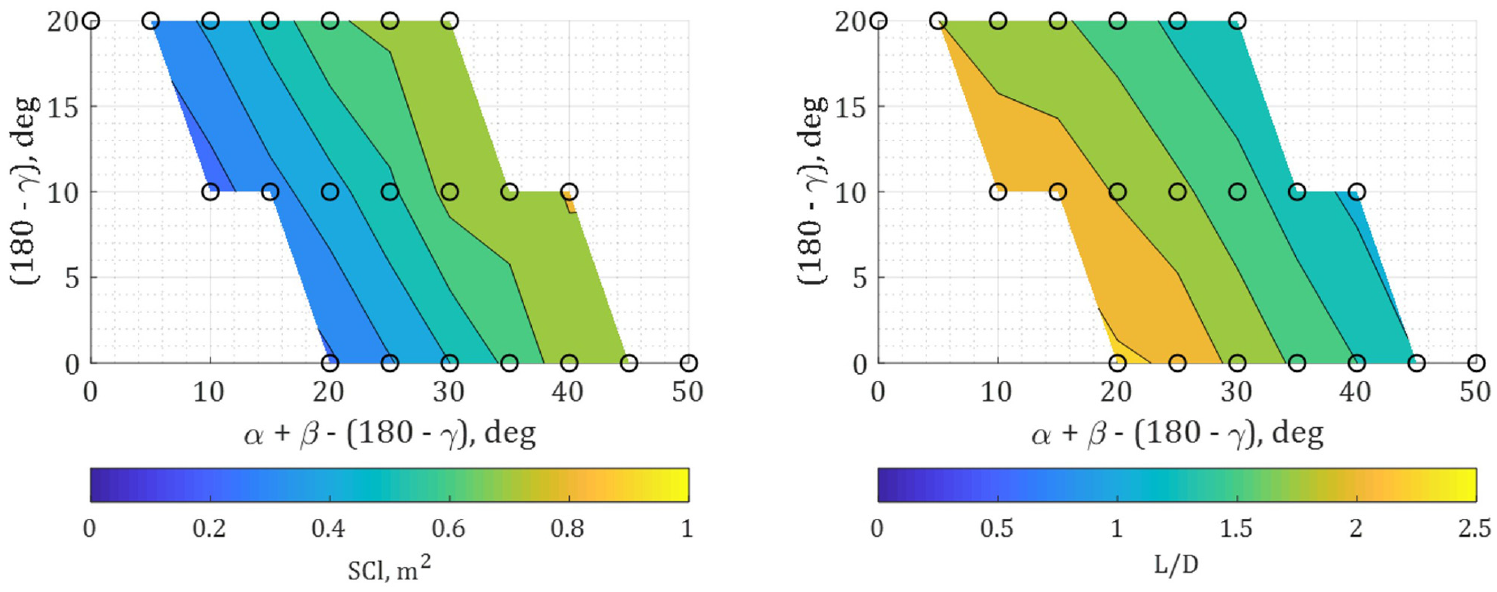
Effects of body posture (camber) on lift and efficiency (β = 15°, V = 35°).
Summary of postures for aerodynamic optimums.
Numerical results
Single flight phase
The measured aerodynamic data were entered into the flight dynamics model while maintaining a single posture over the jump. Figures 16 and 17 show that the maximum distance occurs at neither the maximum lift nor maximum aerodynamic efficiency (SCl nor L/D). This is quantified in Table 4, which shows that the aerodynamically optimum postures performed poorly. Instead, the maximum distance was obtained with a compromise between lift and efficiency. The physical reason for this is that early in the jump, maximizing efficiency is important to maintain horizontal velocity, but as the flightpath curves downwards, the lift and drag vectors tilt forwards (see Figure 10). This means that the lift vector starts to compensate for some of the horizontal force component coming from the drag, and the drag vector starts to add to the vertical force component. When these two effects are combined, the aerodynamic efficiency becomes of less importance. Therefore, when maintaining a single position over the entire jump duration, the efficiency must be high enough to reach the latter part of the jump, but the lift must also be high to maximize the benefits of the curved flightpath.
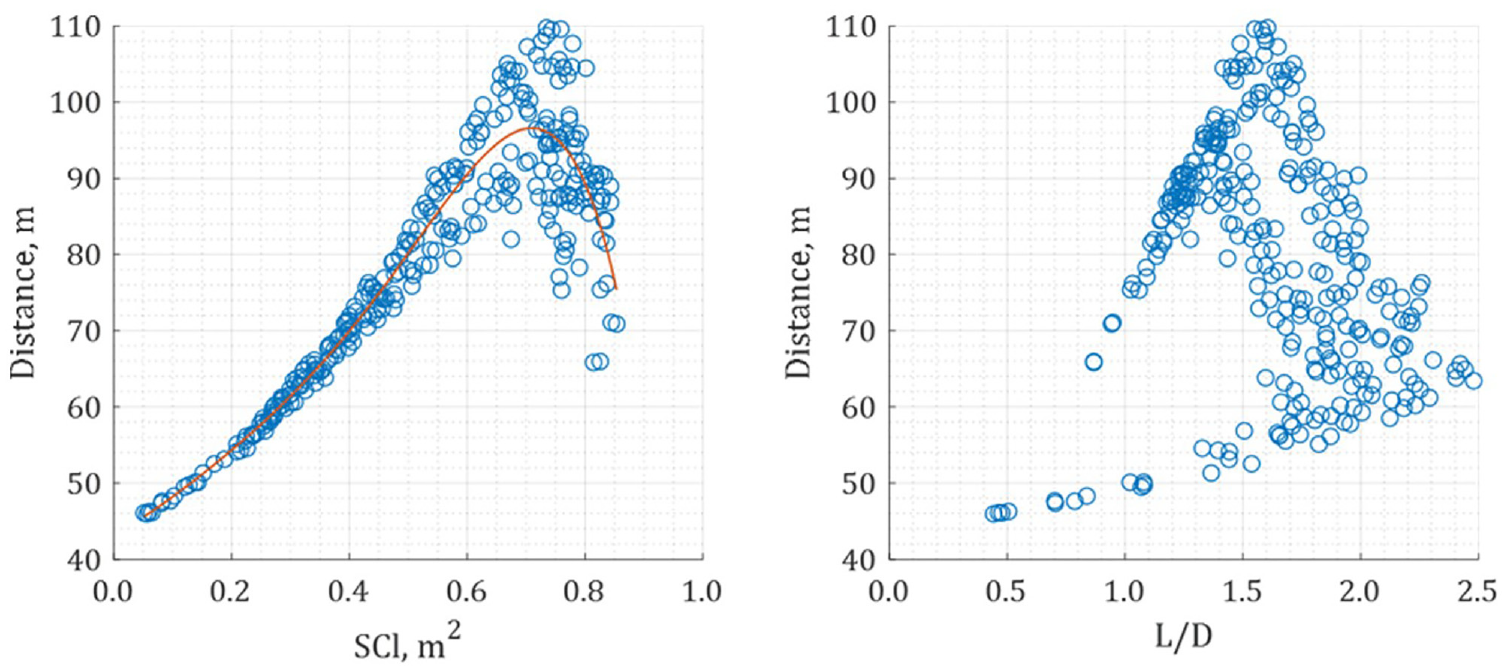
Effects of lift and efficiency on jump distance.
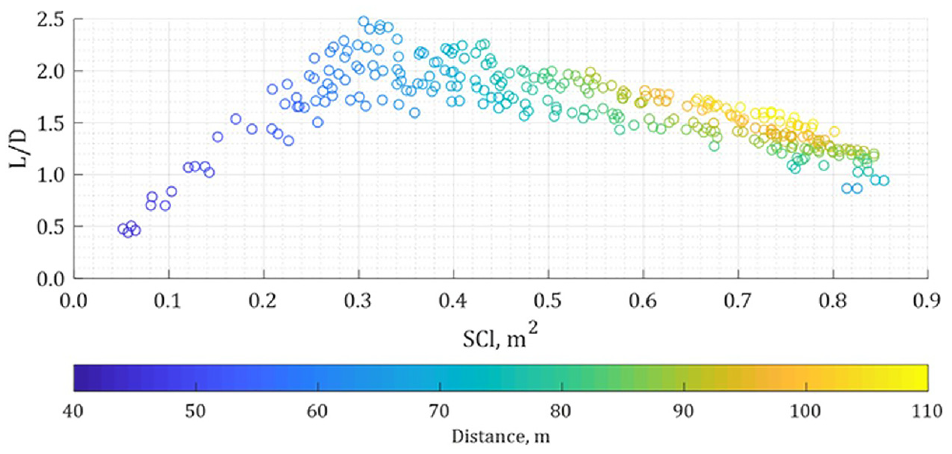
Combined effects of lift and efficiency on jump distance.
Summary of distances obtained with various optimums.
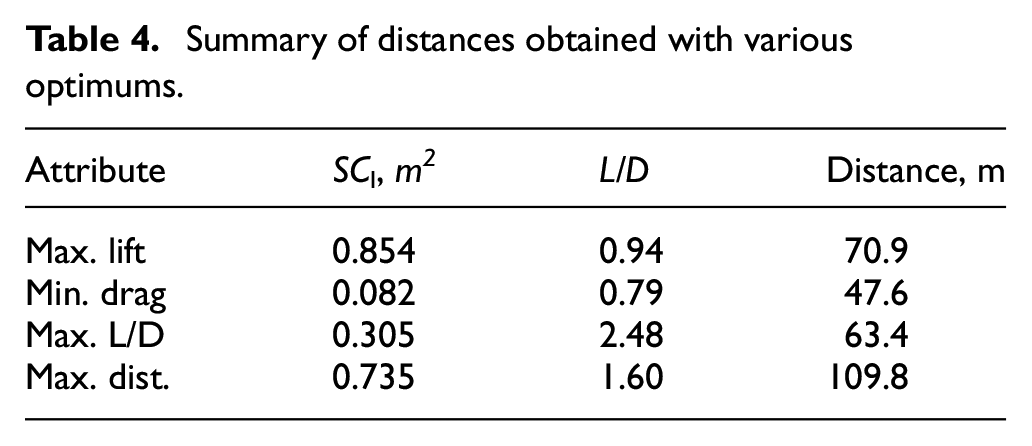
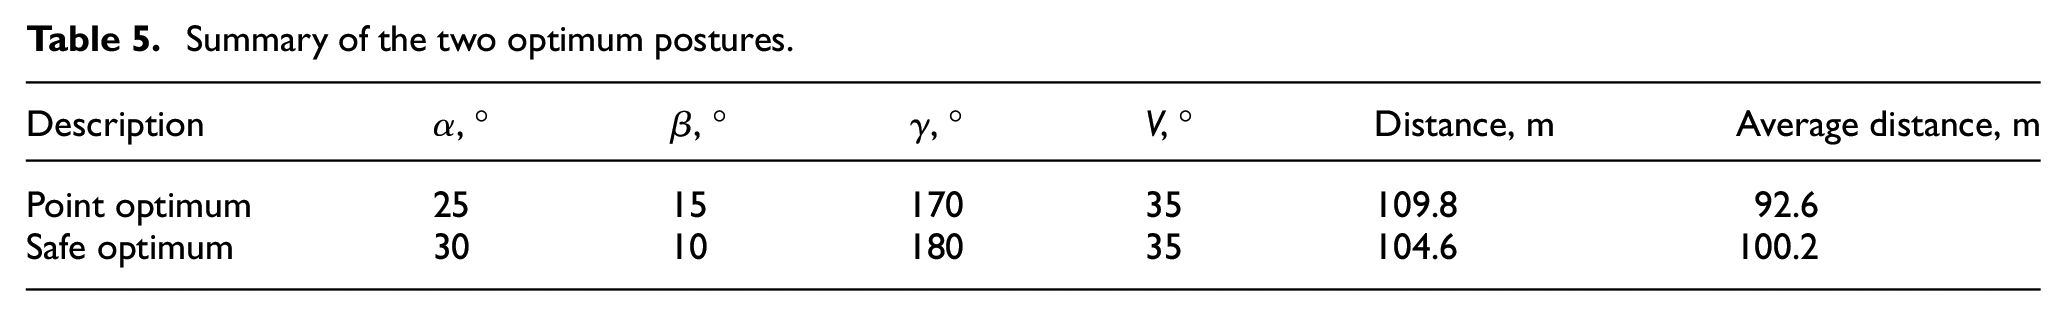
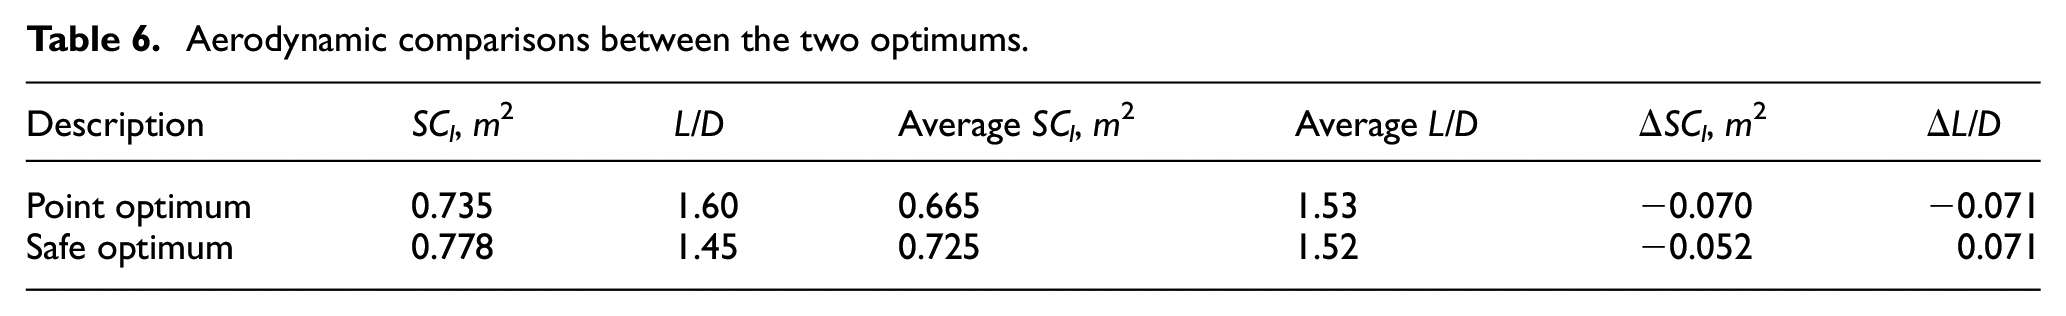
From the data two optimums were defined as shown in Tables 5 and 6; a posture which gave the furthest distance in isolation, and a “safe” posture to account for the skier not being able to accurately replicate exact postures. The model was run over a number of points adjacent to this “safe” optimum to give the average values given in Table 5. Using this safe optimum would ensure the athlete always jumps a good distance, rather than being heavily penalized for small positional errors.
Summary of the two optimum postures.
Aerodynamic comparisons between the two optimums.
Multiple flight phase results
Of the four parameters, α and β are difficult can be controlled both by modification of the equipment and the behavior of an elite athlete. However, given that changing both γ and V is easier than changing α and β 14 this paper only varies γ and V in the multi-phase flight simulations.
To ensure a true optimum was found, all 36,591 possible combinations of postures were simulated. Table 7 summarizes the three-phase flight postures which gave the optimum distance of 111.9 m. This distance is only 2.1 m greater than single-phase flight but it would have accounted for 7.2 more points in the 2018 Winter Olympics, where first and fourth places were separated by just 12.6 points.
Summary of the optimum three-phase flight.
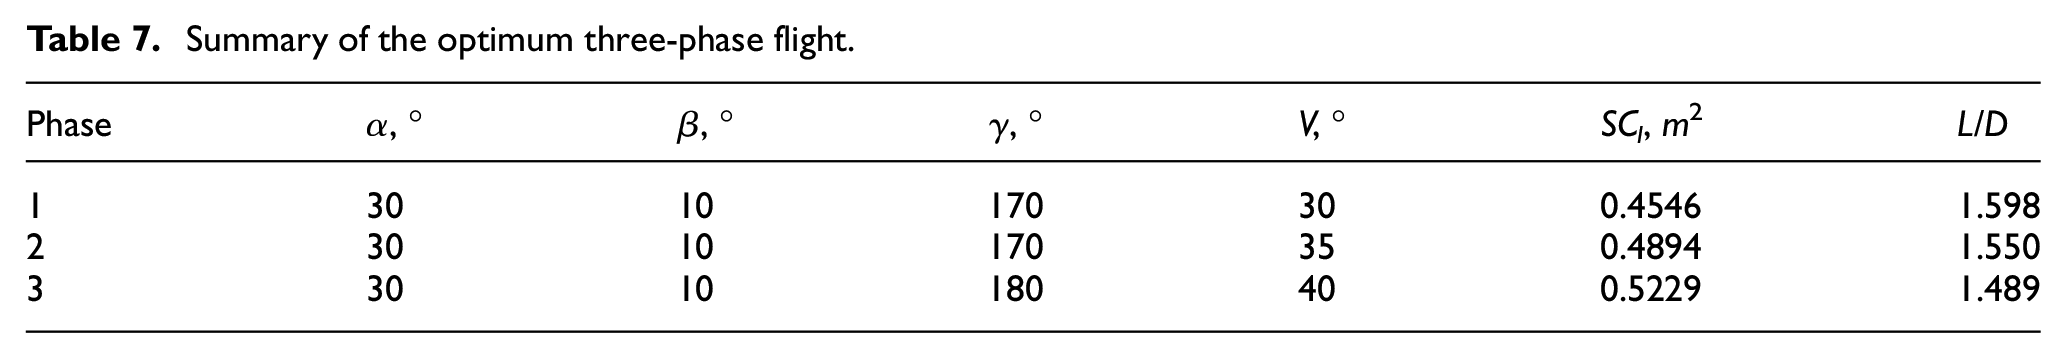
Lift (SCl) and efficiency (L/D) are presented in Figure 18 showing that as the jump progresses, lift increases whilst efficiency decreases. This is achieved by increasing both V and γ (thus reducing camber). Although somewhat counterintuitive, reducing camber increases the lift by increasing the incidence of the body (α+β− (180 −γ)). This fits with the theory presented by Remizov 11 that high efficiency is required early on to maintain horizontal velocity, and lift is more important in later stages as the flightpath curves.
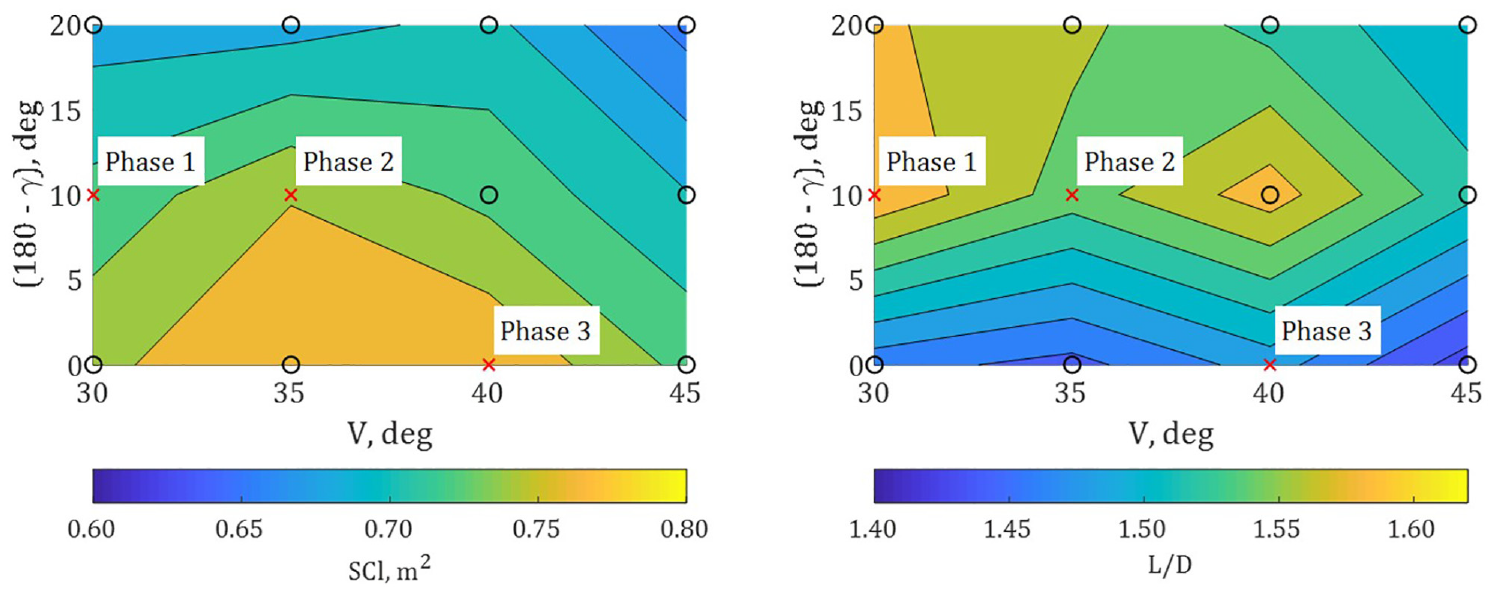
Lift and efficiency for optimized three-phase flight (α = 30°, β = 10°).
To verify the identified trends were not a coincidence, for each flight phase the 12 possible γ and V combinations were compared, using the positions for the maximum total distance in the other two phases. This allowed the aerodynamic effects to be plotted against distance for each phase as shown in Figures 19 to 21. The linear regression correlation coefficient, R2, confirms that the progression trends were not coincidence. Efficiency, L/D has a strong influence in the first flight phase (R2 = 0.887) whereas drag, SCd, has only a weak correlation (R2 = 0.247) and lift, SCl, no correlation. In the second phase the influences are less clear as the correlations are small. However, in the third phase lift, SCl, has a very strong influence (R2 = 0.986).
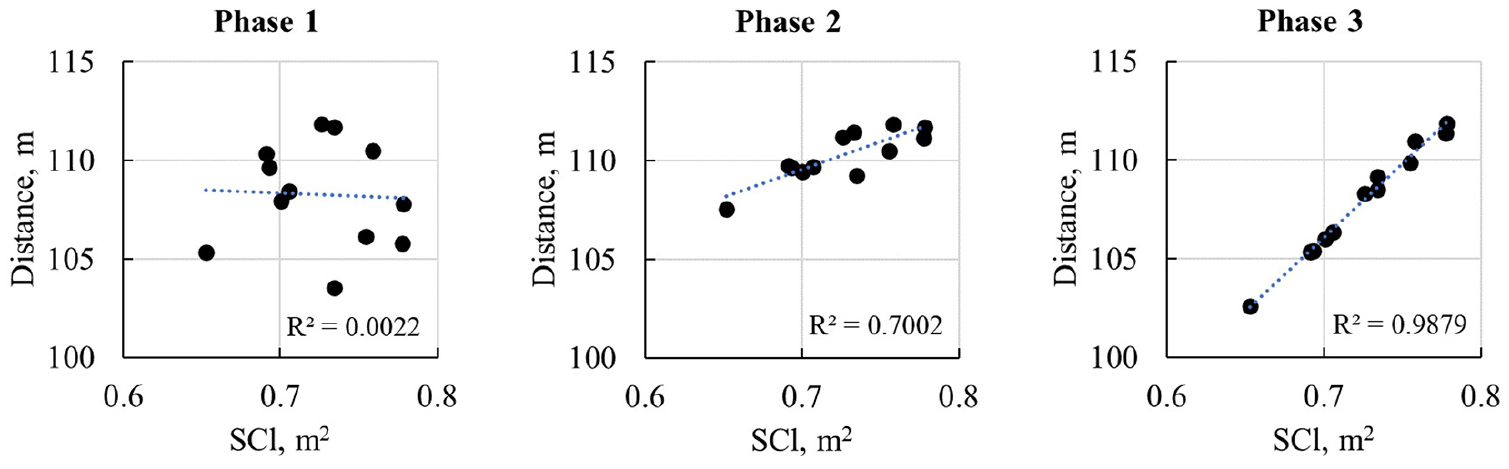
Effects of lift on total jump distance for each flight phase.
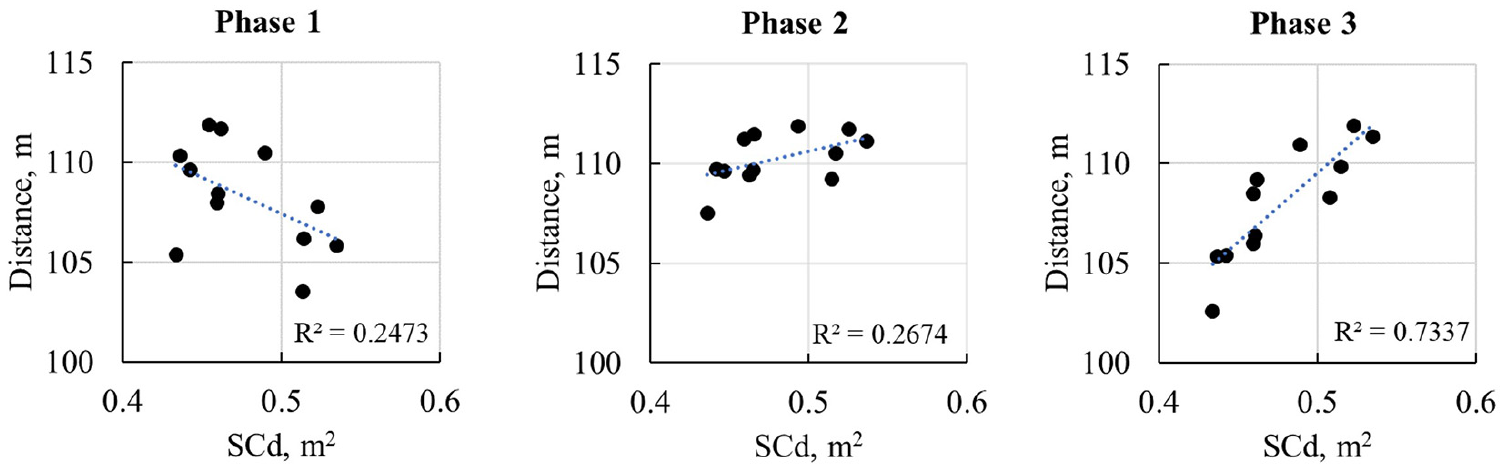
Effects of drag on total jump distance for each flight phase.
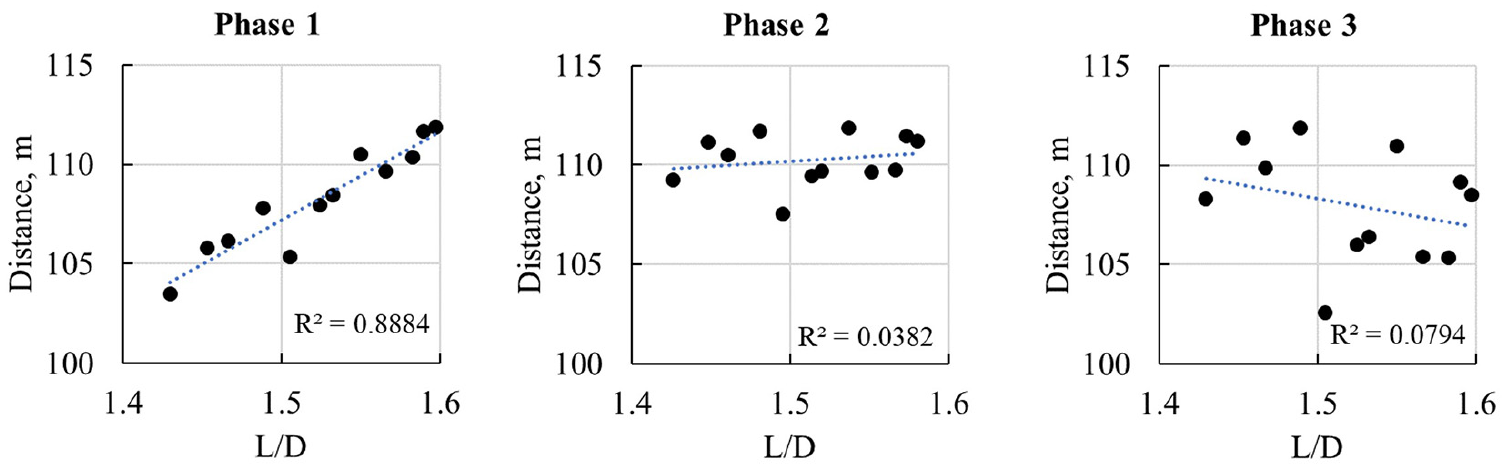
Effects of efficiency on total jump distance for each flight phase.
Conclusions
By conducting an experimental analysis on the aerodynamics of ski jumping, and implementing numerical models to simulate the flight dynamics, it has been found that:
Previously unreported, non-linear flow features related to the ski’s leading-edge sweep and the body’s low aspect ratio allow ski jumping athletes to generate lift at very high angles of attack.
High values of lift and L/D are not necessarily good in isolation for maximizing jump distance. L/D should be maximized at the start of the jump, and absolute lift should be maximized toward the end.
Following the experimental investigation and subsequent numerical analysis, several optimum postures for maximizing distance were also suggested, with varying degrees of difficulty in implementation:
To maximize distance with a safety margin to allow for athlete error, then the athlete should adopt a single posture with: α = 30°, β = 10°, γ = 180°, and V = 35°. This is recommended for less experienced athletes, who may not always be able to recreate exact postures consistently, or for qualifying jumps, or when the conditions may not be favorable.
To maximize distance with no safety margin, the athlete could adopt a single posture with: α = 25°, β = 15°, γ = 170°, and V = 35°. This would be recommended for experienced athletes, who can accurately and consistently recreate exact postures.
To further maximize distance a highly experienced athletes should dynamically alter their posture through the jump starting with α = 30°, β = 10°, γ = 170°, and V = 30°, and transitioning to γ = 180°, and V = 40° at the end.
Footnotes
Appendix
Declaration of conflicting interests
The author(s) declared no potential conflicts of interest with respect to the research, authorship, and/or publication of this article.
Funding
The author(s) received no financial support for the research, authorship, and/or publication of this article.