
Abstract
A testing protocol for conducting biomechanical underhand serve-reception evaluation in volleyball in match-like conditions is presented. A launcher sends a ball over the net toward the reception zone for the player to pass it to the setter; the ball is tracked with video cameras and the player’s articular information is captured by inertial sensors, force plates, and video cameras. Test-retest reliability and, known-groups and concurrent validity of the test are evaluated. Left knee, right knee, left shoulder, and right shoulder angles were highly reliable (ICC > 0.88), with low standard errors of measurement (%SEM < 13.07). Resultant normalized ground reaction forces were also reliable (ICC: 0.76, %SEM: 9.14). Professional and amateur athletes’ comparisons were statistically significant and non-trivial (p < 0.05, Cohen’s d > 0.49), with professionals’ body movements presenting small variance and symmetry between left and right limb variables, and amateurs’ presenting higher variance and greater asymmetry. Finally, each athlete’s left limb angles were compared against their corresponding sagittal Kinovea measurements for concurrent validity, obtaining acceptable correlation scores for amateur athletes (PCC > 0.79) and good correlation scores (PCC > 0.83) for professional athletes. The test offers a reliable and valid method for evaluating underhand serve-reception biomechanics in volleyball players.
Keywords
Introduction
A technical concern in volleyball is the evaluation of each player’s skills as conforming to the requirements of a specific field position, this is because game efficiency is primarily defined by the quality of each individual player. 1 In particular, the receiver – usually a specialized defensive player – is responsible for ensuring an adequate serve-reception of the ball in order to organize the attack against the opposing team. 2 Previous data-based studies have shown that the displacement of the receiver, the reception technique and the receiver position are good predictors of reception efficacy,3,4 which in turn has a positive influence on success in a volleyball match. From the coaches’ perspective, the receiver’s movement, body position, reception area, contact point with the ball, and lateral displacement can be used as predictive variables for reception efficiency.5,6 Therefore, being able to monitor and evaluate all those variables during training can be a differentiating factor for any team.
Nowadays, abounding technology makes it possible to quantitatively evaluate many sports’ techniques and also identify movement patterns of athletes during sports activities. Several studies have addressed different movement patterns in volleyball, such as spiking and jumping.7–15 Relevant studies in the field of sports biomechanics for volleyball blocking and spiking include the analysis of the lower limb mechanism and energy absorbed while landing, 16 or the dynamic load indicators for take-off-landing sequences. 17 Thirty-eight kinematic variables, including the position of the center of mass, speed and height of the spike, as well as time-dependent variables such as the time between specific events have been addressed in another study. 18 However, limited information is available in contemporary research literature regarding biomechanical analysis for the volleyball reception gesture. 19
Recently, volleyball-specific tests, to be performed on the court, have been proposed for monitoring spike and serving speeds, where complex movements arising in the upper-body during a spike and serving are captured. 20 Similar tests related to volleyball serve-reception that permit evaluation of lower- and upper-body biomechanics in situations that resemble match-like conditions are also necessary. Data analysis of the reception execution from official league matches revealed that the most used technique in receiving the serve is the low-hand technique, reaching an average value of 85.1% of all reception types during matches. 21 For this reason, developing specific low-hand reception testing protocols could help with providing useful data for analysis and overall team performance improvement.
This paper presents a volleyball testing protocol that provides quantitative lower and upper-limb information in order to perform evaluation of the biomechanical appropriateness of the underhand serve-reception. The testing was developed in two stages: testing protocol description (motion capture system and methods) and volleyball court experiments to evaluate the hypothesis of the testing methodology to be both valid and reliable.
Testing protocol
This section describes the test protocol for the serve-reception analysis in a match-like environment situation. The test required the volleyball player to perform an underhand serve-reception having a ball thrown at her by a launcher. For data collection, appropriate motion capture equipment was either selected or developed; details and reasoning for the inclusion of each device as well as their technical specifications and proposed distribution in order to achieve significant results is presented in this part.
Data acquisition
An inertial measurement unit (IMU) system was employed for kinematic data collection. IMUs can be placed in specific body locations, such as the player’s limbs, to obtain accurate information about their movement and orientation. 22 Fifteen Aktos-T IMUs were symmetrically placed on the head, arms, forearms, low and high trunk, thighs, calves and feet of the volleyball player, as displayed on Figure 1, then sampled at 142 Hz and transformed into joint angular positions using MobileBody®. 23 Two high-range WiFi IMU antennae were placed in opposite positions across a diagonal from the athlete to maximize the wireless communication required.
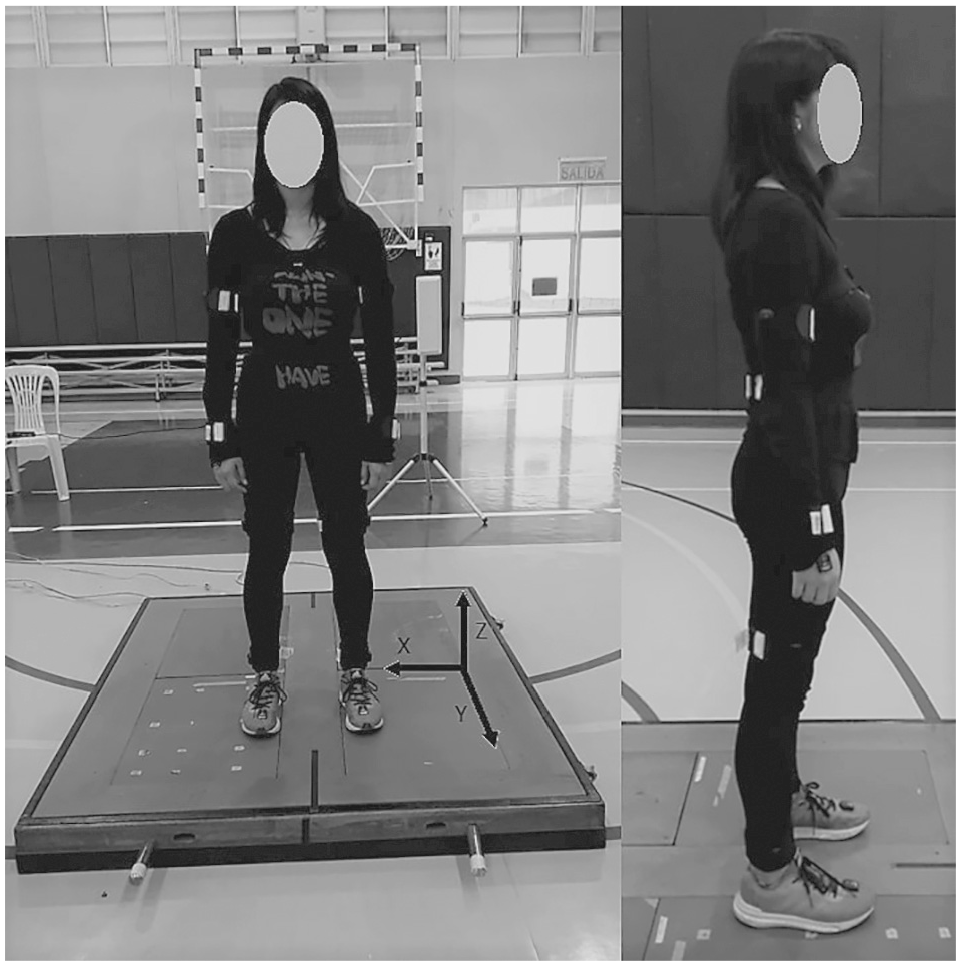
Inertial sensors’ locations on volleyball player’s body: IMU sensors on both feet, calves, thighs, arms, forearms; on both sides of the pelvis and the upper trunk; and on the forehead.
For external evaluation and also to complement the serve reception evaluation, a camera system was also employed. As such, during the test, two Panasonic HC-VX980, one Panasonic SDR-S26, one Panasonic SDR-H80, and one Canon VIXIA HF R400 recorded the frontal and sagittal views, feet, and rear views of the player, and ball movement, respectively. Sagittal and frontal views together with ball movement’s recordings were performed at 60 fps, while the feet and perspective recordings were performed at 30 fps. The approximate speed, height and angle of the ball were also indirectly measured using the Kinovea software. 24
The aforementioned devices, allow for kinematic calculations related to the volleyball player’s performance. However, when aiming to perform a dynamic analysis of human body movements, at least one force needs to be measured in all three dimensions.25,26 Force plates were employed to obtain ground reaction forces in an accurate and reliable way.27,28 Two AMTI OPT400600 force plates were located 270 mm from each other horizontally on a 1200 mm × 2000 mm × 100 mm portable wooden platform for the player to step on, 29 as seen on Figure 2. By placing the force plates on the wooden platform, we were able to transport the force plates to the volleyball court for the testing, even though the player’s displacement capability ended up restricted. The dimensions of the designed wooden platform were selected to give enough space for the volleyball player to cover while performing the aforementioned serve-reception. Force plate data was sampled at 1 kHz using the AMTI Netforce software, and amplified with a 14-bit, 2.9 N/bit analog to digital converter. It should be noted that the net height should also be raised to match the new floor height the athletes will use during the testing.
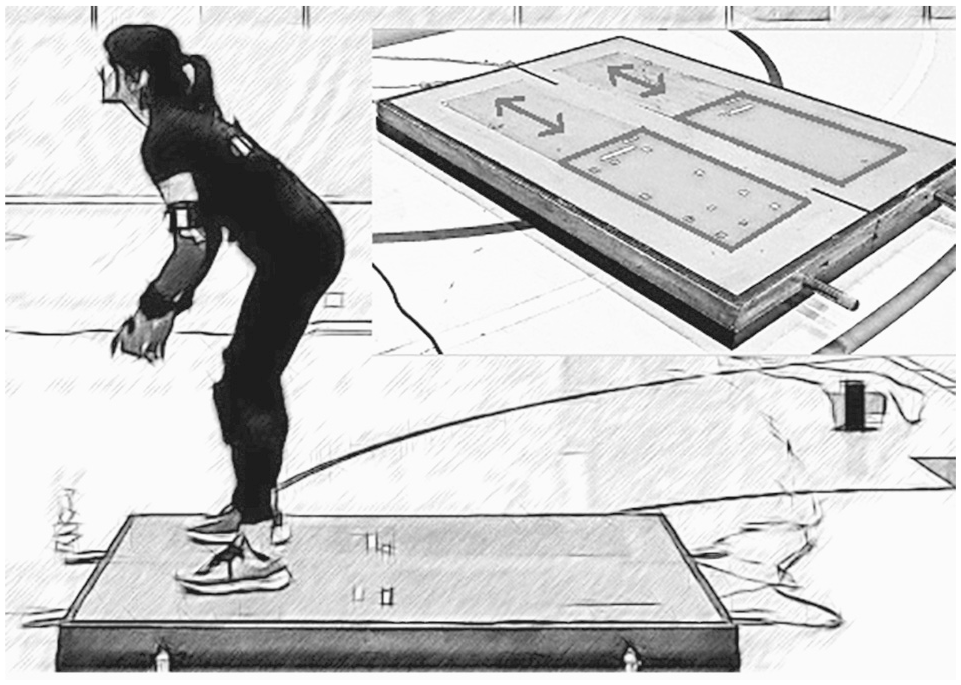
AMTI force plates installed on the portable wooden platform. The volleyball player has to step on the wooden platform during the testing.
An automatic ball launcher was developed to ensure high repetitiveness and accuracy when emulating ball service with little to no rotation, 30 see Figure 3. Official 26-cm diameter volleyball balls were launched with specific kinematic conditions: initial speed and launch angle. Launcher calibration was done 30 min before the beginning of the testing session, for example, with approximately an initial speed of 13 m/s, launch height of 157.5 cm and launch angle of 25.87°, the ball would reach a maximum height of 2.73 m and a landing speed of 7.5 m/s. The ball launcher was located on specific positions in the court to simulate real serve-actions, but also considering that approximately one second was needed between launch and contact for all sensors to accurately register the players’ performance.
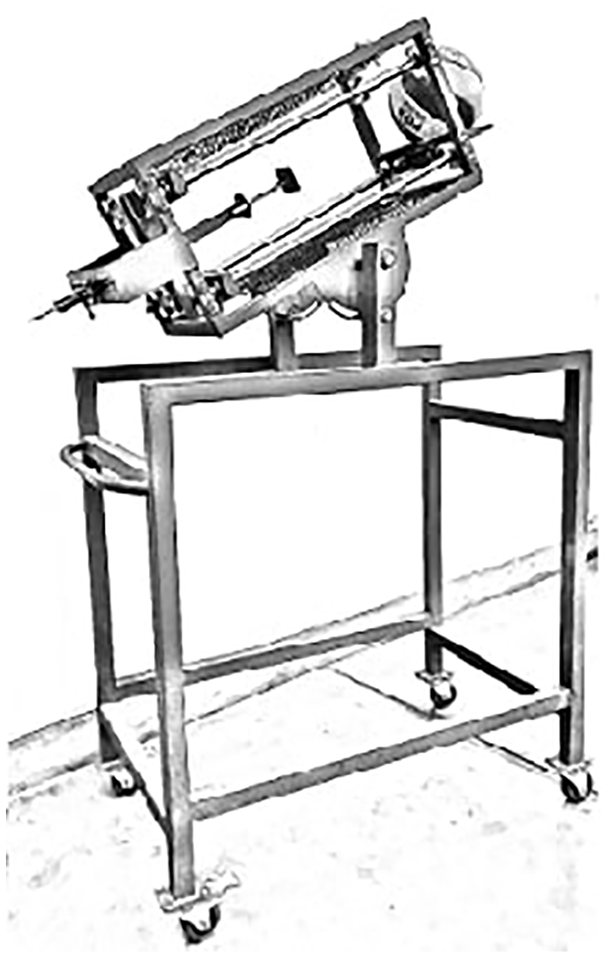
Automatic ball launcher built for testing in a volleyball court.
Methods
Tests were performed at PUCP Sports Center’s volleyball court, which allows for the server – represented by the automatic ball launcher – and the receiver to be on opposite sides, thus simulating the serve-reception gesture. The test setup in the court can be observed in Figure 4. The force plates were placed in zone 6 of the volleyball court, 4.67 m away from the center line. The ball launcher was placed on the other side of the court at zone 6. The sagittal camera was placed at the edge of the court, the frontal camera was placed behind the net, and the panoramic view camera was placed 20 m away from the court to record the full trial. The feet-view camera was located in zone 4, while the IMU antennae were placed in zones 2 and 5, pointing toward the player. Finally, the computer and IMU’s amplifier were set between zones 1 and 2, and the rear-view camera was located outside the court.
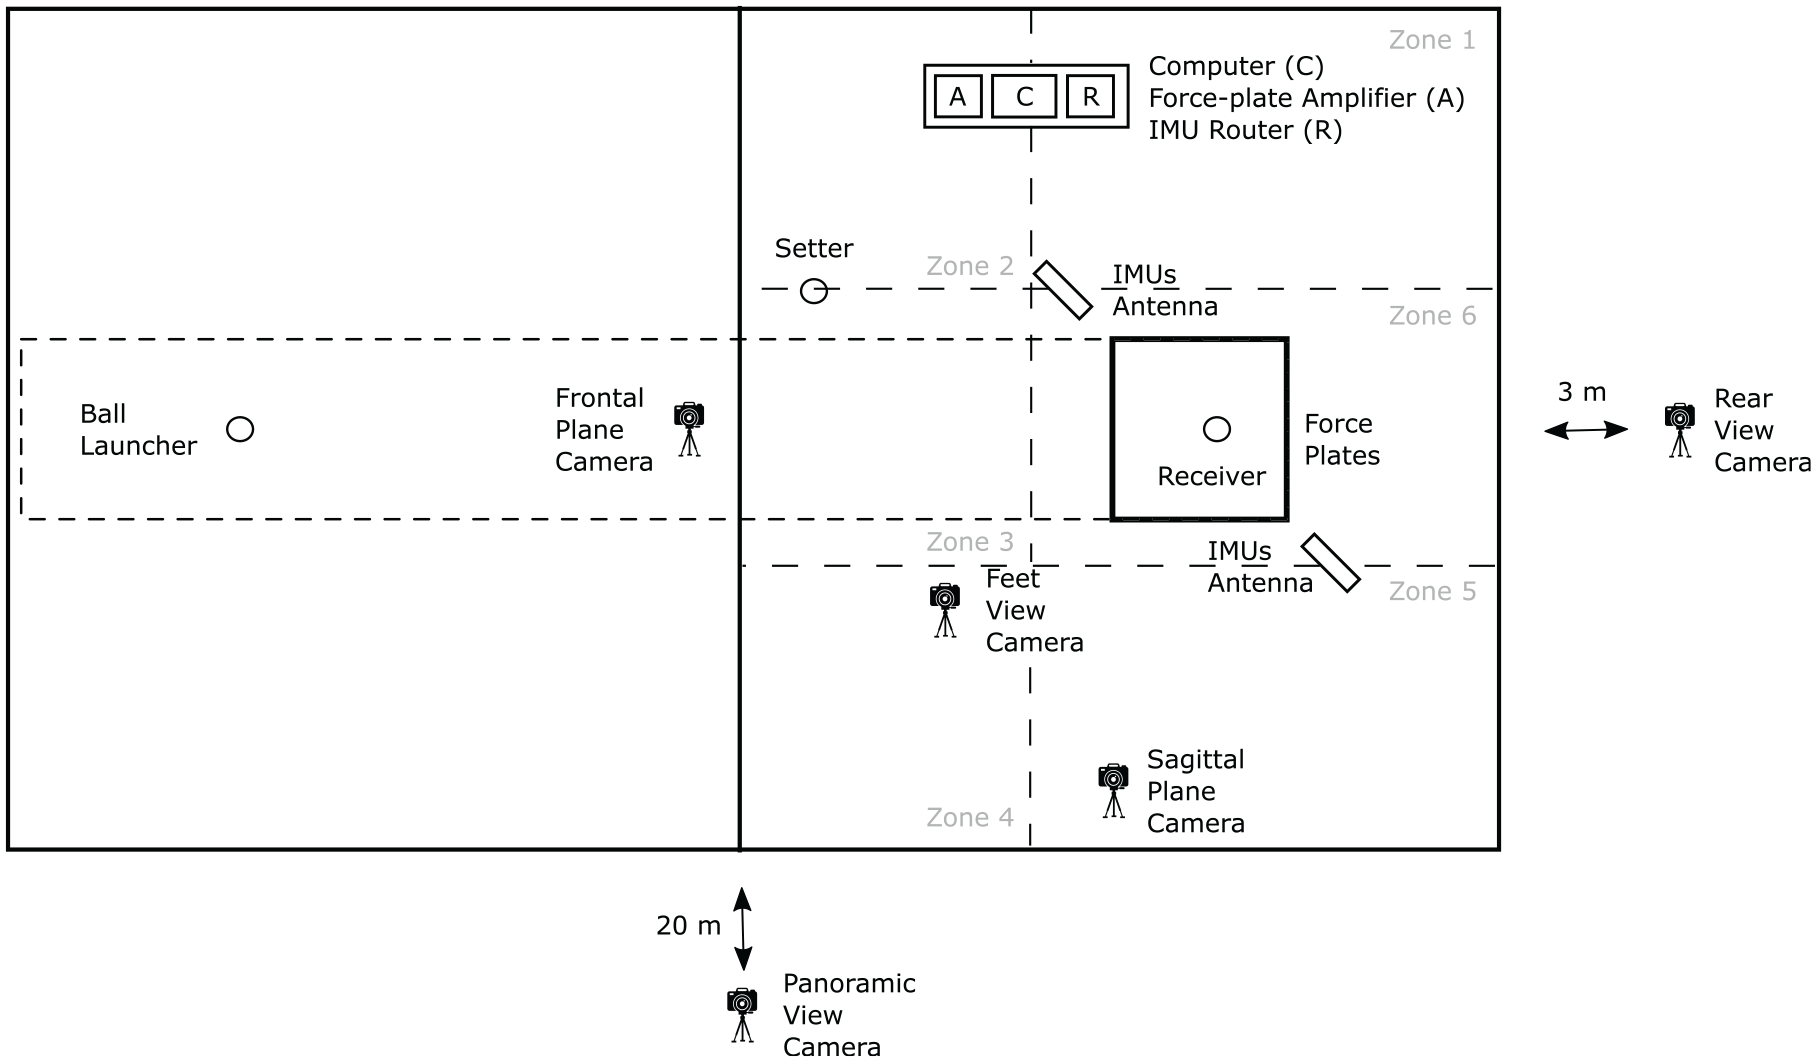
Motion capture system equipment setup: Location of IMUs’ antennae, force plates and cameras in the volleyball court at PUCP Sports Center.
Testing preparation begins when the anthropometric measurements of the player are taken and the data is entered into the IMU’s MobileBody® software. Following, an induction of the player is performed to immerse her with the measurement systems. All systems are then turned on. There is a 10-min underhand serve-reception warm up for the player, with no rest afterward. IMUs need to be calibrated before being placed on the player’s body: 15 IMUs are placed on the force plates platform for 20 s to set a global axis reference for each sensor and to align their y-axis with the platform’s y-axis. The 15 sensors are then placed on the player’s body (this takes approximately 3 min). In order to make sure that IMUs’ data conform with standard movements, the player is asked to stand on her fundamental position and start moving her limbs slowly. Once all the equipment had been correctly located, the data recording was initiated.
The player was then asked to step onto the wooden force platform – one foot on each plate, perform frontal underhand serve-reception for the ball sent by the launcher and pass it to where the referential setter position was located, between zones 2 and 3, see Figure 5. Performing this technique successfully allows completion of the K1 complex of a volleyball game, which determines the effective action to make a good attack and will be called a perfect reception 31 ; however, the success criteria for this test was to form a post-contact parabola with the ball before the straight-up setter hands touch it. The test is rendered invalid if the subject fails to send the ball toward the straight-up setter’s hands, or if they send it near the straight-down hands of the setter.
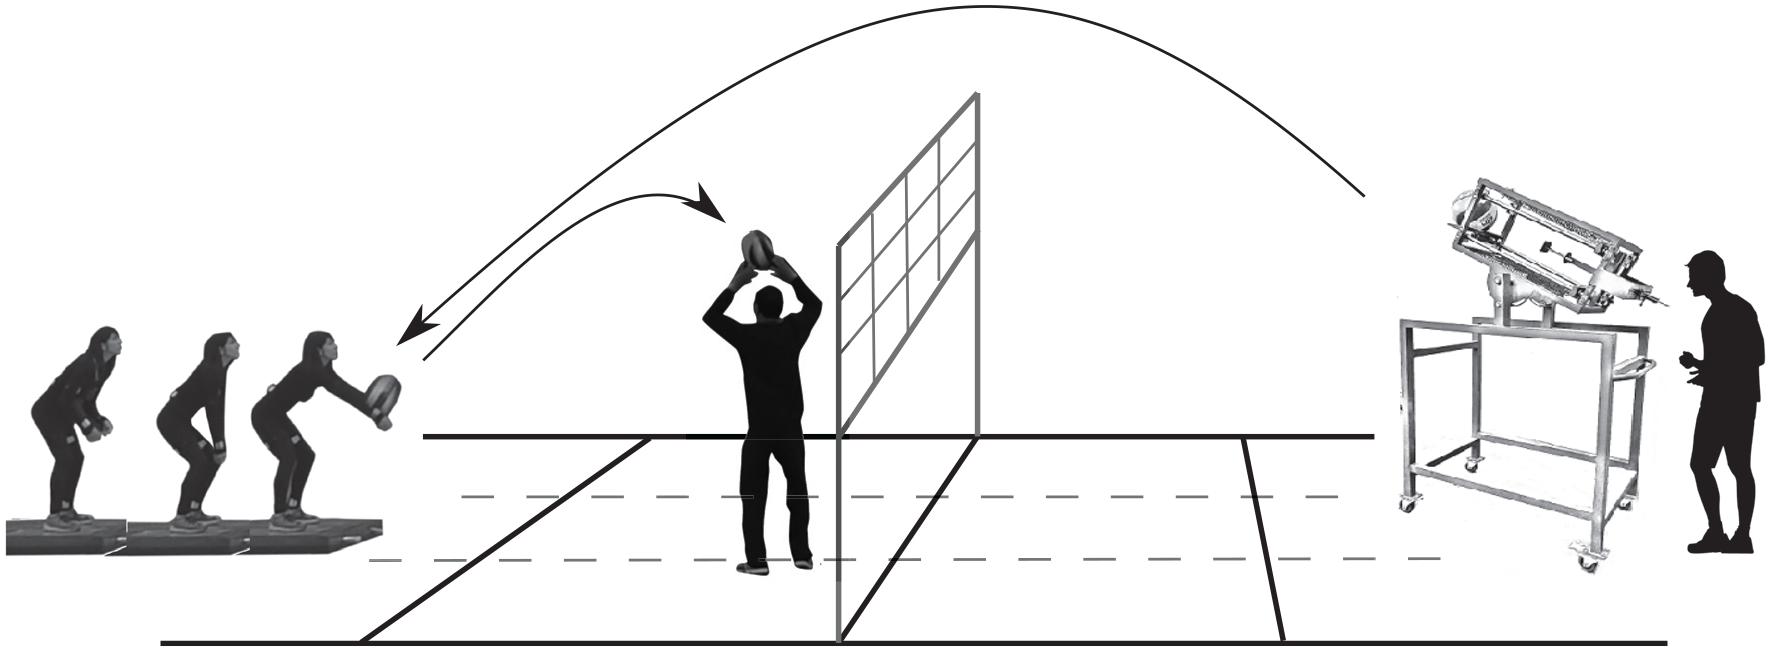
Test execution: Frontal underhand serve-reception with net in the volleyball court.
For multiple tests, the player should perform a minimum of five successful trials. These trials last approximately 20–30 s each, and the selected time frame for processing will have a length of approximately 4–5 s. The data is saved through MobileBody® and AMTI Netforce software, as the reception is executed. It must be noted that IMU wearable system calibration is necessary before each test, whenever the MobileBody® measurements appear to be inconsistent during the recordings, or any time the player leaves the platforms – to prevent fatigue due to repetitive test execution.
Reliability and validity of the test
To address the reliability and validity of the kinematic and dynamical data to be collected with the test, an evaluation was performed with the objective of: (a) estimating test-retest reliability of both knees’ and shoulders’ angles and normalized aggregate ground reaction forces during serve-reception; and (b) examining known-groups validity by comparing amateur players to professional controls; and (c) examining concurrent validity by comparing values to a serve-reception over real-life conditions.
Subjects
Six female volleyball players participated in the experiment: three amateur, ages 20.33 ± 3.51, heights 166 ± 7.55 cm, weights 59 ± 4.58 kg; and three professional, ages 23 ± 3.51, heights 160.67 ± 5.51 cm, weights 57 ± 4.58 kg. Height and weight measurements did not differ significantly for both groups (p < 0.05) and were consistent with anthropometric measurements for average elite players. 32 In addition, subjects did not present any injury, illness or have any history of surgery on their lower or upper limbs. After receiving a clear explanation of the study, each subject signed an informed consent document that stated the risks and benefits of participating. Testing was in accordance with and approved by the institutional ethics committee. Female players were preferred over male, because Peruvian female volleyball teams perform significantly better at international events than their male counterparts.
Data statistical analysis
To determine the reliability and validity of the test, the amateur and professional players completed the test four times: two runs of 10 underhand serve-reception trials in an open court without any equipment but the cameras (free tests), and two runs of 10 underhand serve-reception trials using the testing protocol. Any trial in which the serve-reception was poorly executed, the ball did not reach the player, or the IMUs required recalibration, was immediately discarded until reaching the desired amount of trials. Each session had its own 10-min match-specific warm-up period (which included jogging, stretching, and ball handling), and comprised of one free test run and one protocol test run. The two sessions were at least 2 h apart from each other, and their runs were not executed in any specific order. IMUs (142 Hz), force plates (1000 Hz), and cameras (30–60 Hz) data was collected simultaneously during the testing protocol runs.
Shoulder joint and knee joint angles, as well as normalized ground reaction forces were standardized using linear interpolation and down sampling to 100% serve-reception cycle: ball ejection to ball contact. The synchronization between IMUs, force plates and camera data points was performed using the changes in measurements when the player first stepped on the force plates after the IMUs calibration as a triggering event. The values for these variables were selected at the exact moment of ball contact for further processing.
To estimate test-retest reliability, intraclass correlations coefficients (ICC), standard errors of measurement (SEM) and relative SEM (%SEM) were calculated. To investigate known-groups validity, a comparison of amateur and professional groups is performed using independent t-tests and the effect size Cohen’s d, due to data not being normally distributed. To examine concurrent validity, Pearson correlation coefficients (PCC) were computed.
Results
Test-retest reliability
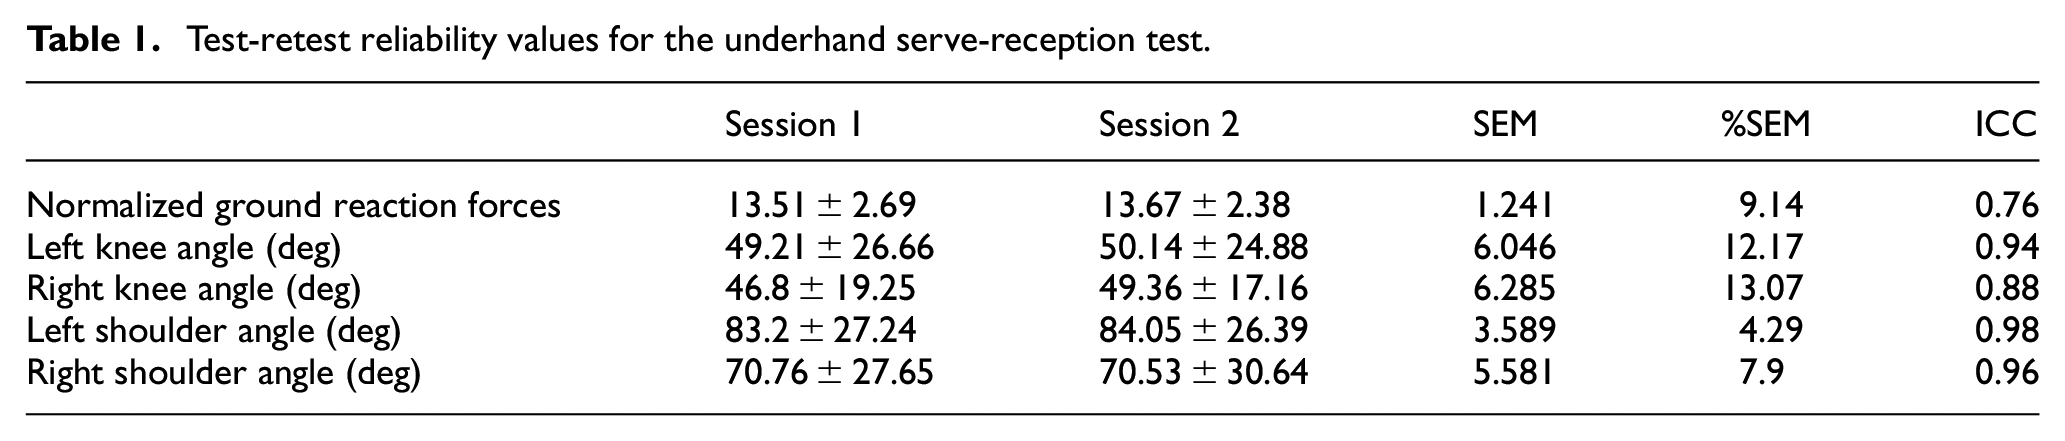
The reliability data of the shoulder joint angles, knee joint angles and resultant ground reaction forces are presented in Table 1. The test and retest measurements for both knee and shoulder angles are evidenced to be reliable (ICC > 0.85, 0.88–0.98, %SEM: 4.29–13.07), while the measurements for the normalized aggregate ground reaction force can only be considered as good (ICC ∈ (0.7, 0.85), 0.73, %SEM: 9.14). Figure 6 displays the average time series for the aforementioned variables, where very similar behaviors can be observed.
Test-retest reliability values for the underhand serve-reception test.
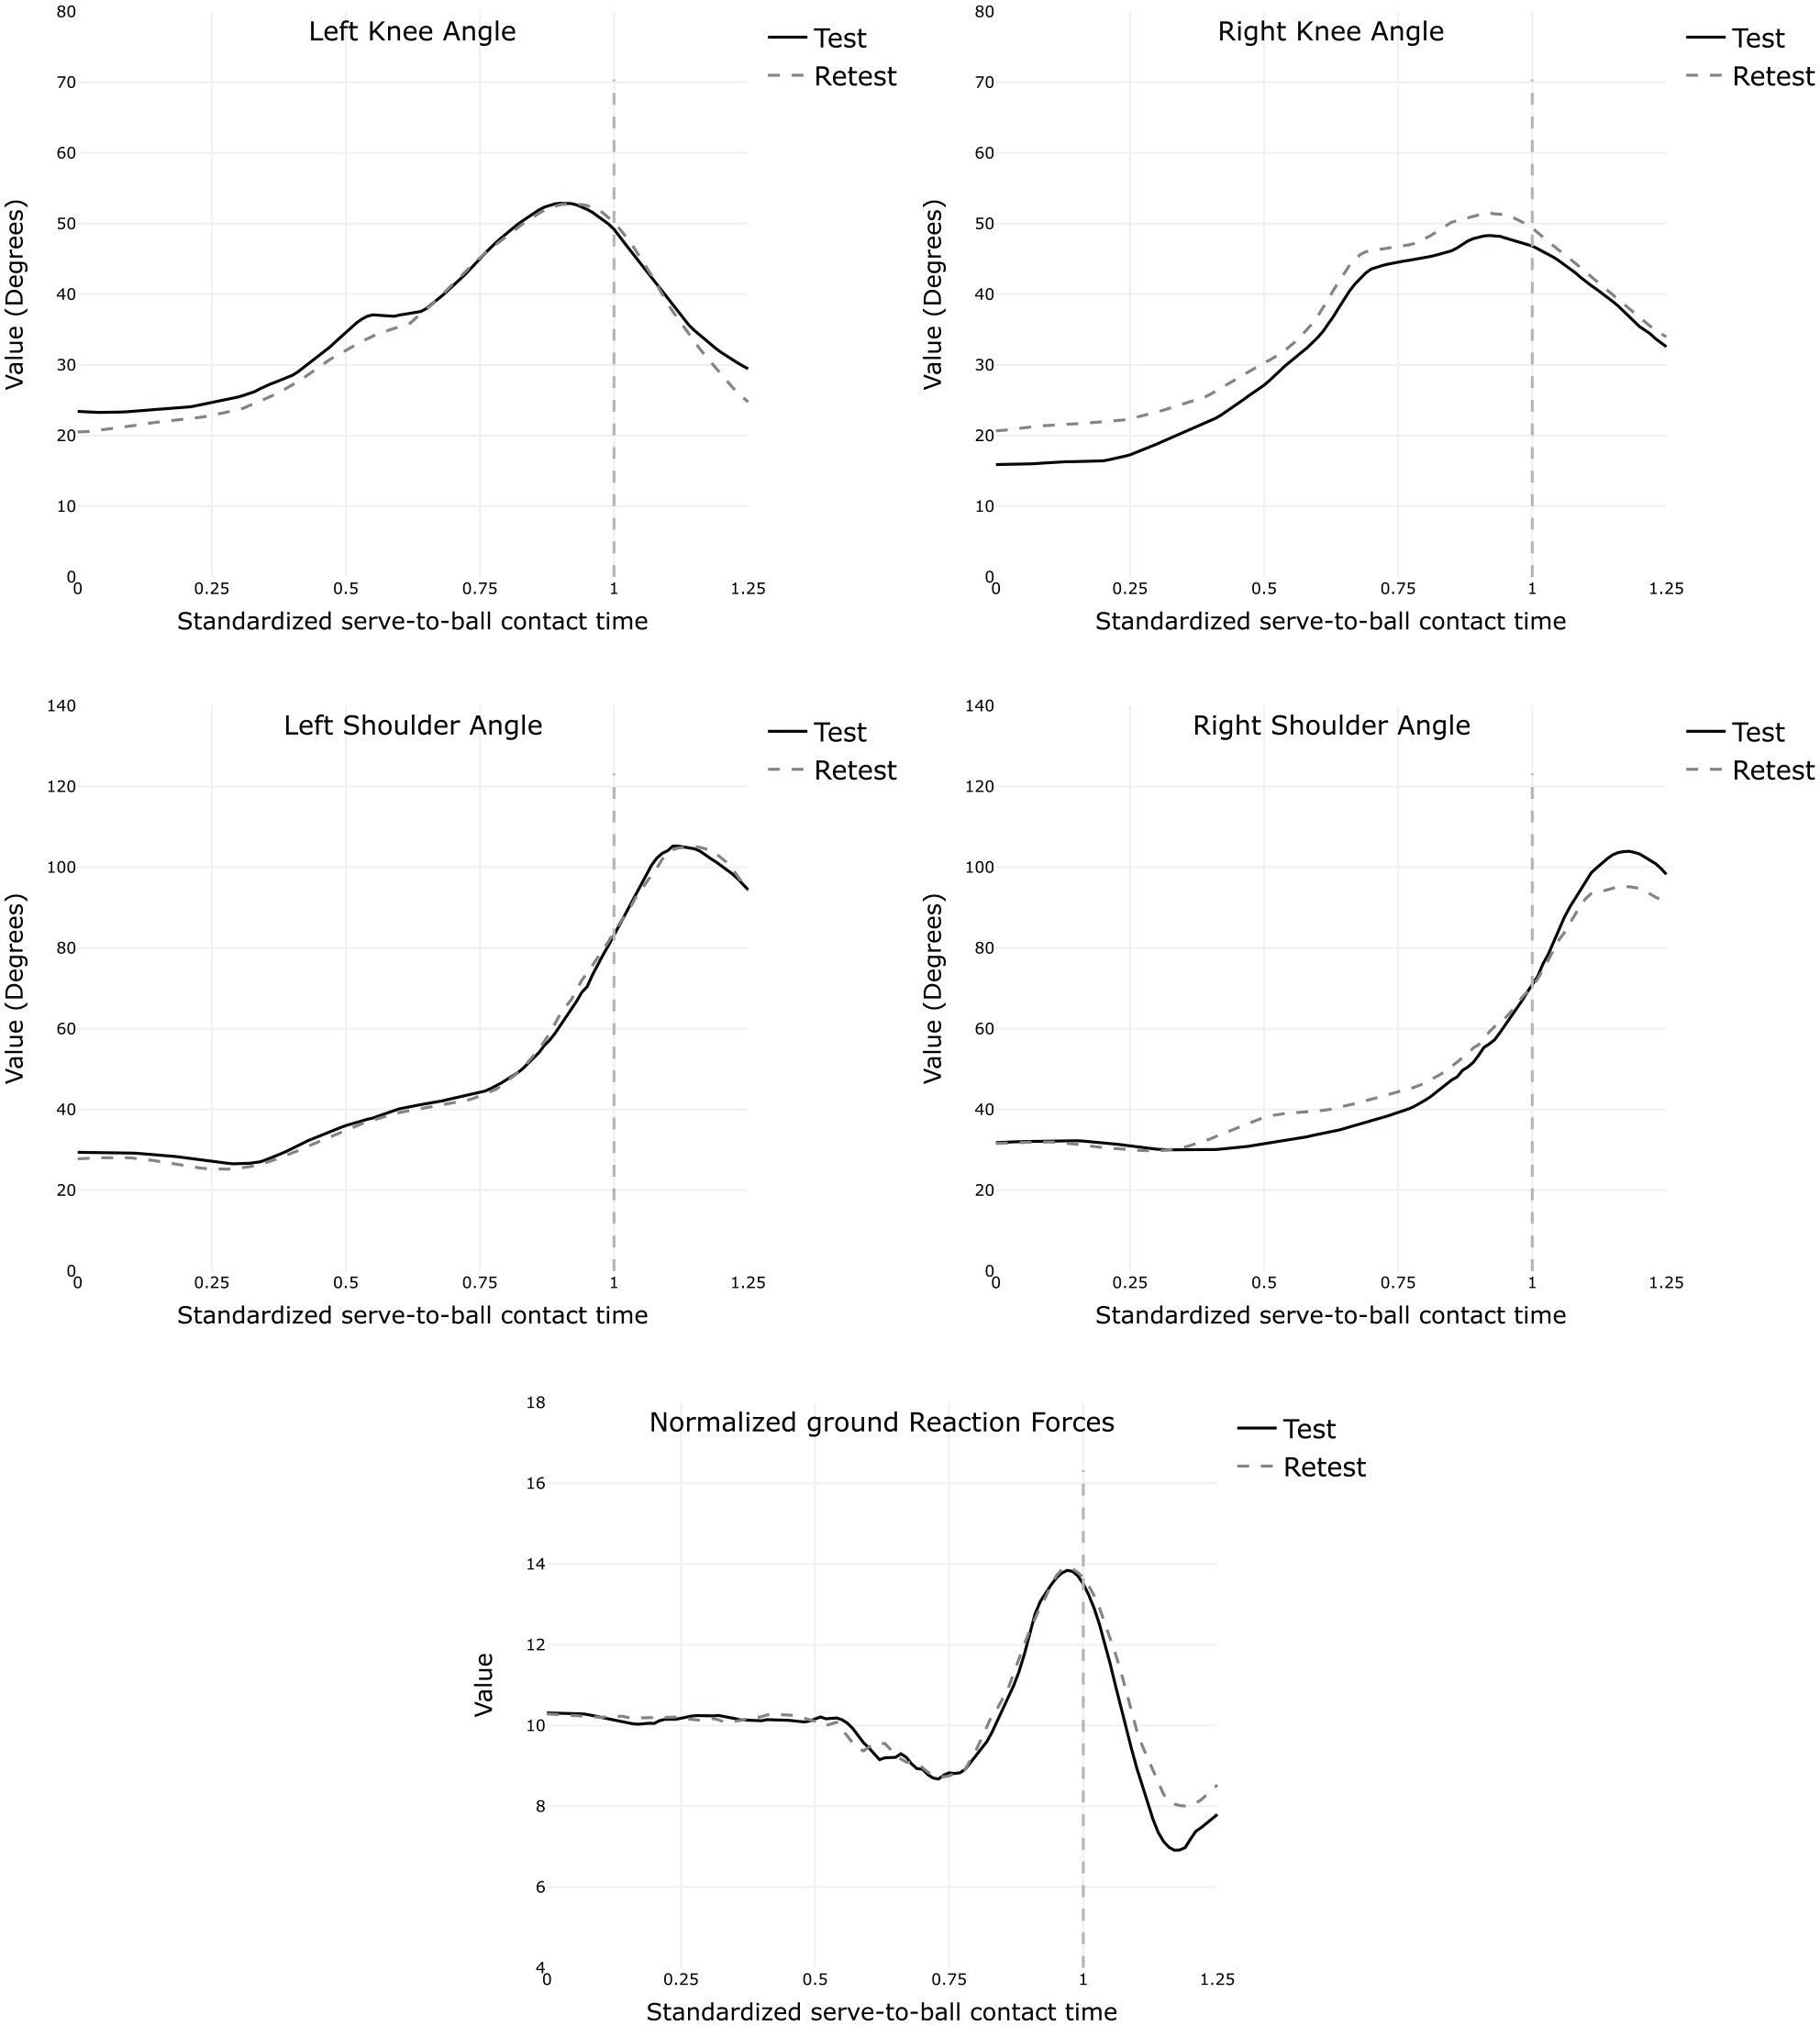
Average test-retest measurements for left knee, right knee, left shoulder, and right shoulder angles; and normalized ground reaction forces. Values were standardized from ball launch time (x = 0) to ball contact time (vertical dashed line at x = 1).
Known-group validity
Known-group validity was also evaluated using data of the shoulder joint angles, knee joint angles and resultant ground reaction forces; their distributions were compared using t-tests between the two athlete groups: professionals against amateur. Table 2 presents the p-values that indicate statistical significance, where it can be seen that the null hypothesis was rejected for both knees’ and shoulders’ angles and that it was not rejected for the resultant ground forces. Overall, the data collected by using the testing protocol was valid in discriminating between professional and amateur players with an effect size Cohen’s d statistics ranging between 0.11 and 7.66. The differences between the groups on knees and shoulder angles, and on ground reaction forces, are illustrated in Figure 7, with professional players flexing more the knees, keeping the passing-platform bisector almost parallel to the sagittal plane and having more variance on the ground reaction forces, in comparison to amateur players, at the vicinity of ball contact time.
Known-group validity for the professional versus amateur comparison.
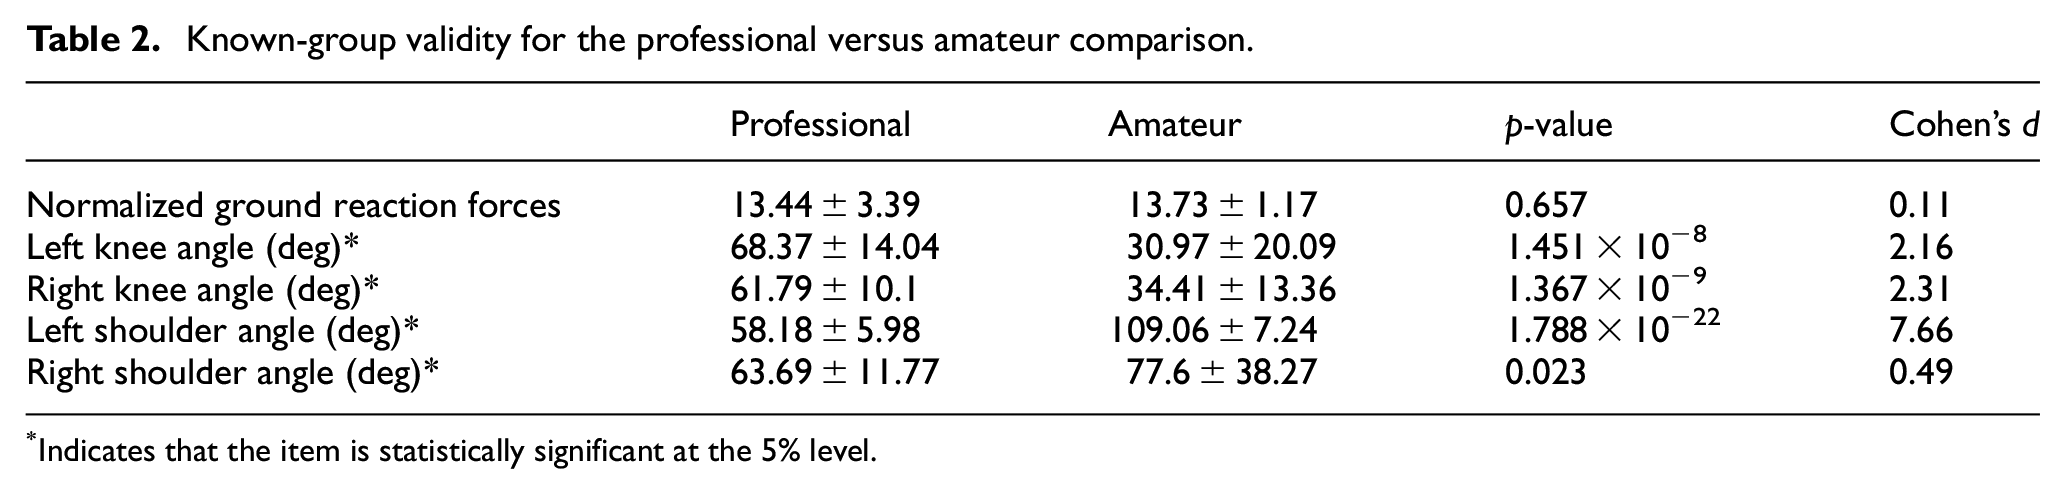
Indicates that the item is statistically significant at the 5% level.
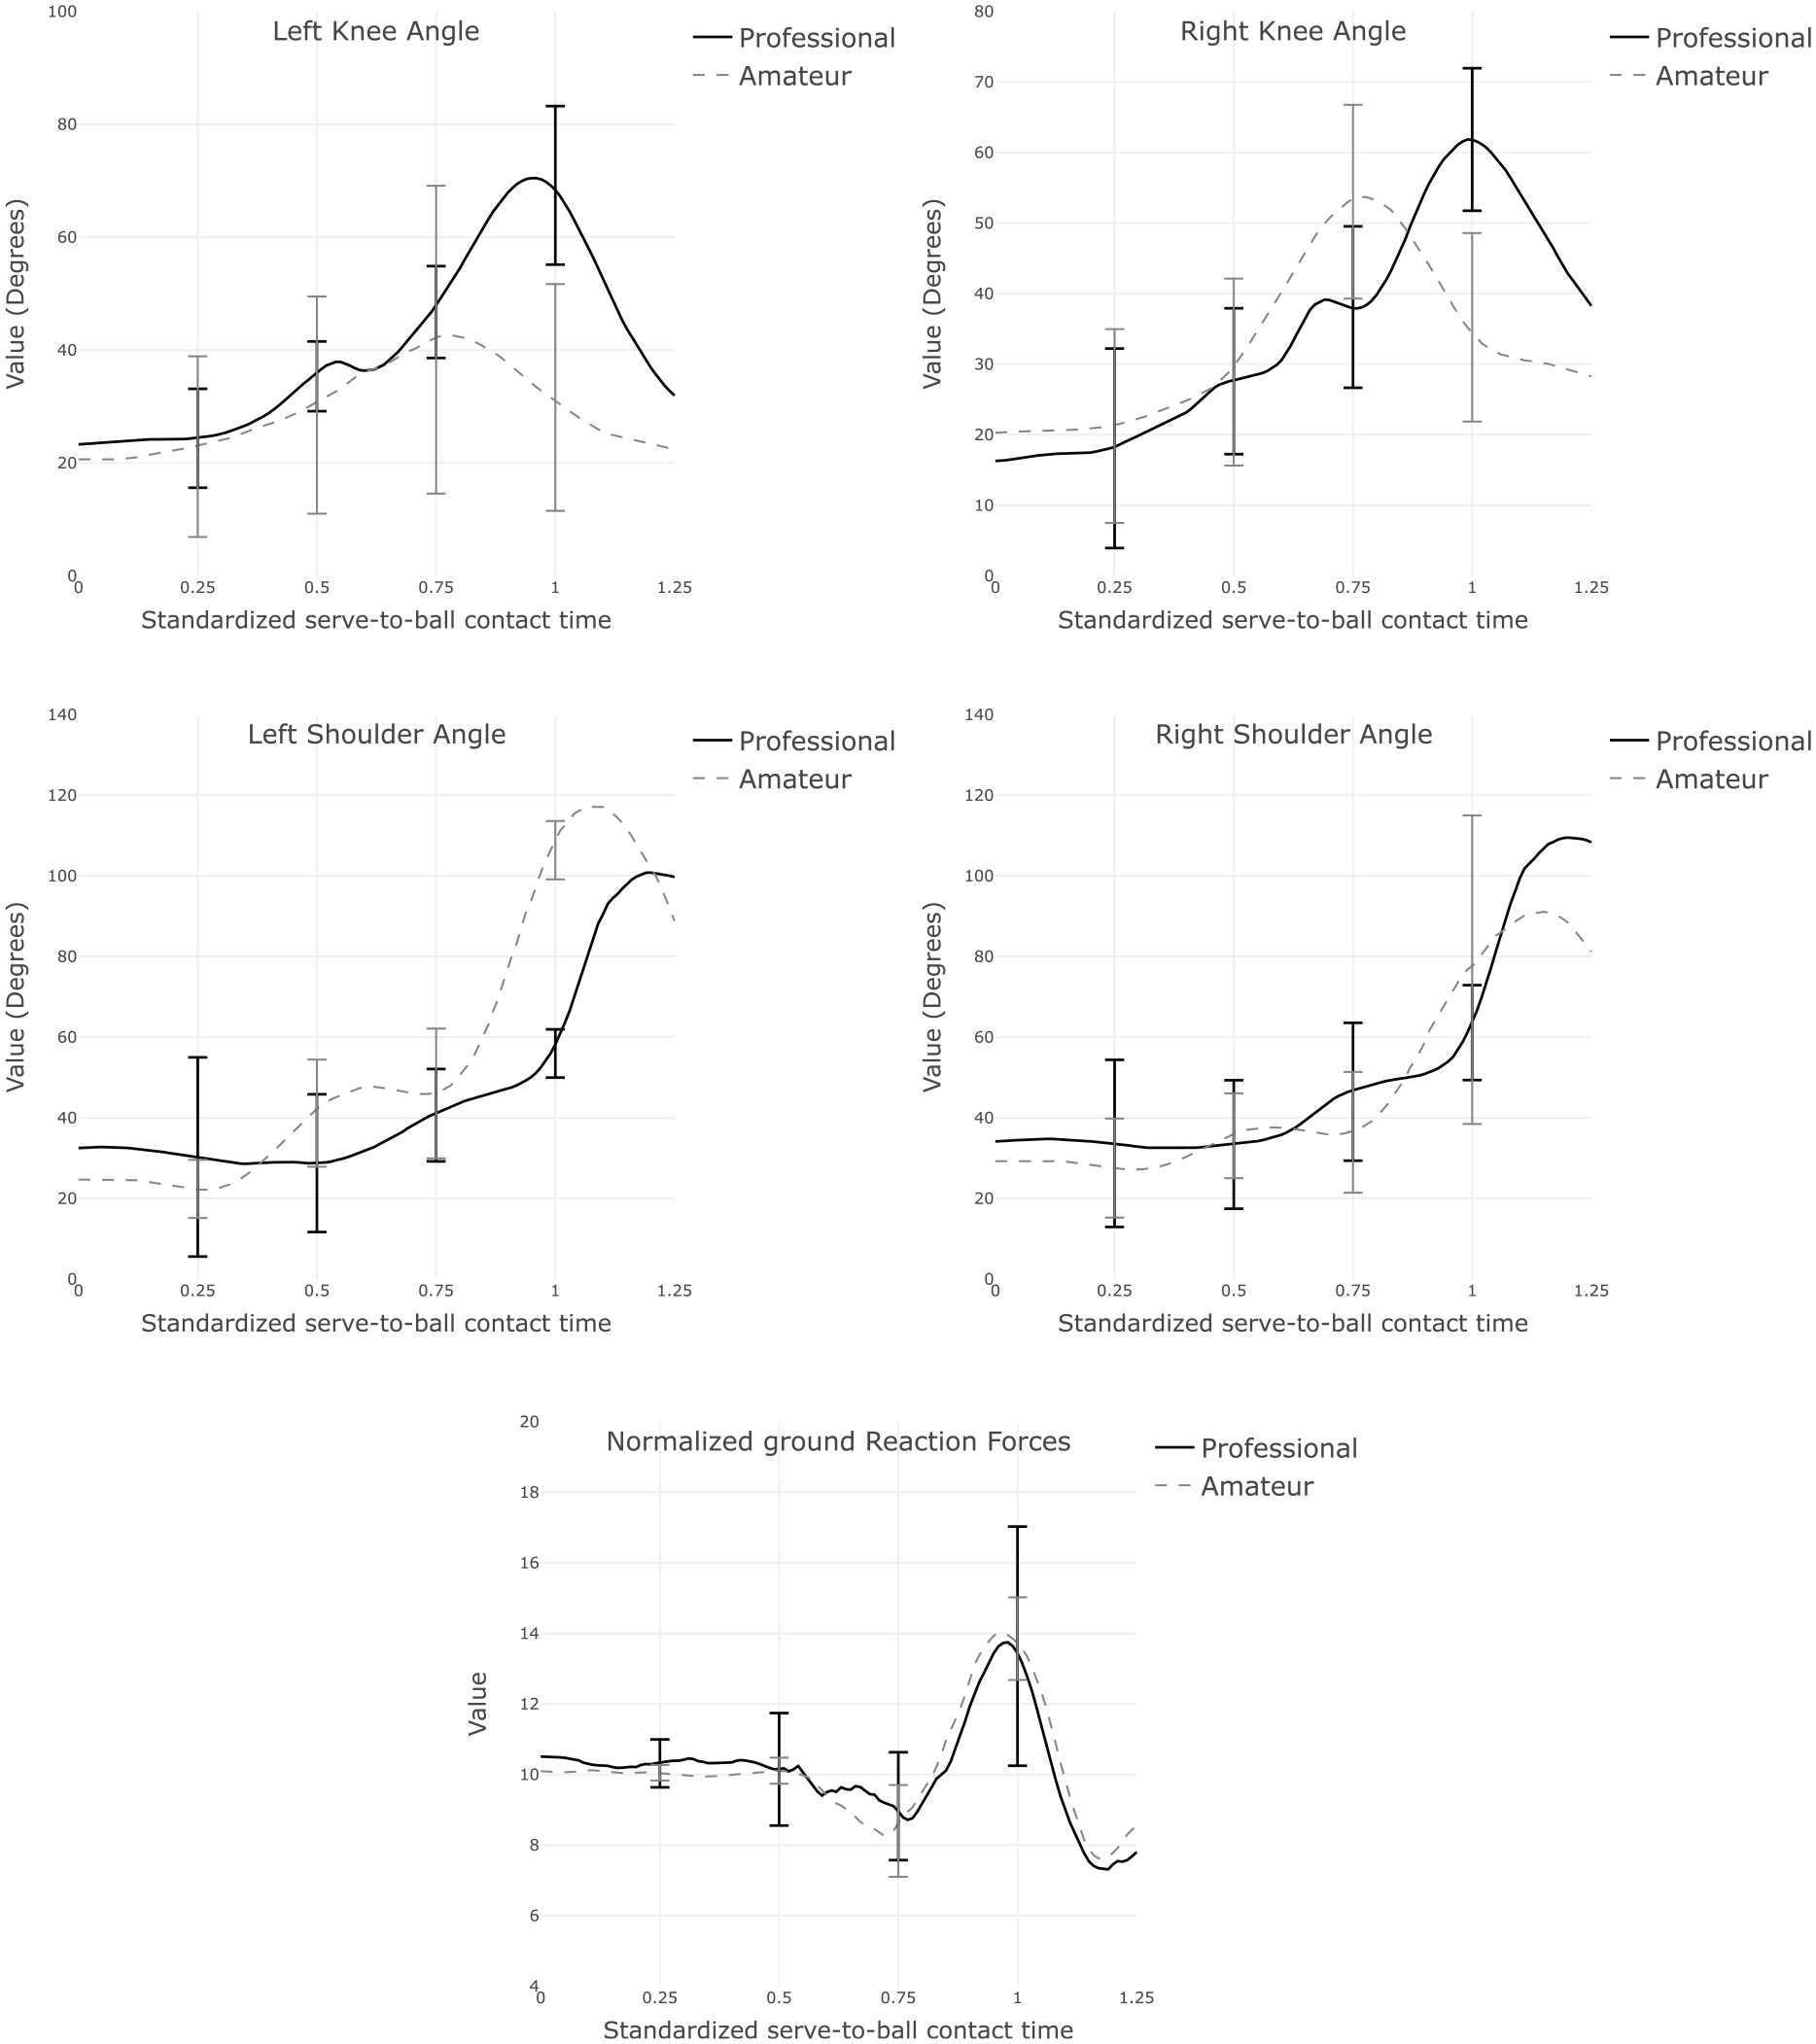
Average known-group measurements for left knee, right knee, left shoulder, and right shoulder angles; and normalized ground reaction forces. Values were standardized from ball launch time (x = 0) to ball contact time (x = 1).
Concurrent validity
The projections over the sagittal plane for two variables: left shoulder angle and left knee angle, were measured using Kinovea software on the videos recorded where the player received the ball without standing on the wooden platform and not wearing the IMUs. This information was then compared against corresponding testing protocol measurements through the Pearson correlation coefficient. Table 3 displays the PCCs and p-values for each player’s left knee angle and left shoulder angle, respectively. Both variables present strong correlation for the different types of data collection, left knee angle, PCC: 0.832–0.941, p < 0.05, and left shoulder angle, PCC: 0.792–0.941, p < 0.05.
Concurrent validity for left knee and left shoulder angles.
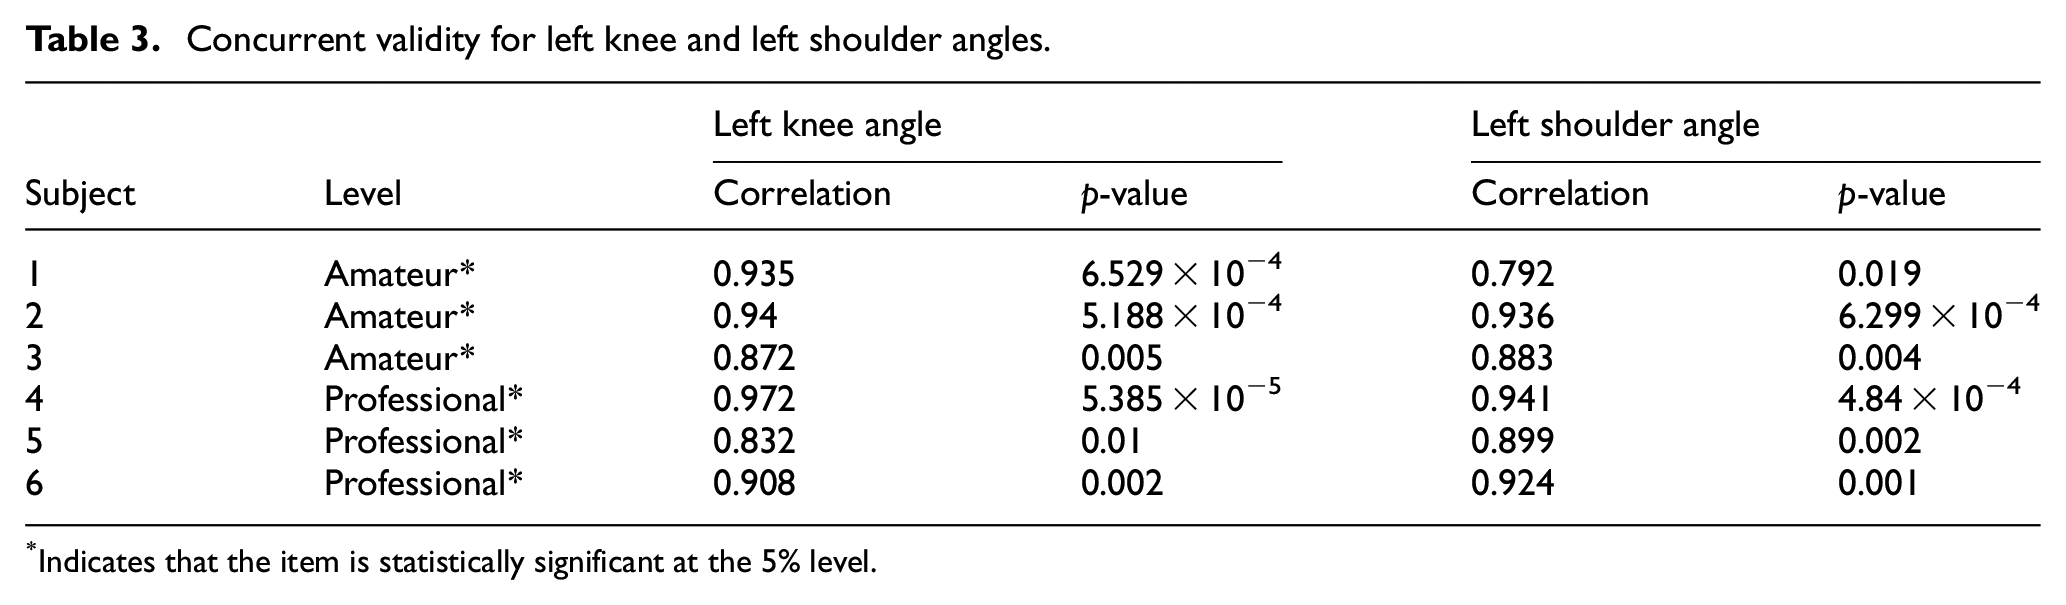
Indicates that the item is statistically significant at the 5% level.
Discussion and implications
In the current study, a testing protocol for underhand serve-reception biomechanics evaluation in volleyball was developed. The test involved using an automated ball launcher to simulate the service conditions, and also video cameras, IMUs, and force plates to record the athletes’ movements before, during and after the reception. The results of this study demonstrate that the developed testing protocol offers a reliable and valid method to obtain biomechanical serve-reception information of volleyball players. The results of this study are expected to remain statistically significant if any of the elements were to be replaced (e.g. if a smash service launcher was used – instead of the one described in the protocol – or different-brand IMUS, cameras, and force plates).
Test-retest reliability for the underhand serve-reception test was evaluated with athletes from amateur and professional levels as members of the same population. The scores for left and right knees and shoulders angles obtained at the ball contact time suggest that this protocol can be reliably used to measure said variables (ICC: 0.88–0.98). Ground reaction forces can only be considered acceptably reliable (ICC = 0.76), but this could vary depending on the athlete’s approach to the reception: initial position, timings, balance shifts, etc. The relatively low %SEM values – up to 13.07% – suggest good sensitivity of this protocol for detecting performance changes. Additionally, the obtained time series data appeared to be very similar for both test and retest measurements, which also suggests that any point in time could be used for reliability evaluation.
Known-group validity was assessed by evaluating the distributions for the shoulder joint angles, knee joint angles and resultant ground reaction forces between both amateur and professional groups. The results of this evaluation establish validity of the testing protocol herein presented, in that the professional athletes were able to repeat the reception with less variability and more sagittal symmetrical similarity on the left and right sides of their bodies when compared to amateur athletes, for all four angles considered (p < 0.05). Additionally, it could be seen that professional athletes placed the arm platform parallel to the floor during contact, while amateur athletes do not. For the ground reaction forces, a higher variance was observed in professional athletes’ measurements, but no statistical assumptions can be made. Cohen’s d values indicate that effect sizes are between small and medium for the right shoulder angles, but huge for the rest of the considered joint angles.
Concurrent validity was assessed by comparing two of the measured biomechanical variables: left shoulder and left knee angles, against their sagittal projections measured directly from Kinovea software. For amateur athletes, acceptable correlation values were obtained for the left shoulder (PCC: 0.792–0.936, p < 0.05), and good correlation values were obtained for the left knee (PCC: 0.872–0.94, p < 0.05). Professional athletes, on the other hand, obtained high correlation values for both left shoulder and left knee variable measurements (PCC: 0.899–0.941, and 0.832–0.972, respectively; p < 0.05 for both cases), evidencing that any changes in said variables would be similarly perceived by both measuring procedures.
Conclusion
The use of modern technology through both invasive and non-invasive methods is becoming more common to study and enhance athletes’ performance. Specifically, for volleyball, several physical and technical performance tests can be performed in both laboratory and match-like settings to assess, measure or compare different abilities.
The described testing protocol can be used with volleyball athletes, obtaining valid and reliable joint angle measurements and ground reaction forces that can be used in further biomechanical analysis. Joint flexion forces and moments can be calculated from ground reaction force measurements by using inverse dynamics, further increasing the data for underhand serve-reception evaluation, opportunity for improvement identification, or injury prevention. In addition, the biomechanical measurements could be used for a more in-depth qualitative and quantitative analysis of serve-reception phases of movement in order to determine factors that affect performance.
Footnotes
Acknowledgements
The authors acknowledge the Instituto Peruano del Deporte (IPD), Federacion Peruana de Voleibol (FPV), and PUCP Sports Center for their assistance with technical personnel and facilities.
Declaration of conflicting interests
The author(s) declared no potential conflicts of interest with respect to the research, authorship, and/or publication of this article.
Funding
The author(s) disclosed receipt of the following financial support for the research, authorship, and/or publication of this article: This work was supported by Funding Agency ProCiencia (Project Concytec – Banco Mundial) under contract numbers 206-2015-FONDECYT and 58-2018-FONDECYT-BM-IADT-AV.
Compliance with ethical standards
All procedures performed with the human subjects were in accordance with the ethical standards of the Comite de Etica de la Investigacion PUCP, Dictamen No 066-2017/CEI-PUCP. Additional informed consent was obtained from all the subjects for which identifying information is included in this article.