
Abstract
Korean teeterboard is one of the most physically and technically demanding circus disciplines. Two performers take turns jumping vertically and land with high impact. The aims of this study were to (1) compare the stiffness across three different teeterboards, and (2) compare Peak Landing Force (PLF) and Maximal Loading Rate (MLR) of four acrobats performing jumps from three teeterboards using four landing techniques (normal, smooth, straight legs, and empty board). Pressure sensors were used to determine recorded forces under the feet, while Boosted Regression Trees (BRT) was used to analyze factors contributing to PLF and MLR. Standard static loading protocol was used to estimate teeterboard stiffness. PLF and MLR increased with jump height. PLF and MLR were reached when landing on the teeterboard with the highest stiffness. The “normal” and “straight legs” landing techniques were associated with higher PLF and MLR. The BRT model was able to associate both PLF and MLR with jump height, participant, teeterboard, and landing technique factors. PLF reached 13.5 times the body weight when landing on the stiffer teeterboard using the straight legs technique. Trainers should be aware of the injury risk to teeterboard acrobats during landing.
Introduction
Korean teeterboard is part of the circus disciplines involving a piece of equipment and is an extremely physically and technically demanding circus act (Figure 1). Two performers take turns jumping vertically, performing complex acrobatic figures, and landing back on the apparatus.
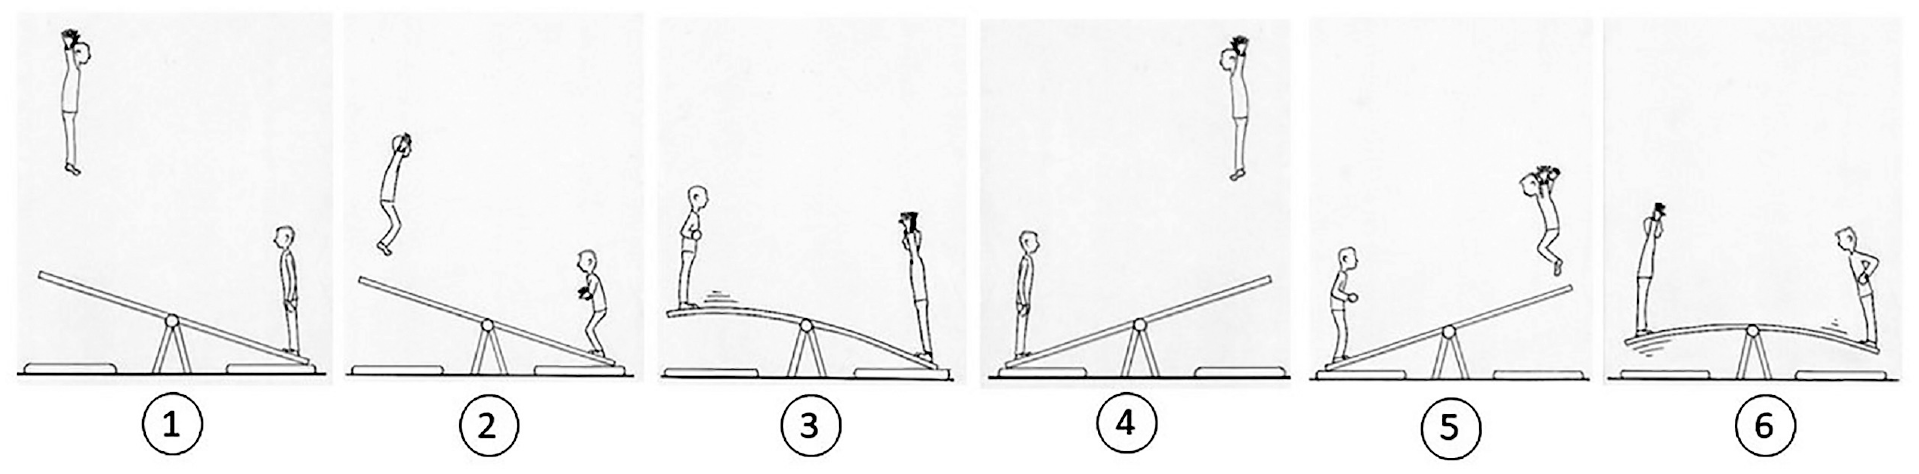
Sequence of movement in Korean teeterboard: (1) aerial phase for the acrobat on the left, ground phase for the acrobat on the right, (2) preparation for landing for the acrobat on the left, preparation for take-off for the acrobat on the right, (3) landing for the acrobat on the left, take-off for the acrobat on the right, (4) ground phase for the acrobat on the left, aerial phase for the acrobat on the right, (5) preparation for takeoff the acrobat on the left, preparation for landing for the acrobat on the right, and (6) take-off for the acrobat on the left, landing for the acrobat on the right.
The sequence of movements requires the first acrobat to land on one extremity of the apparatus, causing the teeterboard to rotate at the pivot point. The other acrobat is then propelled vertically as the teeterboard rotates. After take-off, the performer has to reach a position high enough to safely execute complex acrobatic figures and land back with precision on the teeterboard. A body translation at take-off can lead to a non-vertical trajectory, inaccurate landing, and potential injuries. 1
The most common teeterboard landing techniques are (1) maintaining straight legs or (2) using a flexed knee position at board contact, then pushing on the board and extending the knees to align the body for a vertical take-off. 2 In the circus field, the last technique, called the “normal” technique, is the most common and is similar to the trampoline. Trampolinists usually flex their legs during landing and extend their legs during take-off to be fully extended at the lowest point and capture the elastic energy of the trampoline.3,4 Researchers showed that a strategy to minimize landing impact is to produce a smooth landing through bending of the ankles, knees, and hips. When landing in basketball or volleyball, flexions of the lower extremities can reduce impact forces.5,6 The landing techniques in teeterboard are much more complex than in other sports because of the equipment used and the synchronization between partners.
The teeterboard is generally made of an ash wood assembly providing flexibility and is able to store elastic energy and then transfer it to the other acrobat just before take-off. The mechanism is similar to springboards in diving,7,8 except the diver regains the elastic energy to themselves. During a take-off, divers depress the board so that the springboard returns the elastic energy through a recoil effect to the divers to make them fly. In diving boards, stiffness is adjustable by means of a movable fulcrum. Previous research showed a very strong (r = 0.90) relationship between the vertical velocity at take-off and the board stiffness in senior elite divers. 9 The influence of damping was found to be negligible. 8 For Korean teeterboard construction, there is no standardization in the design. 2 Acrobats, circus schools or companies can personalize the design to their wishes. While it is possible to find performances without the use of a mat, these days it is typical to have a mat under both ends of the teeterboard to reduce the impact with the ground. The European Federation of Professional Circus Schools (FEDEC) 2 recommends a low stiffness board for novice acrobats because the load transfer is known to be smoother. From an engineering point of view, many factors can influence the teeterboard mechanical behavior. These parameters include, but are not limited to, stiffness, material, length and width, wear, humidity, height of the pivot point, and board angle. The teeterboard parameters, such as stiffness, cannot be modified like in diving boards. However, the length of the teeterboard can vary from 2.4 to 4 m and the height of the pivot can vary from 30 cm to 70 cm2. No information is reported in the literature on teeterboard thickness and associated stiffness.
Ground reaction forces can be captured by force platforms 10 or estimated through pressure sensors 11 placed under the feet. In the past, researchers have investigated drop landing and compared ground reaction forces between competitive gymnasts and recreational athletes, 10 landing heights,12,13 different landing surfaces, 14 and back somersault landings. 15 However, there are no data available on ground/teeterboard reaction forces and how these forces relate to mechanical characteristics.
The landing phase is associated with many injuries in gymnastics, 16 volleyball, 17 and basketball 3 and the same association can be made with the Korean teeterboard.1,18 Landing on an empty teeterboard is probably the most precarious situation. 2 It happens when one of the acrobats is not able to step back on the board and the other acrobat is landing on an “empty board,” also called “dead board.” It has been shown that excessive ground reaction forces during landing may result in lower extremity injuries in jumping sports,19,20 while Maximal Loading Rate (MLR) has been related to stress fractures in the lower extremities during running.21,22 While significant greater landing forces were experienced by gymnasts in trampoline 11 and back somersault landings, 15 no studies have been published regarding impact forces in Korean teeterboards acrobats. According to FEDEC guidelines, 2 the performers should have an adequate level of acrobatic skills (e.g. trampoline) before starting to jump on a Korean teeterboard.
To date, the influence of jump heights, participants, landing techniques, and teeterboard characteristics have never been studied on Peak Landing Forces (PLF) and MLR during teeterboard landing. The authors hypothesized that higher jumps, stiffer teeterboards, and less compliant technique will produce larger forces and loading rates. Therefore, the goals of the present study were twofold: (1) to compare the stiffness across three different teeterboards, and (2) to compare PLF and MLR in four acrobats performing jumps from three different teeterboards using four different landing techniques.
Methods
Participants
Four male professional acrobats in Korean teeterboard were recruited for this study. Local ethical committee previously approved the experiment and the subjects signed informed consent agreements. A questionnaire was completed by each participant to quantify their experience with Korean teeterboard and report their usual landing technique. The acrobats were 22.8 ± 2.6 years old with a body mass of 73.5 ± 5.4 kg, a height of 173.8 ± 4.0 cm, and 6.3 ± 4.1 years of experience with Korean teeterboard. The first duo was composed of participant #1 (65 kg) and #3 (77 kg), while participant #2 (79 kg) and #4 (73 kg) formed the second pair.
Korean teeterboard
Three different Korean teeterboards were selected from Cirque du Soleil (CDS), Machine de Cirque (MDC) and École Nationale de Cirque (ENC). All teeterboards were made of the same ash wood assembly and foam sheet (Flexi-Roll mat, thickness: 2.5 cm) that covered the top of the board. Korean teeterboard geometrical and mechanical characteristics are presented in Figure 2. The stiffness of each board was measured with a standard static loading protocol. 5 Weightlifting disks, previously weighed, provided incremental loads between 10 and 230 kg. The disks were placed approximately at the middle of the acrobat’s feet on one end of the board, while the other end was fixed. The distance of the disk center to the board tip was 15 cm. The vertical position of the board tip under each added load was measured after waiting for the board to become stationary. It was determined by reading a meter stick secured to a vertical pole at the side of the board tip. The level of accuracy was ±1 mm. Two trials were carried out for each added load. Both tests provided the same result. The stiffness was evaluated from Hooke’s law.
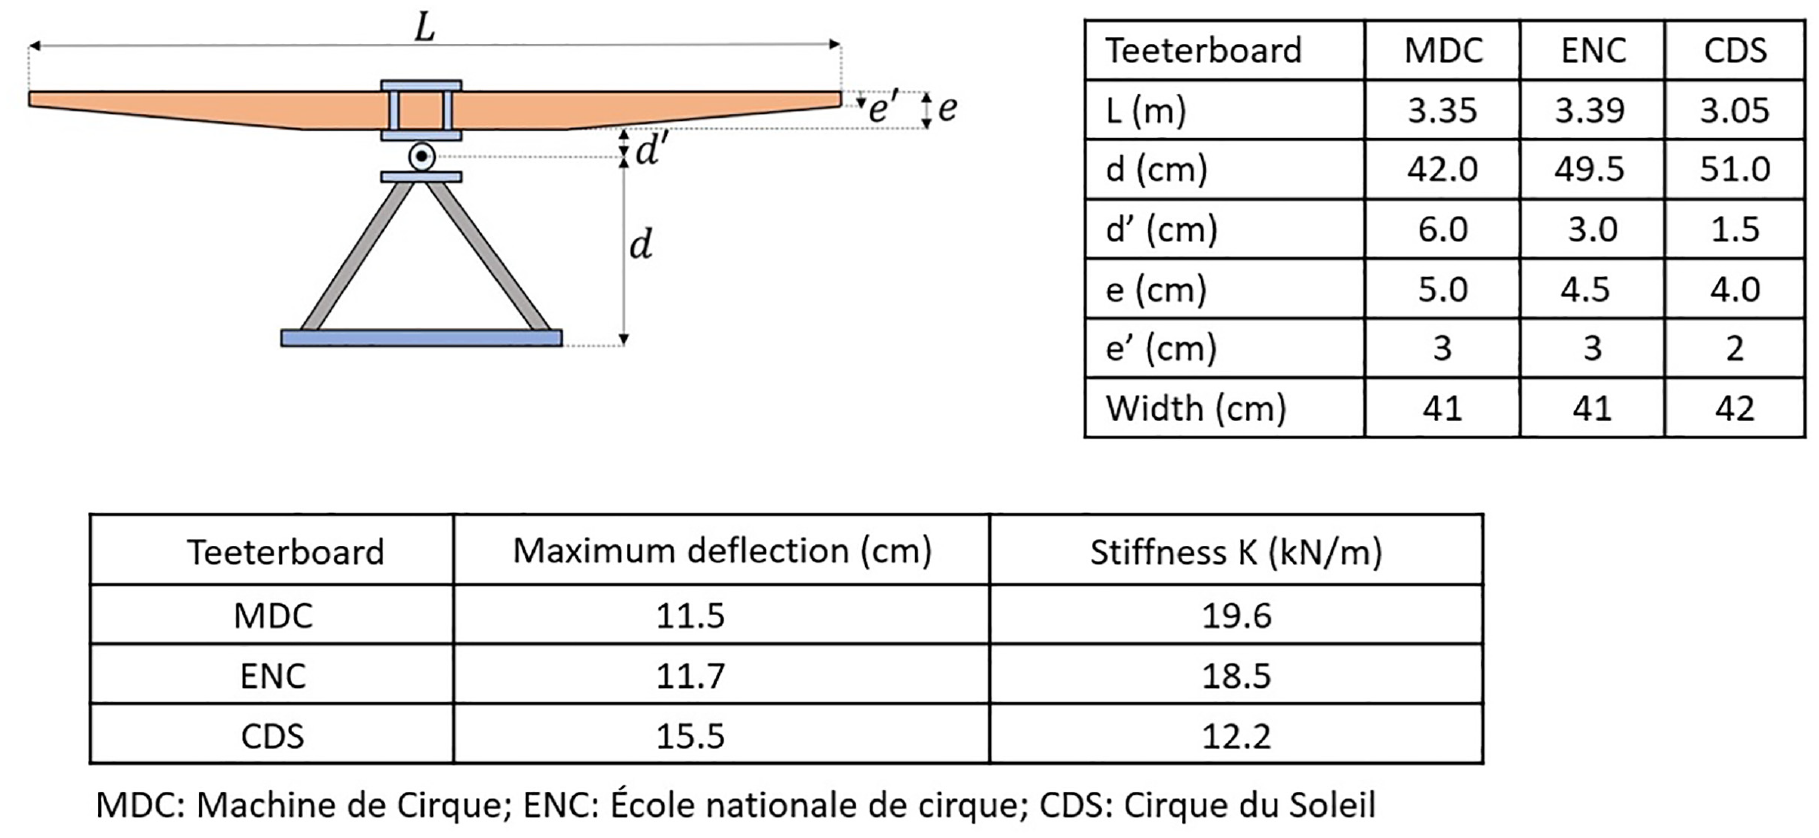
Korean teeterboard geometrical and mechanical characteristics for Cirque du Soleil (CDS), École nationale de cirque (ENC), and Machine de cirque (MDC).
Data collection
F-scan pressure measurement insoles (Tekscan Inc., Boston, Massachusetts, USA) were used under each foot in order to record pressure distribution with a sampling rate of 750 Hz. The forces were estimated by the software provided by Tekscan and expressed in Newtons and then normalized to bodyweight (BW).
A motion capture system (Naturalpoint: OptiTrack FLEX13 cameras, Oregon, USA), comprised of 10 infrared cameras, was utilized to collect the jump height of a marker located on the sternum at 30 Hz. The marker on the sternum was recorded throughout the whole performance (take-off, flight, and landing). Cameras were located 6.5 m high, covering an area of 4.5 m × 3 m.
Before recording data, the participants completed a normal warm-up. After the installation of the marker on the sternum and the pressure insoles in both shoes, calibration was carried out according to the manufacturer guidelines using the step calibration. The participants wore their regular shoes (i.e. boxing shoes with thin soles), which allowed them to feel the contact with the board and the high mountings stabilized the ankle joint. Then, the acrobats were asked to perform regular jumps on each of the three teeterboards using four different landing techniques (normal, smooth, straight legs, and empty board). Three landing techniques were repeated with between 35 and 45 jumps for the normal technique, 10–15 jumps for the straight legs technique and 10–15 jumps for the smooth technique for each acrobat. The acrobats shouted which landing technique they were performing, either the smooth or straight legs technique, and the rest were the normal technique. A coach specialized in Korean teeterboard told which jumps to keep, and advised and gave the acrobats feedback between the series of jumps on the quality of the jumps. The coach was a former gymnast and acrobat with more than 23 years of experience teaching the teeterboard. For safety reasons, only five trials were recorded with an “empty board” and these data were used as an extreme condition comparison. The “normal” landing technique requires the acrobat to flex the knees and hips before landing and push down on the board. The “smooth” landing consists of only keeping the knee and hips flexed before impact, whereas the “straight legs” technique consists of maintaining straight legs and hips prior to and during landing. In a smooth landing, the acrobat continues to flex his legs during the rotation of the teeterboard, until the board touches the mat, so that he ends with the knees in a flexed position. In normal landing, the acrobat extends his legs just after the first contact with the board, at the same time as the teeterboard rotates. The same 20 cm high mat was used for all tests (Spieth Andersen, Ontario, Canada). The participants could take as much time to rest between series of jumps. All jumps were video recorded for quality control of movements.
Peak landing force, loading rate, and jump height calculation
The Peak Landing Force (PLF), normalized to BW, were extracted from the force time profile (Figure 3) during each landing. PLF is commonly called impact/passive peak. 21 Video analysis confirmed that all acrobats landed with flat foot or slightly on the heel and PLF was reached within 8–13 ms. The teeterboard angle favors this landing foot position. Maximum Loading Rate (MLR), expressed in BW/s, is a variable describing the rate of the force transmitted from the board to the body and has been widely used to characterize impact absorption. 21 MLR is defined as the maximum slope between three force samples from foot/teeterboard contact to PLF. Every MLR was calculated with the three-point approach between the first contact and PLF, and the maximum value was used.
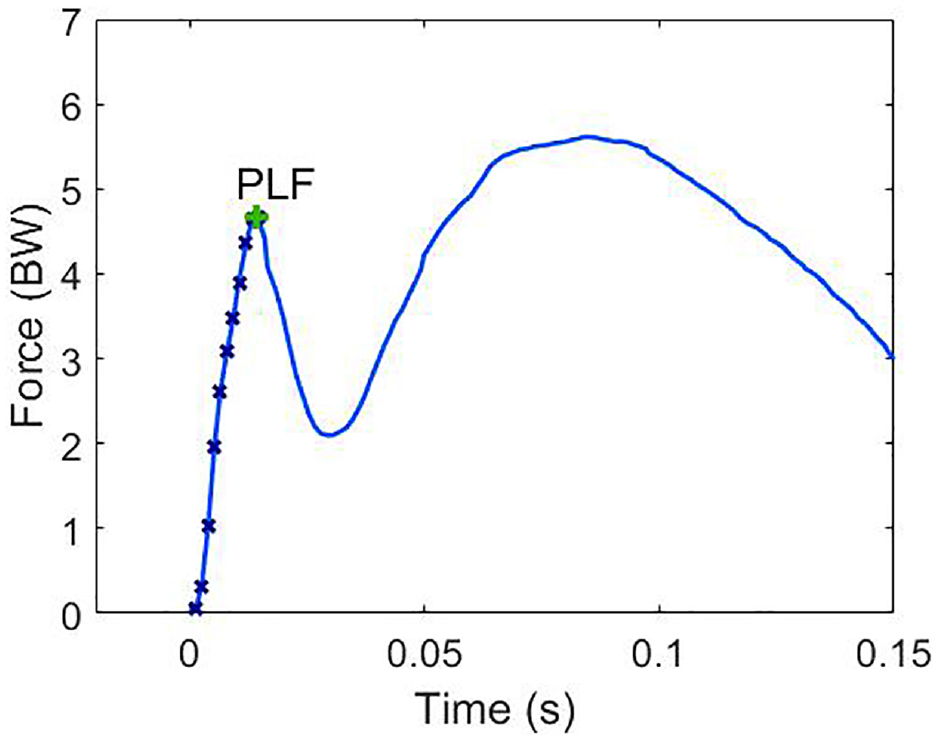
Example of force-time profile from a trial of participant #3 during landing with normal technique. PLF is the first peak force (expressed in BW). Maximum loading rate expressed in BW/s, was calculated as the maximum slope between three force samples between contact (time = 0) and PLF.
Kinematic data were smoothed with cubic spline. The vertical jump height was calculated from the vertical position of the sternum by subtracting the value of the acrobat standing upright on the teeterboard (on the mat) from the maximum height value. The speed was zero at the position from the ground on the mat and at the maximum height.
PLF and MLR were categorized by participants, teeterboards, and landing techniques. The quality of the jumps used for analysis were confirmed by the video recording. A total of 288 jumps were analyzed for PLF and MLR.
Statistical/machine learning analysis
The authors hypothesized that key factors, such as participants, teeterboard models and landing techniques, can influence both PLF and MLR values during landing. Because the distribution of the data was not normal (Sharpiro–Wilk test p < 0.01), the Boosted Regression Trees (BRT), 23 a statistical approach based on machine learning, was used. BRT have shown to be an effective method to identify relationships among various factors in several fields of research. 24
The BRT model quantified the influence (% of deviance) of different factors on output variables. Deviance measures how much the predicted values differs from the observations and represents the loss in predictive performance due to a suboptimal model. Percentage deviance explained, or pseudo R2, was calculated as:
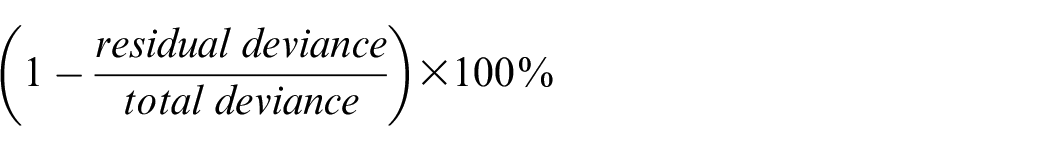
Pseudo R2 values should approach 100% when predictive performance is maximized. 17 Higher numbers indicate a stronger influence on the response variables. The BRT model was used to examine the specific contribution of the four participants, three landing techniques (normal, smooth, and straight legs) and three teeterboard models (CDS, MDC, and ENC). Due to the small number of samples, data for the “empty board” landing technique is presented as an extreme landing condition and therefore is not included in the analysis. The BRT models were developed using the “dismo” and “gbm” packages in the version R 3.6.1 of the software. 25
Reliability study
The consistent reliability of acrobats’ responses were compared by calculating intraclass correlation coefficients (ICC) 26 and coefficients of variation (CV). 27 The reliability of the measurements of PLF (ICC = 0.819, two-way random average measures) and MLR (ICC = 0.971) was high. Participants displayed low CVs, ranging from 8.2% to 11.2% for PLF and 10.0%–13.8% for MLR.
Results
Teeterboard mechanical characteristics
The relationship between the weights added and the teeterboard deflection was found to be linear. As shown in Figure 2, the thickest teeterboard (MDC: 5 cm) displayed the largest stiffness (19.6 kN/m) with the smallest deflection (11.5 cm), while the thinnest teeterboard (CDS: 4 cm) showed the smallest stiffness (12.2 kN/m) with the largest deflection (15.5 cm). The ENC teeterboard showed a stiffness of 18.5 kN/m, almost as high as the stiffness of the MDC teeterboard.
Peak landing forces
As shown in Figure 4(a), the BRT model showed that PLF was influenced by jump heights (40.8%), participants (26.4%), landing techniques (21.8%), and the teeterboards (11%). With these four variables, the BRT model explained 69% of the deviance. Smooth landing technique produced the smallest PLF, which were approximately 2.5 times smaller than the “straight legs” technique. Landing on an “empty board” (average of 9 BW) means experiencing PLF almost twice as that with a normal landing technique. Participants #1 and #4 produced almost twice the PLF level compared to participant #3. These two participants were also the lighter acrobats of their respective duo. The MDC teeterboard produced the highest PLF values and is associated with the greatest teeterboard stiffness.
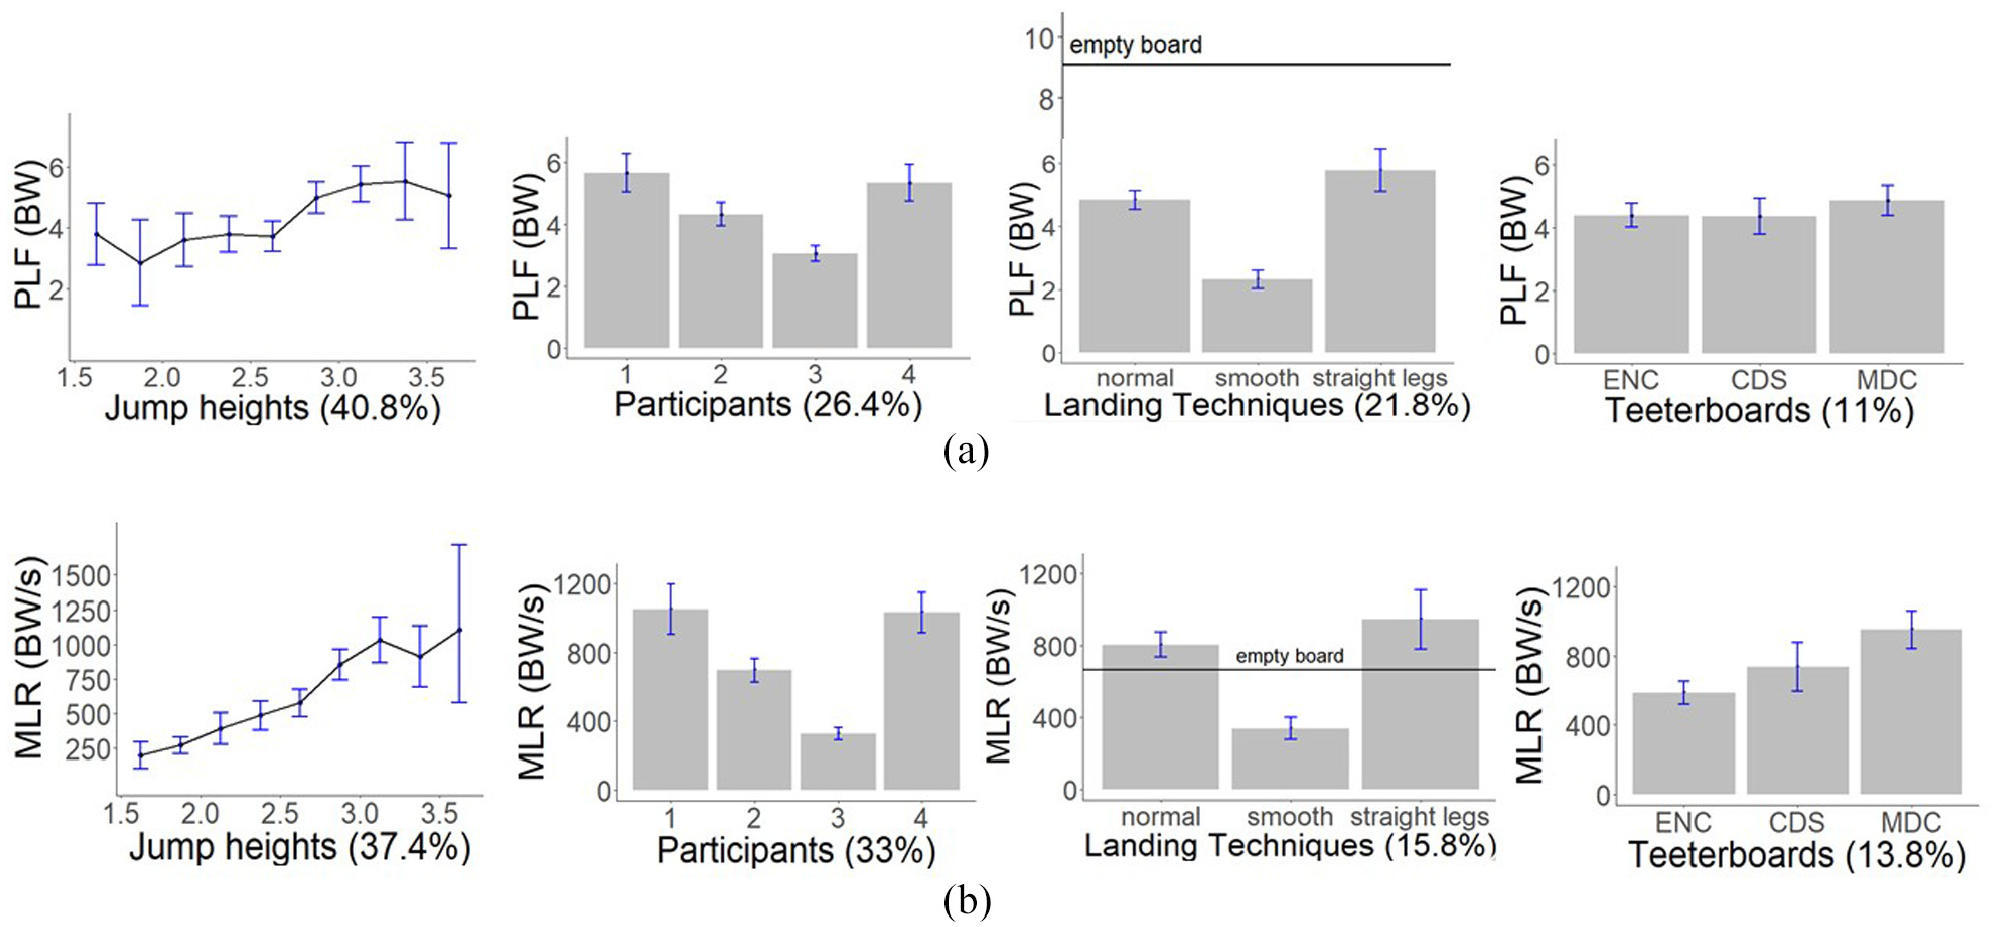
(a) Average and standard deviation of Peak Landing Force (PLF) and (b) maximal Loading Rate (MLR) with respect to jump heights, participants, landing techniques, and teeterboard types. Percentages of deviance explained from the BRT model are in parentheses. Mean value of empty board is presented in the Landing Techniques Figures as an extreme landing condition. École nationale de cirque (ENC), Cirque du Soleil (CDS) and Machine de cirque (MDC).
Maximum loading rate
Figure 4(b) shows that the jump height parameter was the most important factor (37.4%), followed by the participant (33%), landing technique (15.8%), and teeterboard (13.8%) associated with MLR values. The BRT model explained 71% of the deviance of MLR values. The smooth landing technique generated the lowest MLR, while “straights legs” and “normal” landings generated MLR that were more than two times higher. Overall, the MDC teeterboard generated the highest MLR, which was 50% greater than values measured with the ENC board. Similar to the PLF results, participant #3 showed the lowest MLR values, while the lightest participants (#1 and #4) showed the highest MLR values.
PLF and MLR values
The highest PLF value (13.5 BW) was recorded for participant #1 using the “straight legs” technique on the MDC teeterboard, while the highest MLR value (3050 BW/s) was also measured for participant #1 using a “normal” landing technique on the CDS teeterboard. The “empty board” landing generated a maximum value of PLF (13 BW) in participant #4 and moderate peak MLR value (1720 BW/s) in participant #2.
Discussion
Teeterboard stiffness
Since the width is very similar across all teeterboards, the stiffness is mainly influenced by the board’s thickness. Not surprisingly, the CDS teeterboard with the smallest thickness and the shorter length had the smaller stiffness (12.2 kN/m). The ENC and MDC teeterboards had almost the same thickness, but the ENC teeterboard center showed a smaller thickness. This characteristic may explain the slightly reduced stiffness (18.5 kN/m) of the ENC compared to the MDC teeterboard (19.6 kN/m). The stiffer teeterboard (MDC) is also associated with higher PLF and MLR values across all subjects. In comparison, the stiffness of aluminum diving boards range from 3.9 to 8.0 kN/m7–9,28 with respect to the fulcrum position. The MaxiFlex B diving board had a stiffness approximately two to three times smaller than the three Korean teeterboards used in the present study. This can be explained by the fact that this diving board is about twice as long and half as thick 7 as the teeterboards used in this study. The material (i.e. aluminum) used in constructing the diving board likely affected the mechanical characteristics. Measuring static stiffness only is a simplification of the board properties. The authors believe that a better model would be a non-linear torsional spring because the teeterboard not only bends, but also rotates around the pivot point. It has been reported that the springboard behaves as a linear spring with a small mass on top. 8 The vaulting board was modeled as a non-linear damped torsional spring 29 or a multi-model composed of 12 segments linked by torque springs for the upper part and two springs between the lower and upper part. 30
Maximum peak loading forces
The shape of the force time profile for the first peak during landing is similar to the one described in both jumping 10 and landing from spike jump in volleyball. 17
Gymnasts developed maximum peak forces of 16.6 BW during back somersault landing on a force-plate, 15 which is 23% higher than the maximum PLF observed in the present study (13.5 BW for participant #1). Very few studies have evaluated ground reaction forces during landing from higher heights and movable surface. During trampoline jumps, Glitsch and Henrichs 11 used pressure insoles to measure a maximum force of 7.5 BW under one foot for jumps between 1.6 and 2.5 m, whereas a combination of finite element modeling and musculoskeletal modeling estimated the peak force to range between 5.8 and 7.7 BW at one foot contact with the trampoline. 4 If the forces are assumed to be equally distributed under each foot, the total should be approximately 15 BW in trampoline. This value is in agreement with the present results, despite differences in the surface material, jump height and landing technique. Moreover, the time to PLF in the present study occurred within 8–13 ms after the initial contact, suggesting the passive nature of this peak. Muscle response is not quick enough to be active and reduces the impact. Time to first peak exhibited by gymnasts was 10 ms during drop landings of 90 cm. 10 In contrast, time to peak was estimated at approximately 100 ms in trampoline 4 and this difference may be explained by the flexibility characteristics of the trampoline surface.
Maximum loading rate
Seegmiller and McCaw measured the first peak force and the time to attain this force in jumping from 30, 60, and 90 cm. 10 By assuming the calculation of the loading rate being the value of the first peak force divided by the time to this force, the average loading rate for 10 gymnasts jumping from 90 cm was 335 BW/s. These findings are consistent with the present study. The acrobats jumped from a height of approximately 3 m and their average loading rate was 2.4 times higher than the one reported by Seegmiller and McCaw 10 for jump heights of 90 cm. In the present study, maximum MLR was 3050 BW/s, which is similar to findings presented by Hamdi, 31 who reported 2700 BW/s for gymnasts during back somersault landing on a force-plate. Yet, the mechanisms were different. The acrobats landed flat foot on a flexible board allowing rotation, while the gymnasts landed toe first on a rigid and fixed force plate mounted horizontally on the floor. In addition, the loading rate was calculated by dividing the first peak force by the time to reach this peak. In the current study, the maximum loading rate was calculated from the slope between three data points.
BRT model responses
The jump height showed the greatest influence on PLF and MLR values compared to participant, landing technique and teeterboard. These four combined parameters explained most of the deviance for PLF and MLR (69% and 71%, respectively). Other variables combining the dynamics of both acrobats forming a duo were not included in the present study and may have contributed to better explain the deviance of PLF and MLR values. Factors such as postural control, leg stiffness, angle of the body part, or muscle activation may influence PLF and MLR.
Jump heights
The fact that jump height contributed to the majority of PLF and MLR (40.8% and 37.4%, respectively) shows that in Korean teeterboard, PLF and MLR increase with increasing jump heights. Previous studies have shown that jump height has a significant effect on peak ground reaction force in drop landings.12,13 Increasing the jump height can increase the exposure to high forces and loading rates, which are key contributing factors to injury.19,21,22 The most effective way of reducing loads on the body would be to decrease jump height. However, this is not desired as high jump height is necessary to achieve acrobatic performances.
Landing techniques
Normal and straight legs landing techniques showed the highest average values of both PLF and MLR, while “smooth landing” generated the smallest average values. The smooth landing is not a regular movement used by teeterboard acrobats because it affects jump height. Although smooth landing is great to absorb impact, it reduces the momentum of the teeterboard and thus lowers the jump height for the other acrobat. The high PLF and MLR values associated with the “normal” landing technique is in agreement with previous research 10 that showed higher landing forces in competitive gymnasts compared to recreational athletes during drop landings. In that study, they concluded that skilled athletes seem to be more prone to injury than recreational athletes from landing impact responses.
Empty board
Although this technique was not included in the BRT analysis, landing on an “empty board” is a situation that can occur, especially with novice acrobats. It is indeed difficult to land on the small surface of the Korean teeterboard and maintain balance after landing. A bad landing may result in the acrobat stepping off the teeterboard, resulting in the other acrobat landing on an empty board. The high forces associated with the “empty board” landing is therefore a dangerous situation. Given the high impact forces, it is recommended that acrobats in Korean teeterboard should have good physical strength and adequate training to practice this discipline. 2 It is extremely important for trainers and acrobats to be aware of the high impacts (up to 13 BW) that the acrobat’s body experiences with an empty board.
Participants
In the present study, the PLF and MLR differ between the participants and seem to be associated with the acrobats’ weight. The two heavier participants (#2: 79 kg and #3: 77 kg) generated the smallest PLF and MLR, while the two lighter acrobats (#1: 65 kg and #4: 73 kg) generated the highest PLF and MLR. Since participants #2 and #4 and participants #1 and #3 formed two respective pairs, the PLF and MLR values can be explained by the fact that when the lightest acrobats were landing on the teeterboard, they experienced a greater resistance or a lower counterweight caused by the inertia of their respective heavier colleagues. This increased inertia means that the board did not rotate as rapidly and therefore did not move away from the feet as fast during the initial impact. The mass difference of 12 kg in one of the pairs can explain that participant #1 experienced the highest PLF (13.5 BW). Therefore, the mass difference between acrobats should be considered when training, as the production of high impact forces can lead to injuries during landing on certain teeterboards, especially on stiffer boards.
Teeterboards
The large majority of the highest PLF and MLR values were recorded using the MDC teeterboard. The MDC board was the thickest of the boards used in this study and showed the highest stiffness (19.6 kN/m), which was approximately 60% higher than the stiffness of the CDS board. The data from the present study suggests a relationship between teeterboard stiffness and the production of high PLF and MLR during teeterboard landing.
The smallest PLF were measured with both CDS and ENC boards, whereas the smallest MLR were clearly measured with the ENC teeterboard. Furthermore, it was assumed that the stiffness was the only parameter that could affect PLF and MLR values, but other parameters (i.e. length, height of pivot and teeterboard mass) may also contribute to PLF and MLR. Finding the optimal teeterboard design is a challenge for circus professionals. A board too thin will be too flexible and will create timing problem between acrobats, while a board too thick and rigid will interfere with the “whip effect” that is essential for the jump height. When a new teeterboard is manufactured, professionals remove layers of the board surface to reach the optimal board thickness (and stiffness) for their jumps.
Limitation of the study
Some limitations of the present study need to be noted. The small sample size and elite level of the participants prevent the authors from generalizing the results to all acrobats or beginners. Further studies should incorporate greater subject numbers. One limitation remains that the jump height was calculated from a marker located at the sternum and not from the center of mass of the acrobats. Future studies should also consider the timing between acrobats, specifically the timing of the flexion of the knee synchronized with the rotation of the board, in order to better understand the specificity of Korean teeterboard performance.
Conclusion
The aim of the study was to measure and compare stiffness across teeterboard and assess the influence of different factors, including three landing techniques, three teeterboard types, and four participants, on PLF and MLR. This study is the first to incorporate additional factors like participants, landing techniques, and teeterboard types and their relative influence on PLF and MLR. Moreover, this study provided the first ever data set of impact force and loading rates in a circus discipline.
The results showed that PLF and MLR increased with jump height. Maximum PLF and MLR were reached when landing on the MDC teeterboard with the highest stiffness. The “normal” and “straight legs” landing techniques were associated with higher PLF and MLR values, while landing on an “empty board” is also a precarious condition for transmitting high impacts. The BRT model was able to associate both PLF and MLR production with participants, teeterboard, and landing technique factors. The results also showed that PLF and MLR were very high in Korean teeterboard, raising concerns for lower limb injuries. Considering the high impact force and high loading rate measured in this study, trainers should be aware of the importance of specific landing technique training to prevent lower extremity injuries in teeterboard acrobats. Mass difference in acrobat pairs should also be considered as a factor potentially leading to injuries to the lighter acrobat.
Footnotes
Acknowledgements
The authors also want to thank Laurent Ballaz for the use of the force transducers.
Declaration of conflicting interests
The author(s) declared no potential conflicts of interest with respect to the research, authorship, and/or publication of this article.
Funding
The author(s) disclosed receipt of the following financial support for the research, authorship, and/or publication of this article: The authors would like to acknowledge the Fonds de recherche Société et Culture (FRQSC) from the Quebec government for providing a scholarship. They also would like to acknowledge the Cirque du Soleil, Machine de Cirque, École nationale de cirque de Montréal and the Center for Research, Innovation and Transfer in Circus Arts (CRITAC) for their support.