
Abstract
High performing and safe outdoor third generation (3G) artificial turf (AT) fields demand high quality initial design and construction coupled with a comprehensive maintenance aftercare regime. However, in many cases maintenance of AT fields suffers from either a low-cost inexpert approach, or a one-size-fits-all generic approach based on general guidance with little to no evidence of effectiveness. Little previous research has addressed fundamental questions regarding how 3G AT systems degrade or have provided evidence of the effectiveness of maintenance interventions. Maintenance techniques currently utilised can be grouped into four separate categories (grooming, cleaning, decompaction and infill top-ups). The maintenance tools and processes for each category have been developed empirically through experience, mainly in response to qualitative observations with little quantitative evidence.
This paper reports on a unique body of quantitative evidence of specific effects of maintenance interventions, on third generation AT surfaces (3G), collected over the past several years in collaboration with a major UK sports surface maintenance contractor. In addition, the data contributes new and robust evidence of the rate at which 3G surfaces can ‘lose’ quantities of performance infill corroborated by the rate at which fields were topped up to maintain appropriate infill depths. A new quantified pitch degradation and maintenance benefits model is presented explaining 3G AT system degradation factors and mechanisms, their links to changes in system performance and the magnitudes of change effected by specific maintenance techniques.
The new model is of direct benefit to both researchers and practitioners impacting on future best practice for assessing and maintaining the safety and performance of 3G AT.
Introduction
The most common artificial turf surfaces used today for soccer and rugby are referred to as ‘third generation’ (3G) or ‘rubber-crumb’ pitches. 1 The carpets typically comprise a pile height (fibre length) of between 35 and 65 mm. The fibres are typically either single filament strands, or slit filament (fibrillated) strands, manufactured from polypropylene or polyethylene. The behaviour of the polymer is controlled by stabilisers and fillers as well as the processing conditions, 2 and in-play related properties can be controlled by the density, cross-sectional shape, thickness and width of the fibres. Once laid, the carpet is typically infilled with a base layer of sand (size 0.2–1.2 mm) for stability and an upper layer of ‘performance infill’ usually comprising rubber granules (size 0.5–2.0 mm), although some designs utilise a layer of a mix of sand and rubber. 1 A shockpad of rubber or closed/open cell foam is sometimes incorporated under the carpet to absorb impact energy and help control player and ball surface interactions, working in conjunction with the compressible performance infill. The infilled carpet and shockpad make up the ‘surface system’. The carpet and shockpad layers are installed upon a solid foundation, formed of an asphalt layer formed over a compacted aggregate layer (common in the UK) or aggregate only (see Figure 1). A drainage system is incorporated for removing excess water from the playing surface area. Longer piled carpets with deeper layers of performance infill are most suited to this category of 3G design. Although 3G surface systems do not fully replicate the playing characteristics of natural turf they are widely promoted by sport governing bodies as capable of high intensity use in most weather conditions. 3
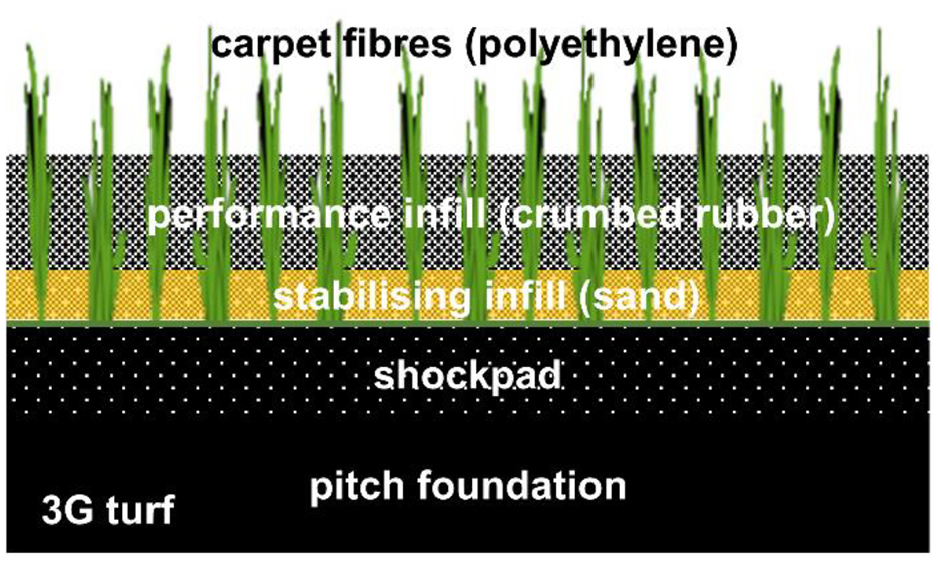
Cross section schematic of a typical 3G artificial turf construction (shockpad is sometimes used). In the UK the AT ‘system’ designs vary, and the sand and rubber layers vary in depth.
To provide high quality and safe 3G surfaces the implementation of a robust maintenance regime is recognised as vital, in addition to the professional installation of a well-designed and fit for purpose surface system.1,3 However, effective maintenance is often under-resourced for reasons of cost and/or poor understanding or how the surface systems wear and degrade. In many cases the standard procurement of a 3G pitch focusses on capital expenditure costs and not the recurrent costs for in-service aftercare. Guidance has improved regarding the benefits of maintenance; in principle, the maintenance programme should be suited to the site specifics. Site specific factors include: the type of surface system installed; the intensity (and type) of use; the local climate; and the local environment such as clean access to the facility and types of neighbouring trees. Maintenance techniques currently utilised can be conveniently grouped into four separate categories (grooming, cleaning, decompaction and infill top-ups). 4 The maintenance tools and processes for each category have been developed empirically through experience, in response to qualitative observations, with little quantitative evidence of their effectiveness.
This paper brings together a unique body of quantitative evidence of the specific effects of maintenance collected over the past eight years in collaboration with a major UK sports surface maintenance provider. In addition, the data contributes novel evidence of the rate at which 3G surfaces lose quantities of performance infill corroborated by the rate at which fields need topping up to maintain the depth recommended by the carpet manufacturer.
The research uses a unique data set collected from 2011 to 2018 to support refinement and validation of a maintenance conceptual model, first published in 2012 by the authors. 4 This original model was largely based on anecdotal subjective evidence, and limited fieldwork data, aimed at forming research questions and effective field-testing strategies. The refined pitch degradation and maintenance model, reported herein, enhances the original model through the addition of the magnitude of changes in play performance achieved from a range of common maintenance techniques.
Past research on 3G pitch maintenance
The importance of maintenance is promoted and emphasised in national and international governing body and industry guidance documents.5,6 However, understanding of the mechanisms of decline in performance of 3G systems over time, and how effectively maintenance can slow or reverse this, is lacking. Only a few controlled experimental studies appear in the available literature or their outcomes captured in best practice guidance. As 3G turf took an increasing share of the market in the 2000s, several studies of changes in pitch performance with time (use) emerged. In general, it was found that 3G surfaces become harder and faster 7 over time, with a trend showing that the fields with the highest ball roll, for example, had received highest usage. A short-term study observed that large changes in ball roll distance and surface hardness occurred during the very first playing season for six 3G pitches. 8 The study also gathered player perception data for these new surfaces, reporting that 47% of participants rated the surface as too hard and 77% felt the ball roll was too quick. A study of 50 soccer fields 7 over a 5-year period in the Netherlands gathered mechanical play performance test data regularly, and concluded the maintenance was a vital factor in prolonging quality. They observed a reduction in regular maintenance increased the number of fields failing one or more of the governing body play performance requirements 9 and most commonly failing ball roll (i.e. ball not slowing down quickly enough).
A UK industry symposium on 3G maintenance, reported in, 10 led to several outcomes related to advice on the frequency of a suite of techniques to ensure longevity of performance, in stark contrast to some sales marketing suggesting AT is low or even maintenance free. The collective qualitative outcomes suggested that whilst generic guidance existed it was considered less relevant to recent developments in yarn technology, and little specific guidance was being issued by the manufacturers regarding their own carpets. Simple daily tasks of removing litter were often under-resourced, according to many delegates. A rule of thumb emerged 10 that for every 10 h of use there should be an expectation of 1 h of maintenance, which raised awareness that perhaps 4 to 5 h of maintenance effort per week may be appropriate for a typical high use facility and this should be refined to suit the site.
In a more recent study in Spain, 11 20 randomly selected 3G pitches of various ages, which had not previously been certified by field testing, were evaluated by mechanical field testing during one season. The study found significant negative differences (i.e. a reduction) in play performance comparing between 3G pitches in three separate categories: age, those <5 years old versus 5 to 10 years old; usage, <35 h versus >35 h per week; and for specific regular maintenance versus no maintenance. The study was limited by unknown variations in system design but provides further evidence that age, intensity of use and amount of maintenance appear to have a strong effect on play performance during the life of an AT pitch.
In recent years UK manufacturers have included warranties with new installations stating the expected number of years a product should last if well maintained, with caveats on intensity of use. In addition, the ‘hours of use’ calculation accounts for how the pitch is used; for example, for the same full-sized pitch, three cross-field 5 a-side games would rate as more intense use than a single 11-a-side game. 12
In 2012 the Loughborough sport surfaces research team published a model of ‘pitch degradation’ (Figure 2). 4 The model was conceived to qualitatively explain the observed decline in performance of 3G pitches with age. It was developed from the (limited) available published research, anecdotal industry experience and several assumptions about AT materials’ behaviour and hypothesised mechanisms for changes in performance over time. The model comprised three elements: degradation factors, degradation mechanisms and likely physical effects and consequences for the components/surface system. The degradation factors were combined into three categories: mechanical wear; weathering and foreign detritus. The mechanisms of degradation attempted to explain the physical processes of degradation to the materials and system. Similarly, the component/system effects attempted to categorise how the mechanism would manifest an observable change in the performance of the pitch. The model showed the many inter-related aspects of how a pitch may degrade and the implications for the user/operator. It was considered helpful in explaining why maintenance is needed, and in identifying the system effects of degradation and hence the expected benefits of specific maintenance processes, albeit qualitatively. However, at the time of the model development, the play performance effects of specific maintenance processes had not been quantified.
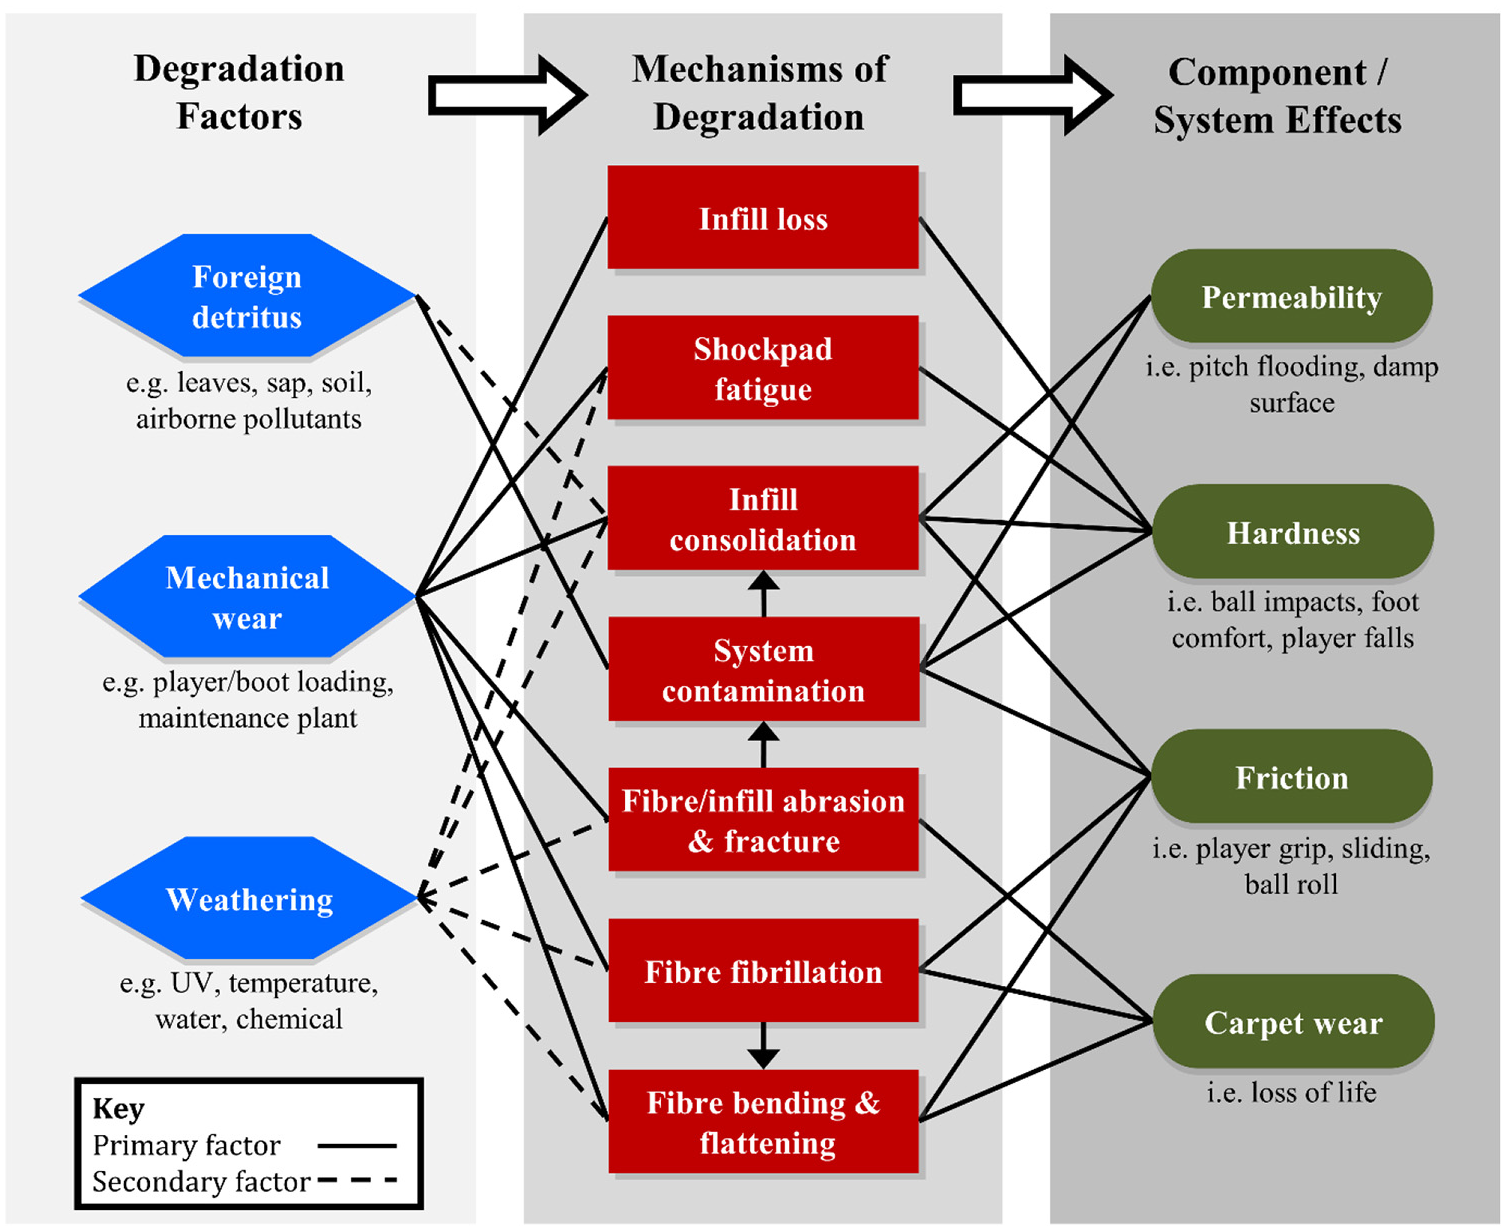
The Loughborough pitch degradation model. 4
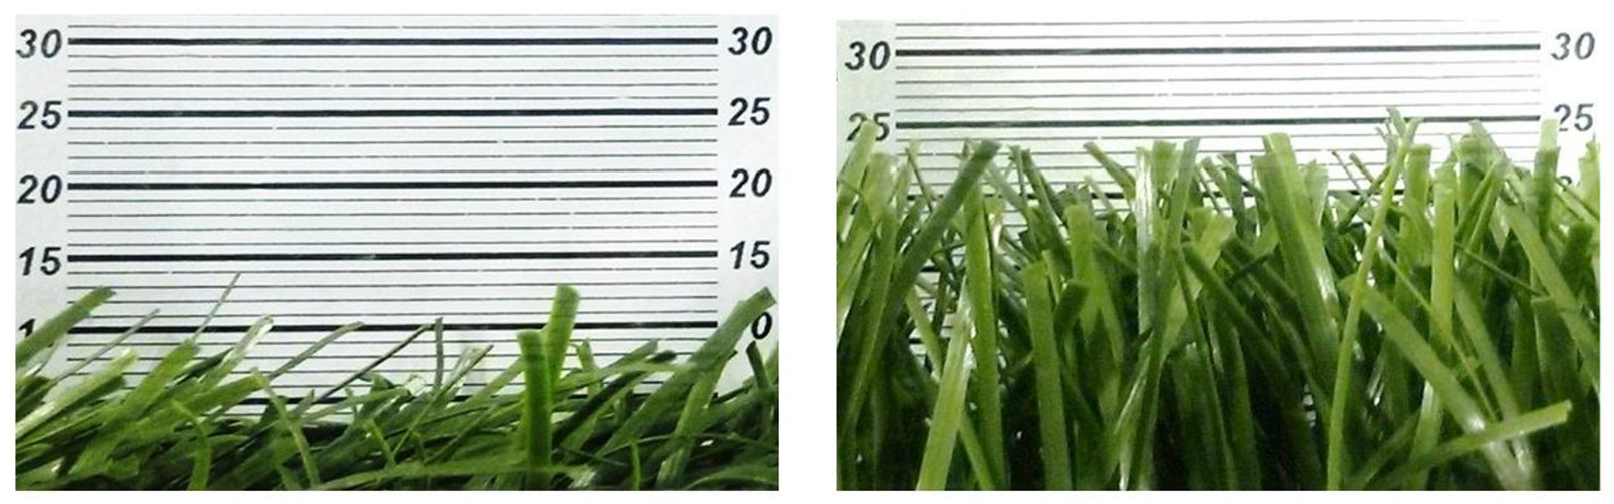
Two more recent studies by the model authors merit further review. In the first McLaren 13 produced a correlation between the industry standard ball roll distance test 5 and the ‘free pile height’ of the carpet fibres; based on a series of measurements on an indoor (no wind effects) FIFA approved AT pitch over the period of one year (Figure 3). Free pile height was reported as the median of the tallest 20 fibres observed using the prism method 5 (Figure 4). Furthermore, both free pile height and ball roll were taken in four orthogonal directions to avoid bias from pile direction. Since installation, this pitch had been used an average of 28 h per week and was regularly maintained; initially receiving 1 h of maintenance for every 10 h of use which had been increased to 1 h of maintenance for every 5 h of use due to larger than expected increases in ball roll distance. The study highlighted large changes in average ball roll distance over the 12 months with further analysis indicating that high spatial variation also existed (Figure 3(a)). Based on these results, the strategy for pitch use was altered with smaller group playing sessions rotated across the whole surface alleviating the tendency for groups to cluster near either a goal or the main pitch entrance.
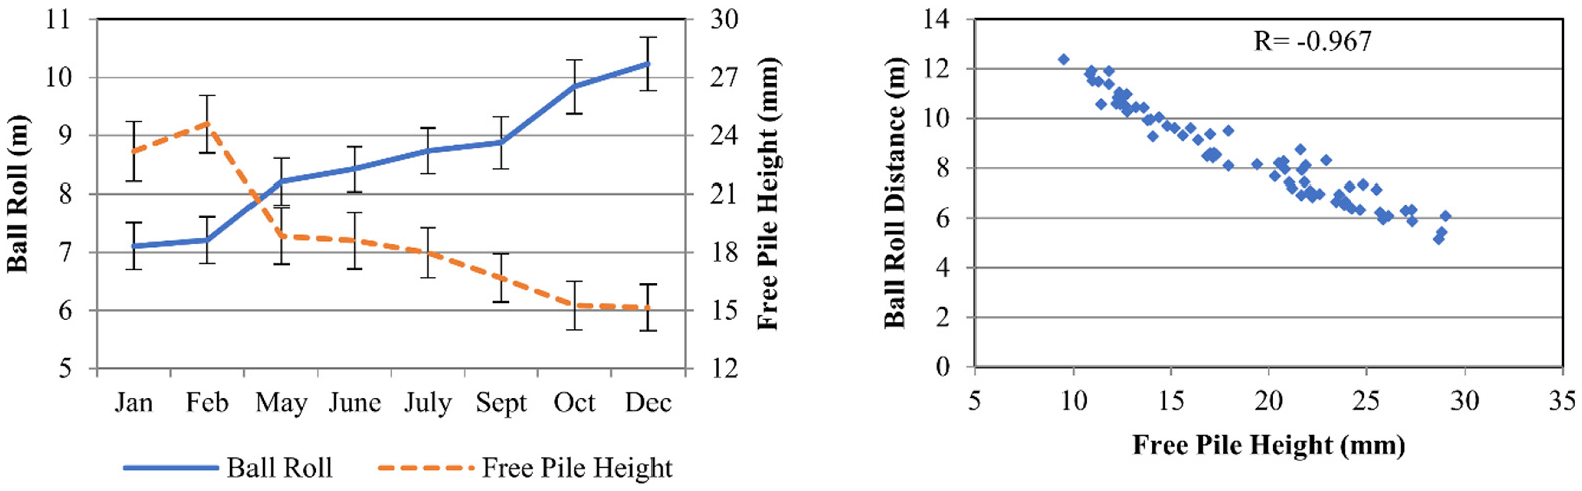
Ball roll and free pile height results from as single indoor 3G pitch 13 : (a) changes in ball roll and free pile height across the 12 month period (the FIFA range of acceptability for ball roll is 4 to12 m (re-test)), 5 (b) strong negative correlation between ball roll distance and free pile height average.
More recently, Sharma 14 reinforced the observation that ball roll distance increases with age/use through a study of the play performance of 11 3G pitches monitored over a 3-year period. In general, these pitch systems comprised long pile carpets (40–65 mm) that were 2 to 3 years old and had all been regularly maintained. A suite of play performance testing was performed annually for 8 of the 11 sites, and quarterly visits for remaining 3 sites. Overall, few changes in play performance were recorded except for ball roll distance, which typically increased by up to 3 to 4 m.
Sharma 14 also reported data on the estimated mass of contamination removed by regular powersweeping of 3G surfaces. Fines contamination is suggested to cause a loss of drainage through clogging and accentuate pitch hardening through compaction. In this study the amount of contamination recovered was estimated based on sieving and identifying the mass of material collected outside the specification performance infill size range of 0.6 to 3.2 mm. Data was collected over a period of 6 month period from powersweeping monthly on three 3G pitches, between 4 and 6 years old with 35 to 40 mm pile length. The estimate of the total mass of contaminant removed per year per pitch was in the range of 20 to 28 kg. This range corresponds to the volume of contamination removed relative to the surface volume disturbed by the brushing (reported as set to a depth of 3 mm) to be in the range of up to 1%; similar to the value reported for sand-based (2G) multi-use pitches, 15 which also suggested an upper limit of 15% by volume as representing highly contaminated, affecting play performance and drainage. In contrast, there is no published work on contamination of 3G pitches and little anecdotal evidence of poor drainage developing over time. The porosity (volume of voids/total volume) of the rubber infill for 3G surfaces has been reported to be up to 70%, 16 while for 2G sand infilled surfaces it is lower at around 40%. 15 Hence, clogging may be expected to be more of an issue for 2G surfaces if not cleaned regularly.
In summary, few published studies exist that investigated maintenance specifically, although several studies have reported programmes of field testing to evaluate changes in field play performance, mostly for relatively short periods of up to 3 years. Industry standards and codes of practice give useful generic guidance as to the suite of maintenance techniques available and their purpose. However, to date the specific benefits of the primary maintenance interventions have yet to be quantified.
Maintenance model for 3G pitches
Introduction
A recent Knowledge Transfer Partnership (2015–2019) between Loughborough University’s sport surfaces research group and a UK specialist maintenance provider, Technical Surfaces Ltd, aimed to quantify the effects of specific maintenance processes on play performance for 3G AT surfaces. The company’s portfolio of contracts, represented by approximately 750 individual pitches including many different pitch sizes, products and surface system constructions but for which not all details of build and maintenance history are fully known. The suite of maintenance services offered to the clients varied considerably, in some cases the company managed all aspects of maintenance, whereas in many cases site owner/operators carried out routine maintenance of litter picking and drag brushing themselves and procured more specialist processes.
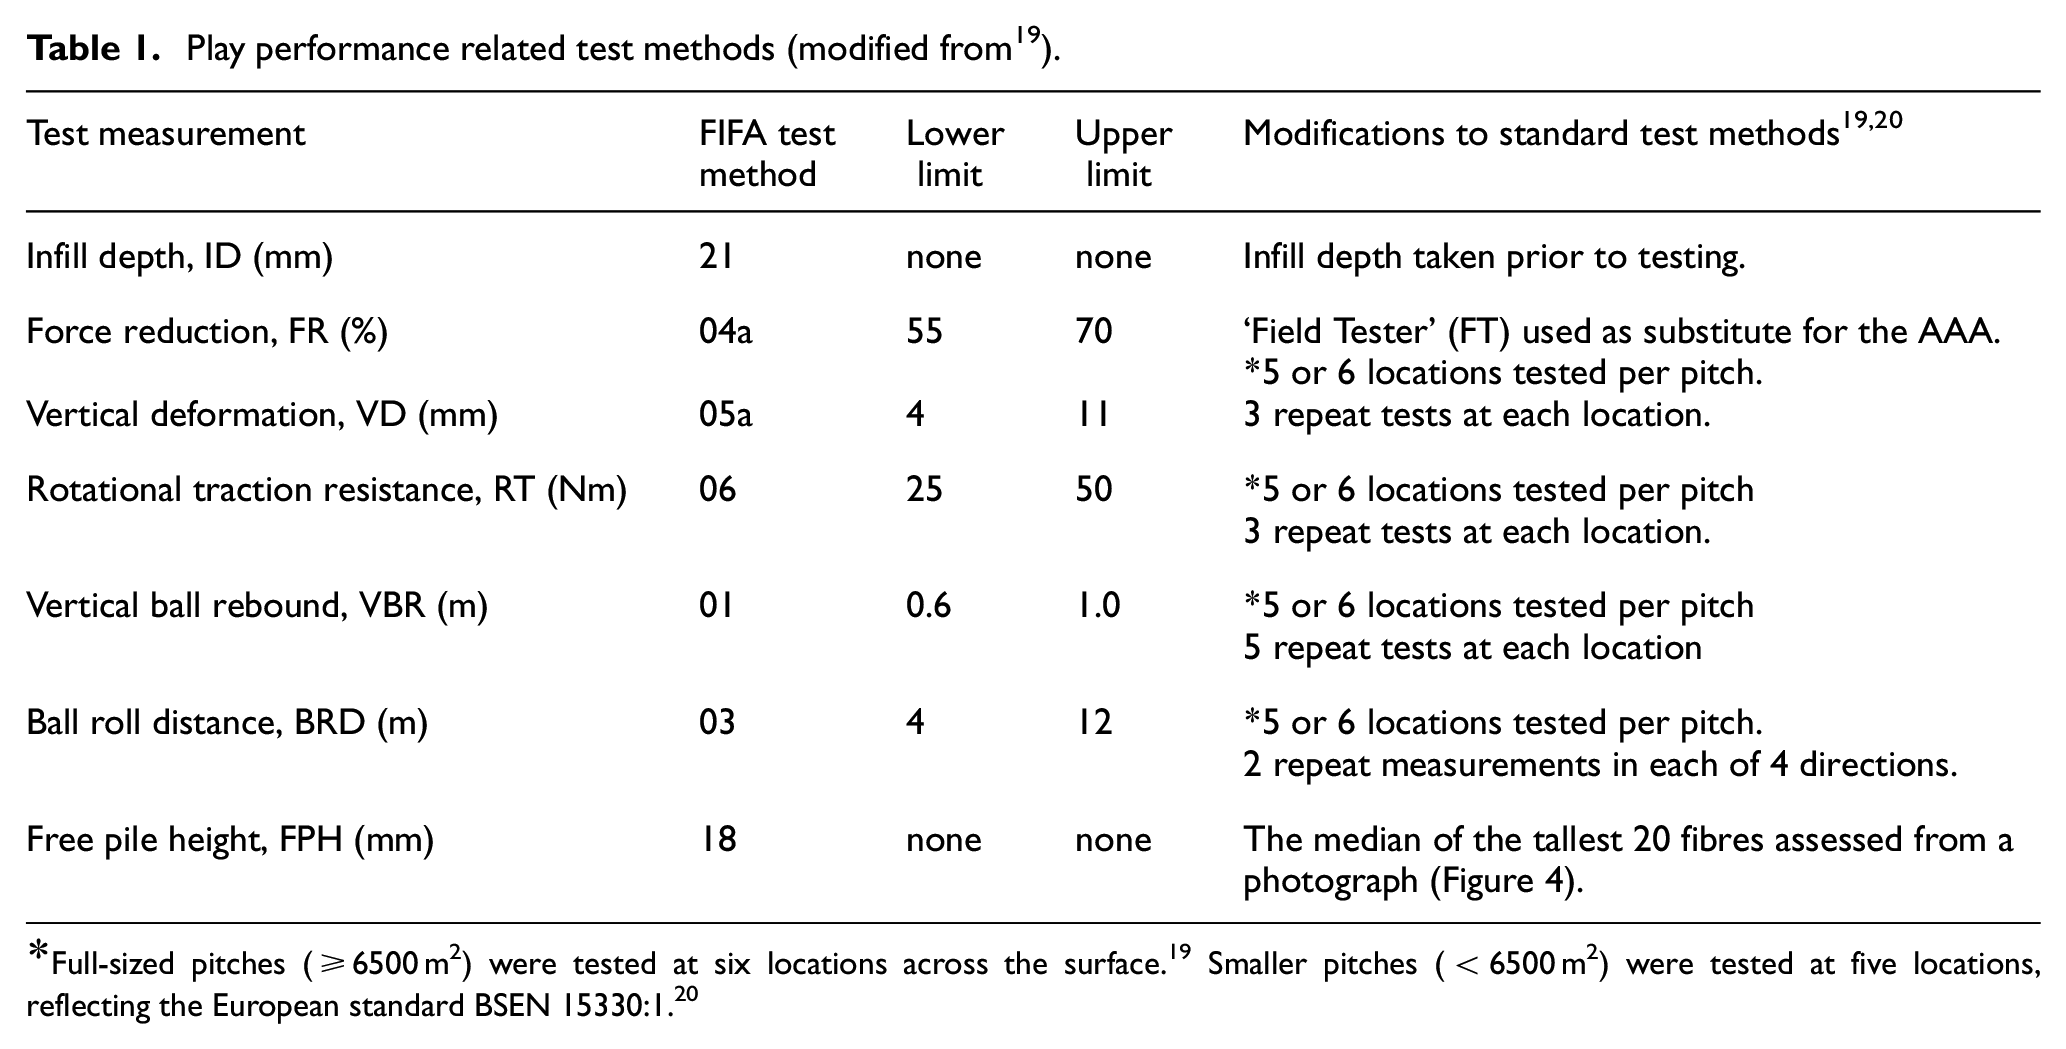
To define acceptable levels of play performance, the industry is reliant on the field testing standards and limits set out in the (international) governing body handbooks of requirements, or follow a similar but reduced set of requirements for example in England for community level football pitches registered with the Football Association. 17 For the majority of the 3G AT pitches investigated herein the relevant standards are those set by FIFA. 5 Within these standards, detailed test methods and acceptability criteria are set out for the key play performance tests of most relevance to players, that is, surface hardness (termed force reduction and vertical deformation) and rotational traction (grip); and for ball-surface interaction that is a ball roll distance and a vertical ball rebound. A summary of the tests, the acceptable FIFA range and any modifications to the standard tests applied in this research are given in Table 1 and Figure 5. Where testing differed for a specific research investigation the relevant sub-section gives details. In this research the Advanced Artificial Athlete (AAA) was substituted by the more portable ‘Field Tester’ (FT), which is a non-standard test and within this wider research programme an extensive correlation between the outputs from the two devices was carried out demonstrating the FT data to be suitable following (minor) adjustment of the measured data. 18
Play performance related test methods (modified from 19 ).
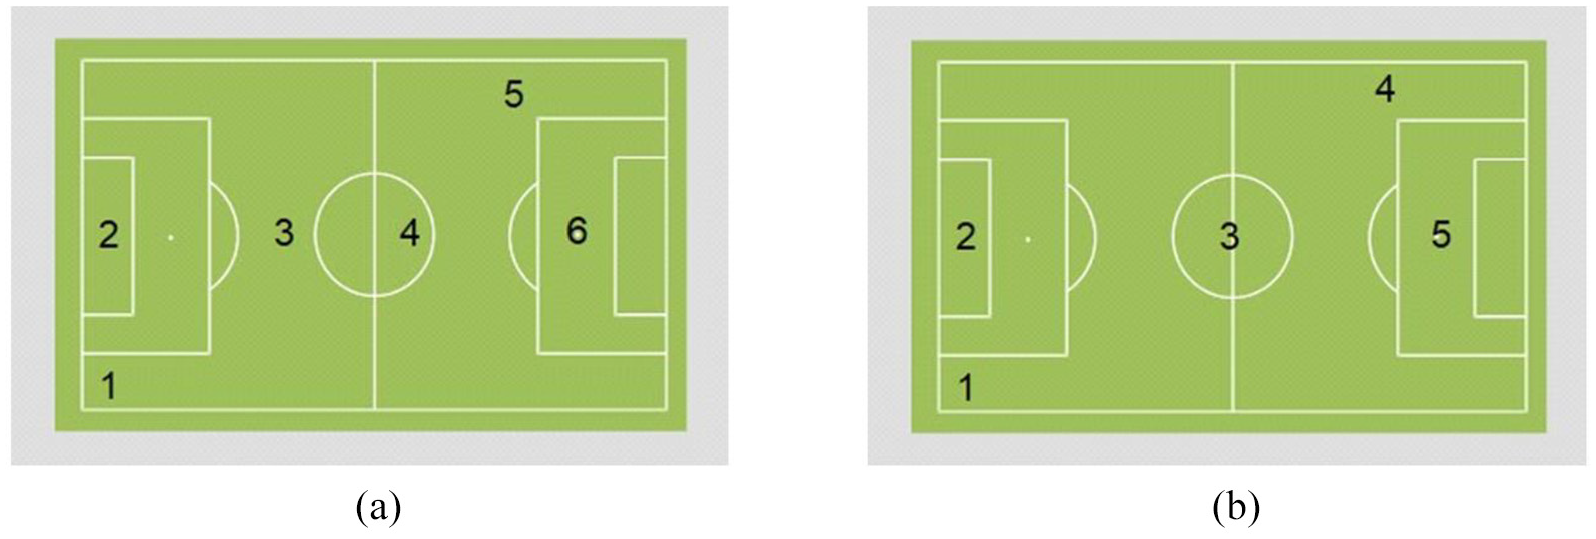
Standard test locations used in this study for: (a) full-sized pitches, and (b) small-sided pitches.
It should be noted that 3G AT pitches are not field tested regularly for performance, at most once a year and if requiring the FIFA approval then every 2 to 3 years, and many fields not at all. The collaborating maintenance company do test fields in detail annually year as part of a full-service package ‘health check’, so have useful information for many but not all fields stretching back around 5 years. The sub-studies described below, investigating measurable effects of specific maintenance techniques, utilised this formation in the company database to select the best available sites for the trials.
Unless otherwise stated, the pre- versus post- data from the performance tests were statistically compared using paired t-tests with significance set at p < 0.05. All statistical analysis was performed in Matlab (The Mathworks, Inc).
Maintenance methods
The following describes each of the commonly applied suite of maintenance techniques:
Drag Brushing (grooming): A tractor mounted static brush 1 (see Figure 6) is traversed across the surface in usually one single direction and one pass, taking 1 to 2 h including clearing the surface of general debris. The height of brush is set by the operator to just penetrate the infill by <5 mm, typically around 3 mm. This process is used to lift the fibres to a more upright position, and to redistribute the infill evenly across the surface. The frequency of application varies, typically from once to several times per week (dependant on the carpet manufacturer guidance and the intensity of usage).
A regular visit combines grooming and cleaning by powerbrushing, with a light decompaction (commercial company term is MatchFit®): A single vehicle is used (see Figure 7) combining a front powerbrushing head and rear-mounted rake. The front powerbrush head comprises rotating brushes (300 mm in diameter) usually set by the operator to a depth of around 5 mm. The rotating brushes lift the fibres and redistribute infill. A hoover cleaning system lifts the debris, filtering out the very fine and very coarse materials (>4 mm) and returning infill size particles back to the surface. The rear-mounted rake comprises a row of spring-loaded steel tines (6 rows of spring-steel tines, 100 mm long, 3 mm thick) usually set to a depth of 15 to 20 mm into the surface. The tines agitate and decompact the infill. Powerbrushing visits are usually carried out between 6 and 12 times per year.
A ‘deep clean’ process is applied typically carried out every 1 to 2 years. A powered brush of large diameter (typically 450 mm) with relatively stiff bristles traverses the surface at low speed (relative to the routine power brushing) to provide high intensity brushing energy. The lower speed also gives more time to filter out the loose material hoovered from the surface and successfully separate out waste and return infill size particles (vibrating filter aperture can be varied and usually set at 4mm). The brush is typically set 10 to 15 mm into the surface. As the infill is disturbed to a greater depth, re-levelling is also usually required, through subsequent drag brushing. This process is also called ‘revitalisation’ (commercial company term used is Revite®).
Rubber Top-Up: Additional performance infill is applied to the surface to replace that lost, increasing infill depth back to the recommended level and restore both play performance and fibre support. A bespoke spreading machine is used to evenly distribute the volume required, and/or target specific areas based on the measurements of infill depth. Typically, a light decompaction is performed pre top-up and power brushing post top-up to ensure the new infill is installed evenly across the surface. Top-ups are typically performed when infill depth becomes low (no specific guidance exists it appears as to how low) and/or the outcomes of play performance tests showing the field is too fast (high ball roll) or too hard (high ball rebound). In many cases whether a recommended top-up is completed depends on the client’s budgeting.
A deep decompaction process is typically performed every 3 to 4 years when the less intense routine monthly decompaction and power brushing process is no longer achieving loosening of compacted infill (commercial company term is PowerGrade®). This bespoke method uses a high energy agitating system of tines, either rotating or with multiple passes, set to penetrate through the performance infill layer into the sand to within 5 to 10 mm of the carpet backing (typical total depth of around 30 mm or more for a 60 mm carpet system). The highly disturbed infill is simultaneously re-levelled using an oscillating power brush or drag brush at the rear of the machine.
Note: The maintenance machinery investigated and described in this paper is somewhat ‘bespoke’, commonly a base unit tractor is modified with bespoke ‘tools’ made by the maintenance company or by the specialist supplier (e.g. SMG in Germany) often to the company’s specific request (based on 30 years of experience). For example, the ‘Sportchamp’ base unit supplied by SMG (Figure 7) is modified with interchangeable rear and front units, for example, a bespoke rake design with tines for decompaction (shown on the rear), and a power brush system (shown on the front). Furthermore, brush stiffness is not specified other than soft, medium and hard and by diameter, for example.
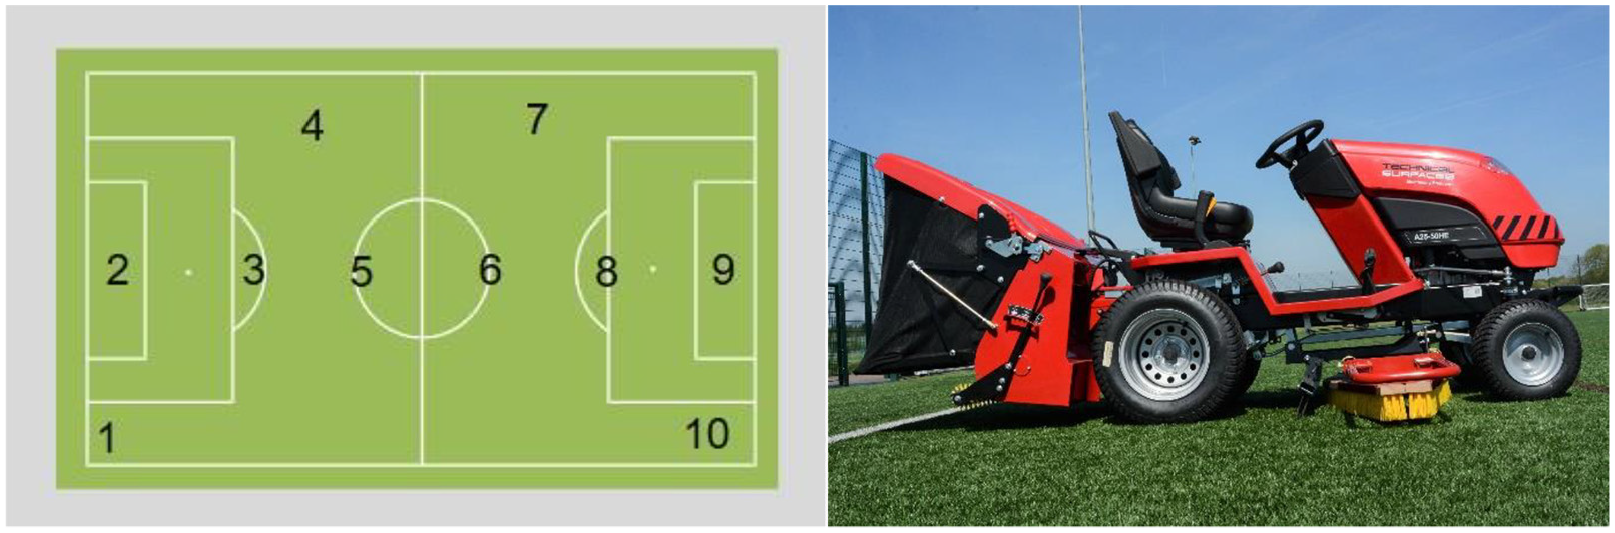
Test locations and the equipment (modified Countax tractor unit) used for the drag brushing study.
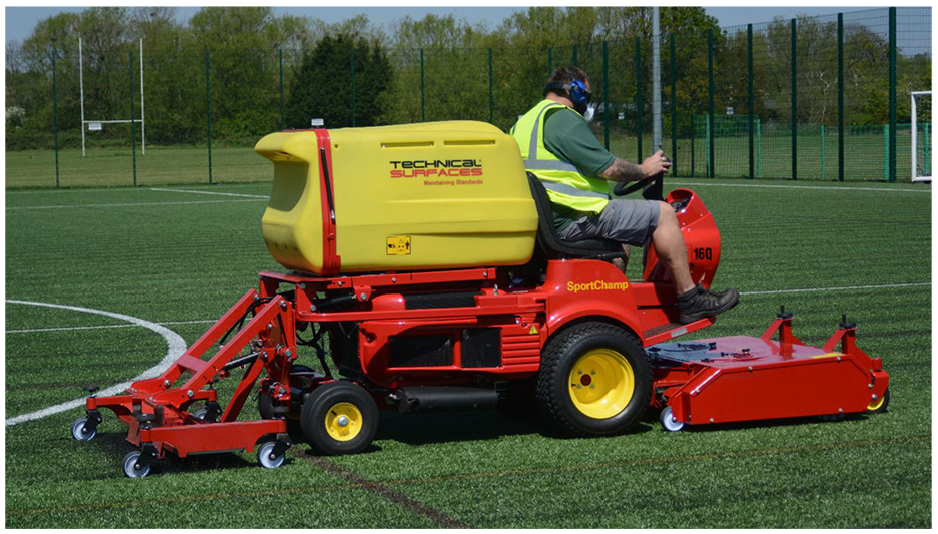
Equipment used for Powerbrushing maintenance; showing the ‘Sportchamp’ base unit with a bespoke powerbrush head at the front coupled to the vacuum and filter system (yellow box) and bespoke carriage with decompacting tines at the rear.
Studies to quantify the effectiveness of the techniques described above are detailed in the following sections, except for the deep clean process which was not included in this research programme.
Study 1: Drag brushing
The aims of this study were firstly to investigate the effectiveness of drag brushing in improving (reducing) ball roll distance and increasing free pile height, and secondly to assess the optimum travelling speed of the machine and frequency of application.
Drag Brushing trials were completed on six pitches selected based on varying specifications and full knowledge of the design and history (Table 2), comprising three different manufacturers’ products and between 1 and 4 years old except for one older pitch described further below. Testing of play performance was carried out immediately before (pre) and after (post) brushing. In addition, return testing visits were completed 24 and 48 h after drag brushing, over which time the pitches were subject to normal play usage. A second drag brush was completed after the initial 48 h testing with the pre, post, 24 and 48 h testing repeated. The pitches were divided into two halves, with five test locations (1–5 or 6–10) completed in each half (Figure 6) and with a machine travelling speed or either 3 or 9 mph. Ball roll distance (BRD) comprised eight measurements at each location, with two repeats in each of the four directions. Free pile height (FPH) comprised eight photographs at each location; one in each direction at the start point of the ball roll and again 2 m along the ball roll path.
Surface systems used in the drag brushing study (all full-size pitches).
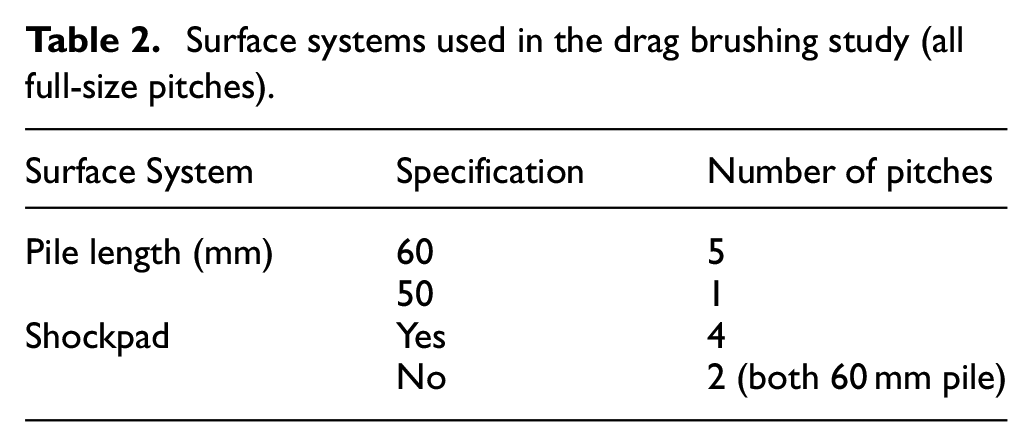
The detailed BRD results for two of the surfaces of similar designs (60 mm polyethylene carpet and no shockpad) but differing ages are given in Table 3 for comparison. Pitch DB1 was one year old and received a single weekly drag brush while pitch DB2 was over five years old and received a drag brush every second week The newer pitch DB1 (anecdotally a moderately intensely used school facility) recorded an average BRD of around 6.6 m with a coefficient of variation (CoV) of 3% to 4% (from the 40 initial pre-tests). Pitch DB2 average infill depth (from 119 measurement locations) was 39 mm and the FPH average was 18 mm. From the infill depth the maximum FPH for this 60 mm carpet might be expected to be 21 mm suggesting the pile was stood very upright and well supported by the infill. In contrast, the older pitch DB2 (anecdotally an intensively used leisure centre hire facility) recorded an average BRD of 12 m with a CoV of 5% to 6% (from the 40 initial pre-tests). The infill depth average was recorded as 34 mm, and free pile height an average of 8 mm.
Drag Brushing Effect on Ball Roll Distance (BRD) comparing two identical pitch constructions of different ages and usage levels (Machine traversing speed 3 mph).
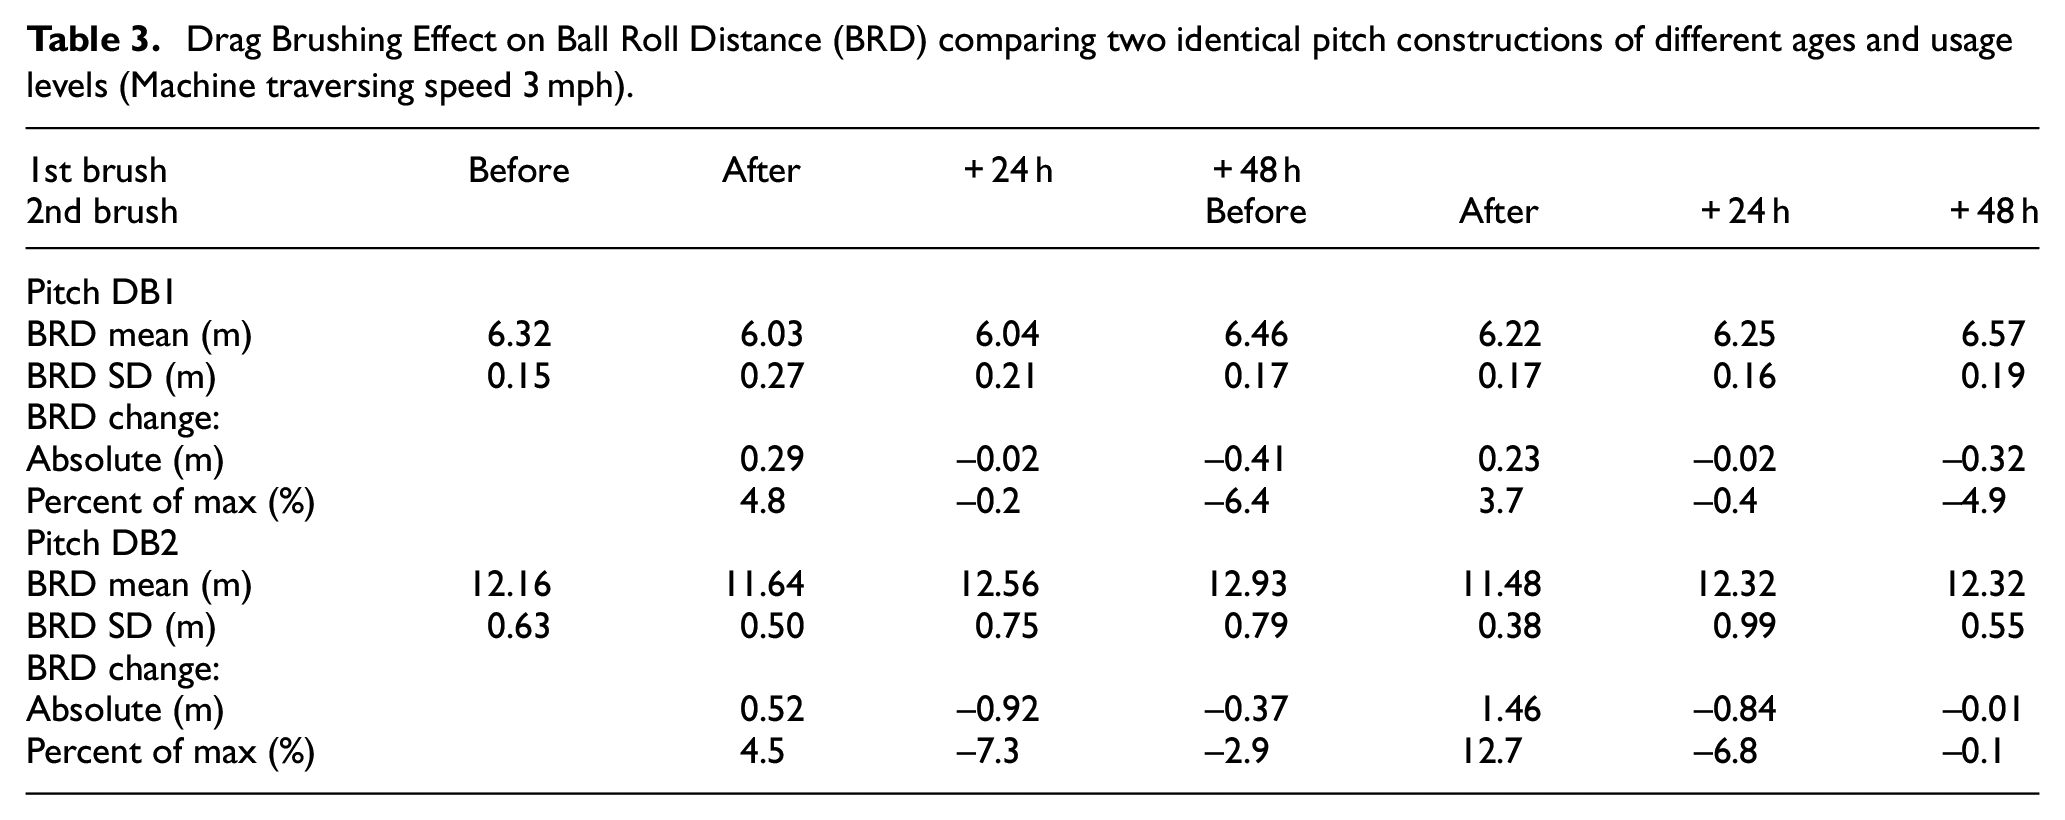
For the newer pitch DB1, the results showed that brushing seemed to have a small effect (20–30 cm improvement in BRD), however the surface was performing well at the shorter end of the FIFA acceptable range (4–12 m) for BRD. The high FPH pre-test showed little room for improvement. In contrast, the older pitch DB2 data showed a relatively large change after the second drag brush, with the positive effects of brushing lasting up to 48 h. It appears for this intensively used older surface (>60 h per week) the pile was much flatter (very low FPH) causing the relatively high BRD. It appears this older pitch would benefit from more frequent brushing, possibly daily, to lift the pile and maintain as large a FPH as possible. Furthermore, with the infill depth 6 mm below the manufacturer’s recommendation (of 40 mm), this pitch would also benefit from additional performance infill (top-up) to help support the fibres. However, anecdotal experience suggests that once a pile is very flattened it is increasingly difficult to add extra infill evenly and effectively.
From the whole dataset (six pitches) of pre versus post testing drag brushing was observed to significantly reduce BRD by around 0.5 m (p < 0.001), from an average pre BRD of around 10 m. Given that the FIFA acceptable range for BRD is 4 to 12 m (Table 1), this reduction equates to a 6% relative change. In comparison, the FPH significantly increased on average by 7.5% (absolute) of the fibre length (p < 0.001). For pitches with an initially flatter pile (i.e. smaller pre FPH) it was observed that the second brushing application further improved the BRD and FPH. Although not a primary focus of the study, it was also interesting to note that no statistically significant effect was measured between the machinery travel speed of 3 mph or 9 mph.
Study 2: Powerbrushing
The aim of this study was to measure the play performance effects and quantify the direct effect of a single Powerbrush (as shown in Figure 7) maintenance intervention (which comprises a combination of grooming, cleaning and decompaction). Ten full-sized pitches all receiving regular maintenance were selected. Play performance testing was undertaken immediately pre and post the Powerbrushing at six test locations (see Figure 5(a)) and comprised ball roll distance (BRD), ball rebound (VBR), rotational resistance (RR), and Field-tester measurements of hardness, that is, force reduction (FR) and vertical deformation (VD).
The largest changes observed from the results were in the ball surface interaction tests; expressed as a percentage change within the FIFA range (Table 1) the BRD reduced on average by 17% (p = 0.01), and VBR reduced on average by 21% (p < 0.001). Rotational resistance reduced on average by 10% (p = 0.01) and VD increased (softer) on average by 7.1% (p = 0.01). Force reduction increased (softer) on average by 5%; however, this was not statistically significant (p = 0.47). It was also observed that for the longer pile surfaces with no shockpad the average change in VBR was slightly larger (reduced by 26%) compared to the surfaces with a shockpad (reduced by 19%).
These results corroborate the expected effect of a decompaction on a surface system infill where the infill has become a little harder through compaction. Loosening of the performance infill reduces the hardness and resilience such that less energy is recovered from the ball impact resulting in a lower rebound height. The looser infill is more compliant giving a higher level of surface deformation (VD) and greater shock absorbency (FR), and a lower resistance to rotational traction. Fibres lifted by power brushing result in more resistance to ball roll, hence the reductions in BRD observed. Overall, the absolute increase in FPH was observed to be on average 1.4 mm (not statistically significant). The higher energy of the power brush, relative to the pseudo-static drag brush, was observed to have a greater effect on ball roll, however, the loosening of infill may also reduce the ball roll resistance of the surface to some extent.
Study 3A: Performance infill loss
The aim of this study was to evaluate the rate of change of infill depth, that is, rate of infill ‘loss’. Occasional top-ups of performance infill during service is common practice. The recent focus on ‘micro-plastics’ entering marine environments has identified 3G AT as one of many sources – and little robust data existed to quantify the scale of these losses.
The methodology for estimating the rate of infill ‘loss’ was to data mine the periodic checks of infill depths for 3G AT pitches held in the company database. The database dated back over 15 years and contained information for around 750 3G pitches of which 416 had useable infill depth data (Figure 8), that is, a minimum of one pair of infill depth readings to analyse a change. Of the 416 sites, 189 were constructed with a shockpad and 227 without. An infill depth reading typically represented the mean of infill depth measurements taken at between 79 and 119 locations on the pitch (best practice has changed over the years). The high number of measurement locations allows good spatial representation of the infill depth distribution across a pitch and minimises the uncertainty in the overall infill depth reading for the pitch (the measurement procedure has an inherent precision of around ±1 mm).
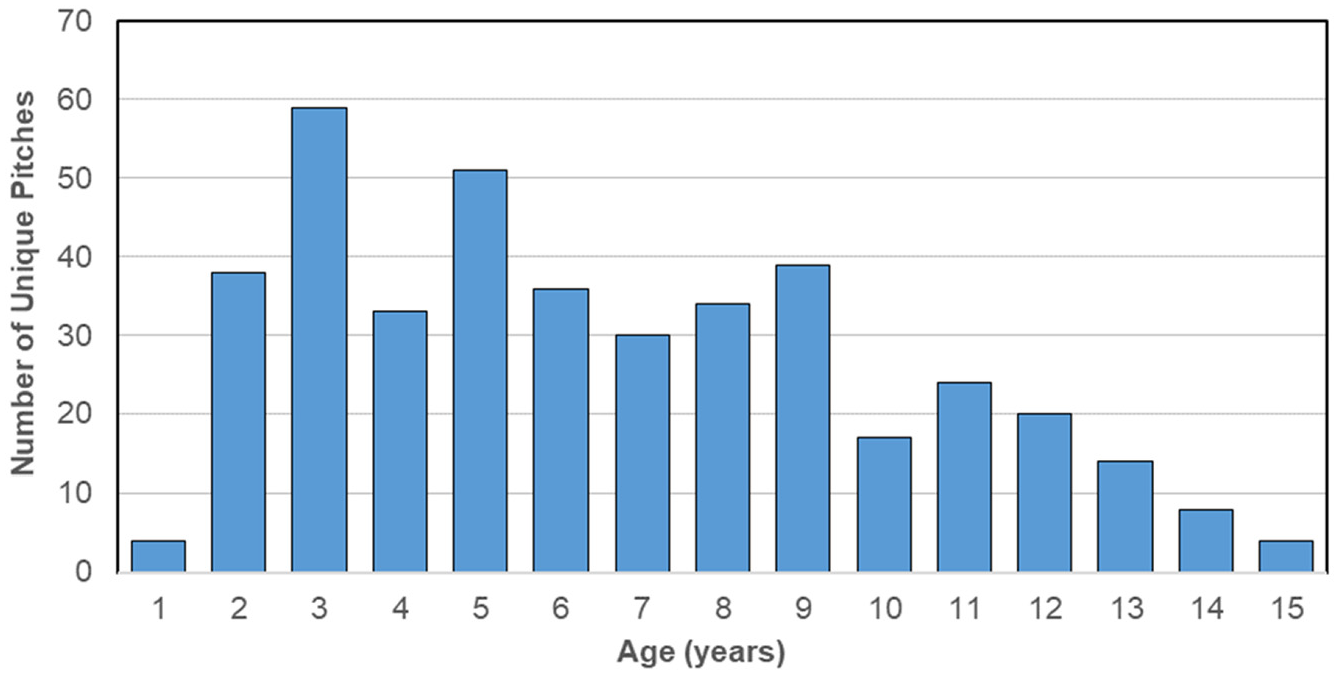
Pitch age distribution for those included in the infill depth change analysis.
The rate of infill loss was estimated as a loss (in mm of depth) per year as this aligned with the typical commercial cycle of annual ‘health checks’ and client reports for their pitches, although many data sets in the database were of more varied time intervals. An initial total of 1801 data points (pairs of infill depth readings) from the 416 pitches were identified. Data points were subsequently excluded if an infill top-up had been applied between readings (as it is not routine to measure before and after on the day) leaving 1206 data points from 389 pitches, or if the readings were too close together in time, that is, < 3 months, needing extrapolation to a ‘per year’ time scale. This then left 830 data points from 368 pitches. The three-month limit of extrapolation was selected through trial and error, as the minimum time period for which the rate of infill loss values showed a similar distribution to those calculated with minimal extrapolation.
The remaining 830 data points were plotted as a histogram to provide an overview of the magnitude of depth change/year and frequency of occurrence (Figure 9). The majority (approximately 75%) of data points were in the range +1 to −2.5 mm/year. It was expected that all data points would show a negative change of depth, that is, a ‘loss’ of infill, however, this was not the case. Through a process of statistical testing it was established that all data points ≤+1 mm should be retained as any small positive change could be accounted for through measurement uncertainty (random errors), while all data points > +1 mm should be excluded due to being the result of an external confounding factor (e.g. a systematic measurement error by an operator, differences in the pitch locations sampled or the occurrence of an unrecorded infill top-up). This process left 656 data points from 340 pitches.
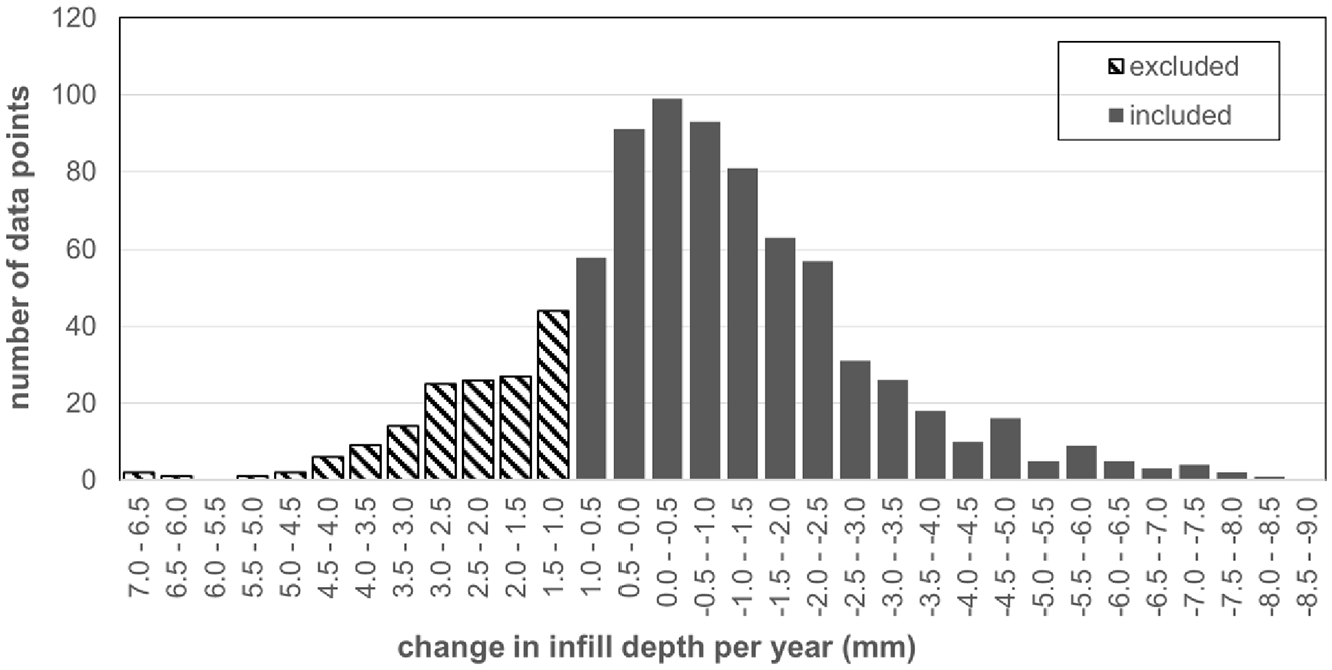
Distribution of the average change in depth of infill per year estimated from the company database of archived field readings. A data point represents a pair of readings, that is, consecutive infill depth measurements for a surface from which the change in a year was estimated. All data points with an increase of >1 mm (shown in red) were subsequently excluded from further analysis.
The collective data show an interesting temporal trend (Figure 10). It is observed that in the early years of a pitch life more infill appears to be ‘lost’. This is, however, attributed to the infills (sand and performance infill layers) ‘settling’ into the carpet structure from the user interactions, and relatively higher magnitude compaction of the infill due to its initial very loose state at installation. The error bars show higher variability in the data in these early years also. After typically 4 years it is observed the change of depth per year becomes relatively consistent in the median and range. A Kruskal-Wallis test (with Dunn post hoc tests) indicated significant differences in change in infill depth between years (p < 0.001). In brief, years 1 to 3 had a significantly greater rate of infill ‘loss’ compared to years 4 onwards (p = 0.009 to <0.001); there were no significant differences between years 1 to 3 or between years 4 and 11.
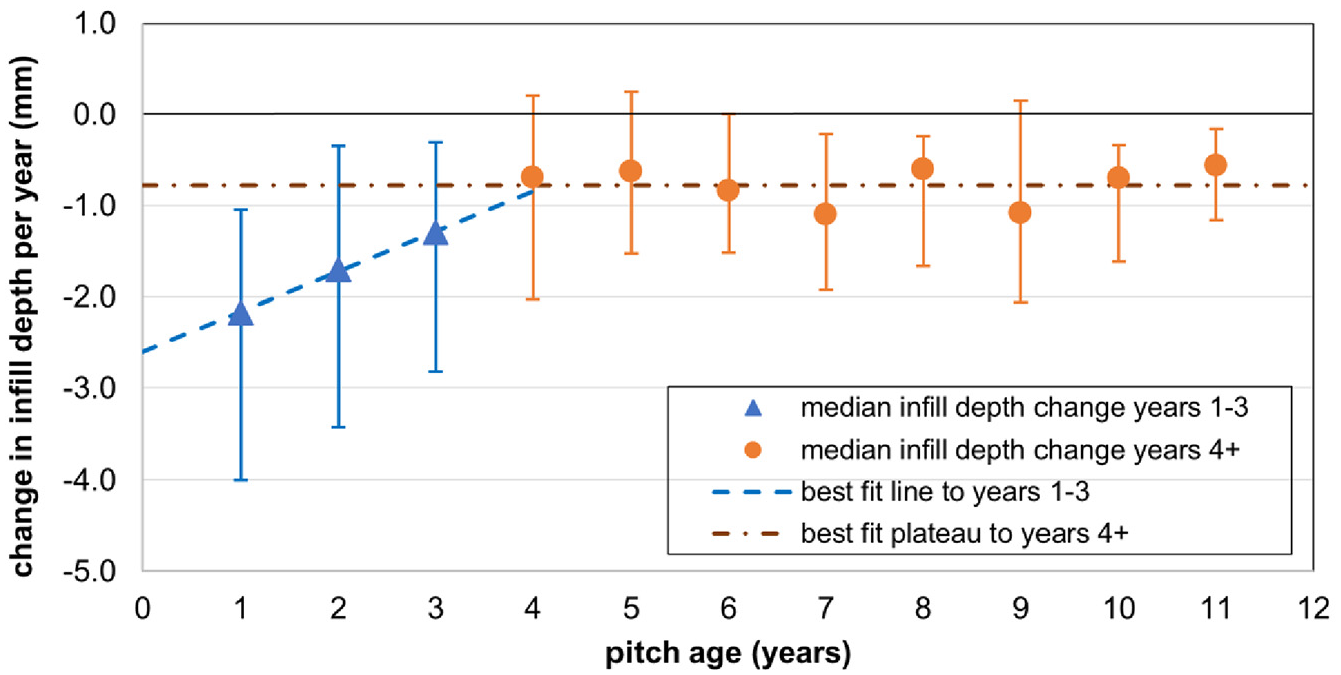
Change in infill depth per year as a function of AT pitch age. The circles represent the median loss and the error bars the interquartile ranges. The best fit line to the data for pitches 1 to 3 years old and best fit plateau to pitches 4 to 11 years old are indicated by the dashed lines. The median was considered a better representation of the ‘average’ loss per year, as the data set was not normally distributed.
As these pitches are in general maintained regularly it could be assumed that this average median change in depth of around 0.8 mm/year (year 4–11 for all pitches) is in fact infill ‘lost’ from the surface. Further analysis of the sub-sets of carpet fibre length, Table 4, suggests for longer pile carpets a relatively higher rate of infill depth change in the early life and a higher rate of ‘loss’ in later life.
Analysis of rate of performance infill loss from AT versus age, for pitches with different pile lengths.
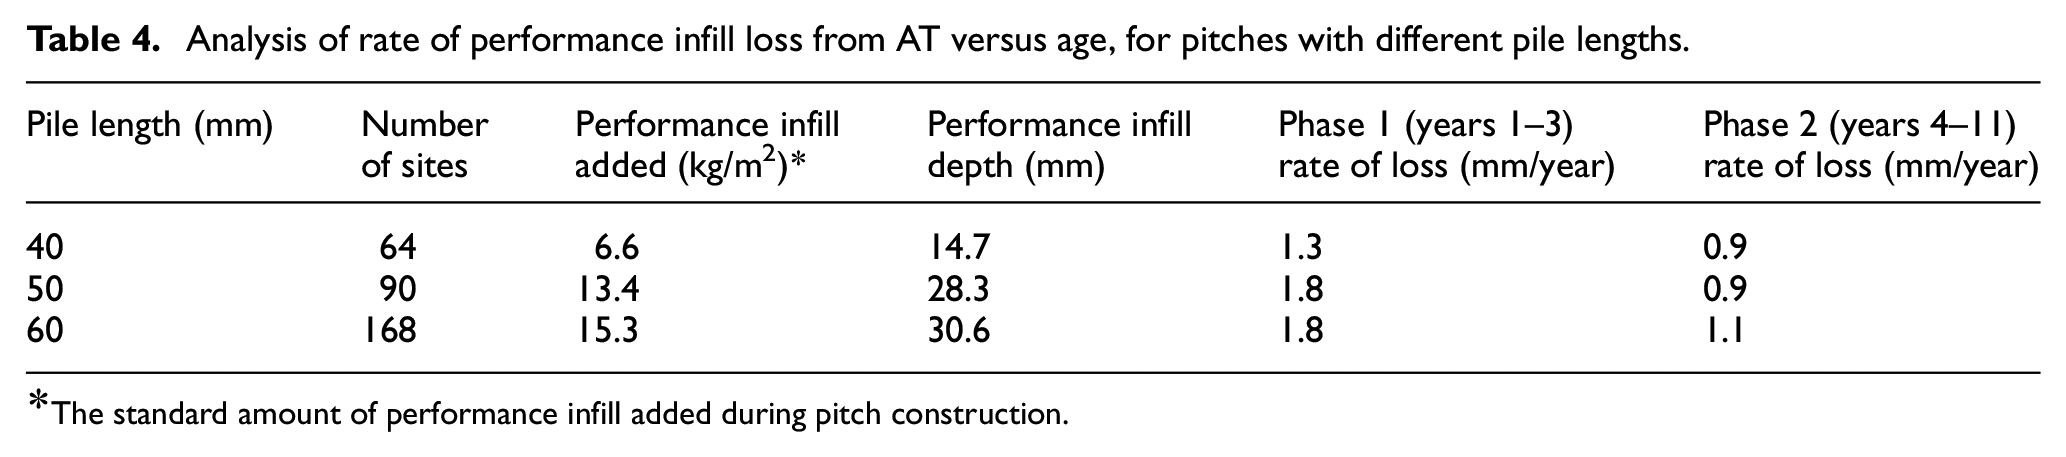
The standard amount of performance infill added during pitch construction.
Any loss of performance infill from the surface is expected to have a detrimental effect on several aspects of play performance, as more fibre is exposed there is less resistance to flattening and/or fracture. A severe loss of infill could be injurious to users, as boot studs may then penetrate too deep and meet much greater traction resistance from the stabilising sand layer or carpet base. Infill loss needs to be redressed to maintain playability and safety, by adding infill back to the surface, a process termed ‘top-up’.
Study 3B: Performance infill top-ups
The aim of this study was to evaluate the direct effects of a change in infill depth from a top-up process on the play performance test results. The top-up of performance infill adds a quantity of rubber crumb to the surface, estimated from the change in depth required, to counteract the systematic losses or a shortfall in relation to the specified depth.
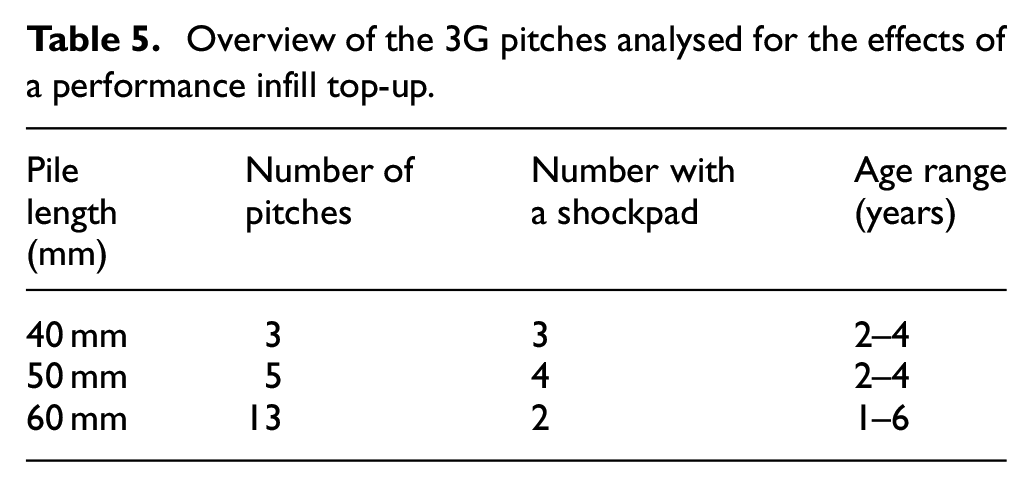
Play performance testing was completed immediately before and after top-up at a total of 21 full-sized pitches of varying age, adding varying quantities of performance infill (Table 5). At each field, a minimum of six locations were tested (see Figure 5(a) for test positions).
Overview of the 3G pitches analysed for the effects of a performance infill top-up.
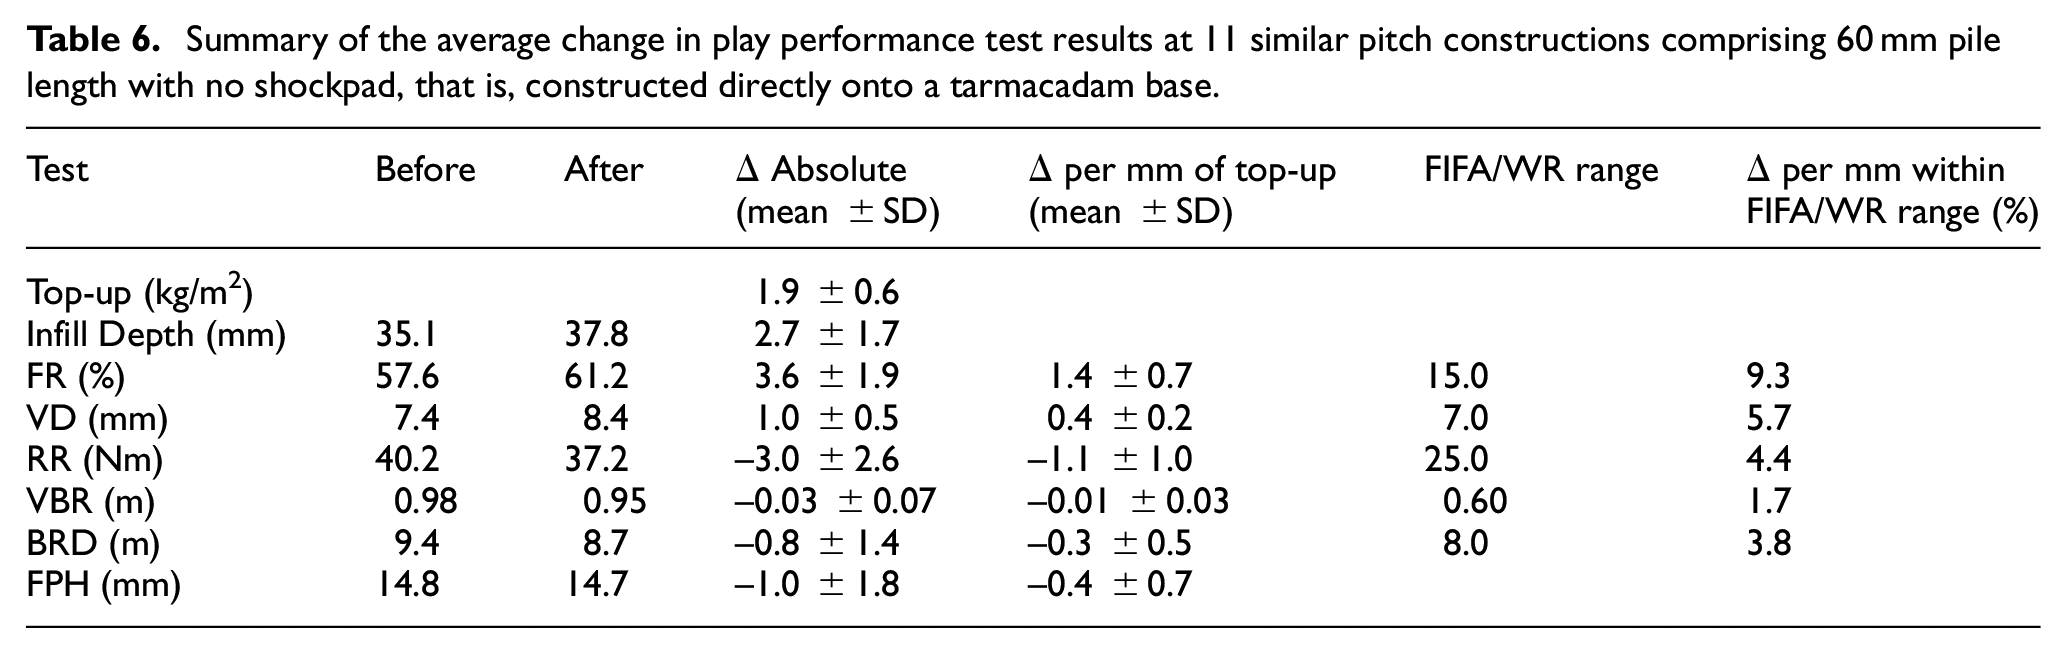
As expected, the addition of rubber crumb resulted in an increased force reduction (FR) and vertical deformation (VD), that is, increasing surface softness (see Table 6). For rotational resistance (RR) the addition of rubber crumb gave a reduction in peak torque. The 3G surfaces without a shockpad showed a larger improvement for these three tests relative to surfaces with a shockpad. In slight contrast the Vertical Ball Rebound (VBR) results showed little change until an extra 5 mm of infill depth or more was added, beyond which VBR decreased with increasing infill depth, the softer surface dissipating more impact energy.
Summary of the average change in play performance test results at 11 similar pitch constructions comprising 60 mm pile length with no shockpad, that is, constructed directly onto a tarmacadam base.
The predictive capabilities of the infill loss analysis (mm loss per year) were compared to the actual rubber top-up data from 10 pitches. The rate of infill depth loss as a function of pitch age data (given in Figure 10 above), was used to predict the total amount of top-up required for these pitches. These 10 pitches were not included in the rate of infill depth loss analysis (Study 3A) and all had negligible net change in infill depth across the analysed time period, that is, infill depths immediately post construction were near specification and remained so following the final top-up included. Overall, the predicted total loss of infill over the pitch life showed good agreement with the actual top-ups completed on the pitch (Figure 11) with the actual top-up tonnage within the inter-quartile ranges (IQR) of the predicted losses for all pitches. On average the model over-predicted the top up requirements by 1.0 ± 1.8 tonnes/year or 14% ± 25%; however, for pitches > 3 years old the predictions were much better at 0% ± 14%. The agreement tended to be better for the older pitches, where ‘real’ rubber loss represents the larger proportion of the infill depth loss compared to the younger pitches where infill settling has it seems a larger effect which is likely to be more variable between pitches (reflected in the larger IQR error bars for years 1–3 in Figure 9). Regardless, the key outcome from this analysis is further support for the relevance of the predicted rate of infill loss data presented in Figure 10.
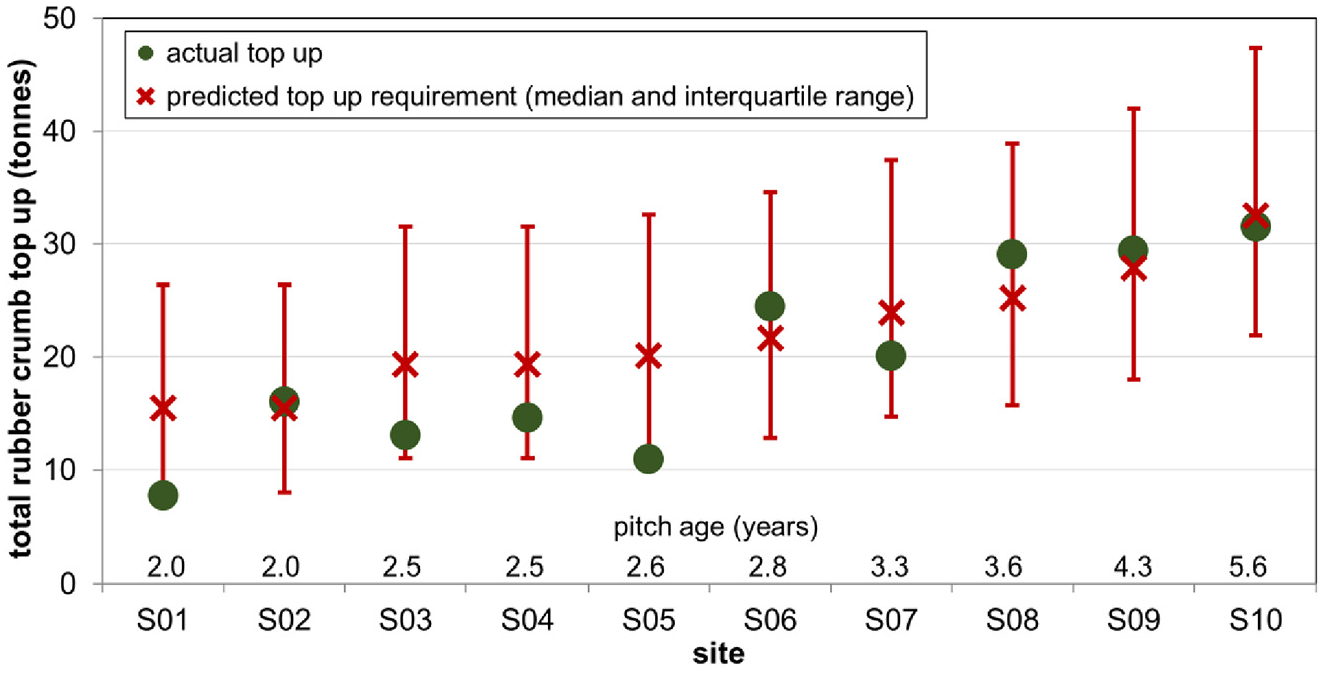
A comparison between predicted total loss of infill for a pitch over its life (in tonnes) and the actual recorded top-ups applied to the pitch over its life (all data has been normalised to an equivalent pitch size of 6500 m2). The results for 10 pitches are presented with the pitch age increasing from left to right.
One limitation of the top-up analysis should be recognised. A light decompaction was routinely performed immediately prior to the top-up, with the pre- measurements all taken before this decompaction process. Hence, the results obtained represent the combined effects of this decompaction and the top-up, and not entirely due to an extra thickness of rubber infill layer.
Study 4: Deep decompaction
The aim of this study was to evaluate the effect of this deep decompaction process, targeting the lower infill, on the play performance test results. This deep decompaction is much more aggressive and deeper compared to that performed as part of the more routine Powerbrushing and decompaction process, reaching depths to within 5-10 mm of the carpet backing.
Two methods of deep decompaction were evaluated, both of which are in regular use by the maintenance company. The SMG ‘Rototine’ machine has rotating tine bars, and the other method comprises a static front raking system which requires multiple passes to penetrate to the performance infill fully. The field play performance data collected before and after the processes was undertaken at seven pitches, with a mix of five or six test locations dependent on pitch size (Figure 5). The seven pitches studied comprised six with a 60 mm carpet, of which two had a shockpad, and one with a 40 mm carpet and a shockpad.
The results indicated that the largest changes observed were from the ball-surface interaction tests. Expressed as the average percentage change within the FIFA range, the ball roll distance (BRD) reduced by 37% (p < 0.001) and vertical ball rebound (VBR) reduced by 38% (p < 0.001). The player-surface interaction performance tests produced smaller but still highly significant changes; rotational resistance (RR) reduced by 26% (p < 0.001), force reduction (FR) increased by 12% (p < 0.001) and vertical deformation (VD) increased by 14% (p < 0.001). Free pile height (FPH) increased by 3.2 mm (p = 0.06).
The effect of this deeper agitation of the infill(s) follows the same pattern of changes in measurements as the lighter regular powersweep and decompaction although of larger relative magnitudes. A deep decompaction intervention is not usually deployed until the pitch hardness becomes an issue that regular lighter decompaction cannot resolve. This intensive process is visually observed to heavily disturb the infill (rubber and sand) and it would be highly relevant to monitor further the longevity of these observed improvements in play performance.
Discussion
The collective results from the individual studies conducted on the maintenance techniques have been utilised to update the original conceptual pitch degradation model (Figure 2) to a conceptual pitch degradation model with quantified maintenance benefits (Figure 12). The effectiveness of each maintenance intervention has been quantified for each of the play performance parameters (e.g. vertical ball rebound) and linked to the relevant system performance parameter (e.g. pitch hardness). The deep clean process was not investigated, however, and comments remain qualitative in the expected benefits. The degradation factors and mechanisms in the updated model remain the same, albeit the mechanisms have been re-ordered to provide a more logical flow of the primary connecting links. In addition, the term consolidation has been changed to compaction, to accord with the usual naming convention of the maintenance techniques and to reflect more accurately the mechanism of ‘compaction’ (reducing air voids in a particulate system).
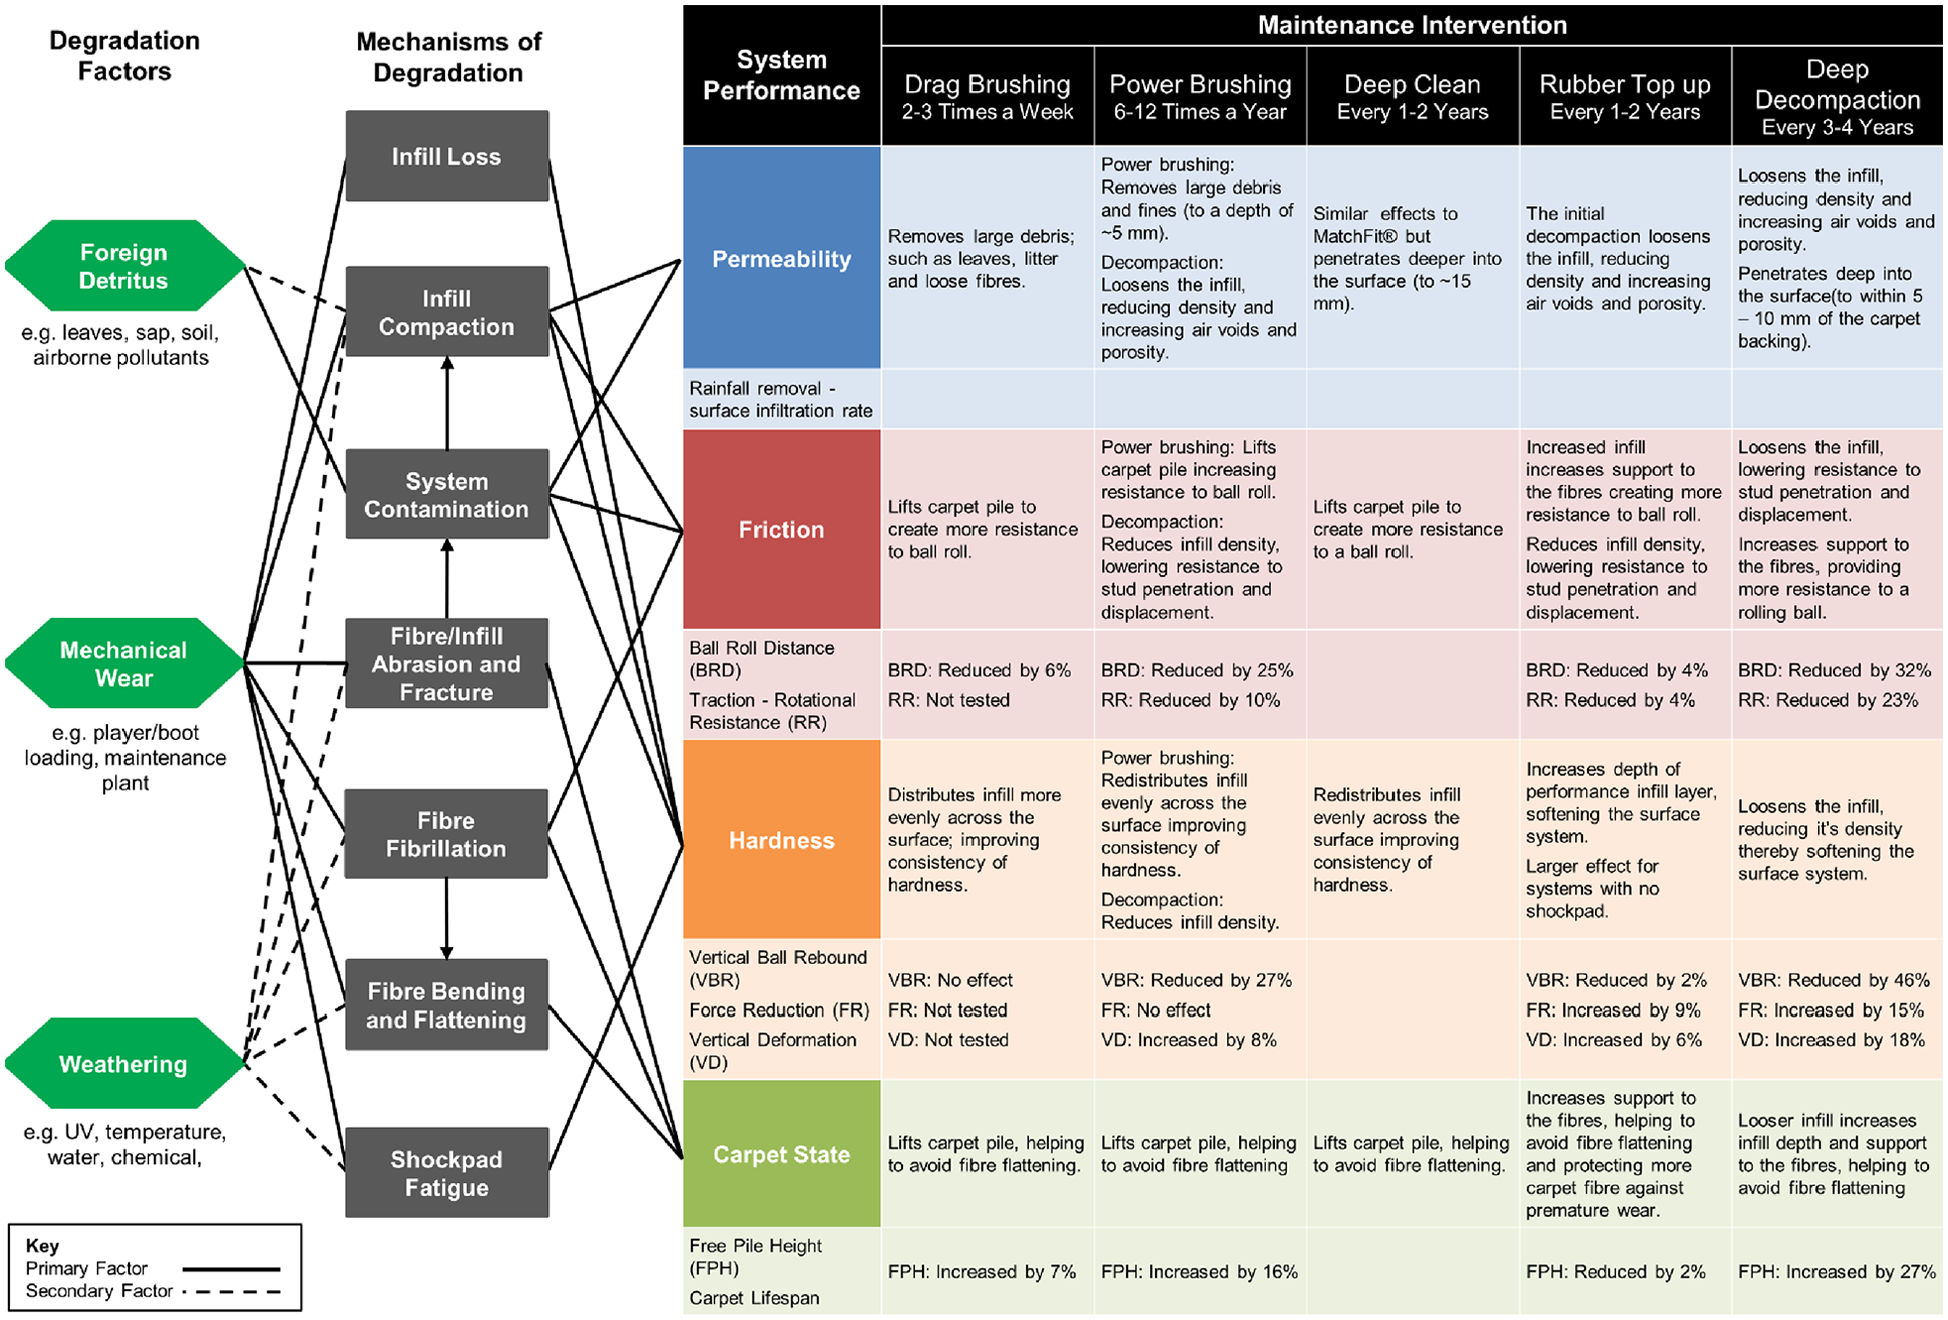
Pitch degradation and maintenance model. Includes the degradation factors and mechanisms which cause the performance of 3G pitches to decline and the intervention maintenance processes aimed to help mitigate degradation. The effectiveness of the interventions, where evidenced in this research programme, are presented as the average change in performance expressed as a % of the FIFA range (see Table 1 and 18 ). The effectiveness of the rubber top-ups is expressed as the average change in performance per mm of infill added. Note, permeability was not measured at any of the fields as part of this work.
The system performance descriptors also remain similar; however, ‘wear’ has been changed to ‘carpet state’ in the updated model to reflect the observation that in many cases fibre flattening is considered a greater problem than fibres wearing down in length. In 3G AT systems manufacturers of yarn and carpets have increasingly attempted to innovate systems with a softer ‘feel’ to reduce concerns around player skin burns. 21 However, less abrasive and softer fibres have greater susceptibility to permanently flatten, consequently many currently used fibres incorporate a stiffening structure such as a spine, somewhat mimicking natural turf leaf.
The data on the effectiveness of each maintenance intervention has been expressed as a percentage change within the FIFA (Quality) range (Table 1 19 ). This representation inflates the size of change compared to reporting the absolute change and/or absolute percentage change (i.e. the change relative to the original value). However, using this form of ‘relative change’ is considered particularly helpful when explaining to the variety of stakeholders the ‘relative effect’ of maintenance techniques and avoids the need to constantly refer to the allowable (FIFA) range if absolute values are used to provide the context.
The model can be used in several ways, by different stakeholders. Where a pitch is due to undergo any form of official accreditation testing, for example, for FIFA, the model can support the selection of maintenance requirements in advance to ensure that the pitch meets specific criteria (e.g. ball roll distance), and where larger changes are needed a more invasive (and costly) technique may be required. Owner/operators clearly need to budget for top-up of the performance infill and can usefully apply the model to make informed decisions forecasting when these may be needed and to review cost estimates from maintenance contractors. The owner/operator can also use the model to support planning for pitch end of life and replacement, by considering the potential performance improvements and associated costs to extend the life of the current pitch versus replacing it. These decisions are, however, predicated on a regular suite of tests to monitor the ‘health’ of the pitch system.
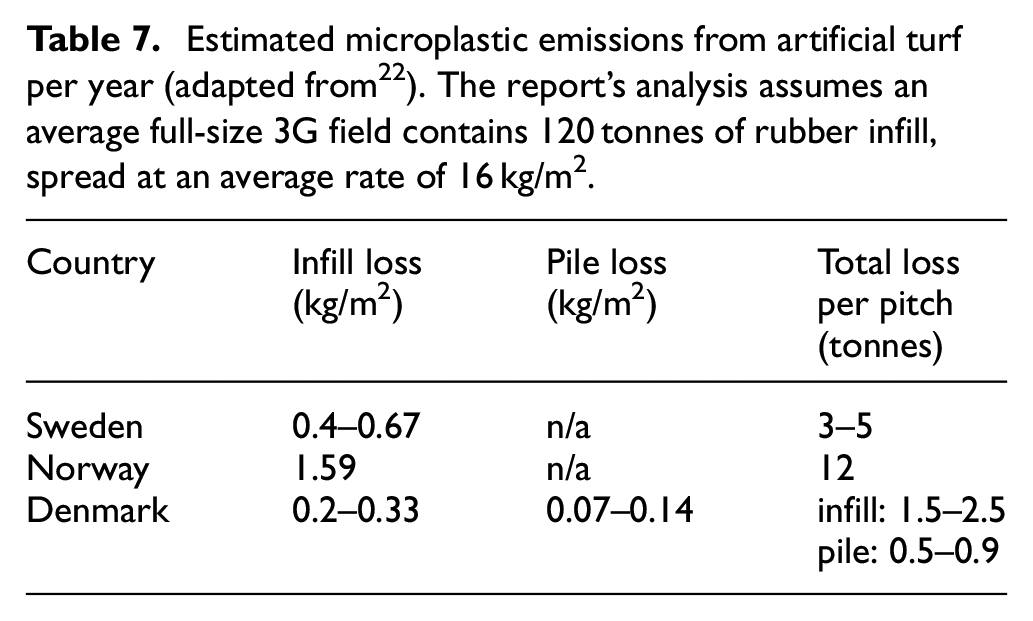
The data on the rate of infill loss with pitch age represents a significant contribution to the current topical debate on the rate of migration of microplastics from sports fields, that is, the loss of rubber particulate infills to the surrounding environment. Corroboration of rate of infill loss (an approximate average of 0.8 mm/year after year 3 or 4) with the recorded top-ups across a range of sites of varying age is also considered a significant finding and advances the robustness of related published studies summarised in recent European guidance (Table 7). 22
Estimated microplastic emissions from artificial turf per year (adapted from 22 ). The report’s analysis assumes an average full-size 3G field contains 120 tonnes of rubber infill, spread at an average rate of 16 kg/m2.
A general limitation of this research programme, however, is the inability to benchmark the effectiveness of the suite of maintenance intervention effects against the expected rate of degradation of a typical sports surface. The database of pitches mined for this study, and the bespoke field investigation programmes, are considered representative of fields that receive regular maintenance. Consequently, the size of effect of some interventions may seem rather small; however, if not regularly applied the rate of loss of functionality and play performance is expected to accelerate. Ideally investigations would have included poorly maintained fields to estimate the rates of degradation with little or no maintenance, however, this was not practicable within the project scope.
A further limitation lies within the continuously changing technologies used for 3G fibres and yarns. Without manufacturers providing very specific guidance as to the detailed aftercare required it becomes a significant challenge for facility managers and maintenance contractors to fine tune the programme of generic interventions for a given installed system.
One key degradation mechanism requiring attention for maintenance is identified as ‘pile flattening’. Pile flattening, or a reduction of ‘free pile height’, causes a loss of resistance to ball roll making surfaces ‘quicker’ and harder for players to control passing and receiving of the ball for example. Regular drag brushing, potentially every day, was demonstrated to be vital in reducing the rate of this degradation. Powerbrushing, to variable depths, was also demonstrated to enhance lifting the pile and reducing the ball roll distance. Further work is required, however, to provide more detail for different yarn types and the more explicit effects of intensity of pitch usage and also if more aggressive brushing may lead to significant premature damage to fibres and shorten the lifespan of the turf system.
A second key degradation mechanism is increasing surface hardness, primarily thought to be caused by compaction of the infill. Regular agitation of the infill was demonstrated to be vital in restoring performance. In addition, vertical ball rebound measurements were more sensitive to decompaction than the ‘Force Reduction’ measure, thought due to the lower impact energy of the ball relative to the Field Tester and supports previous work on the challenges of effectively measuring the effects of decompaction insitu. 18
The new pitch degradation and maintenance model is considered an important step in communicating to all stakeholders the why, how, and what benefits are achievable with regular maintenance. It also highlights the simple tests facility groundsmen can carry out to monitor the effectiveness of maintenance regimes and provide useful in-house knowledge regarding the playing state, or ‘health’, of their 3G pitch. Simple testing of ball roll distance and ball rebound have both been highlighted as particularly useful indicators of pile flattening and increased hardness from compaction or infill loss, two key mechanisms of surface degradation. If these simple tests were performed regularly, coupled with infill depth measurements across the surface, facility managers could directly benefit from a more data informed decision-making approach to setting appropriate maintenance budgets.
The objective pitch degradation and maintenance model represents a major step forward in describing, explaining and verifying the suite of routine commercially available maintenance processes and their directly measurable benefits. Furthermore, the data underpinning the findings are unique, and collectively provide an original contribution to the ongoing debates around the effective maintenance of 3G artificial turf surfaces.
Conclusion
The maintenance of AT pitches has been under-resourced over many years, predicated by a poor understanding of the direct benefits, and anecdotally many fields were sold on a maintenance free basis. Few research studies have investigated maintenance effects, and the exceptions have been limited to programmes that were small-scale and comprised short-term monitoring programmes.
This study has mined a database of 3G pitch performance data across hundreds of pitches up to 15 years old and carried out a series of unique and intensive field studies testing before and after maintenance interventions at a number of selected sites. The data has been used to corroborate mechanisms of pitch degradation and the influencing factors as well as quantifying the effects of maintenance interventions.
A new pitch degradation and maintenance ‘model’ has been produced. The model attempts to show the primary links between the degradation factors, the mechanisms of degradation, and quantifies maintenance intervention effects on specific aspects of play performance. The maintenance interventions quantified cover the generic categories of grooming, cleaning, decompaction and infill top-ups. Notably, the research reported here also quantifies an expected rate of ‘loss of infill’ from a 3G AT field, adding robust data to the debate around migration of micro-plastics from 3G artificial turf fields.
Footnotes
Acknowledgements
The data collected, analysed and presented in this paper was the result of a ‘Knowledge Transfer Partnership’ between Loughborough University and Technical Surfaces Ltd, funded by Innovate UK and Technical Surfaces Ltd. (KTP No. KTP009920)
Declaration of conflicting interests
The author(s) declared no potential conflicts of interest with respect to the research, authorship, and/or publication of this article.
Funding
The author(s) received no financial support for the research, authorship, and/or publication of this article.