
Abstract
Analysis of video and speed data is used to evaluate the efficiency of human underwater flykick. The authors show that by coupling Lighthill’s theory of fish locomotion with human musculoskeletal modelling, it is possible to evaluate the effectiveness of the mechanical and hydrodynamic propulsive components of human underwater flykick. This allows the effect of subtle variances in technique to be assessed by measurement of athlete motion alone. This is demonstrated in an experimental case study of an elite athlete performing two different techniques; one more knee-based or thunniform, and the second more undulatory or carangiform/anguilliform. In finding the mean kinematics of each technique, it is first shown that maintaining stroke-by-stroke consistency of technique leads to an increase in propulsive efficiency. It is further demonstrated that in changing technique, an athlete may swim at the same kick rate but have different propulsive efficiency. This demonstrates the need to determine the energy cost in order to evaluate differing techniques. For the sprint athlete in this case study, it was shown to be more effective to swim with a thunniform technique when at higher velocities and a more anguilliform at lower velocities.
Keywords
Introduction
Underwater flykick – often called underwater undulatory swimming (UUS), dolphin kick or the fifth stroke – is a form of human underwater swimming with techniques and strategies as varied as names. It is typically considered the fastest form of human swimming and consequently limited to
It is typically opinion and intuition that are used to coach the swimmer, leading to differences in technique. For example, with regards to best technique, Von Loebbecke et al. 4 attribute most of the propulsive forces within the stroke to the region from just above the ankle to the toes and conclude that foot motion and ankle flexibility could have a large impact on performance. By contrast, Cohen et al. 5 suggest that ankle flexibility has little impact on net streamwise forces. It is therefore desirable to compare the effectiveness of variations in underwater flykick technique.
Drawing on experience of naval architecture, the aim of the work presented is to combine knowledge of hydrodynamic mechanisms, which convert specific human body motion into propulsion, with an inverse analysis that infers the necessary human muscular activity required to generate such a motion. The achieved propulsive efficiency is thus deduced by relating useful output power to the actual muscular power required. This should also serve to narrow the gap between computation biomechanics and the actual human physiological energy expenditure, which Wei et al. 1 describe as remaining elusive.
Through indirect measurements, the authors demonstrate that the component stages of human underwater propulsive efficiency can be simulated using physics-based models. The influence of specific and often subtle changes in technique can then be understood through measurement of underwater motion alone, rather than by a more generalised equation based on kick frequency and forward velocity. A demonstration of this process is presented here in the form of a case study of a
Ethical approval from the University of Southampton (FoHS-7207) and informed consent from the participant was sought prior to this study.
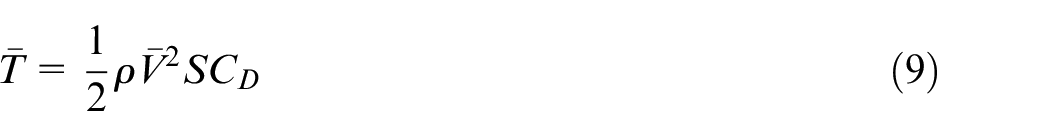
Flykick propulsive efficiency
The change in technique arises through a change in the athlete’s kinematics, illustrated by the overlaid images in Figure 1. The images are aligned horizontally at the head for each technique, respectively, and vertically at the head between the two figures, as indicated by the dashed-dotted line. To compare the two, the maximum vertical displacement envelope of the hips in
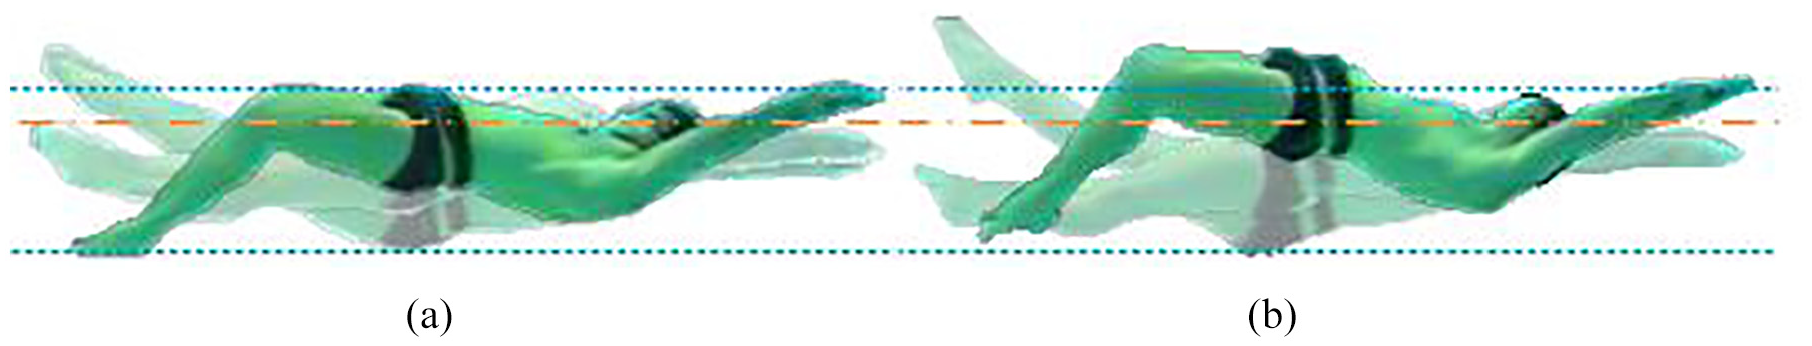
Comparison of body position at three instants through an underwater flykick. These correspond to maximum and minimum vertical range of toes as well as a near horizontal mid position. Images are centred on the head: (a) Technique 1 – thunniform, a more knee based kick and (b) Technique 2 – carangiform/anguilliform, whole body motion creates greater range of travel of feet.
Anguilliform, carangiform and thunniform are terms used to describe fish kinematics,
6
with a decreasing amplitude of oscillation towards the head, respectively. The same terms have similarly been used to describe styles of human underwater swimming (e.g. Hochstein and Blickhan
7
). The first technique used here
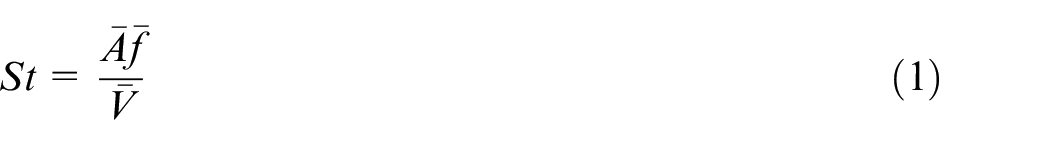
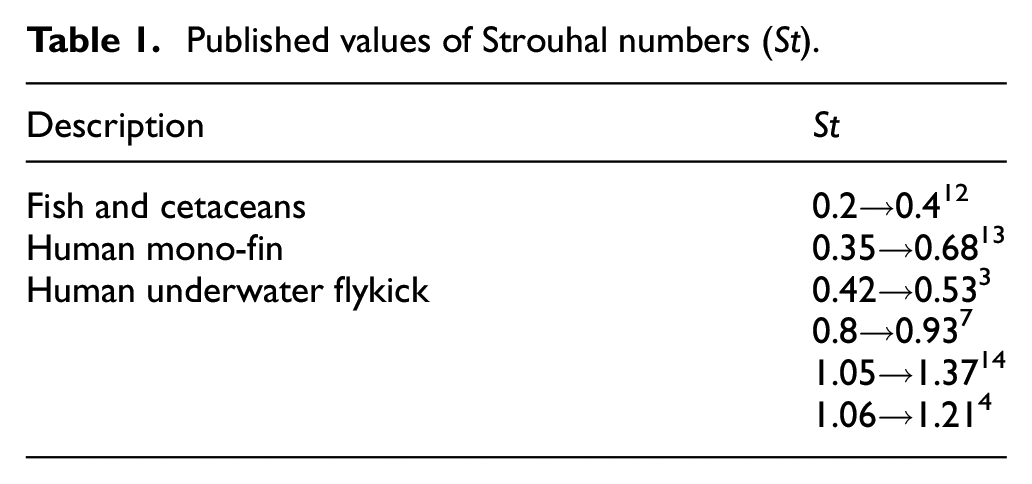
The swimmer’s motion occurs due to specifically timed muscle contractions, which develop a rearward wave-like motion that travels along the body. A propulsive thrust (body reaction) is produced, associated with the fluid momentum created. Consequently, the muscle contractions have to both move the limbs and work against the resistance to motion caused by the surrounding fluid. The swimmer’s speed will be determined by the balance of thrust through the cycle against the resistance (or drag) of the body. The oscillatory motion of a swimmer’s flykick can be characterised in terms of a Strouhal number (St) shown in equation (1) which relates how fast vortices are being generated (due to the oscillations of the feet) and the space between them. 8 In the context of human swimming this is often presented as
where
Published values of Strouhal numbers (St).
The powertrains of human swimming have been described by Daniel
15
and Zamparo et al.
16
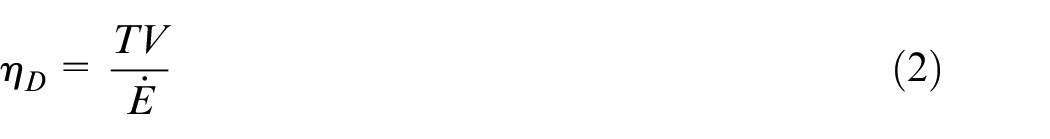
Each stage of power transfer needs to be matched to the next in order to achieve a maximum overall efficiency, which typically for ships is expressed in terms of the ratio of effective power
where
Lighthill 17 and comparatively more recently Singh and Pedley 18 provide a theoretical approach to determining these forces for fish propulsion. Although there is potential to overestimate force magnitudes, it typically replicates the correct mean and trends19,20 and is many orders of magnitude more rapid 21 than computational-based methods as covered by the review paper by Wei et al., 1 with computational fluid dynamics (CFD) examples such as Von Loebbecke et al. 4 or smooth particle hydrodynamics of Cohen et al. 5
Determining the relationship between muscular effort and propulsive thrust has been attempted for some swimming strokes using land-based machines. These measure the effective power delivered by an athlete and also their energy consumption by monitoring oxygen consumption
Recent developments have seen the use of an inverse approach applied by a computational musculoskeletal model. This method infers the muscle forces necessary to develop a given kinematic motion and estimates each muscle’s necessary length and activity. 27 Here, the muscle activity is defined as the force in each muscle normalised by the maximum force it can produce. Umberger 28 and Umberger et al. 29 found good agreement with experimental data when combining the energy of the mechanical element of the muscle with estimates for thermal energy liberation to evaluate total muscle energy expenditure. Langholz et al. 30 compared three musculoskeletal models to inform swimming analysis, finding the AnyBody modelling system 31 as the most sophisticated and favourable for investigations with focus on the interaction between the body and the environment. Earlier work in Japan coupled the SWUM model 32 with an AnyBody musculoskeletal model to investigate surface swimming,33,34 finding sufficient agreement between experimental and simulated results. The AnyBody modelling system has also been used to develop the model in this study.
Using the fluid force and musculoskeletal data, the propulsive efficiency

The input chemical energy is converted into mechanical work out by the muscles
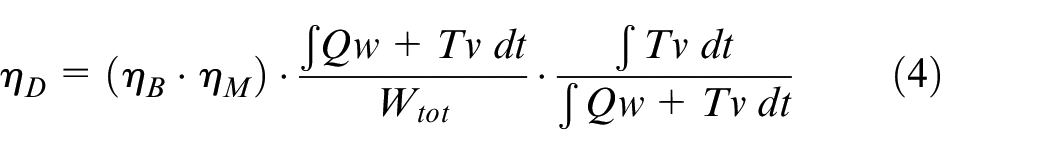
The propulsive efficiency (the authors’ metric of interest) is therefore the product of
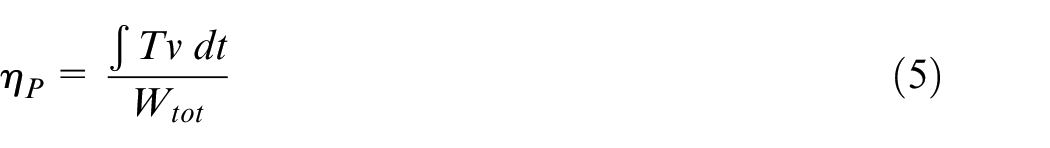
Here,
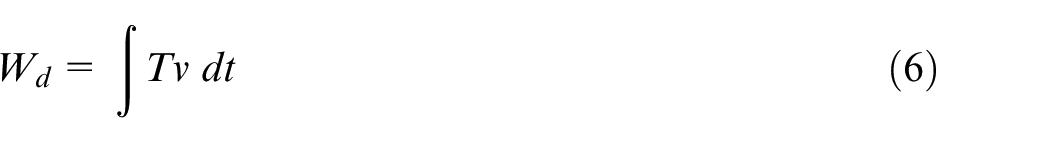
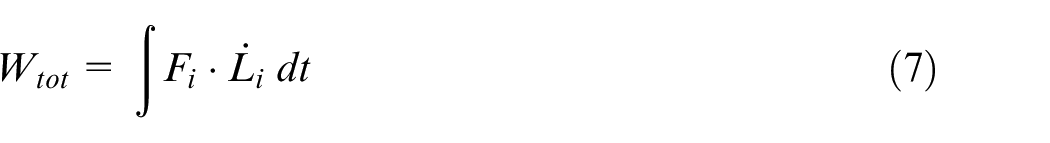
where
Experimental video and data capture is able to record the athlete’s motion, as well as measure their speed.35,36 Using these data as inputs, the remaining parameters in equations (6) and (7) can be estimated and hence
Experimental case study
A world-class elite male backstroke specialist (height 1.82 m and mass 84 kg) performed the two techniques,
The second
Synchronised image and speed data required for the study were acquired using a pool-based system.13,21,36 As the body motion in underwater flykick is assumed symmetrical about the sagittal plane, two-dimensional kinematics were acquired from a submerged camera moving with the swimmer.
While the athlete performed the two techniques, their speed was measured by means of a trailing low-stretch, lightweight line and a rotary encoder. The line was connected to the athlete by a thin strap around their waist, in such a way as to not impinge on their motion. It was then wound around a reel connected to a rotary encoder, with a small resistance applied to prevent over-spin. The rotary encoder converted the 250 pulses per revolution of the encoder into a linearly varying analogue voltage. This analogue source was calibrated and connected to a laptop via a 6009 NI™ USB analogue data acquisition board. The speed and video data were acquired and recorded at 250 and 25 Hz, respectively.
Kinematic processing
A MATLAB 37 script was used to analyse the kinematics of the 10 leg kicks by digitising the acquired video for the corresponding run. The joint centres and anatomical locations were selected in each frame. These are comprised of the tip of the toes, ankle, knee, hip, shoulder, wrist and fingertip. The elbow location is selected in the first frame and assumed to maintain a constant relative location between the shoulder and wrist throughout a run. Two consistent points are also selected on the upper and lower pelvis to provide its orientation (see Figure 2). The beginning of the up-kick signified the start of each cycle. The first phase of the cycle is, therefore, the extension of the knee joint and upwards movement of the toes until full extension is achieved. The second phase is the recovery of the legs initiated with knee flexion. The athlete’s joint angles are defined using the joint coordinate system of the International Society of Biomechanics (ISB) 38 and used by AnyBody.
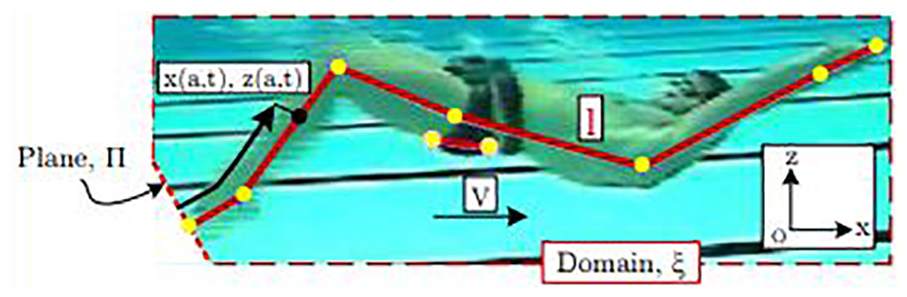
Lighthill reference system. Points indicate the digitised locations from which the joint angles are derived.
To explore the characteristic kinematics of
To gain greater insight into the concept of tuning the kinematics around the synthesised
Hydrodynamic forces: Lighthill’s theory
Lighthill
17
analysed the thrust generation of fish using a momentum conservation approach. Numerically, this can be achieved by sectioning a fish or swimmer into
For the prescribed kinematics, the thrust generated for propelling the fish through the water
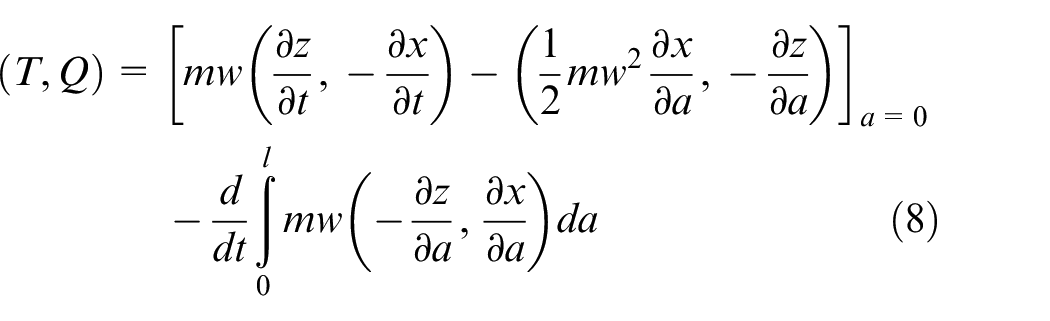
where
For
where
Using the initial mean speed for the respective technique, the Lighthill simulation was executed to calculate the mean thrust, and based on the previously calculated drag coefficient, a new mean speed was estimated. This process was iterated until the mean speed converged (
Musculoskeletal model
Figure 6 shows the musculoskeletal model scaled to the height and mass of the athlete. As the influence of the arm motion would be small, these were excluded. Table 2 details the number of simulated muscles in groups and other kinematic components divided between the body segments.
Audit of the musculoskeletal model.
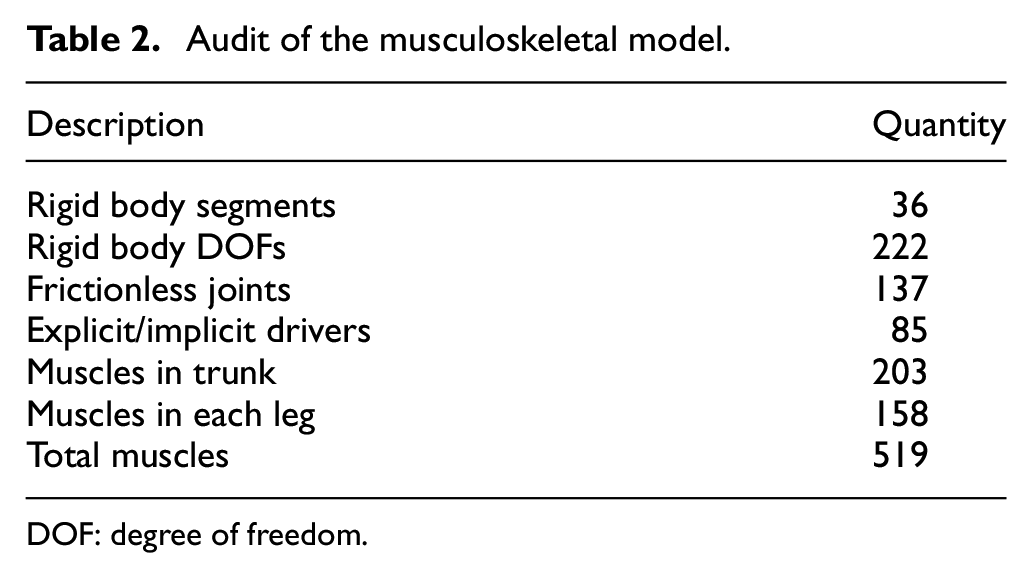
DOF: degree of freedom.
In order to deduce the muscle activities, AnyBody employs an inverse dynamics solver for which the kinematics and external forces must be defined. In this study, the driven kinematics were: the z-axis of rotation for the pelvis segment relative to the global origin; ankle-plantar, knee and hip flexion; and pelvis-thorax extension. The model had over-determined kinematics since there are more muscles than degrees of freedom. The AnyBody default third-order polynomial recruitment solver
39
was used to estimate the normalised muscle activity of each muscle (
The muscles were collated into groups associated with specific joint motions for later analysis. These included the flexors and extensors of the pelvis-thorax, hip, knee and ankle and core muscles.
Results and discussion
The Lighthill and musculoskeletal simulations took approximately 30 min to solve for each technique (10 kicks per technique on a
Results from the simulations for
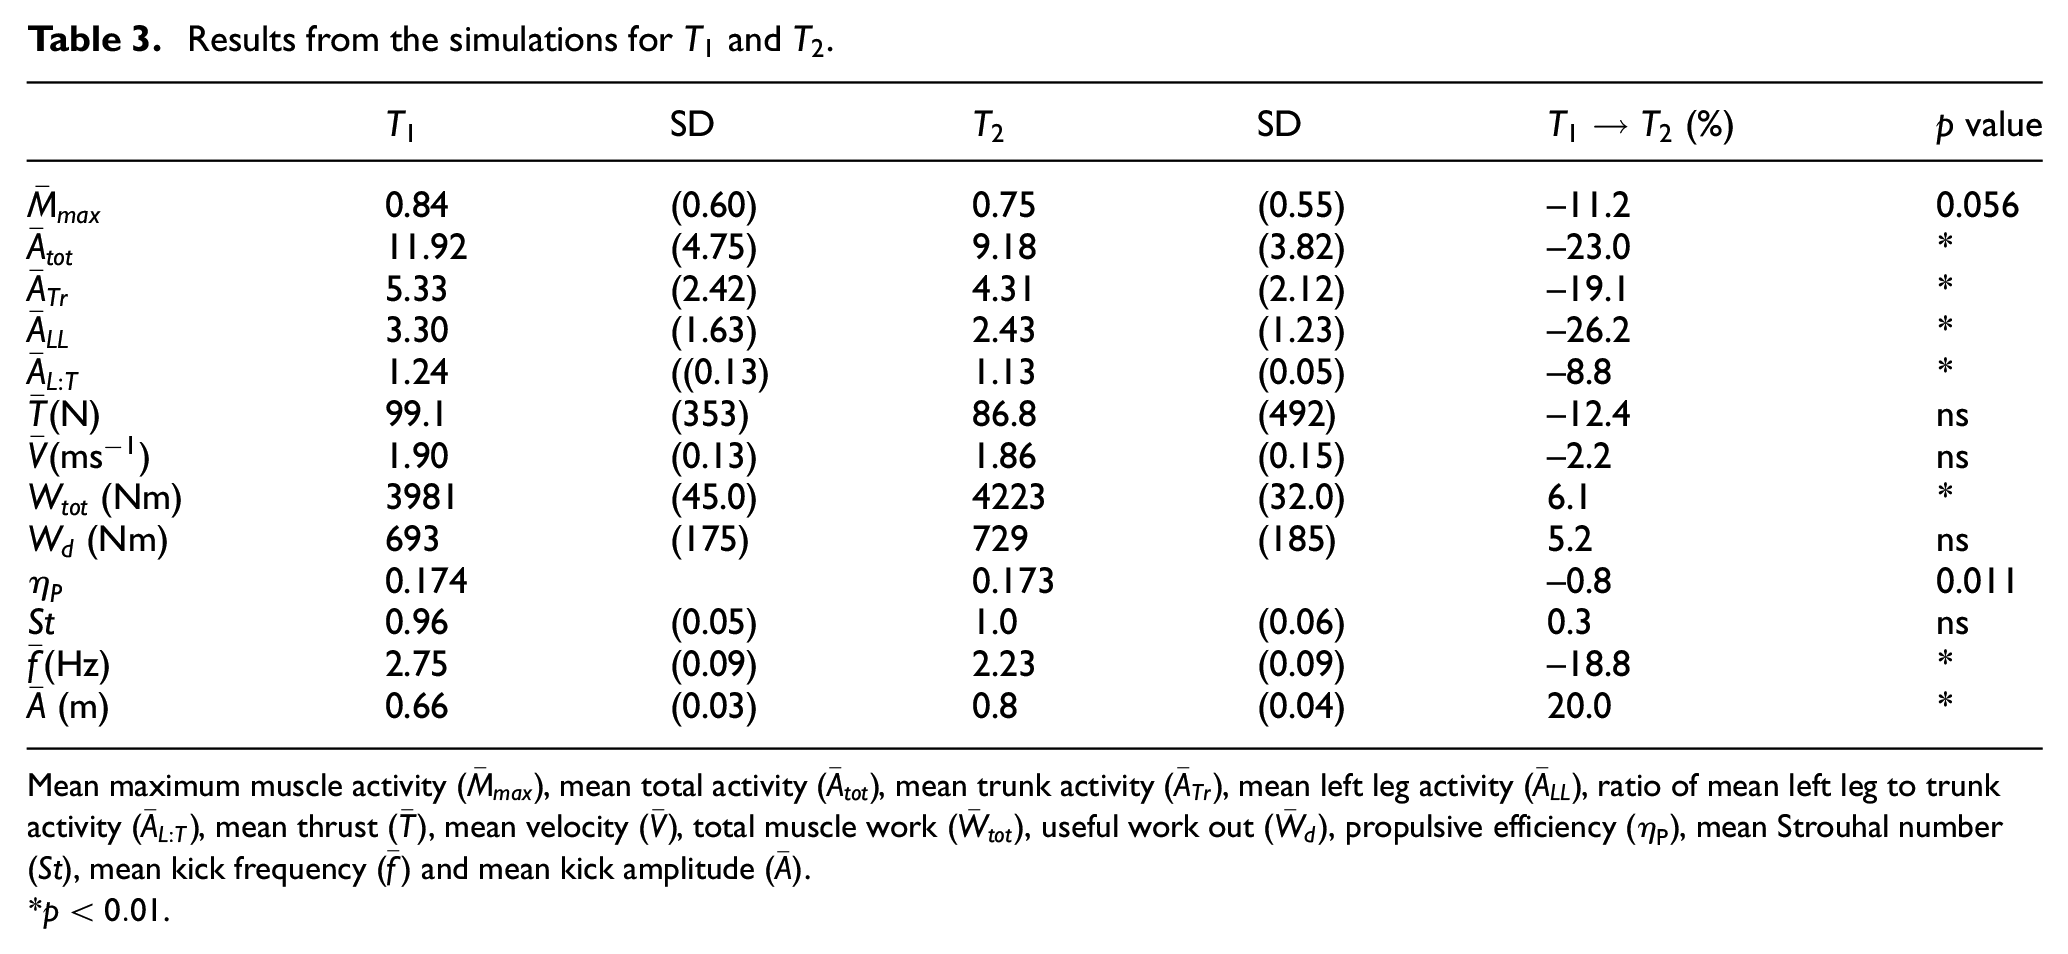
Mean maximum muscle activity
*
Despite a
For each technique, there are two peaks of positive thrust. Figure 3(a) shows the maximum coinciding with change of direction of the toes as the knee and hip joints begin to extend. This implies that the extension phase of the kick produces significantly more thrust than the flexion phase.5,41
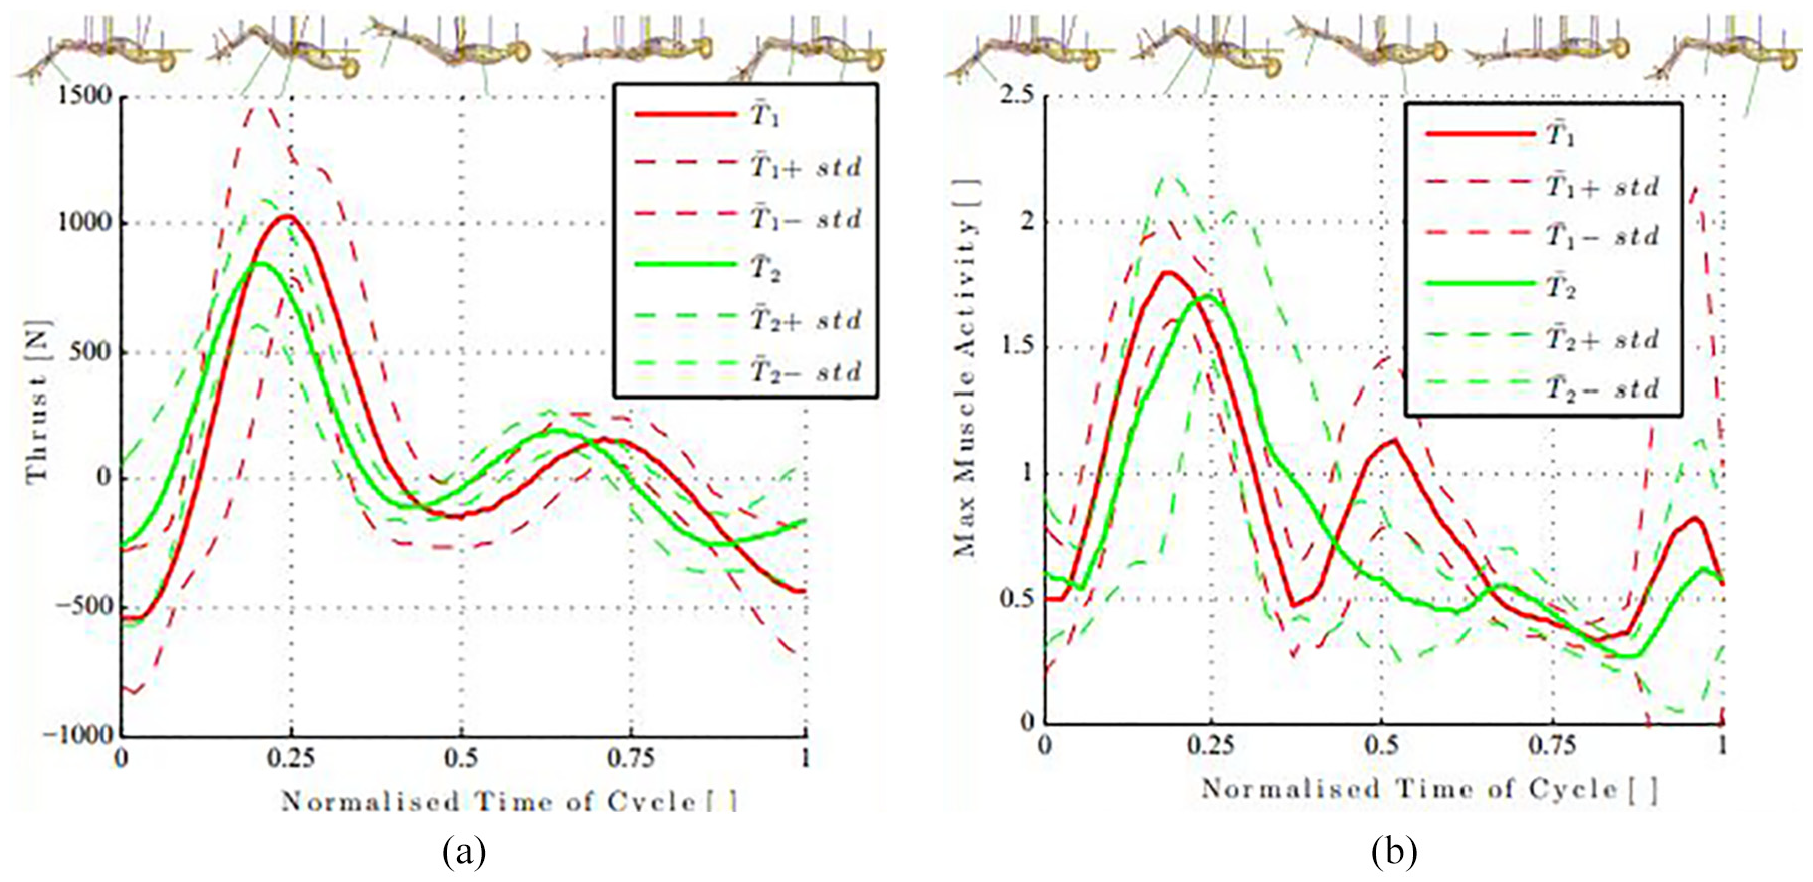
Normalised to one cycle: (a) shows the mean thrust for
It was found that for
From Figure 3(a), it can be seen that the peak of the mean thrust (standard deviation) from the
It is interesting to note that the Strouhal number has remained relatively unchanged, despite the changes in
The maximum muscle activity for these simulations can be seen to peak at roughly the same phase of the cycle as the peak thrust (Figure 3) as the knee begins to extend. There is also a smaller secondary peak in the maximum muscle activity for the first technique, which is not present in the second (Figure 3(b)). This occurs as the toes change direction from the extension phase to the flexion phase and the knee begins to flex. Upon inspection of Figure 3(a) and (b), it is apparent that the cycle is divided into a thrust, followed by a recovery phase. The first half of the cycle (the extension phase) generated 86.2% and 83.2% (
Using the musculoskeletal model, it is possible to investigate in more depth which muscles and muscle groups are being recruited at which part of the cycle and to what level of activity.
Figure 4 presents an example of the activity pattern of the combined muscles for the ankle joint. It shows the maximum activity of the grouped muscles coinciding with the maximum rate of joint angle motion. It also highlights the variation in motion between
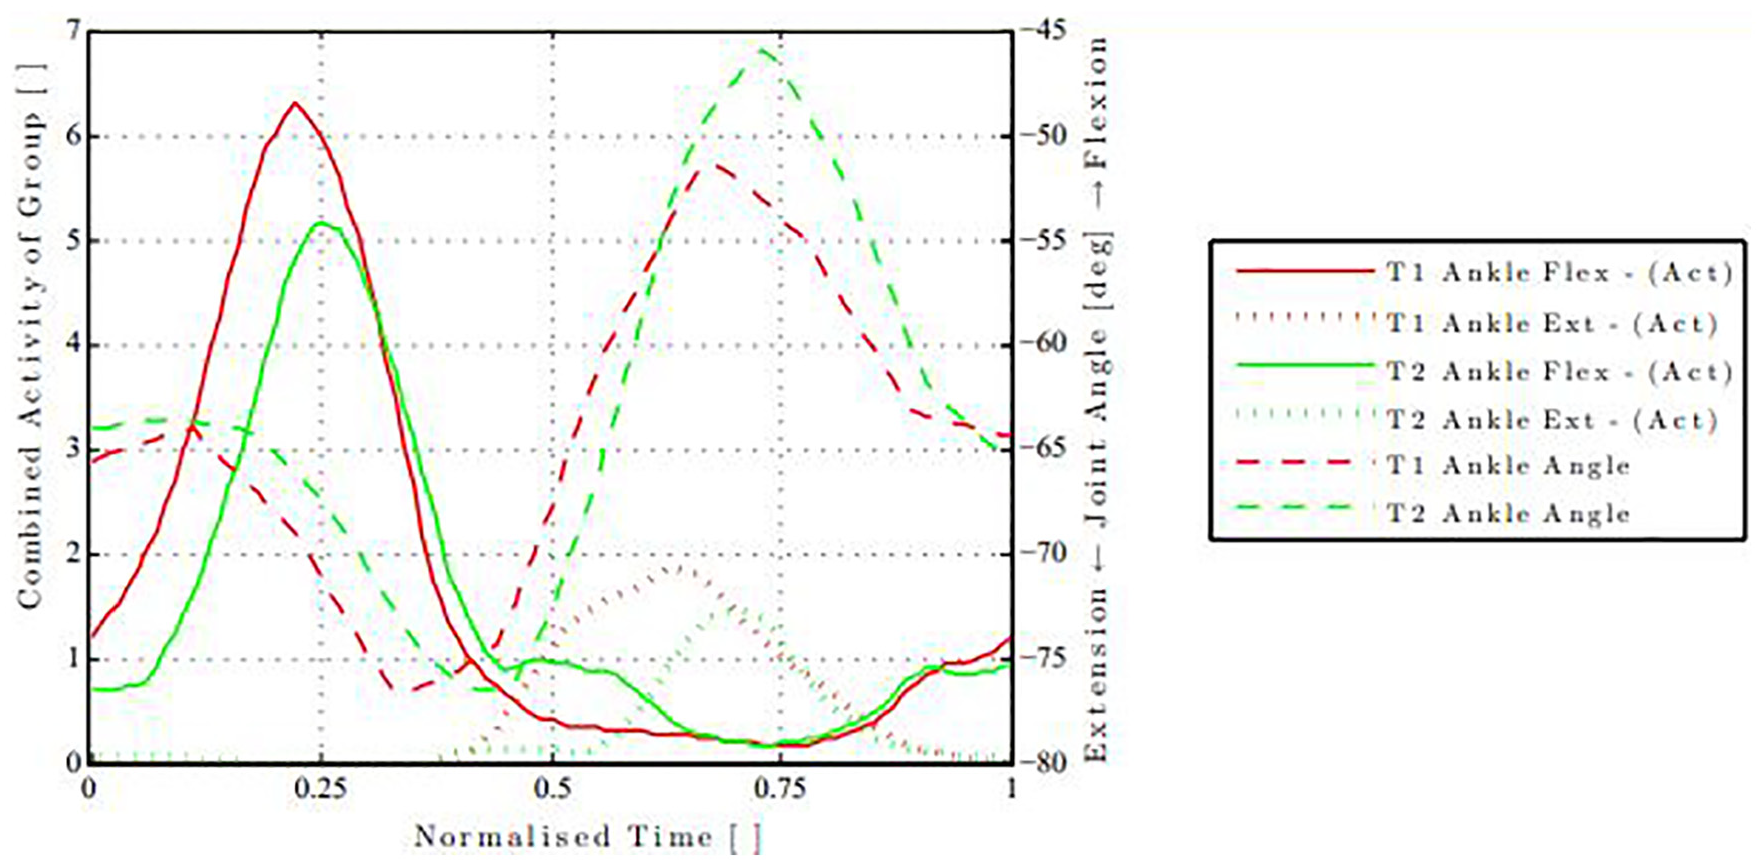
Flexor (solid) and extensor (short dash) activity of the ankle joint for
The activity for each of the combined muscles is shown in groups in Figure 5. An increase in combined activity can be observed in the core stabiliser muscles throughout
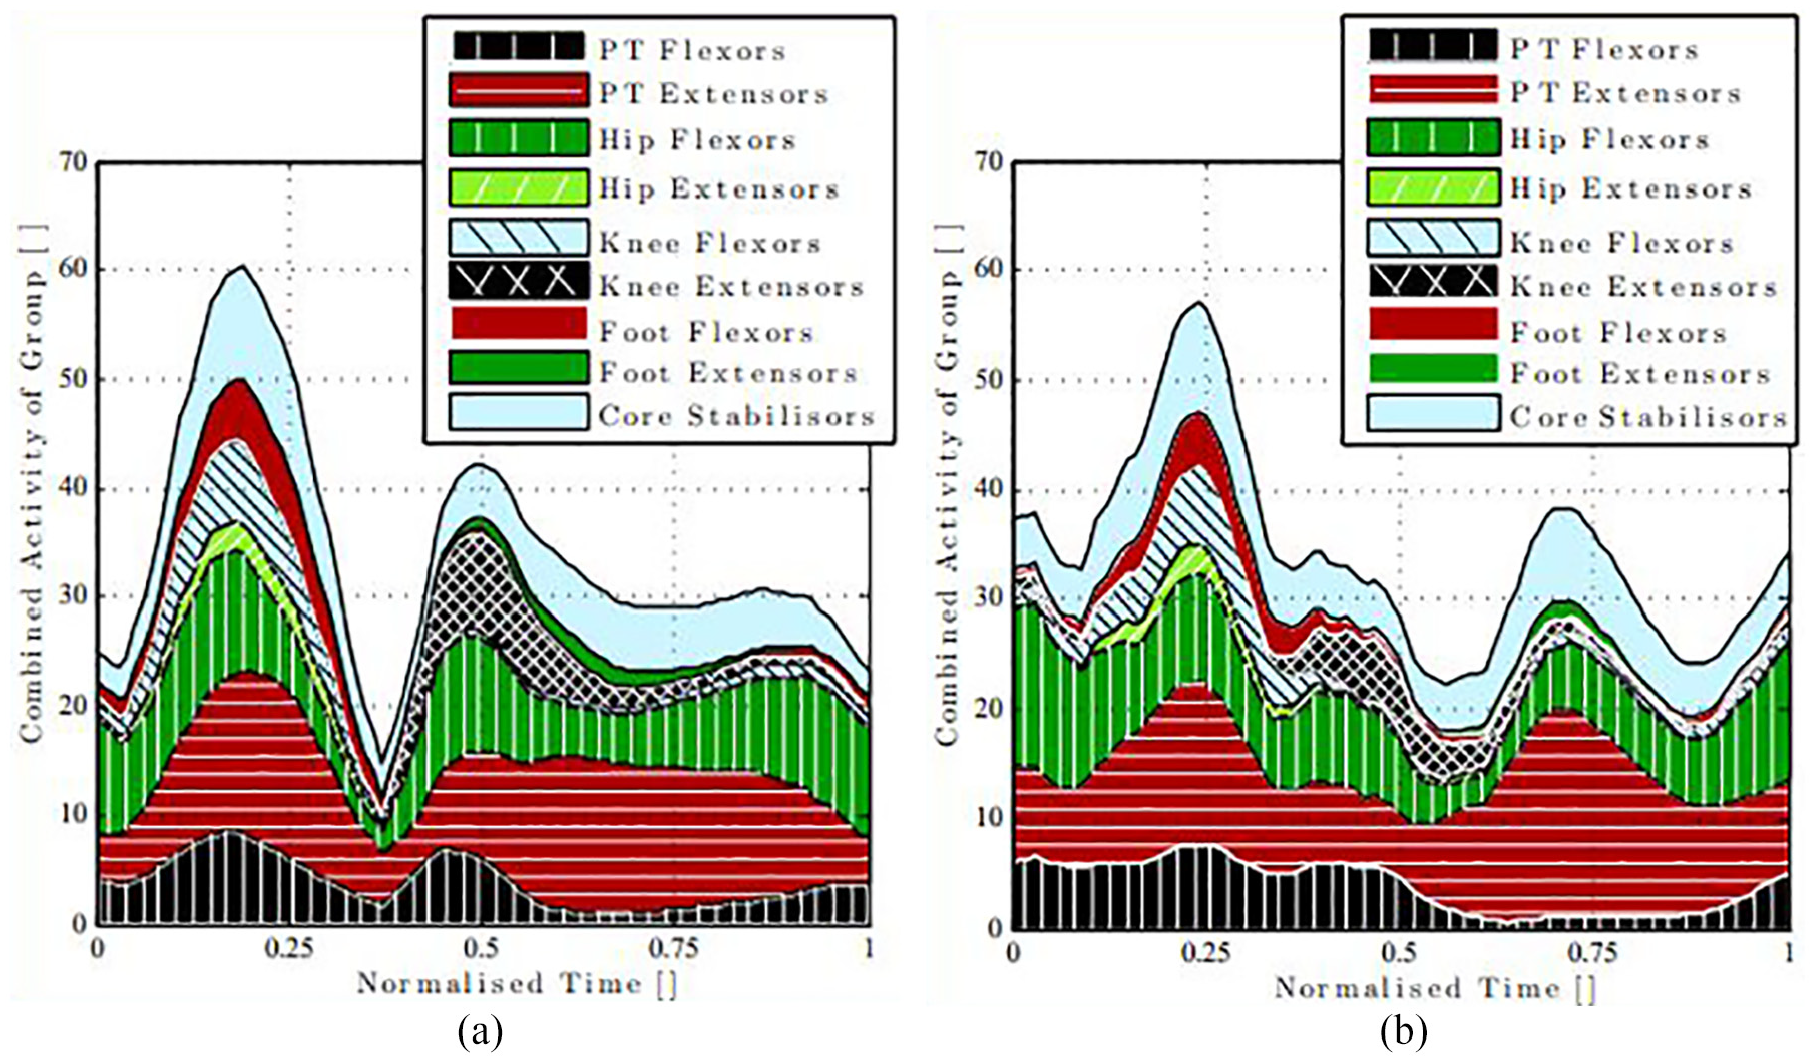
Area plot of combined activity of each muscle separated into the respective activity group: (a)
There is a difference between the phasing of the activations between the trials. There are two distinguishable peaks visible in the two cases, but for
This process of analysis also allows for inspection of individual muscles, as well as groups. Upon inspection of the individual muscle group data, it is found that Rectus Abdominis (
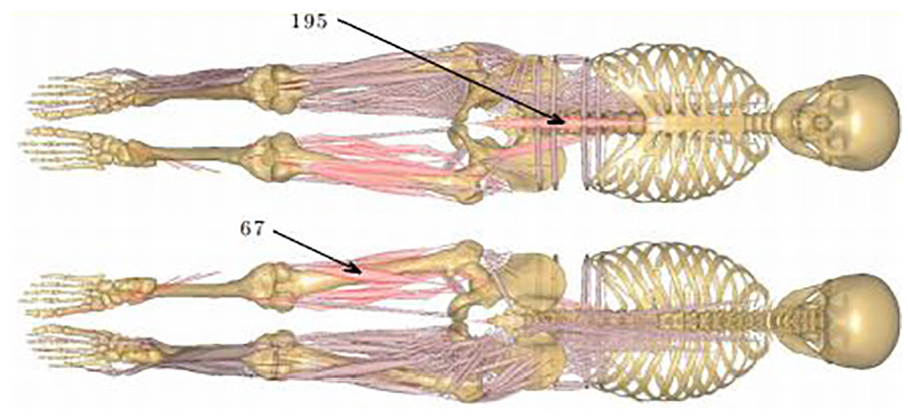
Coronal plane of the musculoskeletal model in anterior and posterior views. Showing all muscles on the body’s right while those muscles on body’s left are indicative of those with a higher frequency of activation. Those highlighted on the left have activity levels that exceed 0.75 for more than 5% of the cycle. Indicated muscles 195 and 67 are rectus abdominis and biceps femoris caput longum, respectively.
Umberger
28
used a complex musculoskeletal model to quantify the energy cost of locomotion
Nevertheless, this approach produces an approximation of the energy expenditure of human underwater swimming that is derived from the kinematics of a specific technique and is of particular benefit in comparative studies as demonstrated here.
Tuning kinematics
The data sets

Example joint angle data obtained for ankle joint.
The propulsive efficiencies for a sweep of k are shown in Figure 8 as a function of Strouhal number, illustrating the non-linear relationship between the kinematic variations in
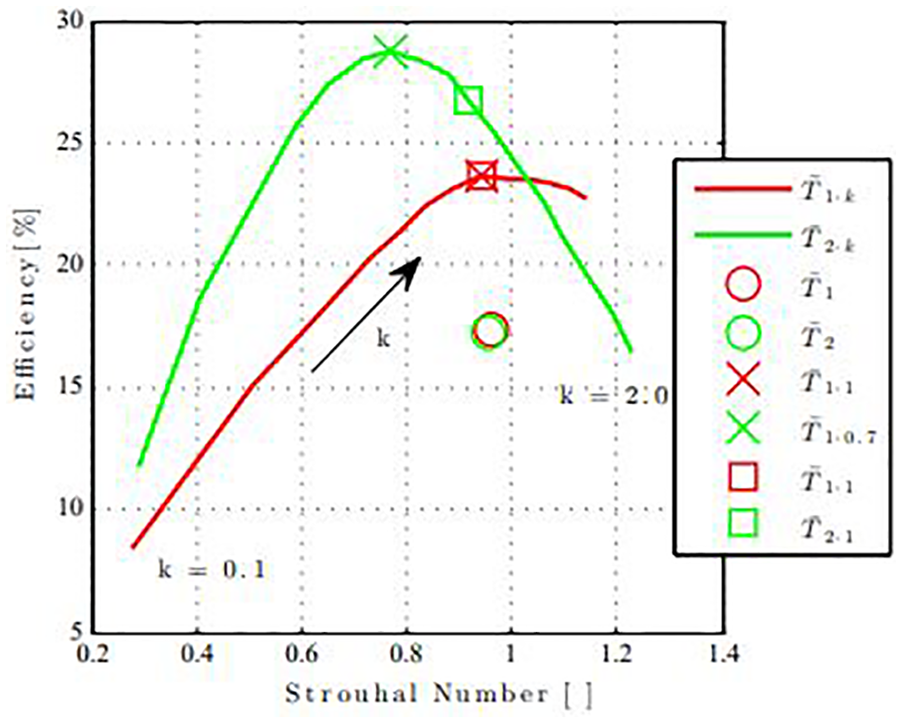
Relationship between kick amplitude and efficiency.
It is apparent that there is an increase in efficiency from
The data indicate that the base style
The Strouhal numbers for
If it is considered that the frequency component in equation (1) is correctly defined as the frequency between vortex shedding, then the apparent time period between the generated vortices for underwater flykick is double that of mono-fin and fish swimming, and thus relatively half the frequency. This would therefore lead to a two-fold overestimation of Strouhal number for cases where only one vortex is shed in a cycle, such as demonstrated for underwater flykick. This would account for the large variation in theoretically optimal ranges in the published values of Strouhal number for human underwater flykick, relative to mono-fin and fish swimming.
Depending on a particular strategy, maximising efficiency may occasionally be misleading. For example, for
From examining these results, it may be more effective for this sprint athlete to swim at a higher velocity and hence aim for a lower Strouhal number. Figure 9 displays the muscle power versus velocity for a sweep of k values, for both
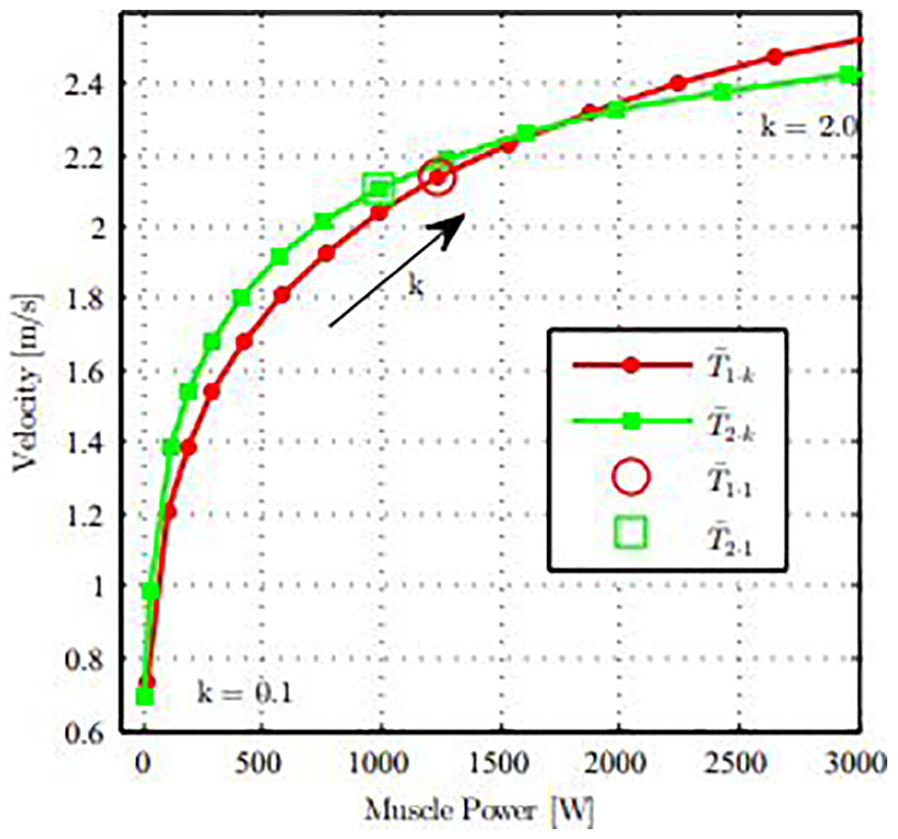
Relationship between power delivered by the muscles and swimming velocities for a sweep of
Conclusion
Lighthill’s theory of fish locomotion has been coupled with a musculoskeletal model for the analysis of underwater flykick, allowing different underwater flykick techniques to be compared. An athlete’s speed and kinematics were acquired and synchronised using a setup that is neither motion restrictive, nor invasive. Initial observations suggest the thrust production of Lighthill is comparable to published data; however, further and more detailed analysis should be conducted to validate and quantify this. In comparison to other methods, Lighthill is computationally inexpensive. The musculoskeletal model has been shown to provide significant insight into inter- and intra-simulated techniques, for example, highlighting the potential for an increase in efficiency associated with a consistent technique. The musculoskeletal model also facilitated the estimation of energetic cost of locomotion. The process was also able to identify muscles or muscle groups of significance that were associated with the simulated kinematics. It is considered that such information could be helpful in designing training or rehabilitation programmes.
An example of varying joint amplitude has demonstrated the potential benefit of tuning kinematics to provide a potential increase in efficiency. This provides a quantitative answer as to which technique may be preferable for this individual athlete when competing in short swimming events. It is suggested that initially following a dive, it would be preferable for this athlete to begin with a knee-based technique and transition to a more undulatory technique as their velocity decreases.
Footnotes
Declaration of conflicting interests
The author(s) declared no potential conflicts of interest with respect to the research, authorship, and/or publication of this article.
Funding
The author(s) disclosed receipt of the following financial support for the research, authorship, and/or publication of this article: This research was supported by the EPSRC (grant reference EP/H501568/1).