
Abstract
The aim of this project was to develop a wind tunnel that enables the study of human performance during various types of sports and physical activities by examining the influence of aerodynamic drag, precipitation, frictional forces and gravitational forces on uphill and downhill travel on a moving substrate. An overall design for a wind tunnel and working section containing a large treadmill was drafted, followed by computational fluid dynamics simulations of flow conditions to assess the design’s feasibility and select from different geometries prior to its construction. The flow conditions in the completed wind tunnel were validated using different flows, speeds and treadmill inclinations. Pilot experiments were carried out using a cross-country skier to investigate the effect of aerodynamic drag on oxygen uptake during double poling and the maximal achieved speed when rolling on a declined treadmill. The purpose was to validate the usefulness of the tunnel. The results showed that flow conditions are acceptable for experiments even in worst-case scenarios with maximal inclined and declined treadmill. Results also showed that aerodynamic drag has a significant impact on the skier’s energy expenditure.
Keywords
Introduction
Athletes in various sports are often studied in the laboratory to obtain biomechanical and physiological measurements using advanced equipment for different types of analyses while benefitting from comparisons in relatively stationary and reproducible conditions.1,2
For experiments to be valid and relevant for the sport, test methods should be used that allow the athletes to perform movements similar to those in a non-lab outdoor environment, along with comparable influencing forces that typically affect the athletes’ performance. The development of large treadmills that enable roller skiing and roller skating in experiments on cross-country skiers, biathletes and skaters is one example of athletes performing similar motions to those used in their outdoor training and competitions. Previously, these categories of athletes were studied running on a small treadmill or pedalling on a bicycle ergometer. 3 Non-specific testing methods do not enable the athlete to imitate sport-specific movement or include the equipment used in the sports, therefore limiting what can be measured and the measurements’ relevance.
In training and competitions, athletes have different external forces to contend with. These forces vary slightly in scope and importance, depending on the type of sport, but typical forces include frictional force, gravitational force and aerodynamic drag4–7 as shown in equations (1) to (3). equation (1) describes the frictional force

where

where
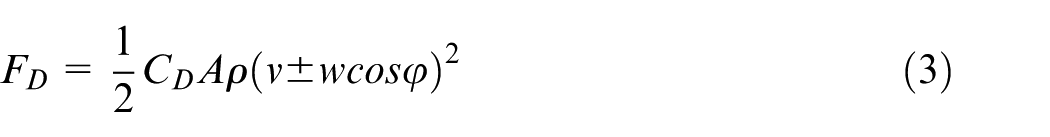
where
Other environmental factors besides aerodynamic drag that may affect an athlete’s biomechanical and physiological responses are air temperature and precipitation.8,9 In Ito and colleagues,8,9 the effects of rainy versus dry conditions were studied in a climatic chamber during simultaneous influence of headwind and cold or hot temperature. Rain did not change the oxygen uptake (
Raindrops also impart a resisting force, in a similar way to air molecules, which the athlete must overcome depending on its scope and the athlete’s speed of travel. This may lead to a higher
In various sports, tests on the significance of aerodynamic drag have been conducted indoors in wind tunnels. Alpine skiers and speed skiers have been tested standing on a force platform to measure ground reaction forces as a function of different postures and aerodynamic properties.10–13 Ski-jumpers have been tested with similar setups during simulated take-offs when examining the influence of body size.14,15 However, these types of experimental setups do not allow travel over a surface that replicates the real world. Also, sports such as running, cycling, cross-country skiing and speed skating imply dynamic motion of body segments during the regular push-off and re-positioning phases. The dynamic motion will invoke transients in the aerodynamics that are not always well represented by static positioning on a force plate.
Leirdal 16 measured the aerodynamic effects of deep to high postures, imitating the cross-country skiing freestyle gears 3 (high posture) and 5 (moderate posture), using a slide board mounted on force plates that were put in a wind tunnel. Cross-country skiing involves free and classical style skiing, each with several sub-techniques, using combined arm and leg exercise. Thus, this type of experimental setup does not enable skiers to apply a propulsive force to the substrate by means of the ski poles and the upper body’s musculature. In contrast to roller skiing, a slide board limits the opportunity to perform cross-country skiing-like movements and is therefore not suitable as a comprehensive test method.
Tests of cyclists’ aerodynamics have used similar setups as noted above, where the bike has been fixed on a stand and force balance in a wind tunnel.17,18 These types of experiments carried out on cyclists and their bikes allow realistic and dynamic movement of the cyclist’s body parts and the bike’s pedals and wheels. However, where the air flows over a stationary floor, a boundary layer builds due to friction along surface; thus, ground plane simulation in the laboratory is not representative. Davies
5
had an innovative idea, placing a treadmill in a wind tunnel in order to study the influence of aerodynamic drag on cyclists’
Several types of wind tunnels exist, but they are generally classified as low speed or high speed tunnels. All tunnel designs considered for sports testing will be of low speed designation and should be designed to match the Reynolds number range (i.e. the ratio of the viscous and inertia forces of the air) encountered by an athlete during competition. Given the low speed of the air, compressibility effects can be considered negligible. The design chosen should be ideally matched to the primary intended use, but the constraints such as available space, cost of build, scale of test and quality of flow required, all have a significant influence on the design. If time and cost are not constraints, it is nearly always preferable to test at full scale to mitigate Reynolds effects. Where human physiological effects are to be tested, there is no option but to test at full scale. Models that include thermal exchange are used, but this would be incredibly complex to implement with dynamic movement.
The two main types of circuit design are Gottingen (closed circuit) and Eiffel (open circuit). The closed circuit is a more efficient design, as the flow is recirculated, thus reducing the size of the fan required and allowing more efficient control of environmental conditions. Open circuit designs are much cheaper to build, having only a linear flow path, but they are much more expensive to run. High flow quality can be achieved with either design, but the design must be tailored to the intended application. Flow conditioning can be expensive to instal, both in terms of fan power and financial considerations. A common compromise is to instal a semi-closed circuit, which is an open circuit tunnel housed within a dedicated building.
The size of the tunnel to be built is governed by the blockage ratio (
Typically, blockage should be kept below 5% to prevent wake streamline compression and keep the need for corrections to a minimum. Blockage corrections for measured data do exist for blockages up to 20%, but the greater the blockage, the more uncertain the accuracy of the corrections. For a given model size (human), increasing the blockage allows a smaller tunnel to be used, but the accuracy of the measurements will be questionable.
Working sections are in two distinct designs – open and closed sections. Closed sections are bounded by rigid walls and have the advantage of no normal flow component and no limit on the length of the section that can be used. The open section design relies on static air outside of a jet to bound the flow, which has the advantage that streamlines are not compressed, but the working section length is limited due to mixing with free air and a subsequent loss of free stream velocity. Many innovative solutions are used to combine the advantages of the two designs, including streamlined walls, adaptive walls, boundary layer suction and slotted walls. The concept is to minimize streamline compression and reduce boundary layer growth along the working section walls, while maintaining free stream velocity.
In summary, a limitation that still exists in experiments on athletes in exercise laboratories is the absence of relevant aerodynamic drag in the practice of physical activity on a moving substrate. The best overall test bed equipment allowing for measurements of athletes in several sports appears to be a large treadmill specially designed for the aerodynamics in a wind tunnel. Moreover, a very large treadmill would enable tests to be carried out on more than one athlete at the same time. For example, the effects of drafting could be studied in many sports.
The project thus aimed to develop a test laboratory that enables studies on the influence of aerodynamic drag, precipitation, frictional forces and gravitational forces on human performance during various types of physical activities and sports, such as walking, running, roller skiing, roller skating, cycling and wheelchair racing. In doing so, a more valid and relevant test environment could be developed for testing sports and athletes in various disciplines. In addition, an environment was created that would allow outdoor companies to test the functionality of their garments during human physical activities that mimic their intended use.
Requirement specification
Initially, a requirement specification based on future needs and usage was established for the wind tunnel and working section. The working section should include a large treadmill with a top speed slightly exceeding the normal racing speed for cyclists and cross-country skiers (roller skiers). The working section should also allow both uphill and downhill travel, so that an outdoor track profile can be replicated by changing the slope of the treadmill. Also, to be able to study drafting in various sports, the treadmill needs to be long enough for two cyclists, two roller skiers or two wheelchairs with riders, to be on the treadmill at the same time being in line with the direction of travel.
The fan should provide a maximum airflow velocity (AF) through the working section, similar to the top speed of the treadmill, thus allowing for relevant aerodynamic drag at all possible treadmill speeds. In order to rapidly reduce AF and treadmill speed, both the fan and treadmill should have an electronic brake function. In addition, to be able to quickly change the AF as the treadmill’s speed changes, the fan needs to be placed near the treadmill, avoiding lag. To minimize the impact of noise and heat, the fan motor should be positioned outside the main building. The fan should therefore be controlled mechanically by a shaft from the electric motor.
In order to simulate rain inside the working section, a number of nozzles should be installed in the ceiling to spread water droplets over the treadmill at various AF. Rain droplet size and the volume per unit area are to be varied to simulate various rain conditions. The rain system therefore needs to be regulated by variable pressure and water flow. A numerical model was developed to estimate how the raindrops behave when they are exposed to different wind velocities in the wind tunnel. For further information about this model, please see Appendix 1.
The building interior layers and the electronics and mechanics of the treadmill and fan must withstand air temperatures from −25 °C to +35 °C at AF up to 20 m/s. Also, the electronics and mechanics must withstand water from the rain system at AF up to 20 m/s and air temperatures 0 °C to +35 °C.
A corridor was required on each side of the working section, where laboratory staff could be protected from the wind and use different types of measuring equipment.
Design feasibility
To assess the feasibility of the design specification, a computational fluid dynamics (CFD) study was performed to predict flow conditions in the tunnel working section. Commercial code (STAR-CCM, Siemens PLM Software, www.siemens.com) was used to complete this analysis for a simplified geometry with the treadmill inclined at 11°, which was considered the largest angle that is likely to be used during future studies in the wind tunnel and the worst-case scenario for flow conditioning.
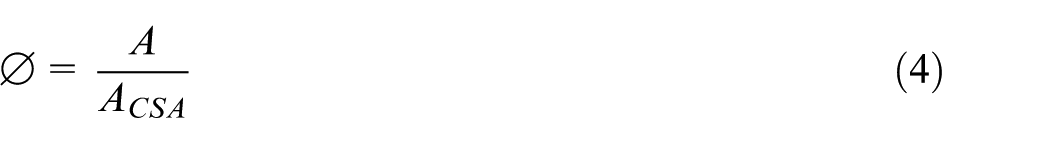
Figure 1 shows the simplified computer-aided design (CAD) geometry for the proposed wind tunnel design. The wind tunnel consists of an inlet duct, followed by a ramp to the inclined treadmill and exit through a diffuser to the proposed fan site. The isometric view of the geometry is included to clearly show the position of the inlet, ramp and treadmill. Only the linear proportion of the semi-closed design is considered, and ideal inlet conditions are assumed.
General arrangement of proposed wind tunnel design. Dimensions in metres. Treadmill angle: 11° incline.
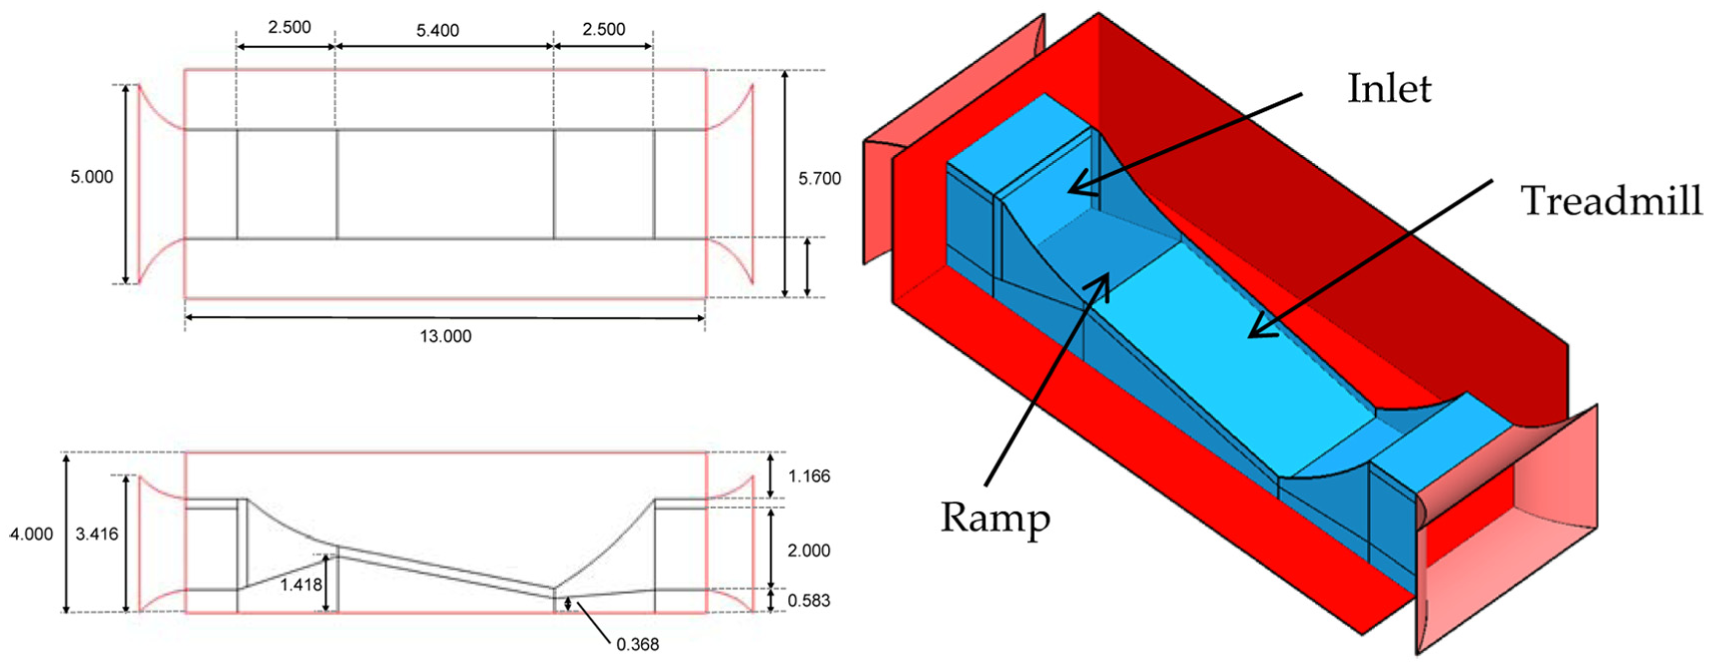
Further geometries were also considered, including removal of the ramp connecting the inlet and treadmill, 30% permeability side walls and a declined ramp condition as shown in Table 1.
The four cases carried out with CFD simulations.
CFD: computational fluid dynamics.
The removal of the ramp allowed some of the inlet flow to travel underneath the treadmill. This modified geometry should remove the boundary layer leading up to the treadmill that will separate and potentially reduce flow quality in the working section. Side wall permeability was introduced in an attempt to reduce the mixing of the low pressure flow with the static side flow, while allowing for access to the working section and an allowance for blockage. There is a potential for flow to ‘spill’ over the side of the treadmill, further exacerbating the mixing of the flow and deceleration within the working section. Finally, the declined case was tested for completeness.
Figure 2 shows the applied mesh to the test geometry. The mesh consisted of 2.5 million hexahedral elements with boundary layers resolved for first cell height on the treadmill surface of y+ = 1. Flow was initialized with a velocity inlet flow of 6 m/s, the maximum likely for the inclined case. A declined case of −5° was also considered for completeness and initialized at 10 m/s. An outflow was used for the outlet. For the first modified geometry case, the ramp leading up to the treadmill was modelled as an outflow. For the second modified geometry, the side wall was increased to the height of the inlet and had a permeability of 30%, which was modelled using a porous jump (momentum sink). The permeability represents a 30% slotted wall.
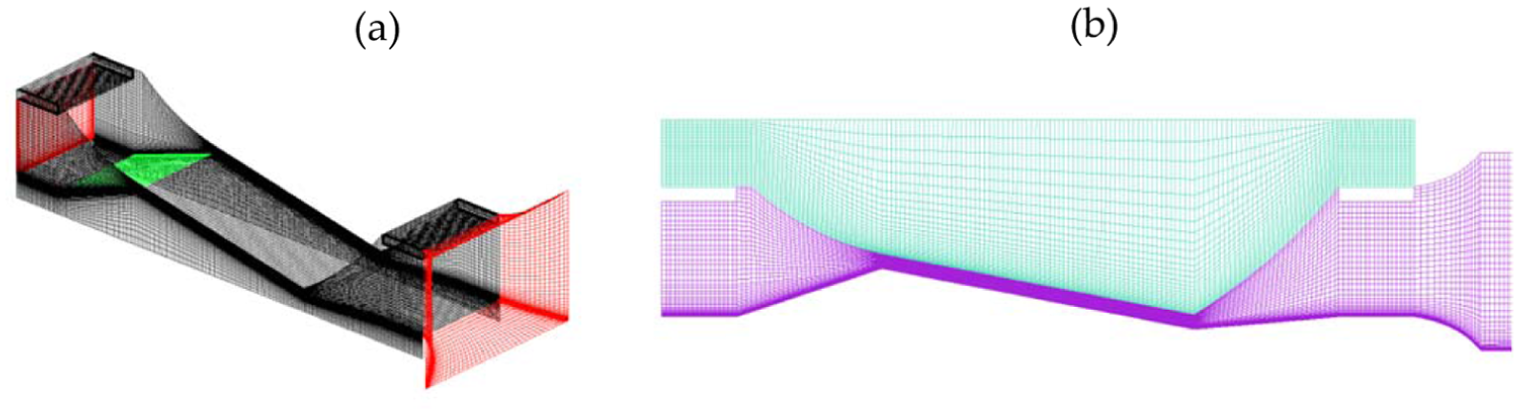
CFD mesh: (a) mesh on surfaces and (b) slice at z = 0 m.
From the evidence presented in Figure 3, the initial design was poor, resulting in undesirable flow conditions. Flow is accelerated up the inlet ramp (1) causing streamline compression and non-uniformity. The flow separates at the transition to the moving ground plane (2) increasing the non-uniformity at the test subject’s position (3). There is also contraction and acceleration shown at (4) where diffusion and deceleration into the fan would be more efficient. In addition, a slice taken at the centre of the moving ground plane (test subject’s position) clearly demonstrates that the flow velocity at the subject’s head would be approximately 7 m/s, whereas it reduces to 2 m/s at the knees. This scenario does not represent a good condition for estimating cooling or aerodynamic effects. The arrows indicate a circulation of the flow ‘spilling’ over the small raised edges of the treadmill, which is due to higher pressure air mixing into the lower pressure, faster moving air down the centre. As access is required to the test subject and blockage effects must not become an issue, a slotted wall was included in the design to improve the flow uniformity and efficiency of the system, potentially reducing the required fan power.
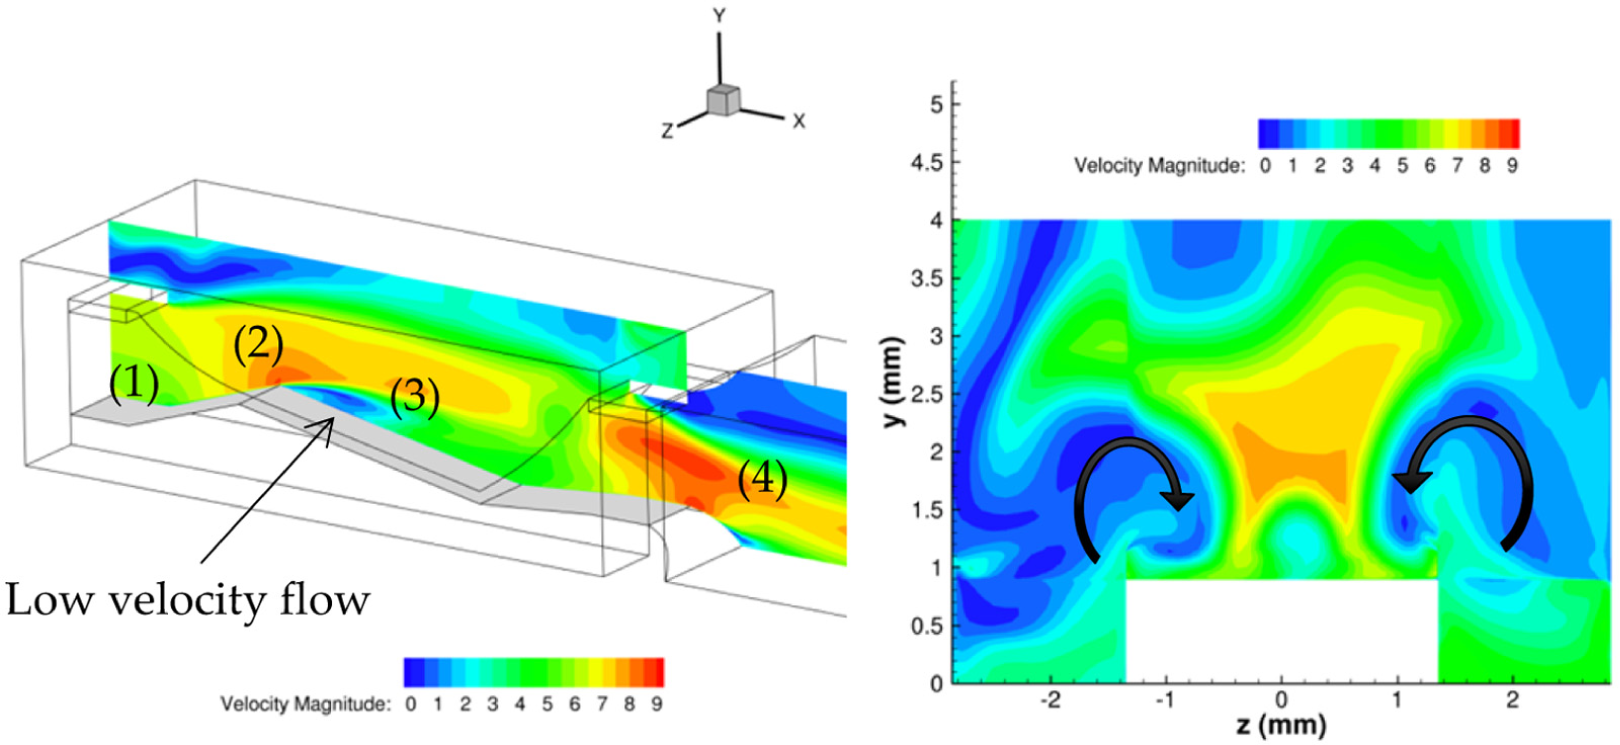
Results of CFD case 1. Velocity magnitude at z = 0 m slice (centre). Velocity magnitude at x = 6.5 m slice (centre of treadmill).
The removal of the inlet ramp had a significant effect on the flow with a surprisingly large improvement in uniformity. As shown in Figure 4, it is evident that the boundary layer over the treadmill (5), although still in existence, is much thinner and the rate of thickening is low. Note that the flow conditions underneath the treadmill were not modelled and a blockage here may affect the flow quality above. The introduction of permeable side walls had little effect on the central flow, but as is clear in Figure 5, the wall conditions are significantly improved when compared with Figure 3.
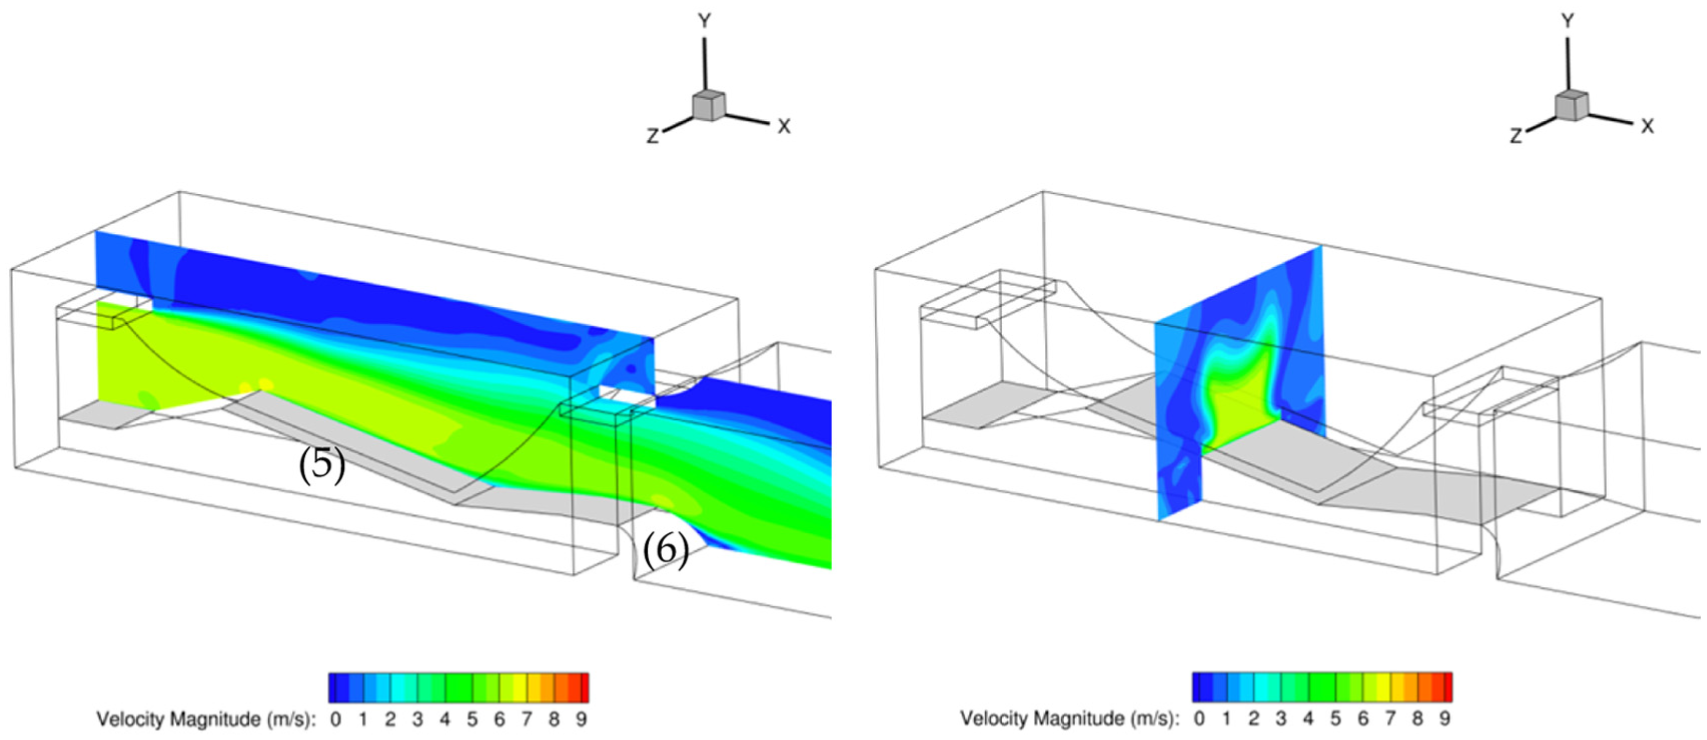
Results of CFD case 2. Velocity magnitude at z = 0 m slice (centre). Velocity magnitude at x = 6.5 m slice.
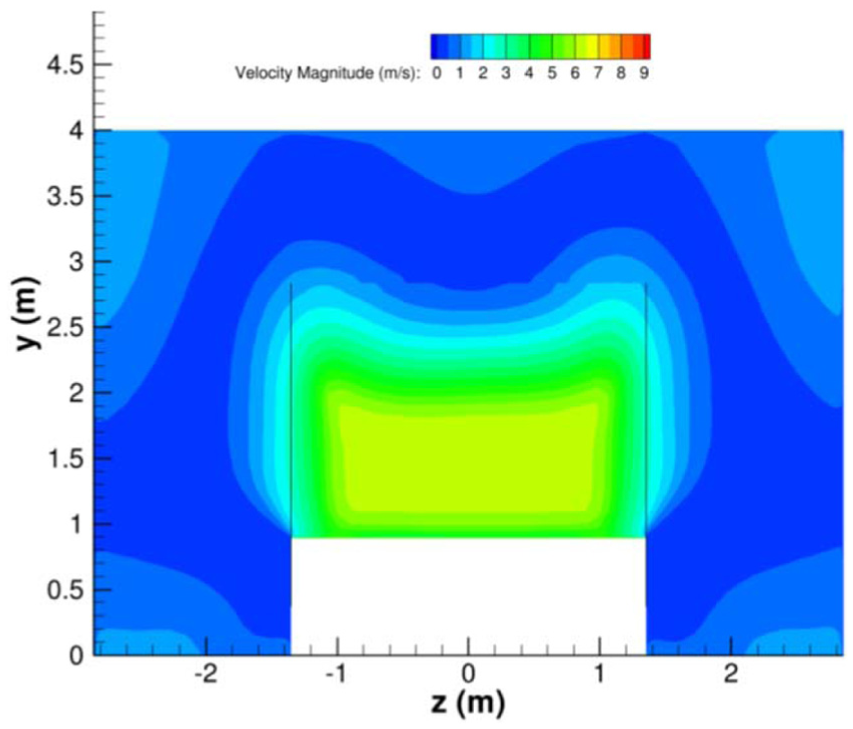
Results of CFD case 3. Velocity magnitude at x = 6.5 m slice (centre of treadmill).
It is evident from Figure 5 that the permeable side walls (represented by the vertical lines at z = ±1.2 m) permit some mixing of the flow but reduce the deceleration of the flow at the boundary; deceleration only becomes significant for z > 2.2 m. As the flow becomes more uniform, the decision was made to include a 30% slotted wall. Note that 30% is not necessarily an optimized value for this application but is commonly used in automotive tunnels. Although significantly less mixing occurs between low and high pressure regions, the height of the side walls is increased in the final design to help alleviate mixing that otherwise would become more prominent as the test velocity increased.
CFD highlighted the need for the leading edge of the treadmill to be carefully designed to avoid unintentional separation. The flow underneath the treadmill was not considered in the CFD, but to avoid disturbing the flow over the top of the treadmill, it was identified that the flow would need to be fed back into the system downstream at approximately point (6) in Figure 4.
Figure 6 demonstrates the predictably good flow conditions for the declined case. Velocity was increased to 10 m/s to represent the likely increased speed of a skier on a slight downhill. A small separation exists at (7), which will necessitate an increase in fan power, but this is likely compensated for by the smaller losses for the declined ramp. The increase in inlet velocity (8) further highlights the need for proper diffusion into the fan. While this would have little impact on flow quality, the fan power requirement will be negatively impacted. Figure 6 shows excellent working section flow conditions with no significant deceleration below z = 2.75 m, well above skier height. The increased total velocity gives rise to additional mixing with static flow, but this is now controlled and predictable.
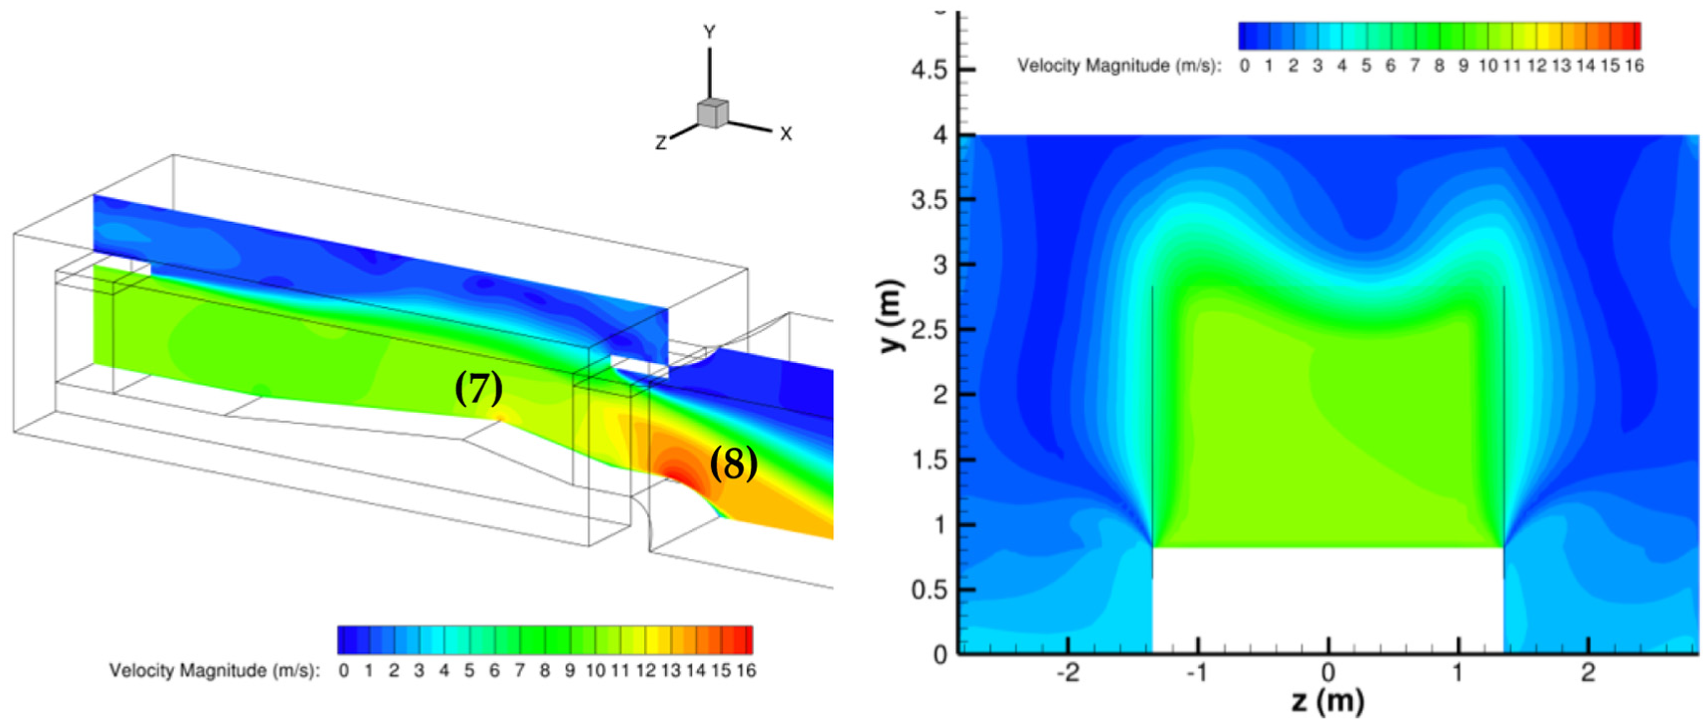
Results of CFD case 4. Velocity magnitude at z = 0 m slice (centre). Velocity magnitude at x = 6.5 m slice (centre of treadmill).
Design specification
Following the CFD simulation, the final design was considered in terms of volume flow rate and circuit pressure loss to establish the likely fan power requirement and circuit efficiency. Volume flow rate was defined at the inlet to the working section for a range of velocities and a fixed cross-sectional area. The nozzle velocity is higher than that in the working section due to subsequent area change and pressure loss.
The stagnation pressure loss of the tunnel circuit was estimated by totalling the losses of individual components. The total stagnation pressure loss, ΔH, is necessary to calculate the required overall fan stagnation pressure rise as shown in equation (5)
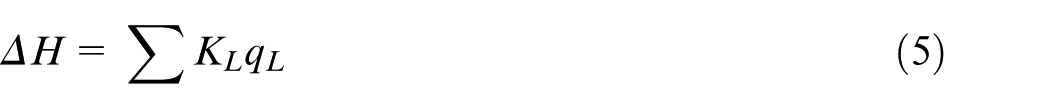
where KL is the loss coefficient and qL is the dynamic pressure. Where possible, existing component data 19 in academic papers and direct calculations were used; where this was not possible, estimates were made from first principles and equivalences in academic papers. The following details the approach taken for each section, progressing in logical order from the bell mouth around the circuit. Each section was estimated at 15 m/s; this is the tunnel’s maximum design speed.
Bell mouth intake
A bell mouth is to be used to guide airflow into the settling chamber without separation, minimizing unnecessary pressure loss and aiding the achievement of good quality flow. An ellipse is able to better withstand separation than true radii for incidence flows. ESDU 8003719 suggests that the ratio of minor to major axis diameter ratio should be in the region between 2 and 5. Also, the diameter of the radii should be defined as r > 0.14D, 20 where D is the inlet diameter.
Flow conditioning
Filter meshes and honeycomb sections are used to condition the flow, to straighten and effect a reduction in turbulence. For the proposed tunnel, however, it was not anticipated that a reduction of turbulence would be required for the expected tests. The use of a flow straightening device was incorporated as no turning vanes were to be used between the building return and the bell mouth inlet. For this, a honeycomb section of dimensions 160 mm depth and 14 mm hydraulic diameter is chosen. This size is readily available and avoids manufacturing of tailored solutions that are prohibitively expensive.
Expansion into the working section
Diffuser design is detailed in ESDU sheet 73024. However, the tunnel does not have a true diffuser, as the geometry from the inlet nozzle to the working section is a combination of a diffuser and sudden expansion. Consequently, the worst-case scenario is covered. A typical loss coefficient for sudden expansion or enlargement of diameter is KL = 1.0, reducing to a typical value of KL = 0.2 for a diffuser. The upper value was used.
Blockage losses
The projected frontal area of an athlete varies with type of sport practised, body size and behaviour, but a general value of 0.5 m2 was accepted.17,21 The worst case is two athletes side by side, giving a combined frontal area of 1.0 m2, which creates a blockage ratio, allowing for interference effects, of 10.8%. This is well within the accepted maximum of 20% for slotted walled tunnels. Appropriate continuity corrections will be applied if force and/or pressure data are acquired in the future. Quoted values of CD at 15 m/s for humans are in the range of 0.6 to 1.1. 22 Given the approximation of a human to a vertical cylinder, plus interaction and end separation effects, a value of CD = 0.8 is reasonable and was used in this study.
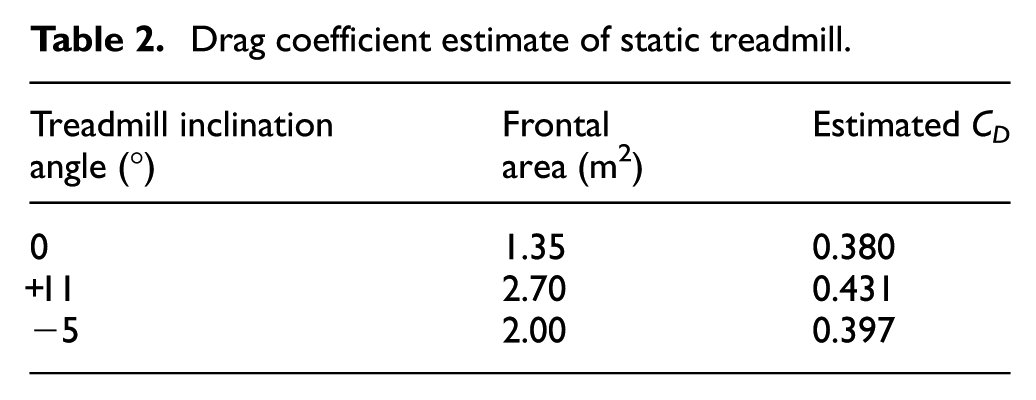
The treadmill was treated as an additional blockage in the tunnel with additional loss for changes of incidence. Both +11° and −5° cases were considered and the highest loss was used for the fan power calculation. Simplified geometry of the treadmill gave an approximation to a four-legged table 5.5 m long, and 2.7 m wide (aspect ratio of 2.03), on legs 1.2 m high with the legs and body of the treadmill being 0.3 m thick. The approximate frontal areas and subsequent drag coefficient estimates 23 are shown in Table 2.
Drag coefficient estimate of static treadmill.
The effect of the moving ground plane will be to thin the boundary lower on that surface, resulting in a smaller loss coefficient. As there is potential for static force plate measurements to be taken in the future, this effect (benefit) has been negated for the fan specification.
Under-treadmill flow
The under-treadmill ducting effectively forms a continuous 180° bend. The loss coefficient for a well-radiused 90° bend is conservatively
Permeable wall effects
A number of tunnels (most notably the Volvo PVT
24
) have used slotted walls, and the general conclusion is that 30% open area ratio is suitable for reproducing accurate flows at high blockage ratios (>10%). The consequence is that the loss factor and, hence, power requirement will increase. Experiments by Vandrey and Wieghardt
25
showed that a closed jet tunnel will have a loss coefficient of approximately 0.09 and an open (free) jet will have a loss coefficient of approximately 0.38 (with a suitable collector). For the reported experiment, an open area ratio of between 18% and 28% was considered. Reported loss coefficients are given for the 18% case with
Safety screen
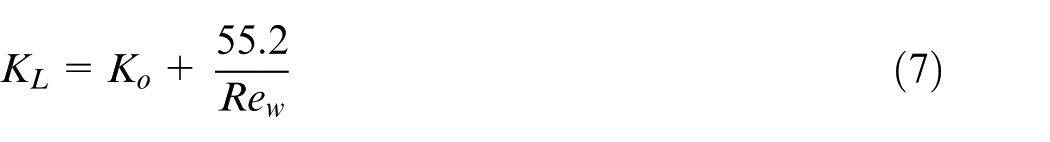
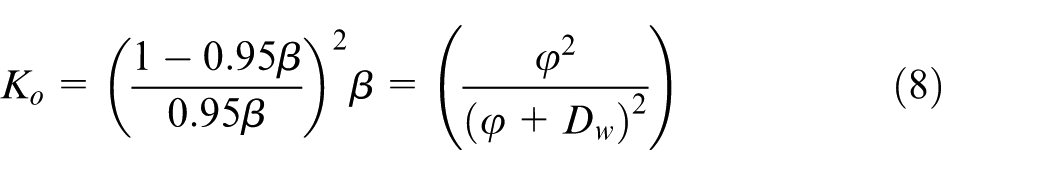
A safety screen is required in front of the fan to protect the fan from objects left in the tunnel and to prevent the athlete from falling and being ‘sucked’ into the fan. The screen should be a mesh that is capable of holding a mass of 100 kg. The screen uses a circular wire section in a horizontal/vertical configuration with wires at approximately 50 mm intervals. The loss coefficient of a safety screen was estimated from its wire Reynolds number Rew 26 as shown in equations (7) and (8)
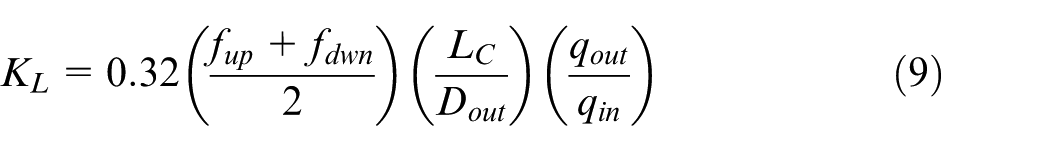
Contraction to rear nozzle
Well-designed, large radii contraction will, by definition, have a relatively low loss resulting from friction alone, 27 with the contraction loss coefficient calculated as shown in equation (9)
Outlet bell mouth diffusion to ambient
Sudden expansion of flow is usually equated with a pressure loss of KL = 1.0. However, this loss will be mitigated by the use of a bell mouth, maintaining attachment at the wall and having a degree of control over the expansion. In this case, the loss is estimated to be reduced to KL = 0.75, which is the mean of a poor bell mouth design and sudden expansion with no bell mouth.
Frictional losses
Frictional losses will occur throughout the circuit and were estimated for the two largest components: the working section and the building return circuit. Both will have a general frictional loss, similar to those found in a pipe in the turbulent regime. The loss coefficient is found in equation (10)
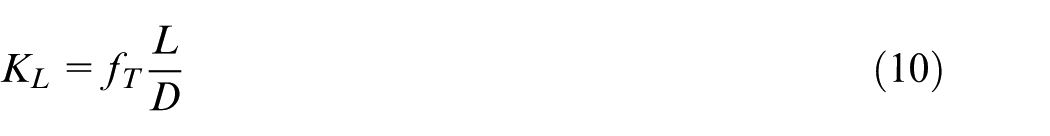
where fT is the turbulent friction loss coefficient and can be solved for as shown in equation (11)
This equation, used by Johl to estimate the friction losses in the Loughborough University tunnel design, 28 was solved iteratively and converged to 4 d.p. (decimal places) in six iterations.
Joint and leakage losses
It is usual to allow an additional loss in the system for leakage at joints, misalignment at joints and small details that are not accounted for in the estimation. A conservative figure used at the fan specification stage was Jl = 10%, though this value would likely to be lower for a well-built tunnel. The penalty for over-estimation of losses is a fan that is more capable than required, albeit at an additional cost. The penalty for under-estimation is a fan that is not capable of running the tunnel at the required speed!
Fan power requirement
The overall fan line power requirement is calculated as shown in equation (12)
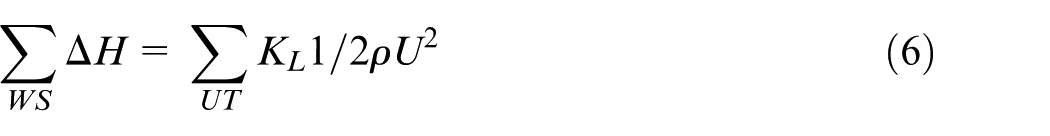
where A is the reference area for the tunnel (in this case, the nozzle area) and η is the overall efficiency of the fan/motor/controller. A typical overall efficiency is 75% (Johl et al. 28 as advised by Voith Howden). Using results from Vandrey and Wieghardt, 25 it appears that the jet will be at 80% of nozzle velocity at three diameters downstream of the nozzle. This indicates that nozzle velocity will be 1.2 times that of the required working section velocity.
The wind tunnel
The wind tunnel’s overall design was decided in the product and requirement specification. Based on the results of the CFD simulations, the wind tunnel was built according to the design in case 3. Figures of the completed wind tunnel and its working section can be seen in two different views in Figure 7(a) and (b). The inner dimensions of length, width and height for the main building (a) are 22 × 9.7 × 6.9 m3, respectively. The working section’s outer and inner dimensions are 14 × 6.4 × 3.7 m3 and 9.9 × 3.35 × 3.05 m3, respectively, where 3.05 m is the height from the treadmill upper surface to the ceiling. The working section’s outside corners and the main building’s inside corners are rounded, with a radius of 0.5 and 1.0 m, respectively. At each end of the main building, large ports with a total area of approximately 12 m2 (one port in the front, 4.0 × 3.0 m2, and two ports at the rear, 1.9 × 3.1 m2) can be opened to allow atmospheric air to pass through the working section. This can be an asset, especially during the winter months of November to March, to achieve temperatures in the working section that are below freezing. This can be useful, particularly in experiments on athletes who compete in winter sports and when testing the functionality of garments intended to be used in a cold environment.
(a) and (b) The two figures show the wind tunnel and working section in the horizontal and sagittal planes. The arrows denote the direction of airflow. The letters refer to main features of the tunnel described in the text.
Next to the wind tunnel is a room (b) with large windows from which visitors can look into the working section. The room is also used for preparation and follow-up with subjects and equipment, as well as running and monitoring the fan and treadmill. On the opposite side of the main building, nine large windows allow daylight to enter the wind tunnel.
The working section bell mouth has a contraction in the form of an elliptical geometry on the sides and top, where the ratio between the long and short axes is 2 and the length of the quarter ellipse is 0.8 m. A honeycomb (c) with hexagonal cells with a length, diameter and cell wall thickness of 160, 14 and 0.2 mm, respectively, is placed in the opening (10.2 m2).
The fan (d) (Howden Ventilatoren GmbH, Växjö, Sweden) is positioned in the rear of the working section, and the motor (e) (ABB Sweden, Västerås, Sweden) is positioned on the outside of the main building. A shaft with a diameter of 0.24 m connects the fan with the motor. The motor has a power of 200 kW; the fan has 12 blades, and an impeller and hub diameter of 2.8 and 1.12 m, respectively; a maximum speed of 600 r/min; and an efficiency of 88%. The frequency converter has an electric brake function to rapidly decelerate the fan and airflow when desired. A silencer is placed in front of the fan to reduce the noise level in the working section. A wheel cover is installed around the fan that increases in diameter behind the fan. A safety mesh is placed in front of and behind the fan to protect people and equipment from physical contact.
A treadmill (RL 5500, Rodby Innovation AB, Vänge, Sweden) is located in a central position in the working section. The treadmill (f) is designed with a central tilt function to be able to change slope and thus simulate different terrain types in the form of uphills and downhills. The treadmill belt’s maximal speed is 14 m/s, and inclinations/declinations range from +10° to −5°. The area of the belt on which various types of sporting activities can be performed is approximately 15 m2 (5.5 × 2.7 m2). A ramp (5.0 × 0.3 m2) is located on each side of the belt with railings where personnel can stand and perform actions while the treadmill is operating. The big treadmill has space for two cyclists or roller skiers in line with the flow and two side-by-side subjects, to study the effects of drafting in many sports. Also, the treadmill and fan have capacities which are sufficient to match most track profiles and speeds athletes use in their outdoor training and competitions. Furthermore, the possibility of tilting the treadmill downhill in combination with the relevant aerodynamic drag makes it possible to roll downhill on any sport-specific equipment and maintain the position on the treadmill. To the authors’ knowledge, the opportunity to mimic all types of terrain profiles makes this climatic wind tunnel unique.
The treadmill has an elliptical geometry at the front and rear ends, where the ratio between major and minor axes is 3 and the length of the half ellipse is 0.33 m. Underneath the treadmill, where parts of the airflow pass, an upper floor is mounted with a vertical distance to the treadmill’s lower surface, at inclination of 0°, of 0.36m and 0.56 m, at the front and rear ends, respectively. The upper floor connects at both ends to ramps, which in turn connect to the lower part of the honeycomb and the fan, respectively. On each side, between the upper floor and the treadmill, vertical walls prevent air from flowing to the sides. To avoid blocking the airflow passing underneath the treadmill, the motors are placed on both sides of the treadmill. Note that depending on long-term performance assessment, under-belt suction may be needed to further control the boundary layer thickness.
There is a corridor (g) (13.4 × 1.3 × 2.6 m3) on each side of the working section, from which personnel can monitor measurements, run the fan and treadmill and operate different types of measuring equipment. The corridors allow sufficient room for personnel and equipment during the experiments.
Both sides of each corridor have glass walls, which allow good eye contact between personnel and subjects performing on the treadmill, while separating the corridors from airflow in the working section and the recircling air in the main building. The large windows of the main building, those between the attached room and the wind tunnel, and the use of glass side walls for the working section allow daylight to enter the wind tunnel and make it an open and bright environment with little claustrophobic feeling. The glass walls facing inward towards the treadmill have slots (0.9 × 0.05 m2) with openings comprising approximately 30% of the total wall area. The slots also provide convenient openings to pass through hoses and cables for different types of measuring equipment and facilitate communication between personnel and subjects on the treadmill.
The treadmill and the fan can be operated manually via a steering console placed in (g) or via programmable software from any room in the wind tunnel (Bevi AB, Blomstermåla, Sweden), to provide different AF, treadmill belt speeds and gradients. The fan and treadmill can be run separately or together using the software. When both are running, the fan acts as a slave to the treadmill, where AF default is the same as treadmill belt speed, that is, no ambient wind conditions. This can easily be adjusted to take into account any wind coming from the front or rear.
The rain system is a custom-built system with three nozzles (NC 0707, BETE Fog Nozzle, Inc., Greenfield, Massachusetts, USA) located in the ceiling of the working section. The nozzles are centred between the side walls and in line with the airflow with a centre to centre (c-c) distance of 1.9 m, where the rear nozzle has a distance of 0.65 m up to a vertical point above the treadmill centre point. The system also includes a pressure-reducing valve with balanced seat, three 2-way hydronic valves to control the flow to each nozzle (DO6FN, Honeywell GmbH, Mosbach, Arnsberg, Germany) and an ultrasonic flow sensor for measuring water consumption (Multical 62, Kamstrup A/S, Skanderborg, Denmark). The rain system was checked with good results, so that the raindrops fall on the treadmill belt, regardless of AF.
A liquid chilling package with a cooling capacity of 230 kW at +7 °C/+12 °C on the refrigerant supplies the wind tunnel with cooling (Carrier 30Hz-091, Carrier AB, Göteborg, Sweden). In experiments when the fan is running, air from two air coolers is supplied in the main building ceiling (h) above the fan (AIA, LU-VE Sweden AB, Asarum, Sweden). In experiments when the fan is not used, ventilation and cooling are added into the inside of the working section via vents in the ceiling. Sensors that measure temperature and CO2 are located in the working section’s ceiling.
The rain and ventilation system are both run by a compact controller and a free programmable system software (Honeywell Hawk, COACH ax, Honeywell GmbH, Schöinach, Germany). The capacity of the ventilation and cooling system is controlled in the software that logs data from the CO2 and temperature sensors. Follow-ups show that the temperature can be kept stable within 1 °C from a set value (+8° to +25°) and that CO2 increases by no more than 0.01% during human experiments in the wind tunnel.
Validation
A validation of the working section AF was carried out using a four-hole Cobra Probe instrument (Turbulent Flow Instrumentation Pty Ltd, Tallangatta, Australia) attached to a thin rod carried out through the slots in the left and right side glass walls. The probe was positioned to measure AF at an angle parallel to the treadmill. Mean and standard deviations (SDs) were determined from a data output rate of 1250 Hz, chosen to have a Nyquist frequency significantly above any aerodynamic effects, thus capturing a mean of all true flow effects. A sampling time of 30 s was used to capture multiple length scales for AF (m/s), overall turbulence intensity (TI (%)) and yaw angle (YA (°)). The ambient air pressure, temperature, humidity and density were between 985 and 988 hPa, 18.0 °C and 18.5 °C, 32% and 39%, and 1.166 and 1.174 kg/m3, respectively, during the data collection.
The validation was conducted at a total of 27 (3 × 3 × 3) points in the volume above the treadmill belt. The 27 points were distributed throughout the area: three cross-sections perpendicular to the airflow, positioned at the front (FS), mid (MS) and rear (RS) part of the treadmill with a c-c distance of 1.75 m (X-coordinate); three corridors each in line with airflow, left (LC), mid (MC) and right corridor (RC) with a c-c distance of 1.0 m (Y-coordinate); and three planes parallel to the treadmill surface, low (LP), mid (MP) and high plane (HP) with a distance of 0.4, 1.4 and 2.4 m, respectively, above the treadmill belt (Z-coordinate). The three common central points, at MS, MC, LP, MP and HP, were determined from the treadmill upper surface area centre point. Thus, each section, corridor and plane contained a total of nine points, each compiled and reported as mean ± SD.
The validation of AF was carried out at the following angles and speeds of the treadmill: +10° at 3, 5 and 7 m/s; 0° at 3, 7, 11 and 14 m/s; and −5° at 7 and 14 m/s. The AF was chosen to match the treadmill belt speed, which was achieved by the following fan rotational speeds: 3 m/s, 128 r/min (22%); 5 m/s, 214 r/min (36%); 7 m/s, 300 r/min (50%); 11 m/s, 475 r/min (79%); and 14 m/s, 600 r/min (100%).
Also, to investigate the treadmill’s influence on the boundary layer, paired measurements were carried out with and without running the treadmill belt. Data were collected in the MC, at the front, mid and rear part of the treadmill, at the distances 0.05, 0.10, 0.15, 0.20, 0.30 and 0.40 m above the treadmill belt, at 0° and AF 3 and 10 m/s.
Statistical analyses were carried out using SPSS for Windows statistical software release 24.0 (SPSS, Chicago, IL, USA). One-way analysis of variance (ANOVA) with Bonferroni post hoc test was used for comparison of AF within and between the different sections, corridors and planes, and the Student’s paired t-test was used for comparison of the treadmill boundary layer.
Consistent flow conditions were observed with no significant (p > 0.05) difference in AF between each of the sections, corridors and planes over the range of AF at a +10° treadmill inclination. Similarly, there were no differences within and between sections and corridors at 0° and −5° declinations, except for MC versus LC at 0° at 3 m/s as shown in Table 3.
Results (mean ± SD) for AF, TI and YA measured at three different sections, corridors and planes above the treadmill and at various treadmill inclinations and speeds.
AF: airflow rate; TI: turbulence intensity; YA: yaw angle; FS: front section; MS: mid section; RS: rear section; LC: left corridor; MC: mid corridor; RC: right corridor; LP: low plane; MP: mid plane; HP: high plane.
p < 0.05: * versus RS, × versus LC, # versus RC, □ versus LP, ¤ versus MP.
However, significant (p < 0.05) differences in AF were found for planes HP versus LP on all tested AF at 0° and −5°. Similarly, there were differences for HP versus MP at 0° for 7, 11 and 14 m/s. Furthermore, differences in AF were also found for HP versus RS and HP versus LC on almost all tested AF at 0° and −5°, except for 0° at 3 m/s and −5° at 14 m/s, respectively. Finally, differences in AF were also found for HP versus RC at 0° for 11 and 14 m/s and between FS and RC at −5° for 14 m/s. The results show that AF is quite homogeneous within and between different sections, corridors and planes even in the worst-case scenarios, such as the maximal uphill and downhill cases. What deviates from this is primarily the top plane when the treadmill is in a horizontal and declined position. This has already been seen in the CFD study of predicted flow conditions. Even though it improved significantly from the case 1 to case 3 design, it was expected to remain to some extent at a level close to the ceiling. However, in practice, it is less important given that measurements on subjects are unlikely to take place more than 2 m above the treadmill surface.
The TI and YA were approximately 8% and ±3° in most cases, with slightly higher values at 10° inclination as shown in Table 3. Given the lack of turning vanes, ±3° should be considered excellent for YA. The TI is relatively high for a wind tunnel but could be reduced with the introduction of turbulence grids, but evidence for their requirement is needed (i.e. results of TI measured in the field). Measurements taken at indoor arenas will be much lower than those experienced outdoors and are generally taken to inform HVAC (Heating Ventilation and Air Conditioning) design. In order to straighten the flow and reduce turbulence levels into the working section, a honeycomb was positioned in the back of the bell mouth. The actual effect of the honeycomb in straightening and reducing TI appears quite clear. Without it, there would likely be a large crossflow from the upper to the lower part of the working section seen through a significantly increased YA.
There were significant (p < 0.05) differences in boundary layer, between the stationary and running treadmill belt, on the forward, mid and rear parts of the treadmill, except for the mid part of the treadmill at 10 m/s (p = 0.09). Significant differences also exist in the total mean at both 3 and 10 m/s. Figure 8 shows the results of the boundary layer measurements as mean ± SD from the forward, mid and rear parts of the treadmill. As can be seen, the treadmill belt movement has a positive impact on the boundary layer. Having the treadmill belt moving at the same speed as the AF almost completely thins out the boundary layer closest to the surface and makes the AF more homogeneous with the bulk flow. The overall implication is that the treadmill offers a significant improvement to the accuracy of the flow field, which will have a substantial impact on the accuracy of the physiological measurements.
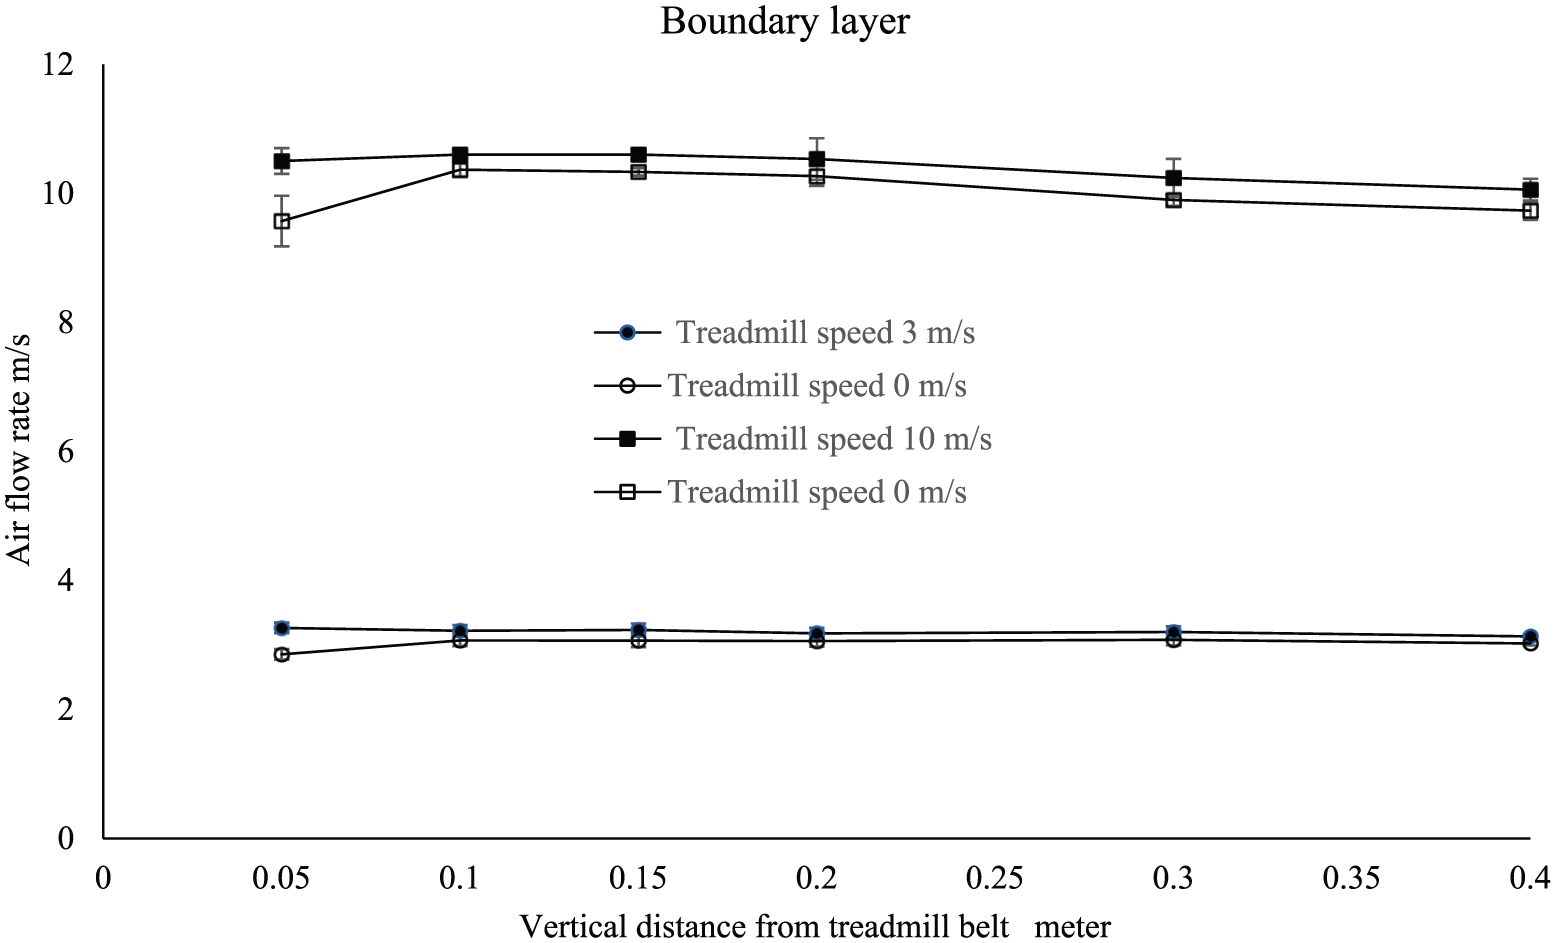
Comparison of boundary layer without versus with treadmill belt running at speeds 3 and 10 m/s. Mean ± SD from measurements on the forward, mid and rear parts of the treadmill.
Pilot study on a cross-country skier
To further validate the tunnel design and implementation, a pilot study was done on the influence of FD on
Furthermore, an additional experiment was undertaken to investigate the speed in downhills when acceleration no longer occurs (i.e. where equilibrium is achieved between gravity and rolling resistance and aerodynamic drag (FG – Fµ – FD = 0)). To calculate the CDA, the skier performed downhill rolling on the roller skis on treadmill declinations −1.9°, −2.8° and −3.8°. The position was tucked in order to minimize FD, and this was similar to the position adopted by the skier when outdoors on roller skis and when skiing on snow. A similar position can be seen in Spring et al. 21 for skier ‘A’.
During the experiments with the skier, the air density was 1.138 kg/m3. In order to quantify Fµ, the roller skis’µ R was determined (µ R = 0.025, PRO-SKI C2, 1.3 kg, Sterners, Dala-Järna, Sweden), using special equipment for this purpose and a normal force on a single roller ski similar to half of the skier’s body weight. 29
The investigation of the influence of aerodynamic drag on
Furthermore, the achieved maximal speed when downhill rolling on the three declinations −1.9°, −2.8° and −3.8° was 5.6, 11.1 and 13.9 m/s, respectively. Using equation (3), the CDA was calculated to be 0.32 ± 0.05 in this tucked position. When skiing downhill on snow or rolling downhill using roller skis, bicycle and so on, you will finally reach a speed when acceleration no longer takes place, provided that the drag area does not change, the slope is long enough and there is no change in declination. The experiment using the cross-country skier rolling downhill in a tucked position on the roller skis showed that a maximal speed and force equilibrium between FG versus Fµ and FD could be achieved on a treadmill, as is the case in outdoor situations. Without the significant impact of FD, it is not possible to achieve a maximal speed on a treadmill since the Fµ is not large enough to balance FG alone, that is, acceleration would continue until the speed of the skier exceeds the maximum speed of the treadmill. The pilot experiment with the skier showed that FD was a significant influencing power and should be included in experiments in cross-country skiing.
Conclusion
The climatic wind tunnel’s overall design, the results of the validation study and initial experiments on a skier showed that a unique and well-designed tunnel has been achieved that is well suited for physiological sports experimentation in various sports, particularly running, walking, cycling, cross-country skiing, speed skating and wheelchair riding. Athletes can be tested on the treadmill under the influence of aerodynamic drag, precipitation, frictional force and gravitational force, and companies in the sports and outdoor industries can test the functionality of their products and garments during physical activities that mimic their intended use.
Footnotes
Appendix 1
Numerical calculations were made to estimate how the raindrops fell to the treadmill with different size and airflow. From Figure 9, with
where m is the mass of the raindrop, v is the initial vertical velocity of raindrop from the nozzle, w is the horizontal wind speed, FW is the force on the raindrop from the wind in the wind tunnel, FD is the drag force on the raindrop and α is the angle between the drag force and the y coordinate.
We also have the relations
Calculations were made with a Runge–Kutta solver in MATLAB for different drop sizes and wind velocities. The size of the drops was from fine rain with a diameter of 0.5 mm to more normal rain with a drop diameter of 3 to 4 mm. Value of the coefficient k was estimated from meteorological data of the limiting speed for different drop sizes. The k value was assumed to be the same for both forces FD and FW. The aim of the calculations was to get a proper horizontal movement of the drop on its way from the nozzle to the treadmill. This was achieved with a suitable initial velocity v of the drop from the nozzle, which in its turn gave data for manufacturer of the water system.
Acknowledgements
The authors would like to thank their colleagues at Sports Tech Research Centre, Mid Sweden University, who participated in the applications for EU funds and supported the project in every way.
Declaration of conflicting interests
The author(s) declared no potential conflicts of interest with respect to the research, authorship, and/or publication of this article.
Funding
The author(s) disclosed receipt of the following financial support for the research, authorship, and/or publication of this article: Thanks are due to the European Union’s regional development fund, which provided financial support to certain parts of the project.