
Abstract
Genetic epidemiological studies on the prevalence and numbers of individuals with α1-antitrypsin deficiency in each of 97 countries worldwide were used to estimate the numbers in each of the five following phenotypic classes: PI*MS, PI*MZ, PI*SS, PI*SZ, and PI*ZZ. These 97 countries were then grouped into 10 major geographic regions to make it possible to compare the numbers in each of these five phenotypic classes in immediately adjacent countries. Such groupings also make it possible to review the spread of the PI*S and PI*Z alleles from one major geographic grouping to another in the world as well as the spread of these two deficiency alleles within a major geographic region. The data in the 10 tables on the numbers in each of the five phenotypic classes in the countries in the same geographic region as well as the prevalence of the PI*S and PI*Z alleles in countries in the same geographic region provide a novel database for the identification of large numbers of individuals in a given phenotypic class. The database also provides useful information for the identification of countries with high numbers of PI*ZZ individuals for augmentation therapy within a given geographic region.
Introduction
α1-Antitrypsin (AAT) deficiency is a recessive heritable metabolic disease that results in the synthesis and secretion of defective AAT. AAT is a 52 kDa α1 glycoprotein, composed of 394-amino-acid residues and three asparagine-linked complex carbohydrate side chains. It is produced mainly by hepatocytes and secreted into the blood, where it acts as a circulating serine protease inhibitor whose principal substrate is neutrophil elastase [Brantly et al. 1988a]. About 100 genetic variants of AAT are recognizable. Protease inhibitor (PI) M (medium mobility) is the normal allele, and the two most frequent deficient alleles are PI*S and PI*Z. PI*ZZ phenotype results in very low AAT serum concentration (10–15%), and PI*SZ, PI*SS and PI*MZ phenotypes result in low–intermediate serum AAT concentrations from 35% to 70%. The two most frequent deficiency alleles are PI*S (which expresses approximately 50–60% of AAT) and PI*Z (which expresses approximately 10–20% of AAT [Brantly et al. 1988b]. At least another 20 variants affect the amount and function of the AAT molecule. However, in clinical practice, most (96%) AAT deficiency related diseases are linked to the PI*ZZ type, and the remaining 4% to PI*SZ, and about another 30 rare or null phenotypes [Brantly et al. 1988; Stoller 2003a, 2003b]. Individuals who are homozygous for the PI*Z allele undergo significant intracellular polymerization of their AAT, showing a profound suppression of their circulating plasma AAT levels. The retained AAT polymers in the endoplasmic reticulum of hepatocytes can cause liver damage with a variable clinical presentation, from neonatal hepatitis to liver cirrhosis and hepatocellular carcinoma in adults, whilst the lack of circulating protein may promote development of chronic obstructive pulmonary disease (COPD) [Lomas et al. 1992].
In an earlier paper we discussed the possibility that AAT deficiency is not a rare disorder but one that is rarely diagnosed [de Serres et al. 2003]. Since it was known as a disease of white people from Northern Europe [Hutchison, 1990, 1998], little thought was apparently given in the medical community that this disease might affect other racial subgroups.
Using genetic epidemiology studies performed by others in the peer-reviewed medical literature, we started to collate data on the prevalence of the two most deleterious alleles, namely PI*S and PI*Z, outside of Northern Europe. In these papers we determined the number in each of the five phenotypic classes: PI*MS, PI*MZ, PI*SS, PI*SZ and PI*ZZ. with 95% confidence intervals on all estimates [Blanco et al. 2001a, 2001b, 2004, 2005; Blanco and Fernández, 2001; de Serres, 2002; de Serres et al. 2003a, 2003b, 2005a, 2005b, 2006a, 2006b, 2007]. These previous studies on the genetic epidemiology of AAT deficiency have demonstrated that this human genetic condition is widely distributed worldwide [Blanco et al. 2001a, 2001b, 2005a, 2005b, 2006, 2007; de Serres, 2002; de Serres et al. 2003a, 2003b].
In this paper, we have organized the overall database on the genetic epidemiology of AAT deficiency into 10 major geographic regions worldwide. The database comprises studies performed by others in the peer-reviewed medical literature on 97 of the 193 countries worldwide. Within each of these 10 major geographic regions, we have highlighted the database for the individual country, among those listed, that has the highest numbers in each of the following phenotypic classes: PI*MS, PI*MZ, PI*SS, PI*SZ, and PI*ZZ.
Materials and methods
Estimates of the total population in each country
Estimates of the total population of each country as of July 2011 were obtained from the Central Intelligence Agency site (https://www.cia.gov/library/publications/the-world-factbook/index.html).
Source of genetic epidemiological studies for PI*S and PI*Z and estimates of the prevalence for each of these two major deficiency alleles
The articles used in this study were obtained through a variety of sources and our research strategy for selection of relevant genetic epidemiological studies has been discussed in earlier publications [de Serres, 2002; de Serres et al. 2003a, 2003b; Blanco et al. 2006]. In this study, the overall database has been increased from 69 countries in our most recent publication [de Serres et al. 2007] to 97 countries. The data reported by two valuable studies published in 2010 and 2011 were added to our original database [Spínola et al. 2009; Carroll et al. 2011]. These 97 countries are only those out of a possible 193 countries worldwide (https://www.cia.gov/library/publications/the-world-factbook/index.html) where there are genetic epidemiological studies on AAT deficiency in the peer-reviewed medical literature.
For the present analysis, these countries were classified into eight geographic regions, namely, geographic region 1 – North Africa, with the following countries in alphabetic order: Cameroon, Cape Verde, Gambia, Mali, Morocco, Nigeria, Somalia and Tunisia; geographic region 2 – Central and South Africa, with the following countries: Angola, Botswana, Democratic Republic of the Congo, Mozambique, Namibia, Republic of the Congo and South Africa; geographic region 3 – Northern Europe, with the following countries: European Russia, Denmark, Estonia, Finland, Iceland, Latvia, Lithuania, Norway, Poland and Sweden; geographic region 4 – Eastern Europe, with the following countries: Albania, Austria, Bosnia-Herzegovina, Greece, Hungary, Macedonia, Romania and Serbia; geographic region 5 – Western and South Europe, with the following countries: Belgium, England, France, Germany, Italy, Netherlands, Northern Ireland, Portugal, Republic of Ireland, Scotland, Spain and Switzerland; geographic region 6 – North and Central Asia, with the following countries: Asian Russia, Afghanistan, India, Iran, Israel, Jordan, Kazakhstan, Nepal, Pakistan, Saudi Arabia and Tajikistan; geographic region 7 – Southeast Asia, Australia and New Zealand, with the following countries: Australia, China, Indonesia, Japan, Malaysia, Mongolia and New Zealand; geographic region 8 – North and Central America, with the following countries: Canada, Costa Rica, El Salvador, Guatemala, Honduras, Mexico, Nicaragua, Panama and the United States of America; geographic region 9 – Caribbean, with the following countries: Cuba, Dominican Republic, Haiti, Jamaica, Puerto Rico and Trinidad & Tobago; geographic region 10 – South America, with the following countries: Argentina, Brazil, Bolivia, Chile, Colombia, Ecuador, Guyana, Paraguay, Peru, Suriname, Uruguay and Venezuela.
Estimating the numbers in each of five phenotypic classes (PI*MS, PI*MZ, PI*SS, PI*SZ and PI*ZZ) and gene frequencies of PI*S and PI*Z with 95% confidence intervals
The formulas for developing estimates of the two deficiency allele frequencies and 95% confidence intervals were discussed in earlier articles [de Serres et al. 2003a; Blanco et al. 2004]. In addition, the most recent population estimates for each of these 97 countries obtained from the CIA website (https://www.cia.gov/library/publications/the-world-factbook/index.html) were used to make all calculations concerning the numbers (with 95% confidence intervals of each of five phenotypic classes: PI*MS, PI*MZ, PI*SS, PI*SZ and PI*ZZ) as well as the prevalence of the two deficiency alleles, namely PI*S and PI*Z.
Results
Figures 1–10 make it possible to compare the prevalence of the two major deficiency alleles PI*S and PI*Z in each of the 10 geographic regions. All prevalences are expressed as cases per 1000 population. Summaries of the numbers of each of the five PI phenotypes for carriers and deficiency alleles among countries included in these 10 geographic regions are given in Tables 1–10. The country with the highest number in each of the five phenotypic classes is indicated in bold type. It is important to note that each estimate in bold type in these 10 tables could be as low as the lower confidence interval or as high as the upper 95% confidence interval.

Prevalences of the PI*S and PI*Z deficiency alleles in geographic region 1 – North Africa. Prevalences are expressed as cases per 1000 population.

Prevalences of the PI*S and PI*Z deficiency alleles in geographic region 2 – Central and South Africa. Prevalences are expressed as cases per 1000 population.

Prevalences of the PI*S and PI*Z deficiency alleles in geographic region 3 – Northern Europe. Prevalences are expressed as cases per 1000 population.

Prevalences of the PI*S and PI*Z deficiency alleles in geographic region 4 – Eastern Europe. Prevalences are expressed as cases per 1000 population.

Prevalences of the PI*S and PI*Z deficiency alleles in geographic region 5 – Central and South Europe. Prevalences are expressed as cases per 1000 population.

Prevalences of the PI*S and PI*Z deficiency alleles in geographic region 6 – North and Central Asia. Prevalences are expressed as cases per 1000 population.

Prevalences of the PI*S and PI*Z deficiency alleles in geographic region 7 – Southeast Asia; Australia and New Zealand. Prevalences are expressed as cases per 1000 population.

Prevalences of the PI*S and PI*Z deficiency alleles in geographic region 8 – North and Central America. Prevalences are expressed as cases per 1000 population.

Prevalences of the PI*S and PI*Z deficiency alleles in geographic region 9 – Caribbean. Prevalences are expressed as cases per 1000 population.
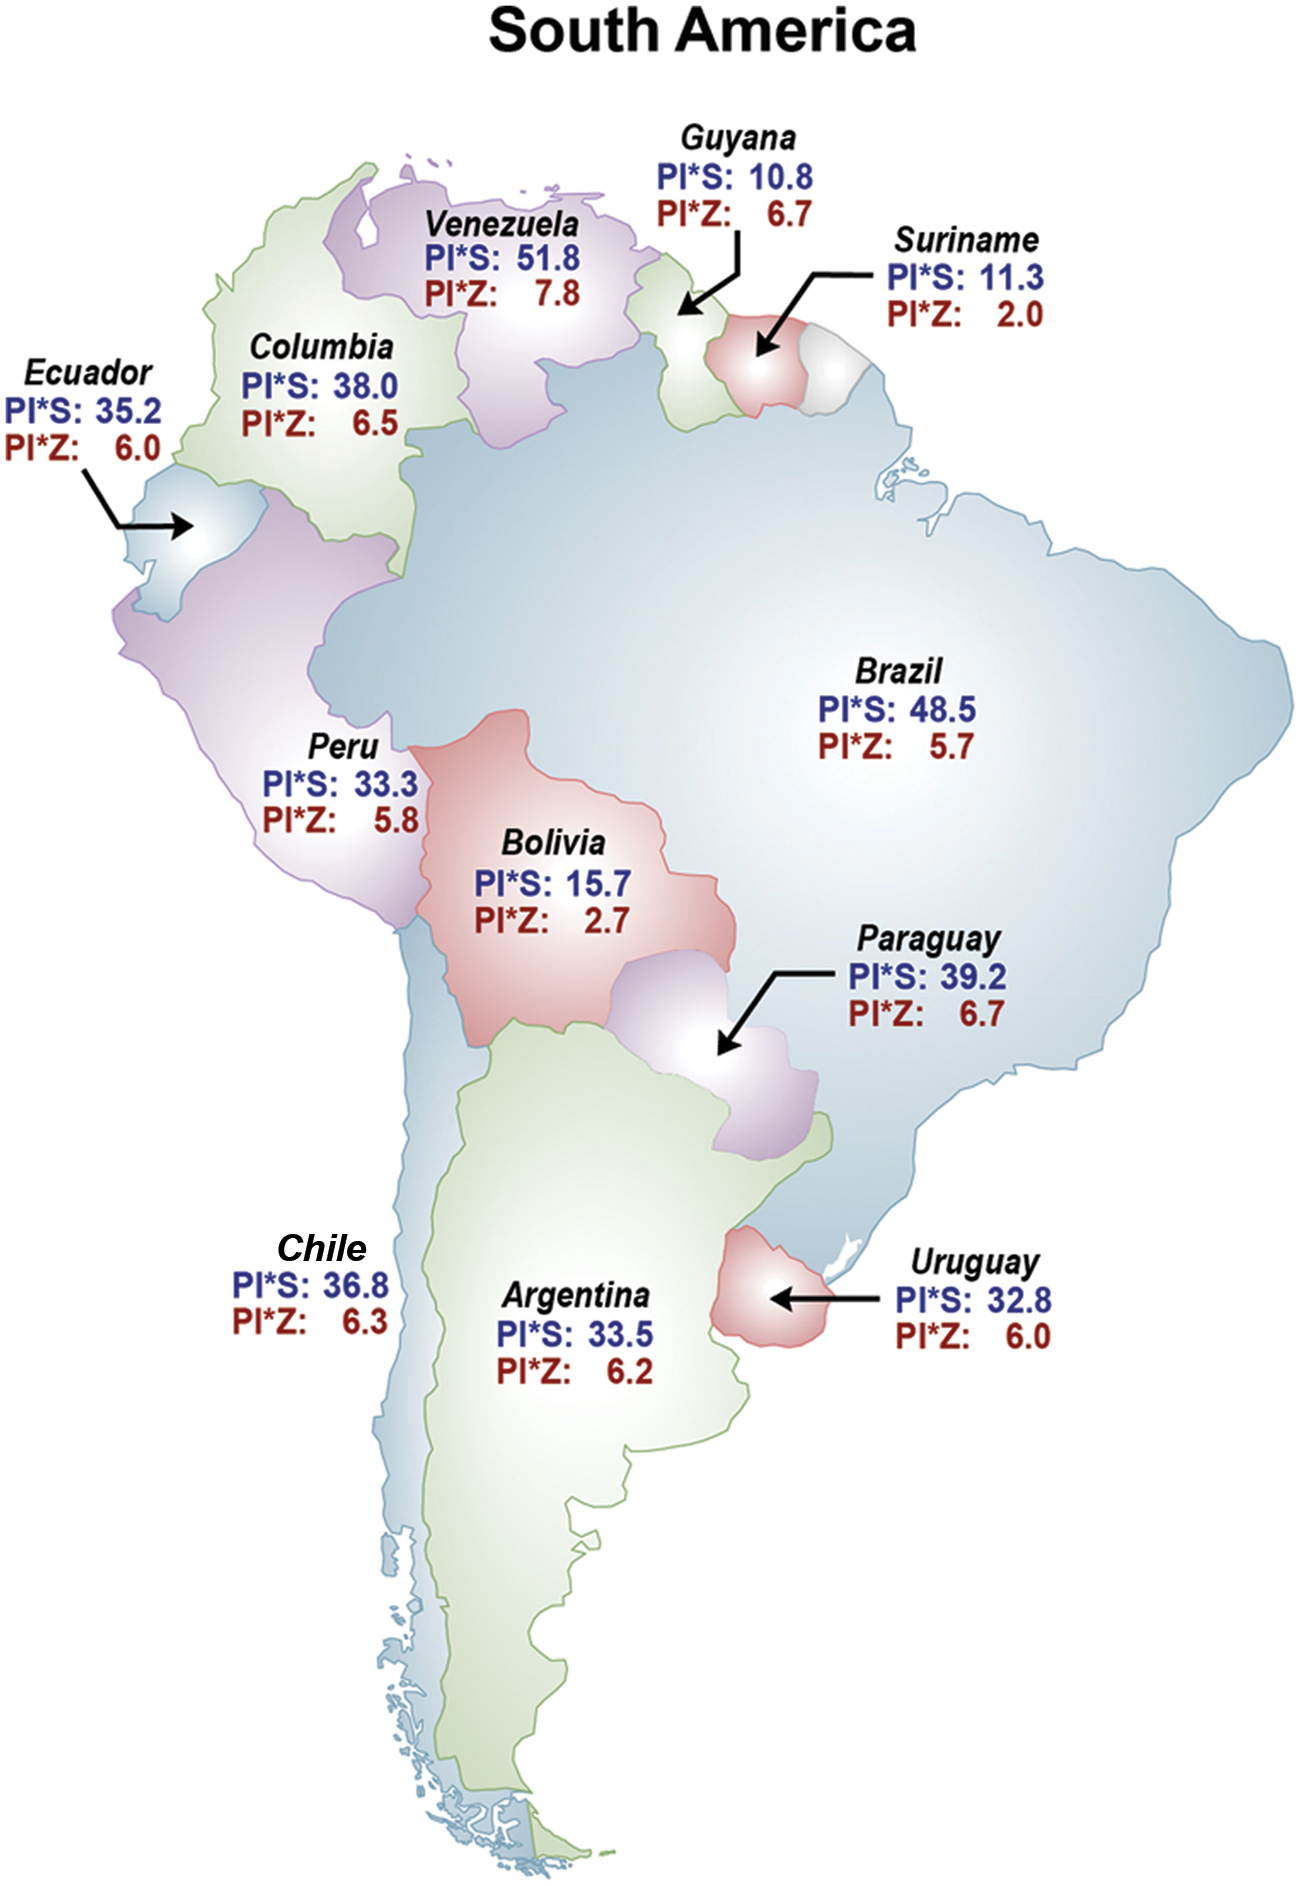
Prevalences of the PI*S and PI*Z deficiency alleles in geographic region 10 – South America. Prevalences are expressed as cases per 1000 population.
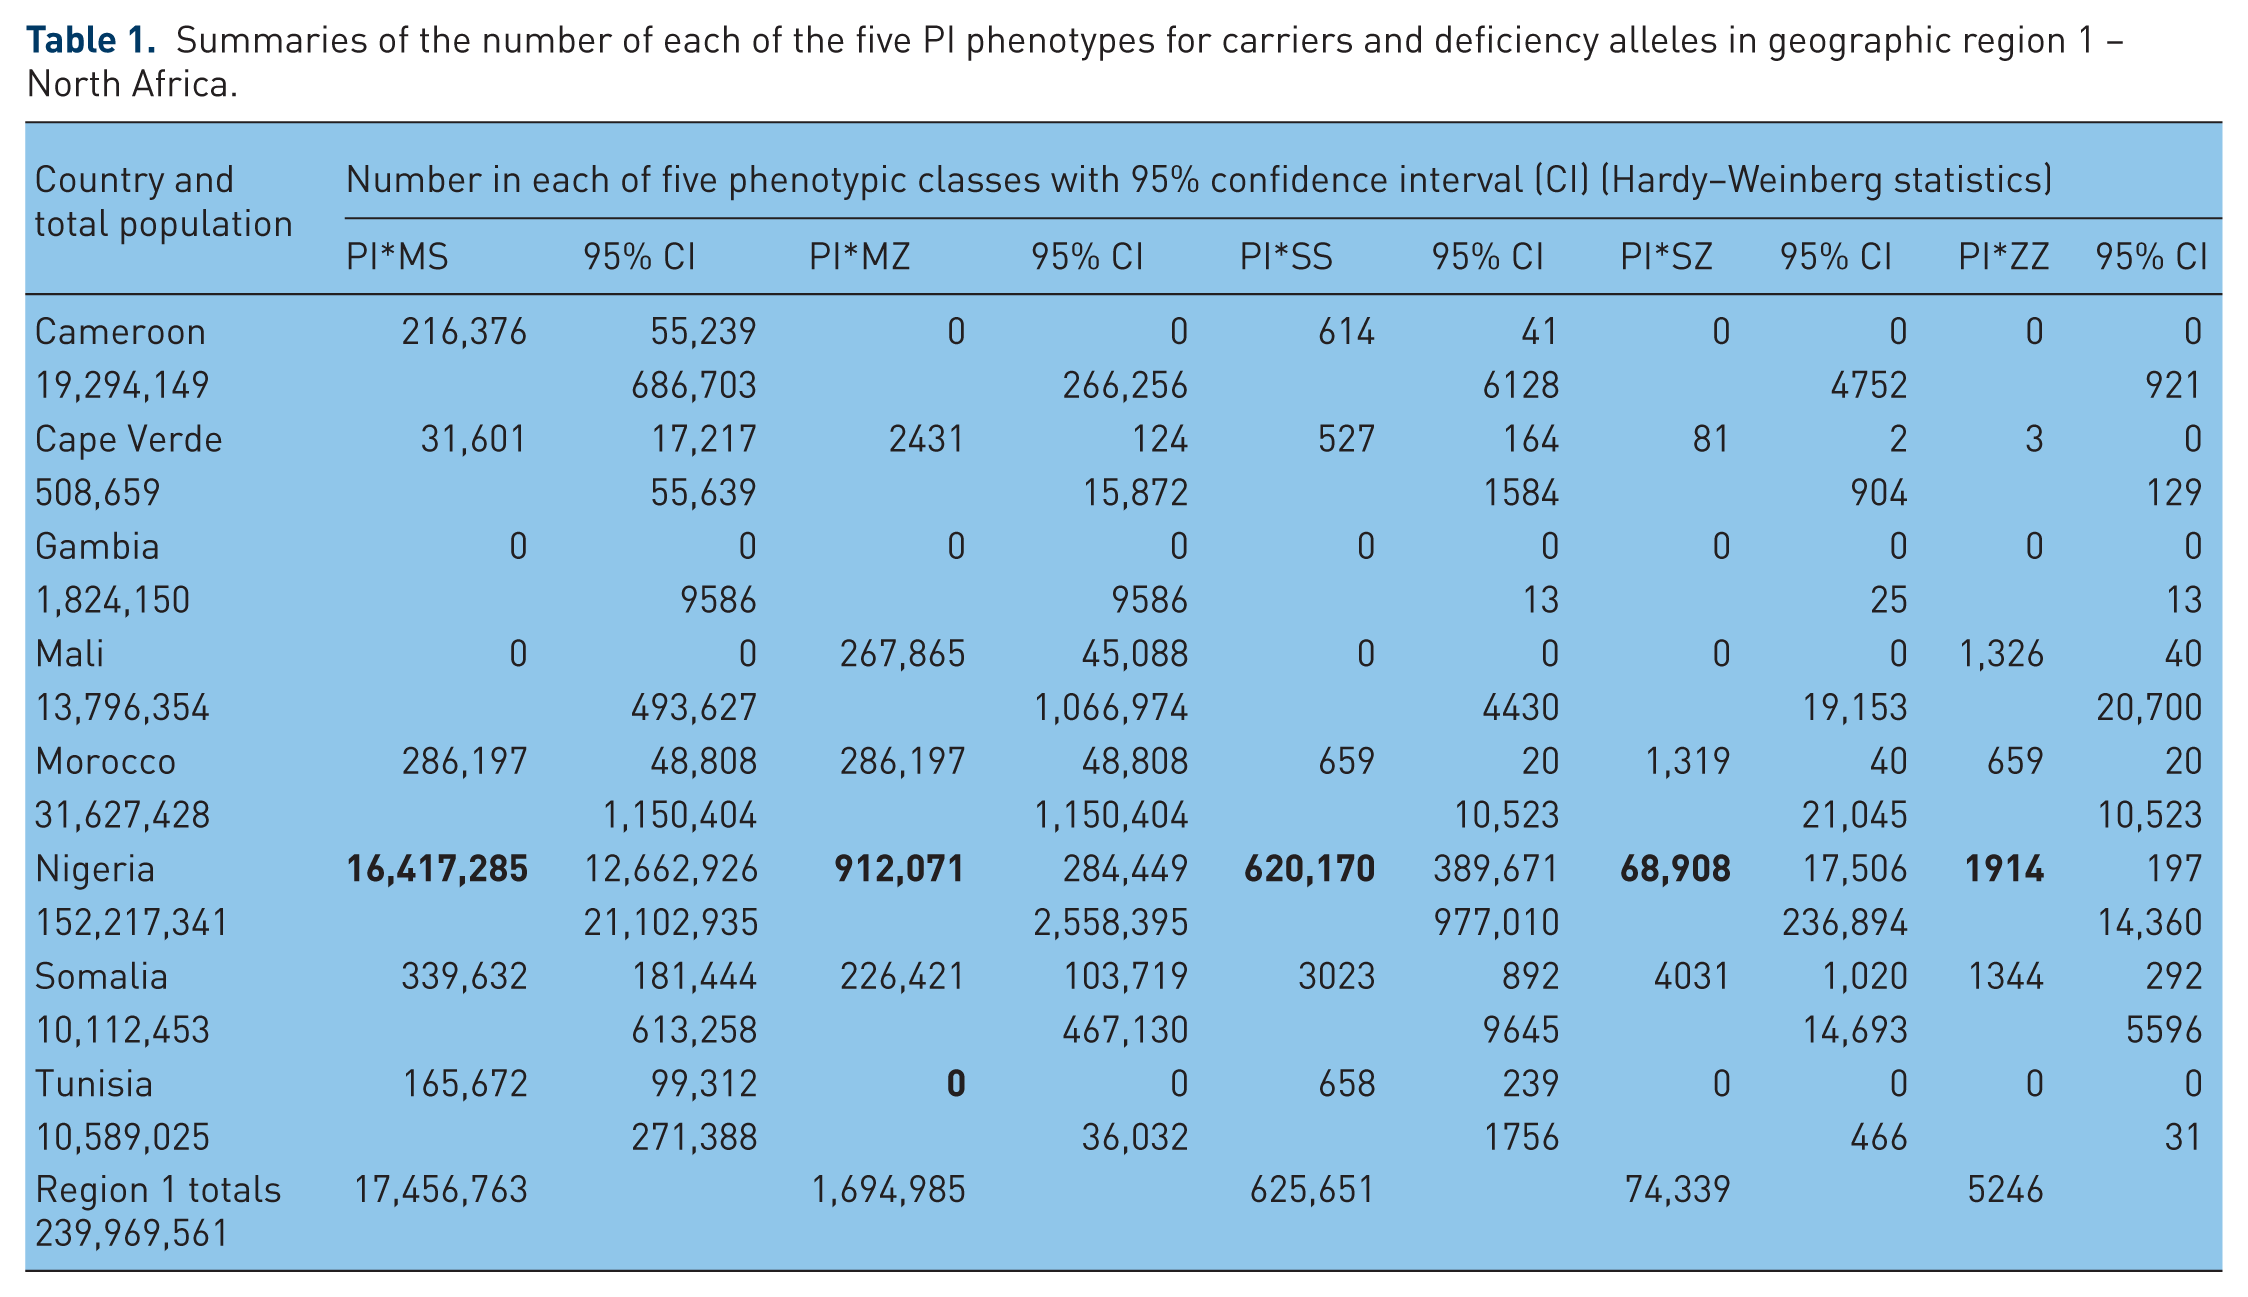
Summaries of the number of each of the five PI phenotypes for carriers and deficiency alleles in geographic region 1 – North Africa.
Summaries of the number of each of the five PI phenotypes for carriers and deficiency alleles in geographic region 2 – Central and South Africa.

Summaries of the number of each of the five PI phenotypes for carriers and deficiency alleles in geographic region 3 – Northern Europe.

Summaries of the numbers of each of the five PI phenotypes for carriers and deficiency alleles in geographic region 4 – Eastern Europe.

Summaries of the numbers of each of the five PI phenotypes for carriers and deficiency alleles in geographic region 5 – Central and Western Europe.

Summaries of the numbers of each of the five PI phenotypes for carriers and deficiency alleles in geographic region 6 – North and Central Asia.

Summaries of the numbers of each of the five PI phenotypes for carriers and deficiency phenotypes in geographic region 7 – East Asia, Australia and New Zealand.

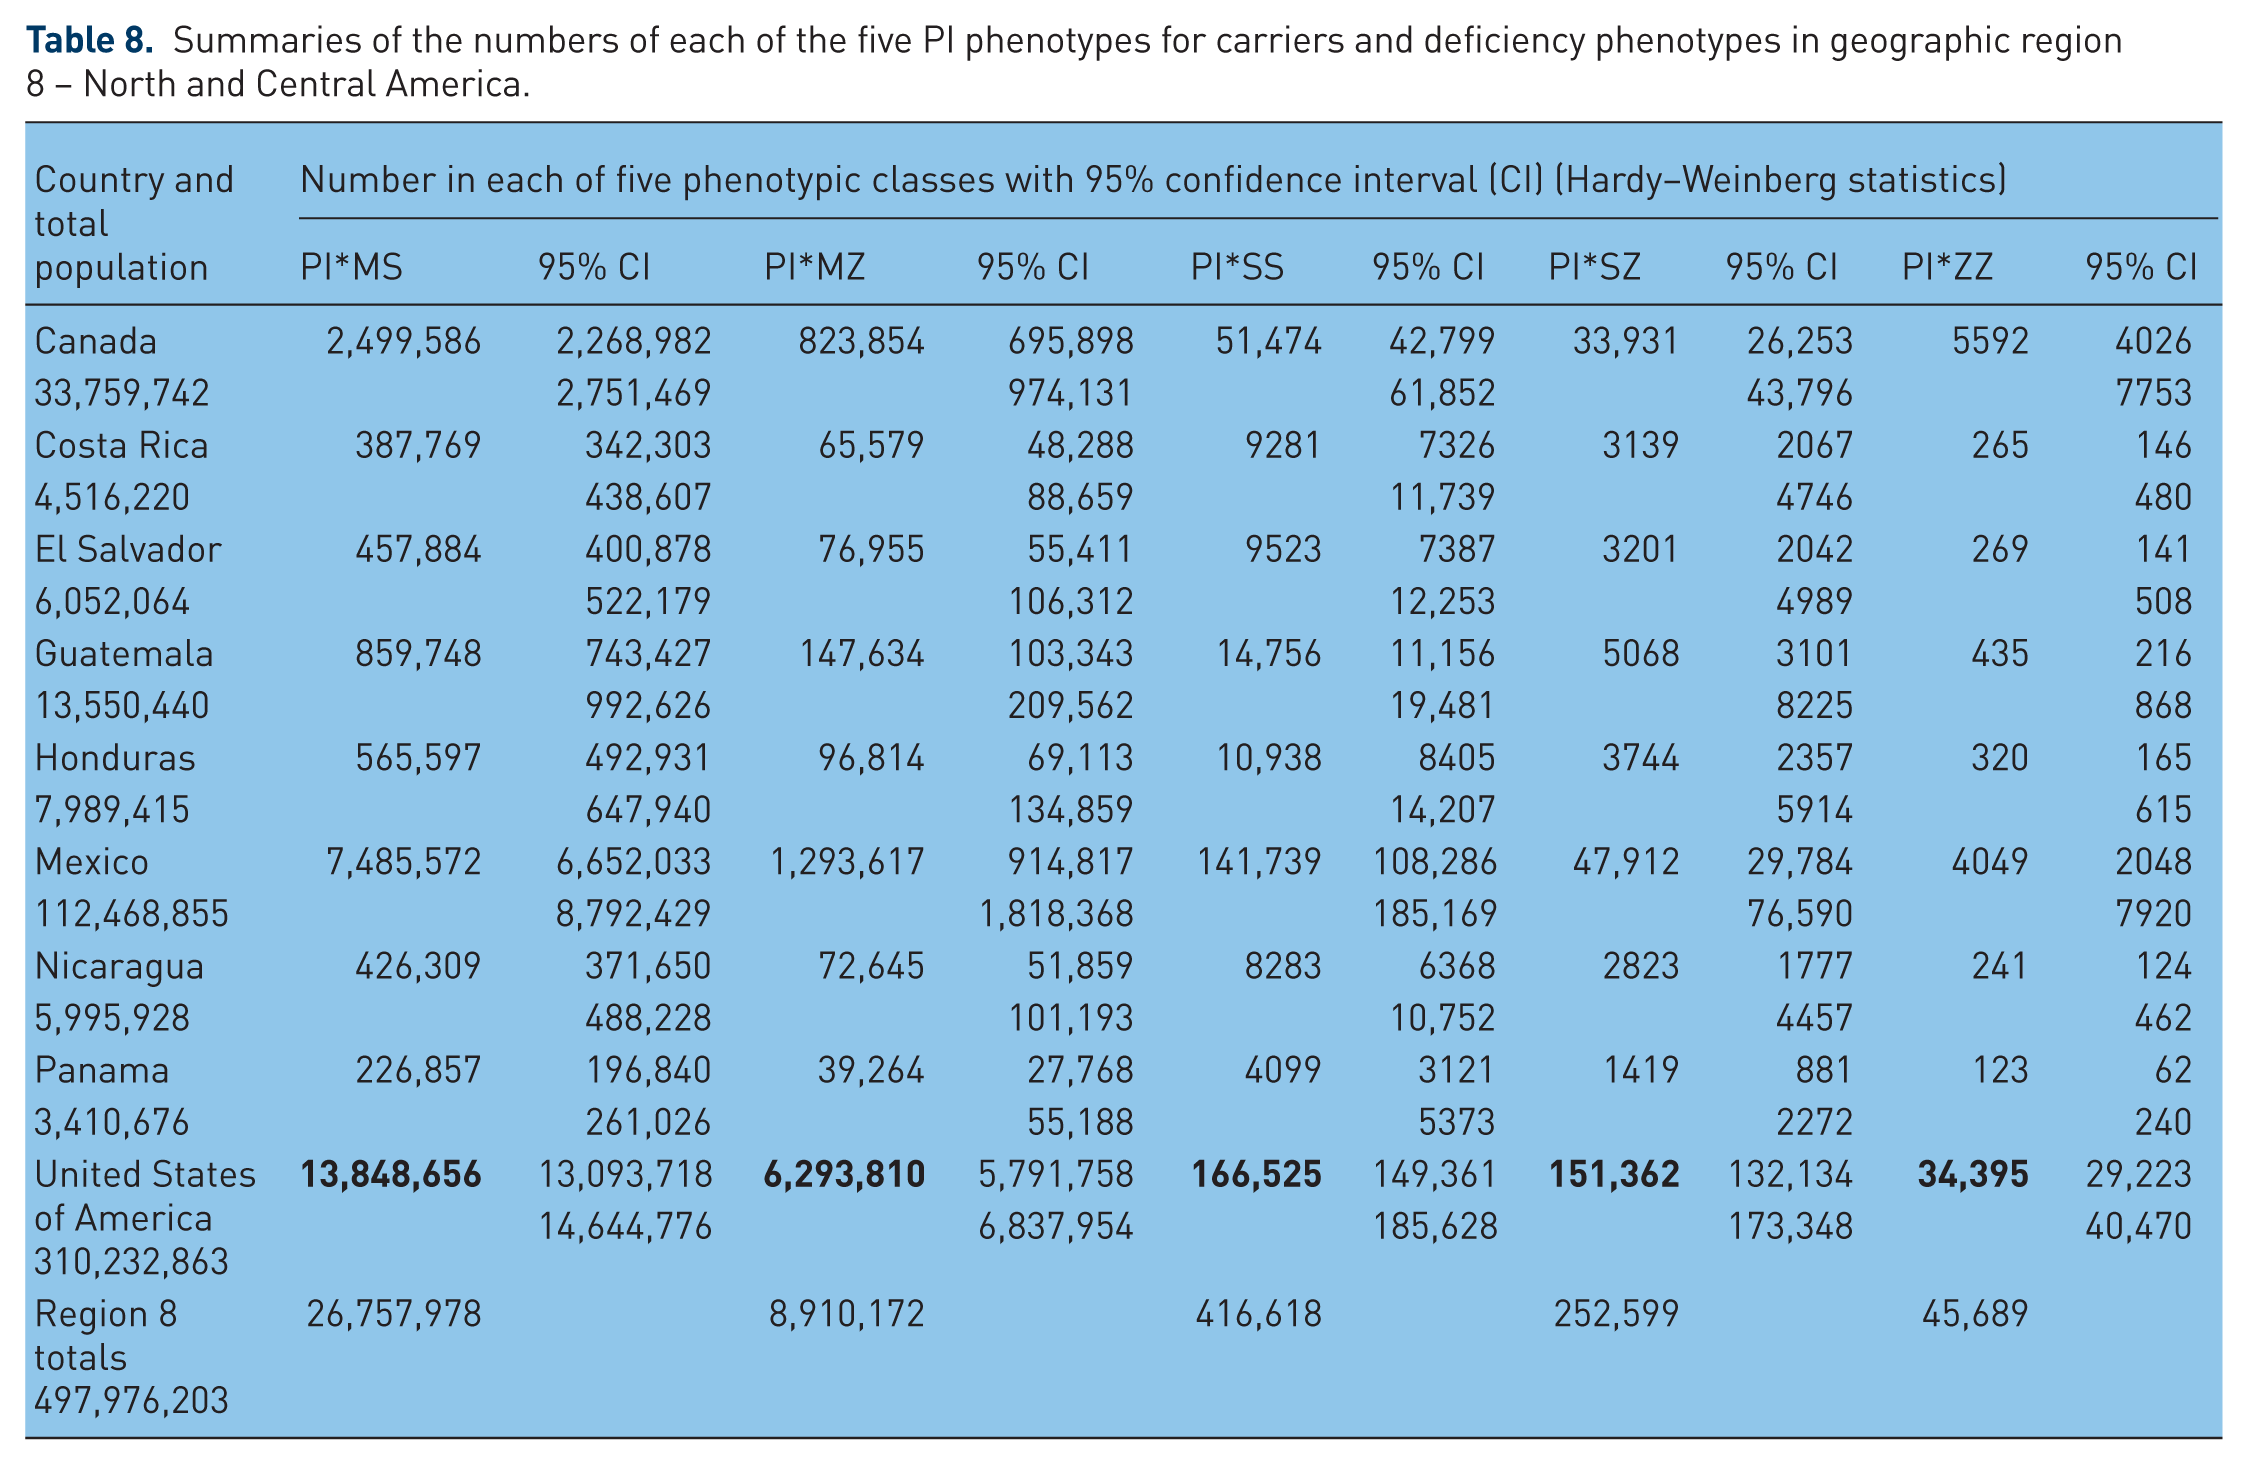
Summaries of the numbers of each of the five PI phenotypes for carriers and deficiency phenotypes in geographic region 8 – North and Central America.
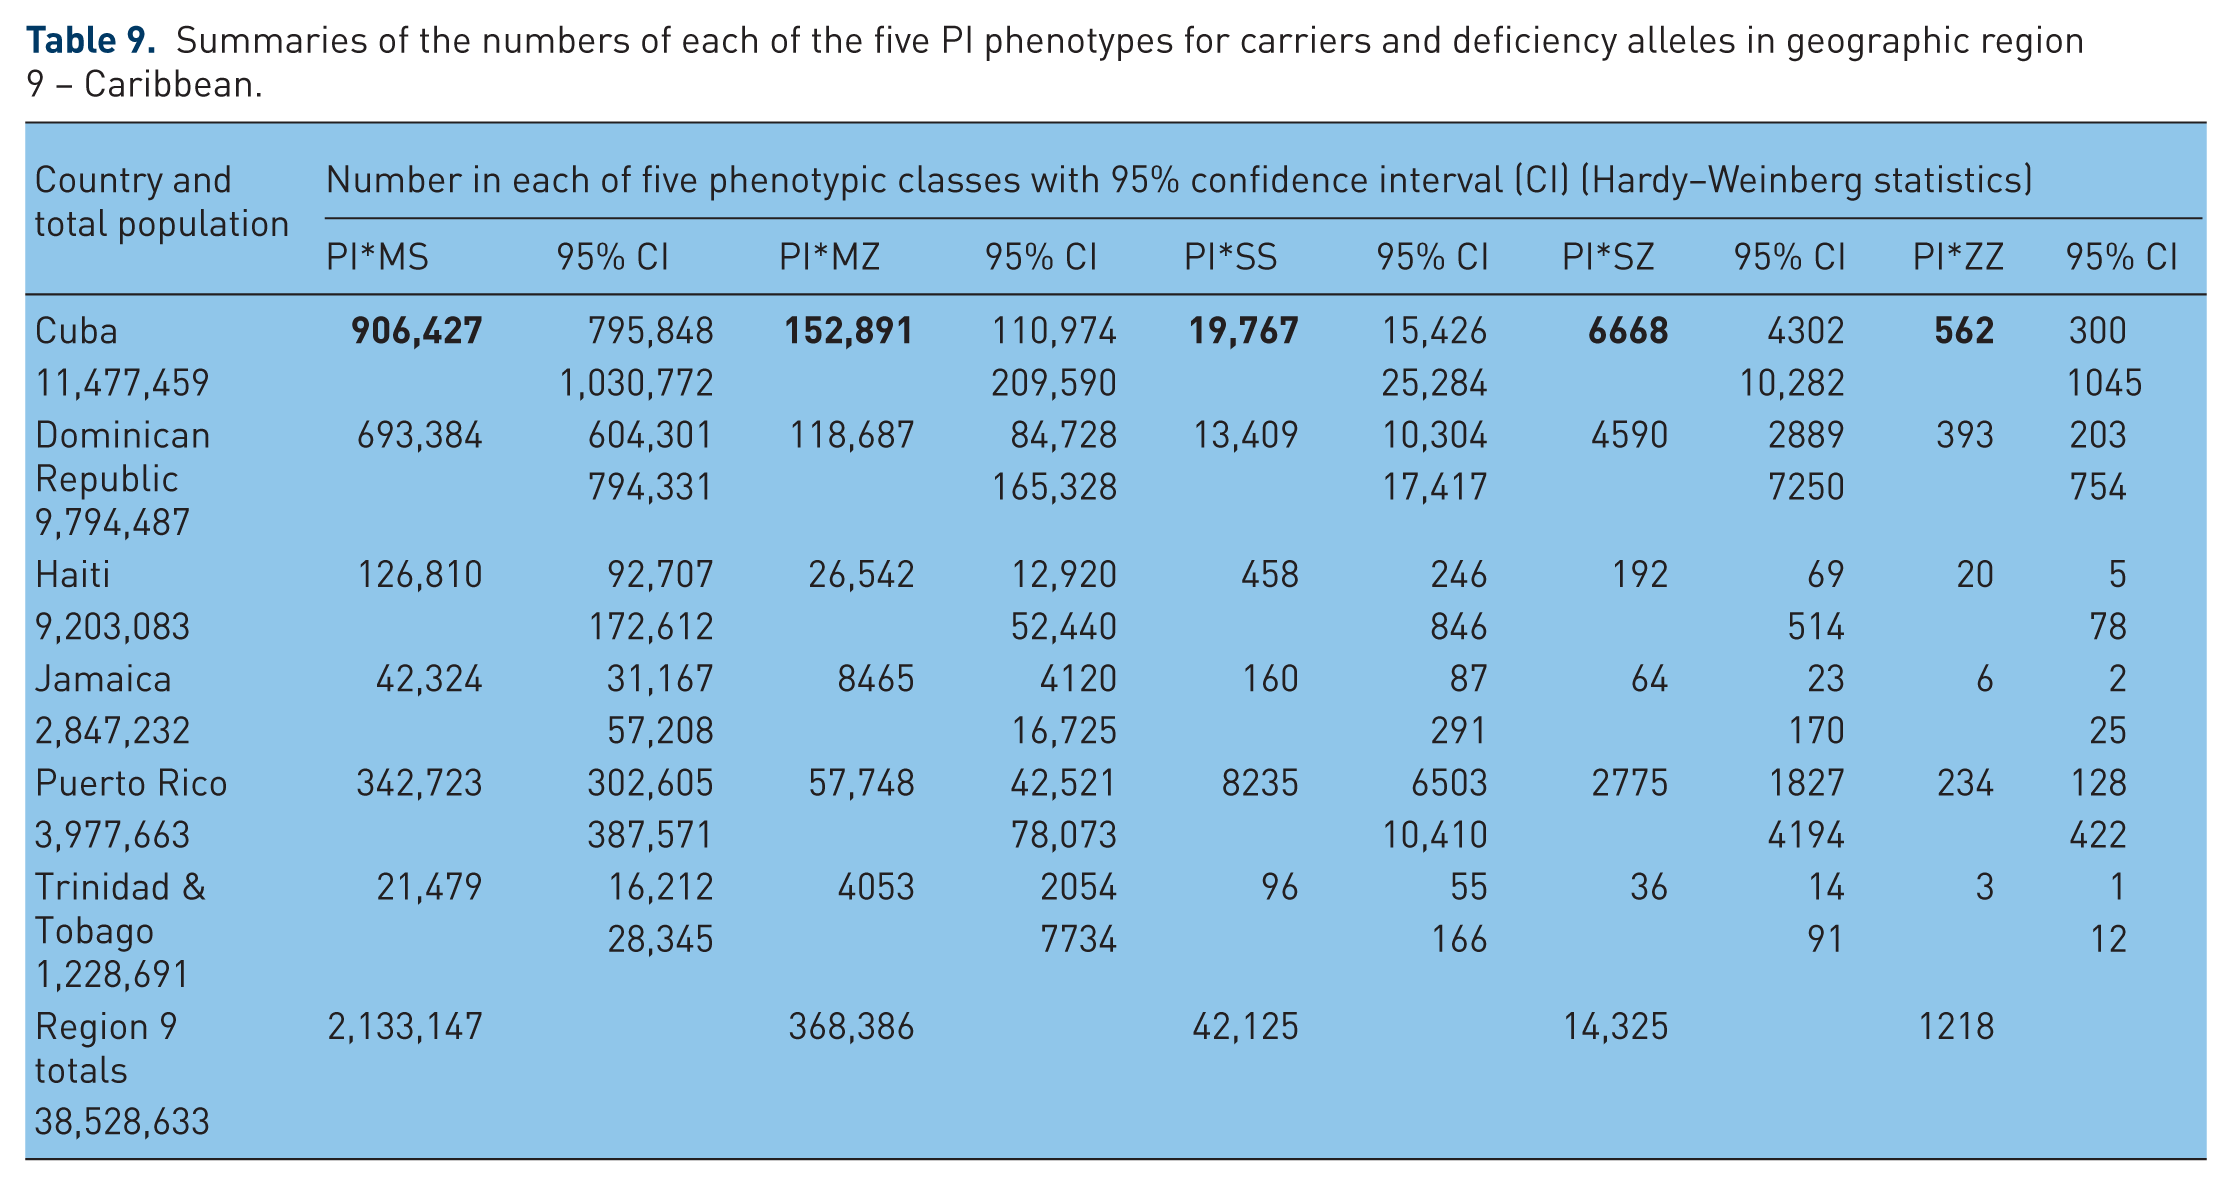
Summaries of the numbers of each of the five PI phenotypes for carriers and deficiency alleles in geographic region 9 – Caribbean.
Summaries of the numbers of each of the five PI phenotypes for carriers and deficiency alleles in geographic region 10 – South America.

In Figure 1 – North Africa – Pi*S frequencies range from 0.0 in Mali to 63.8 in Nigeria, and PI*Z frequencies range from 0.0 in Tunisia, Gambia and Cameroon to 11.5 in Somalia. The highest numbers of deficiency genotypes of all classes are in Nigeria.
In Figure 2 –Central and South Africa – Pi*S frequencies range from 0.0 in Republic of the Congo to 188 in Angola, and PI*Z frequencies are 0.0 in all these regions. The highest numbers of MS and SS genotypes were estimated for Angola, but remarkably, none of these African regions have MZ, SZ or ZZ genotypes.
In Figure 3 – Northern Europe – Pi*S frequencies range from 7.3 in Finland to 31.3 in Latvia, and PI*Z frequencies range from 0.0 in Iceland to 45.1 in Latvia. Very high frequencies of PI*Z are also found in Denmark and Estonia (with 27.9 and 24.5 per 1000 respectively). The highest numbers of MS, MZ, SS and SZ genotypes are in European Russia, and the highest numbers of the ZZ phenotype are found in Latvia (4519) and in Denmark (4033).
In Figure 4 – Eastern Europe – PI*S frequencies range from 0.0 in Albania and Bosnia-Herzegovina to over 21 in Austria and Greece, and PI*Z frequencies range from 0.0 in Albania to 13.3 in Austria. The highest numbers of MS and SS genotypes are in Greece, the highest numbers of MZ and ZZ are in Romania, and the highest number of SZ (almost 5000) is in Austria.
In Figure 5 – Central and Western Europe – PI*S frequencies range from 100–200 per 1000 in the Iberian Peninsula to 19 in Northern Ireland. PI*Z frequencies range from 7 in Switzerland to 30 in Portugal. The highest number of PI*MS genotypes is in France. The highest numbers of PI*SS and PI*SZ are in Spain. Spain with around 12,000, England, France and Germany with around 8000–11,000 each have very high numbers of ZZ genotypes. Portugal with almost 5000 also shows an important number of PI*ZZ genotypes.
In Figure 6 – North and Central Asia – PI*S frequencies range from 0.0 in Nepal and Kazakhstan to 31 in Saudi Arabia. PI*Z frequencies range from less than 1 in Nepal, India, Jordan and Israel to 15 in Saudi Arabia. India and Pakistan show the highest numbers of PI*MS (over 3.5 million each). Saudi Arabia and Pakistan show the highest numbers of PI*SS (over 20,000 each). Pakistan, with almost 4 million MZ, 36,000 SZ and 15,000 ZZ is the country with the highest numbers of deficient genotypes in this geographic area.
In Figure 7 – East Asia, Australia and New Zealand – PI*S frequencies range from 0–1 per 1000 in Japan, Mongolia and China to 33–43 in New Zealand and Australia. PI*Z frequencies range from 0–1 in Indonesia, China and Japan to 12–26 per 1000 in Australia and New Zealand. The highest number of MS genotypes is in China with 2.5 million. The highest numbers of MZ (about 500,000), SS (about 40,000) and SZ (about 22,000) genotypes are in Australia. Australia and New Zealand, with about 3000 ZZ each, are the countries with the highest numbers of this very deficient AAT genotype. The PI*ZZ genotype is rarely found in Malaysia and it is practically absent in China, Indonesia, Japan and Mongolia.
In Figure 8 – North and Central America – PI*S frequencies range from 23 in the USA to 30–45 in Central American states. PI*Z frequency ranges from 6–8 in Mexico and Central America to 10 and 13 in the USA and Canada respectively. The USA with almost 14 million MS, 6 million MZ, 160,000 SS, 150,000 SZ and 34,000 ZZ is the country with the highest number of AAT deficiency genotypes.
In Figure 9 – Caribbean – PI*S frequencies range from 7–9 per 1000 in Jamaica, Haiti, and Trinidad & Tobago to around 40 per 1000 in Cuba, Puerto Rico and Dominican Republic. The highest number of AAT deficiency genotypes is in Cuba, with approximately 900,000 MS, 150,000 MZ, 20,000 SS, 7000 SZ and 500 ZZ.
In Figure 10 – South America – the PI*S and PI*Z frequencies range from 30 and 50 for PI*S to 5–8 per 1000 for PI*Z in most populated countries (i.e. Brazil, Argentina, Colombia, Venezuela). The higher number of AAT deficiency genotypes is in Brazil, with approximately 18 million MS, 2 million MZ, 500,000 SS, 100,000 SZ and 6000 ZZ.
Population size summaries of the numbers in each of the five phenotypic classes of PI*S and PI*Z for all 97 countries in 10 geographic regions with data on the genetic epidemiology of alpha-1 antitrypsin deficiency (AATD)
As shown in Table 11, in a total population of 5,264,150,044 in the 97 countries in 10 geographic regions with data on the genetic epidemiology of AAT deficiency there are a total of 190,574,275 AAT deficiency genotypes. Of these, 181,894 (0.1%) are PI*ZZ; 1,269,054 (0.7%) are PI*SZ; 4,017,900 (2.1%) are PI*SS; 42,564,136 (22.3%) are PI*MZ, and the remaining 142,541,291 (74.8%) are MS genotypes.
Estimates of the numbers in each of five genotypic classes based on the genetic epidemiology of AATD in 98 of the 193 countries worldwide.

Discussion
In the last 49 years, following the report on AAT deficiency by Laurell and Eriksson [Laurell and Eriksson, 1963] in Malmöe, Sweden, a number of genetic epidemiology surveys have been performed, so that currently we have a global view of the AAT deficiency distribution worldwide. According to the present estimate there may be over 190 million deficiency genotypes in the 97 countries of the world, with data on the genetic epidemiology of AAT deficiency. However, 75% of them are only slightly deficient MS genotypes with no recognized risk of developing AAT deficiency related diseases; 24% are MZ and SS genotypes with a controversial but potential risk of developing AAT deficiency related diseases; 0.7% are SZ genotypes with increased risk for AAT deficiency related diseases; and 0.1% are ZZ genotypes, with a well established increased risk for development of AAT deficiency related diseases. According to the data from this study, 60% of all ZZ genotypes worldwide are in individuals living in Europe and North America, with Northern and Central Europe having over 74,000 of these subjects (41% of the total), and North America having over 44,000 of these ZZ subjects (24% of the total). In addition, 48% of all the SZ genotypes are also in Northern and Central Europe, 20% in North and Central America, and 16% in South America.
We have found that one of the most striking features of the prevalence of PI*S and PI*Z deficiency alleles is that the highest or lowest prevalence is isolated to a given country and not shared with immediately adjacent countries in the same geographic populations. For example, in geographic region 3 – Northern Europe, the highest prevalence of the PI*ZZ deficiency class is found in Latvia but not in the immediately adjacent countries: European Russia, Estonia or Lithuania. Thus, it may be that each country can be considered as isolated inbreeding populations where marriages occur between individuals in immediately adjacent villages, towns or cities rather than, in the main part, between individuals in other countries. However, we are aware that our calculations can have important limitations, most of them related to the method of selection of the cohorts and the sample size of the analyzed studies. In fact, the surveys on which we based our calculations included a wide variety of subjects, such as, blood donors, neonates, various groups of workers, students, laboratory or hospital staff, selected populations poorly representative of the general population (so-called ‘natives’), and only a few randomly selected unrelated healthy individuals from the general population. In addition, our approach using PI*M, PI*S and PI*Z gene frequency with the Hardy–Weinberg equilibrium formula to estimate the total number of subjects with deficiency variant combinations in a given country or geographic region, taking into account the overall population, undoubtedly has potential biases, especially in regions with different ethnic or racial groups. Therefore the results should be considered with caution. However, our analysis has not taken into account the rare (which are called ‘rare’ due to their low prevalence) and null AAT deficiency variants, due to the lack of available studies. Prevalence of the rare variants may be higher than was previously believed because they can be mistaken for the PI*Z variant and thus misdiagnosed. A recent revision of 3511 AAT deficiency determinations performed at the Spanish Registry Laboratory, from 1998 to 2010, detected 1.6% of cases with rare AAT alleles, a rate similar to those reported in other European studies [Rodriguez-Frias et al. 2012]. Hence, the so-called ‘rare’ AAT alleles may not be as rare as assumed. It has even been suspected that rare AAT deficiency variants could be more frequent in those countries in which the gene frequency of PI*Z is lower, such as in some Mediterranean and North African countries [Denden et al. 2009].
Therefore, despite these caveats, the overall estimates of carriers and severe AAT deficiency subjects worldwide appear impressive, suggesting that AAT deficiency is probably one of the most common hereditary under-recognized disorders in the world, with only a small minority of subjects currently detected. The results of the present analysis support the concept of targeted screening for AAT deficiency in countries with large populations of white patients with COPD [de Serres et al. 2006]. The availability of AAT replacement therapy for individuals with pulmonary emphysema associated with AAT deficiency encouraged the scientific community to establish and reinforce AAT deficiency screening programs even in countries not previously considered to have a high prevalence of the disorder, and to implement national registries [Stoller et al. 2003]. In the future, with the publication of case studies on health problems associated with the PI*MS, PI*MZ, PI*SS or PI*SZ alleles, the data presented in the 10 tables can be utilized to identify larger numbers of individuals with a given phenotype in particular countries in each of these 10 geographic regions.
Conclusion
The overall data on the numbers of individuals in the countries in each geographic region and the prevalence of the PI*S and PI*Z deficiency alleles demonstrate the spread of these two alleles to many different countries worldwide from those countries where they arose generations ago. It appears that as a result of this spread by migrating populations, inbreeding populations have been established within given countries with prevalences not necessarily shared by immediately adjacent countries within a given geographic region.
The genetic epidemiological data on the prevalence of the two most common deficiency alleles PI*S and PI*Z have shown that they exist in many countries worldwide where there are genetic epidemiological studies in the peer-reviewed medical literature. In most countries, individuals with phenotypes that put them at risk of various environmental exposures have not been identified. Regarding AAT deficiency, questions exist as to whether there is an increased risk for adverse health effects when such individuals with AAT deficiency are exposed to toxic environmental agents [Mayer et al. 2000; Sigsgaard et al. 2000; de Serres, 2003]. Occupational exposures of concern may include a variety of situations that expose workers with AAT deficiency to hazardous agents. Such agents (and worker groups exposed) could include chemical substances (beauticians, chemical plant workers, fumigators, gas station attendants, painters and welders), toxic fumes (airport personnel, bus, cab and truck drivers, dry cleaners, factory workers, industrial and household cleaners, and manicurists), and organic wastes or particulates (agricultural workers, dental workers, farmers, miners and textile workers). Those at risk also may work in professions regularly exposed to pathogens and other readily transmissible diseases (doctors, school teachers, nurses and other healthcare professionals, sales personnel, and restaurant and hotel waiting staff). Thus, we can conclude that collection of detailed information on occupation is critical for the effective management of individuals with AAT deficiency [de Serres, 2003]. There are cost-effective, targeted screening approaches that could be used in the USA, for example, to detect AAT deficiency in patients with COPD [de Serres et al. 2006].
In summary, identification of individuals with AAT deficiency worldwide is critical for management and education. More effective healthcare management and lifestyle changes, such as smoking cessation, can be undertaken in individuals with AAT deficiency to prevent the development of lung disease.
Footnotes
Acknowledgements
This article may be the work product of an employee or group of employees of the National Institute of Environmental Health Sciences (NIEHS), National Institutes of Health (NIH), however, the statements, opinions or conclusions contained therein do not necessarily represent the statements, opinions or conclusions of NIEHS, NIH or the United States government. The authors are indebted to Ms Suzan Edelstein of the DHHS/NIH/NIEHS Arts and Photography Department for her creativity in displaying a very complex database both in worldwide maps and figures to facilitate comparisons of the prevalences of the P*S and PI*Z alleles in each of the 97 countries. The authors are also indebted to Professor Enrique Fernandez-Bustillo for development of a method for statistical analysis used to obtain the numbers in each of the five phenotypic classes as well as the prevalences of PI*S and PI*Z.
Funding
This research received no specific grant from any funding agency in the public, commercial, or not-for-profit sectors.
Conflict of interest statement
The authors declare that they have no competing interests.