
Abstract
Introduction
Lupus nephritis (LN) is characterized by significant heterogeneity and a complex pathophysiology, which traditional methods struggle to fully resolve. Advanced multi-omics approaches are essential to disentangle its cellular and molecular drivers.
Methods
We employed an integrative strategy combining single-cell RNA sequencing (scRNA-seq) profiling of LN biopsies with large-scale bulk RNA-seq cohorts. We applied non-negative matrix factorization (NMF) to scRNA-seq data to define robust immune meta-programs and utilized CellChat to decode cell-cell communication networks. Leveraging these insights to overcome sample size limitations, we prioritized key pathways and developed 399 machine learning predictive models using bulk transcriptomics, validated on independent cohorts.
Results
ScRNA-seq analysis revealed a distinct cellular landscape, including a rare population of plasmacytoid dendritic cells (pDCs) and an expanded population of CD56dimCD16+ natural killer (NK) cells expressing high levels of IFN-γ and perforin, suggesting a role in inflammatory pathology. Macrophage subpopulation CM2 emerged as a central pro-inflammatory hub, potentially driving fibrosis via autocrine signaling and epithelial activation. We observed reduced Treg-B cell interactions, suggesting a regulatory collapse. Our machine learning models, based on innate immunity, circadian rhythms, apoptosis, and NF-κB signaling, achieved high diagnostic accuracy (AUC = 0.929 for innate immunity). Hub genes, including CYBB, CSF2RB, and IRF8, were confirmed to be upregulated in LN and correlated with clinical severity in external validation datasets. Molecular docking simulations suggested a potential structural basis for CYBB-dexamethasone interaction, providing a hypothesis for future verification.
Discussion
This study identifies CM2 macrophages and dysregulated pDC-NK axes as key drivers of LN. By bridging cellular interactomes with clinical predictive modeling, we provide a robust roadmap for precision detection and identifying potential therapeutic targets in LN.
Keywords
Introduction
Lupus nephritis (LN) continues to pose considerable difficulties in both its diagnosis and management.1,2 Traditional research methodologies have provided a foundation for understanding LN, but the heterogeneity and multifaceted pathology of this disease necessitate the adoption of more sophisticated investigative techniques.3,4 The integration of cutting-edge technologies such as single-cell RNA sequencing (scRNA-seq), non-negative matrix factorization (NMF), 5 and machine learning 6 has heralded a new era in biomedical research, promising to shed light on the complex dynamics of LN.
ScRNA-seq has been instrumental in uncovering the diverse cellular landscapes within LN, revealing novel cell subtypes and their functions in disease pathogenesis. However, scRNA-seq studies are often limited by high costs and smaller sample sizes, making it challenging to link cellular findings directly to clinical outcomes in large populations. To address this, we adopted a synergistic approach: utilizing scRNA-seq to identify high-resolution cellular signals and “meta-programs,” and then projecting these insights onto larger bulk RNA-seq cohorts to construct robust predictive models. 7 This integration allows us to leverage the resolution of single-cell biology while maintaining the statistical power and clinical applicability of large-scale transcriptomics.
In this study, we use the NMF algorithm to study the genetic and cellular intricacies of LN. Our research builds upon the utility of NMF in probing the intricacies of various diseases, from oncological to sepsis-related conditions,8,9 and applies this framework to LN for the first time. We have expanded our comprehension of LN to surpass mere clinical correlations, resulting in the creation of predictive models with improved diagnostic accuracy, thereby enhancing our comprehension of LN and providing novel diagnostic tools for clinical use.
By delving into the intricate biology of LN, we identified four pivotal pathways—innate immunity,10,11 circadian rhythms, 12 apoptosis, 13 and NF-κB signaling 14 —that are central to the pathophysiology of this disease. These pathways not only are crucial for the initial immune response to LN but also influence the temporal patterns of symptom severity, cellular fate, and immune response modulation.
Through the application of these advanced technologies, our study sheds light on the intricate interplay of genetics and cellular dynamics in LN. Our aim was to provide a comprehensive analysis of this complex autoimmune disease, offering valuable insights and pioneering new avenues for targeted and personalized therapeutic strategies for the management of LN.
Materials and methods
Data acquisition and preprocessing
Single-cell RNA sequencing (scRNA-Seq) samples
ScRNA-seq data for lupus nephritis (LN) were obtained through the ImmPort database. 15 These data specifically pertain to renal tissues harvested from patients diagnosed with LN. Utilizing scRNA-seq data from these renal tissues allowed us to explore the cellular heterogeneity and molecular mechanisms underlying LN at a granular level, revealing novel cell subtypes and their roles in disease pathogenesis.
Bulk RNA-Seq samples
To complement our analysis of renal tissues and to understand the systemic immune response in LN, we integrated bulk RNA-seq data from renal tissues and peripheral blood mononuclear cells (PBMCs) obtained from four cohorts within the GEO database. The details of these cohorts are as follows:
The integration of both renal tissue data and PBMCs data was crucial for developing predictive models that could potentially be applied to non-invasive diagnostics, providing a comprehensive view of the disease's impact on both renal and systemic levels.
Data preprocessing and reporting guidelines
Each dataset, whether derived from renal tissues or PBMCs, underwent rigorous preprocessing. This included normalization to account for differences in sequencing depth, batch effect correction to minimize the influence of technical variability, and quality control measures to ensure the integrity of the data. We adhered to relevant bioinformatics reporting standards to ensure transparency and reproducibility in our data processing and model construction.
Gene set curation for signaling pathways
In our pursuit of decoding the molecular mechanisms of LN, we chose the following gene sets for their known or potential role in LN pathophysiology:
Single-cell data analysis
Data preprocessing for single-cell data
We analyzed scRNA-seq data from LN patients. Using the Seurat (version 4.4.0), 20 we embarked on a rigorous data filtration process aimed at enhancing the integrity and reliability of our analytical outcomes.
Our analysis commenced with preprocessing the raw scRNA-seq data to ensure high-quality cellular data for downstream analysis. We implemented a series of quality control measures using Seurat's built-in functions, which are designed to filter out cells with low gene detection and high mitochondrial content that may indicate poor cellular integrity. Specifically, we removed cells with fewer than 1000 detected genes and those with mitochondrial gene expression exceeding 25% of the total gene expression, following established criteria for scRNA-seq data quality control.
After quality control, we normalized the data to correct for variations in sequencing depth and cellular content. We applied the ‘LogNormalize’ function within Seurat, which standardizes the data on a logarithmic scale. Post normalization, we conducted principal components analysis (PCA) to simplify high-dimensional data, which is crucial for uncovering variation sources and visualizing LN cellular diversity. We selected the top 20 principal components (PCs) that captured the majority of the variance in the data. These PCs were used as input for subsequent clustering and visualization steps. We applied t-SNE for 2D visualization. Seurat's clustering algorithms, including the Louvain method, group cells by gene expression, revealing their functional affinities. The clustering resolution was set to 0.5 to balance the granularity and biological relevance of the clusters. After clustering, we annotated major LN cell types via specific markers.
To identify variable genes that contribute significantly to the cellular heterogeneity, we used Seurat's FindVariableFeatures function. This function selects genes that exhibit high variance across cells, which are essential for distinguishing different cell populations. We set the parameters to identify the top 2000 variable genes based on their dispersion and mean expression levels.
Cell-cell interaction analysis in LN
To analyze cell communication in LN samples, we employed the CellChat tool (version 2.1.2). 21 We converted the Seurat object containing single-cell RNA-seq data into a CellChat object using the create CellChat function and the CellChatDB human database. This step integrates single-cell data with ligand-receptor interaction information, enabling the analysis of cell communication networks. We quantified the communication interactions between different cell types using the ‘compute CommunProb’ function, which calculates the communication probability based on ligand and receptor expression levels. This function provides a comprehensive overview of the potential communication between cell types. The results were visualized using the ‘netVisual_circle’ function, which generates CirclePlot and Shell Plot. The CirclePlot provides an overview of the communication landscape, while the Shell Plot highlights key cell types and their interaction patterns in LN samples.
Innovative use of NMF in LN
Data preprocessing for NMF
Prior to applying the cNMF algorithm, 22 we undertook a preprocessing step to standardize the gene expression data. Given that NMF does not accommodate negative values, we converted all negative values to zero, ensuring that the data conformed to the algorithm's requirements. This preprocessing step is critical for the accurate application of NMF and for ensuring that the subsequent analysis is not confounded by negative expressions.
Conducting NMF analysis
We meticulously applied NMF analysis to the leukocyte data from each LN sample, performing 100 iterations to ensure that the algorithm converged on an optimal solution. This iterative process is essential for NMF, as it seeks to decompose the gene expression matrix into two non-negative matrices that represent metagene (factors) and sample-specific expression patterns. We identified distinct gene modules via a novel ranking algorithm that constructed two matrices to assign genes to factors on the basis of contribution and influence, monitoring for rank shifts indicating factor reassignment. We used Pearson correlation and hierarchical clustering to analyze gene expression patterns, revealing gene covariation and clustering within leukocyte meta-programs. Our analysis identified four unique leukocyte meta-programs (Meta-Programs 1–4) in LN, each marked by a specific set of top-ranking genes, revealing active biological processes and pathways in LN. This approach deepens our insight into the molecular mechanisms of LN and establishes a basis for subsequent genetic and immunological studies in autoimmune diseases.
Integrated methodology for predictive model development and validation
Gene set intersection and pathway analysis
Before model construction, we performed a detailed intersection analysis of Meta-Program 1 with the aforementioned gene sets to identify genes that are not only highly expressed in LN but also play significant roles in the associated biological pathways. This analysis was conducted via bioinformatics tools that allow for the integration of gene expression data with known pathway information from databases such as KEGG and Reactome. The gene sets included InnRGs, CirRGs, ApoRGs, and NKRGs. We used the following machine learning algorithms: LASSO, 23 Ridge, 23 Elastic network, 23 Stepglm, 24 SVM, 25 GlmBoost, 26 LDA, 27 plsRglm, 28 RSF, 29 GBMs, 30 XGBoost, 31 and Naive Bayes. 24
Model development, cross-validation, and independent testing
To enhance the robustness of our predictive models and mitigate the risk of overfitting, we implemented a two-tiered validation strategy:
Internal Validation: We employed 10-fold cross-validation within the training datasets. This method involves dividing the dataset into 10 equally sized subsets. For each iteration, we trained the model on 9 folds and tested it on the remaining fold; this process was repeated 10 times.
Independent External Validation: Crucially, we utilized completely independent hold-out cohorts (GSE200306 and GSE81622) that were not seen by the models during the training phase. This step is essential to confirm that our models generalize well to new patient populations and distinct tissue types (e.g., blood).
Hyperparameter tuning
We performed rigorous hyperparameter tuning for each machine learning algorithm to optimize model performance. Using a grid search combined with cross-validation, we tested multiple combinations of hyperparameters. For example, for LASSO and Ridge regression, we optimized the regularization parameter lambda (λ). For Support Vector Machines (SVM), we tuned the cost (C) and kernel parameters (gamma). For gradient boosting models (XGBoost, GBM), we optimized the learning rate, tree depth, and number of estimators.
Feature and model selection criteria
Feature selection prioritized genes with the highest expression levels and known involvement in LN-related pathways. Model selection was guided by predictive performance metrics, focusing on the AUC in both the internal cross-validation and, more importantly, the external validation cohorts. We compared the models on the basis of their average AUC, selecting the top-performing models for further analysis.
Data integration and harmonization for model validation
Recognizing the heterogeneity introduced by data from both blood and renal sources, we implemented a rigorous harmonization process. We applied a two-step normalization process to account for differences in tissue types, minimizing batch effects and ensuring comparability across different sources. For the GSE200306 cohort, which comprises LN patients at various disease stages, we focused our analysis on initial kidney biopsies obtained at flare. This methodology enabled us to evaluate the disparities in gene expression patterns corresponding to the initial flare-up of LN before the influence of treatment.
Confidence intervals for AUC values
To increase the validity of our findings, we calculated the 95% confidence intervals for the reported AUC values via the bootstrapping method, providing a measure of the precision of the AUC estimates and allowing for an assessment of the variability in model performance across different validation cohorts.
Significance testing for AUC comparisons
Additionally, we performed pairwise significance testing between the AUC values of different models via a permutation test to determine whether the observed differences in performance were statistically significant, controlling for the false discovery rate. By incorporating these detailed descriptions and statistical measures, we have enhanced the transparency and reproducibility of our methodology, ensuring that the development and validation of our predictive models are clearly articulated and scientifically rigorous.
Functional network and go analysis of hub gene sets in LN
Using GeneMANIA, 32 we constructed detailed functional networks for the hub genes within the critical InnRG, cirRG, ApoRG, and NKRG sets. This comprehensive analysis encompassed various interaction types. GeneMANIA also facilitated GO enrichment analysis. In GO enrichment analysis, we applied Benjamini-Hochberg FDR correction to ensure robust inference at the gene set level. We enhanced our analysis with Cytoscape software (v3.10.1), 33 a powerful tool for visualizing complex networks and integrating diverse biological data. We create intricate visual representations of the functional interactions and pathways among the genes of interest. Additionally, we employed an UpSet diagram to effectively illustrate the overlapping GO terms across our identified gene sets. Using this graphical representation technique, we effectively underscored the overlapping and unique functions of these genes in LN, offering an unambiguous and holistic view of their roles within the disease's molecular framework. By elucidating the contributions of these key genes to the pathogenesis of LN, we established a basis for the development of therapeutic interventions and the identification of diagnostic biomarkers.
Validation of hub gene mRNA expression
To substantiate the mRNA expression patterns of the identified hub genes, we conducted a comprehensive validation using a diverse array of publicly accessible datasets.16,34–36 Our analysis included data from the ERCB Lupus Glomeruli, ERCB Lupus Tubulointerstitium, Peterson Lupus Glomeruli, Berthier Lupus Glomeruli, and Berthier Lupus Tubulointerstitium cohorts, which provided a rich source of RNA sequencing information for cross-validation.
Data integration and standardization
We integrated RNA sequencing data from these cohorts, ensuring that the data were harmonized to allow for a consistent comparison of gene expression levels across different studies. This harmonization process involved standardizing the data to account for technical variations in sequencing platforms and batch effects, ensuring that the subsequent analysis was not confounded by these factors.
Differential gene expression analysis
We performed differential gene expression analysis to quantify the expression levels of the hub genes CYBB, MX1, CSF2RB, IRF8, STAT1, IFI16, and IFIT2. A two-sided Welch's t-test was applied to compare gene expression means between LN and control groups. This test does not assume equal variances or sample sizes between groups. Fold change (FC) was computed as FC = Mean Expression of LN / Mean Expression of Control, and results were log2-transformed (log2FC) for interpretability.
Quantification and comparison of gene expression
The expression levels of the selected hub genes were quantified across the integrated datasets. We then compared these levels to identify any significant differences in expression patterns. This comparative analysis allowed us to assess the consistency of the gene expression profiles across different patient populations and disease states.
Validation of CYBB expression
The CYBB expression were compared with previous research37,38 to ensure the consistency and reliability of our findings. This alignment strengthens the credibility of our study and supports the translational potential of our computational findings.
ROC curves of hub genes in five validation cohorts
To assess the diagnostic potential of the hub genes, ROC curve analysis was conducted. The expression data from five validation cohorts16,34–36 were used to generate ROC curves for each gene: CYBB, MX1, CSF2RB, IRF8, STAT1, IFI16, and IFIT2. AUC values were calculated to evaluate the sensitivity and specificity of these genes as biomarkers for lupus nephritis.
Correlation analysis of hub genes with renal function
Correlations between hub gene expression levels and clinical parameters, including GFR, proteinuria, serum creatinine, and blood urea nitrogen (BUN), were analyzed in five validation cohorts.16,34–36 We compute Pearson correlations for all genes against various clinical properties. The Pearson correlation coefficient (r value) measures the linear correlation between two variables and ranges from +1 (perfect positive correlation) to −1 (perfect negative correlation).
Correlation analysis of hub genes with pathological stage
For the assessment of hub gene expression across different pathological stages of LN, we utilized the World Health Organization (WHO) classification system, which provides a standardized framework for evaluating the severity and characteristics of renal involvement in systemic lupus erythematosus (SLE). This classification system categorizes LN into six classes based on renal biopsy findings: Class I: Normal or minimal mesangial changes. Class II: Mesangial proliferative lupus nephritis. Class III: Focal lupus nephritis. Class IV: Diffuse lupus nephritis. Class V: Membranous lupus nephritis. Class VI: Advanced sclerosing lupus nephritis.
Given the limitations in sample availability and detectable expression for certain genes across all classes, we were able to perform differential expression analysis for CYBB in classes II and III, CSF2RB in classes II and IV, and IRF8 in classes II and IV.
To compare the mRNA expression profiles of these genes across the specified pathological stages, we employed a two-sided Student's t-test for pairwise class comparisons. This statistical approach allowed us to identify significant differences in gene expression between the classes for which we had sufficient data. The results were considered significant at a p-value threshold of less than 0.05.
Protein structure prediction of hub genes by AlphaFold 3
The protein structures of the hub genes CYBB, IRF8, IFIT2, CSF2RB, STAT1, IFI16, and MX1 were predicted via AlphaFold 3, an advanced protein structure prediction tool. The predicted structures were analyzed to elucidate the molecular mechanisms and potential interaction sites of these proteins.
Molecular docking of dexamethasone with CYBB
Molecular docking studies were conducted to explore the hypothetical interactions between the CYBB protein and dexamethasone. Docking simulations were performed via established protocols and software tools to generate structural hypotheses for potential drug-target binding.
Statistical analysis
The results were considered significant at p < 0.05.
Results
ScRNA-Seq reveals LN cellular heterogeneity
We performed single-cell RNA sequencing (scRNA-seq) on renal biopsies from 24 lupus nephritis (LN) patients and 10 healthy controls. Unsupervised clustering analysis using Seurat revealed 22 transcriptionally distinct cell populations, including a rare plasmacytoid dendritic cell (pDC) subset and a predominant CD56dimCD16+ natural killer (NK) cell cluster (Figure 1A and Supplementary Figure 1), demonstrating the remarkable cellular heterogeneity of LN. Marker genes defining each cell type are presented in Figure 1B. Comparative visualization of LN and control through t-distributed Stochastic Neighbor Embedding (t-SNE) further highlighted disease-specific alterations in cellular architecture (Figure 1C).

Single-cell landscape and leukocyte meta-programs in lupus nephritis. (A) t-SNE visualization revealing 22 distinct cell types within the lupus nephritis (LN) single-cell dataset. (B) Violin plots illustrating the expression patterns of marker genes across identified cell types. (C) t-SNE plots highlighting the distribution of LN and control samples in the single-cell dataset. (D) Identification of four distinct leukocyte meta-programs (MP1-MP4) within the LN dataset, each characterized by a unique transcriptional signature.
Non-negative matrix factorization (NMF) analysis revealed four transcriptional meta-programs (MP1-MP4) in LN, each with unique gene expression patterns, indicating specific immunological pathways and cellular states (Figure 1D). This granular genetic view of LN aids in developing predictive models and understanding immune cell behavior in this autoimmune disease.
Enhanced diagnostic precision with machine learning in LN
We developed 399 predictive models, integrating data from MP1 with four vital gene sets. These gene sets, encompassing key biological pathways from innate immunity to NF-kB signaling, included a diverse array of genes, such as 187 innate immunity-related genes (InnRG), 231 circadian-related genes (CirRG), and 114 apoptosis-related genes (ApoRG), and included 79 NF-kB-related genes (NKRGs). The distinct expression patterns of these genes, which are crucial for decoding LN pathophysiology, are depicted in detailed heatmaps (Figures 2A-2D and Figures 2E-2H).

Mapping key pathway-related genes and intersections. (A-D) Venn diagrams illustrating the intersections among four gene sets related to critical pathways identified with Meta-Program 1, demonstrating the convergence of pathways in LN. (E-H) Heatmaps showing the results of a comparative analysis of gene expression levels of pathway-related genes across major cell types in the LN single-cell dataset, highlighting the differential expression and potential functional implications of these genes.
Our extensive evaluation of 399 predictive models using 12 machine learning algorithms has demonstrated notable success in accurately diagnosing LN. These models, including 96 InnRG models, 95 CirRG models, 104 ApoRG models, and 104 NKRG models, were rigorously tested for their predictive performance via the AUC. The InnRG models employing LASSO and naive Bayes demonstrated high predictive accuracy, as evidenced by a mean AUC of 0.929 across all cohorts. Specifically, the AUC was 0.989 in the training cohort, 0.950 in the independent renal validation cohort (GSE200306), and 0.848 in the independent blood validation cohort (GSE81622). This level of accuracy highlights the robustness and adaptability of the InnRG models (Figure 3, Supplementary Figures 2–4, and Supplementary Tables 1–4).
Furthermore, models focusing on CirRGs presented a mean AUC of 0.927, reflecting their strong predictive ability and underscoring the importance of circadian rhythms in the pathology of LN. The ApoRG models also showed favorable performance, with a mean AUC of 0.886, indicating their effectiveness in capturing the complexities of programmed cell death processes in the LN. Finally, the NKRG model demonstrated a mean AUC of 0.862, highlighting its potential for understanding and predicting intricate inflammatory and immune responses in LN.
The consistency in high predictive accuracy across these diverse gene sets not only validates the robustness of our models but also reflects the multifaceted nature of LN. These results, detailed in Figure 3, Supplementary Figures 2–4, and Supplementary Tables 1–4, confirm the potential of our predictive models as noninvasive diagnostic tools for LN, offering new avenues for early and accurate disease detection. The impressive performance of our models, particularly in the blood sample cohort (GSE81622), emphasizes their potential to transform LN diagnostics towards “liquid biopsy” approaches. By elucidating the genetic foundations of LN through these models, we are one step closer to realizing personalized and effective treatment strategies for LN (Supplementary Figure 3).
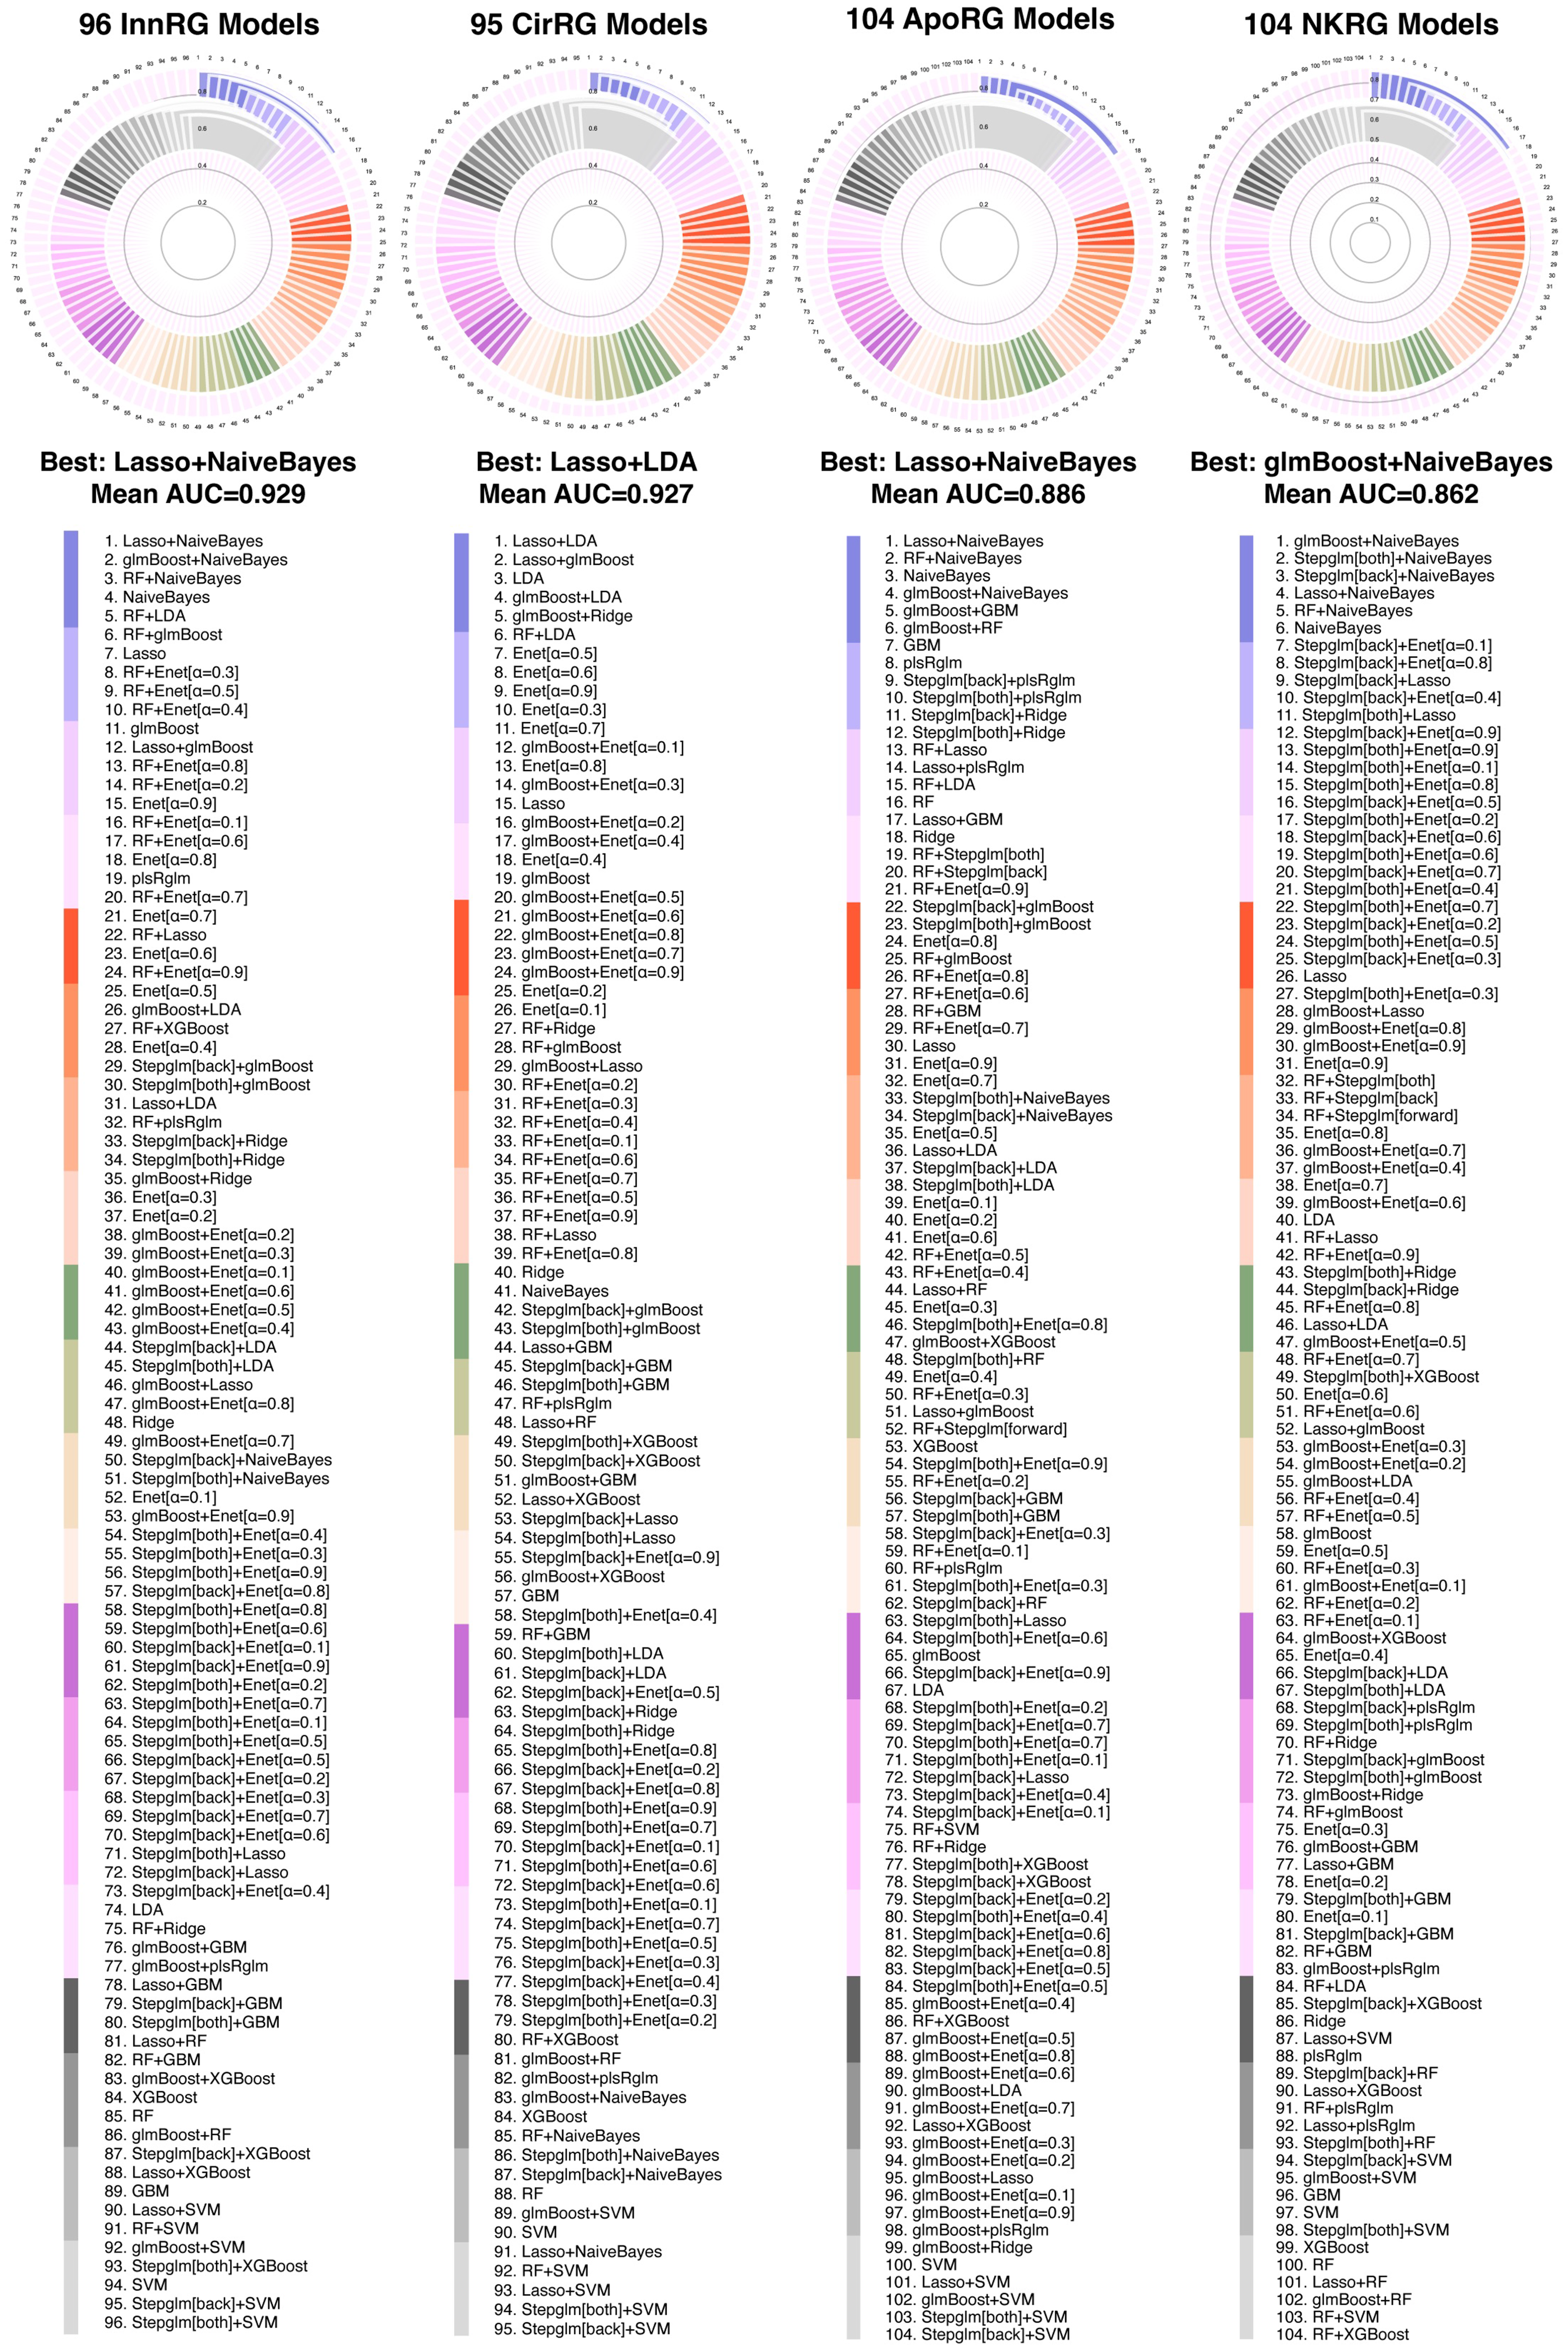
Model performance evaluation across cohorts. This composite Figure shows the mean AUC results for a comprehensive array of machine learning models stratified by gene set and algorithm combination. Subpanels provide an in-depth look at the performance of models for each gene set, including 96 innate immunity-related genes (InnRG), 95 circadian-related genes (CirRG), 104 apoptosis-related genes (ApoRG), and continued through to 104 NF-kB-related genes (NKRGs), across training and validation cohorts, demonstrating the diagnostic accuracy of our models.
Moreover, through dot plots, we explored the expression patterns of the hub genes in single cell level (Figures 4A-4D). This exploration highlighted genes prominently expressed in myeloid cells, revealing their pivotal functions in immune system regulation and offering valuable insights for potential therapeutic interventions. Through this extensive development of predictive models, we advanced the understanding of LN but also noninvasive diagnostic approaches, significantly impacting the future management of this complex autoimmune condition.

Profiling of single-cell hub gene expression. Dot plots visualizing the expression patterns of the hub genes (A) InnRG, (B) CirRG, (C) ApoRG, and (D) NKRG across various cell types within the single-cell dataset, providing insights into their distribution and functional roles.
Elucidating interaction networks and gene ontology enrichments
On the basis of our in-depth exploration of the genetic components of LN, we used GeneMANIA for extensive network analysis (Figures 5A-5D and Supplementary Table 5–8). This analysis revealed a dynamic array of interactions among the hub genes in LN. These interactions are mapped within two adjacent circles and highlight the entangled biological processes intrinsic to the LN.
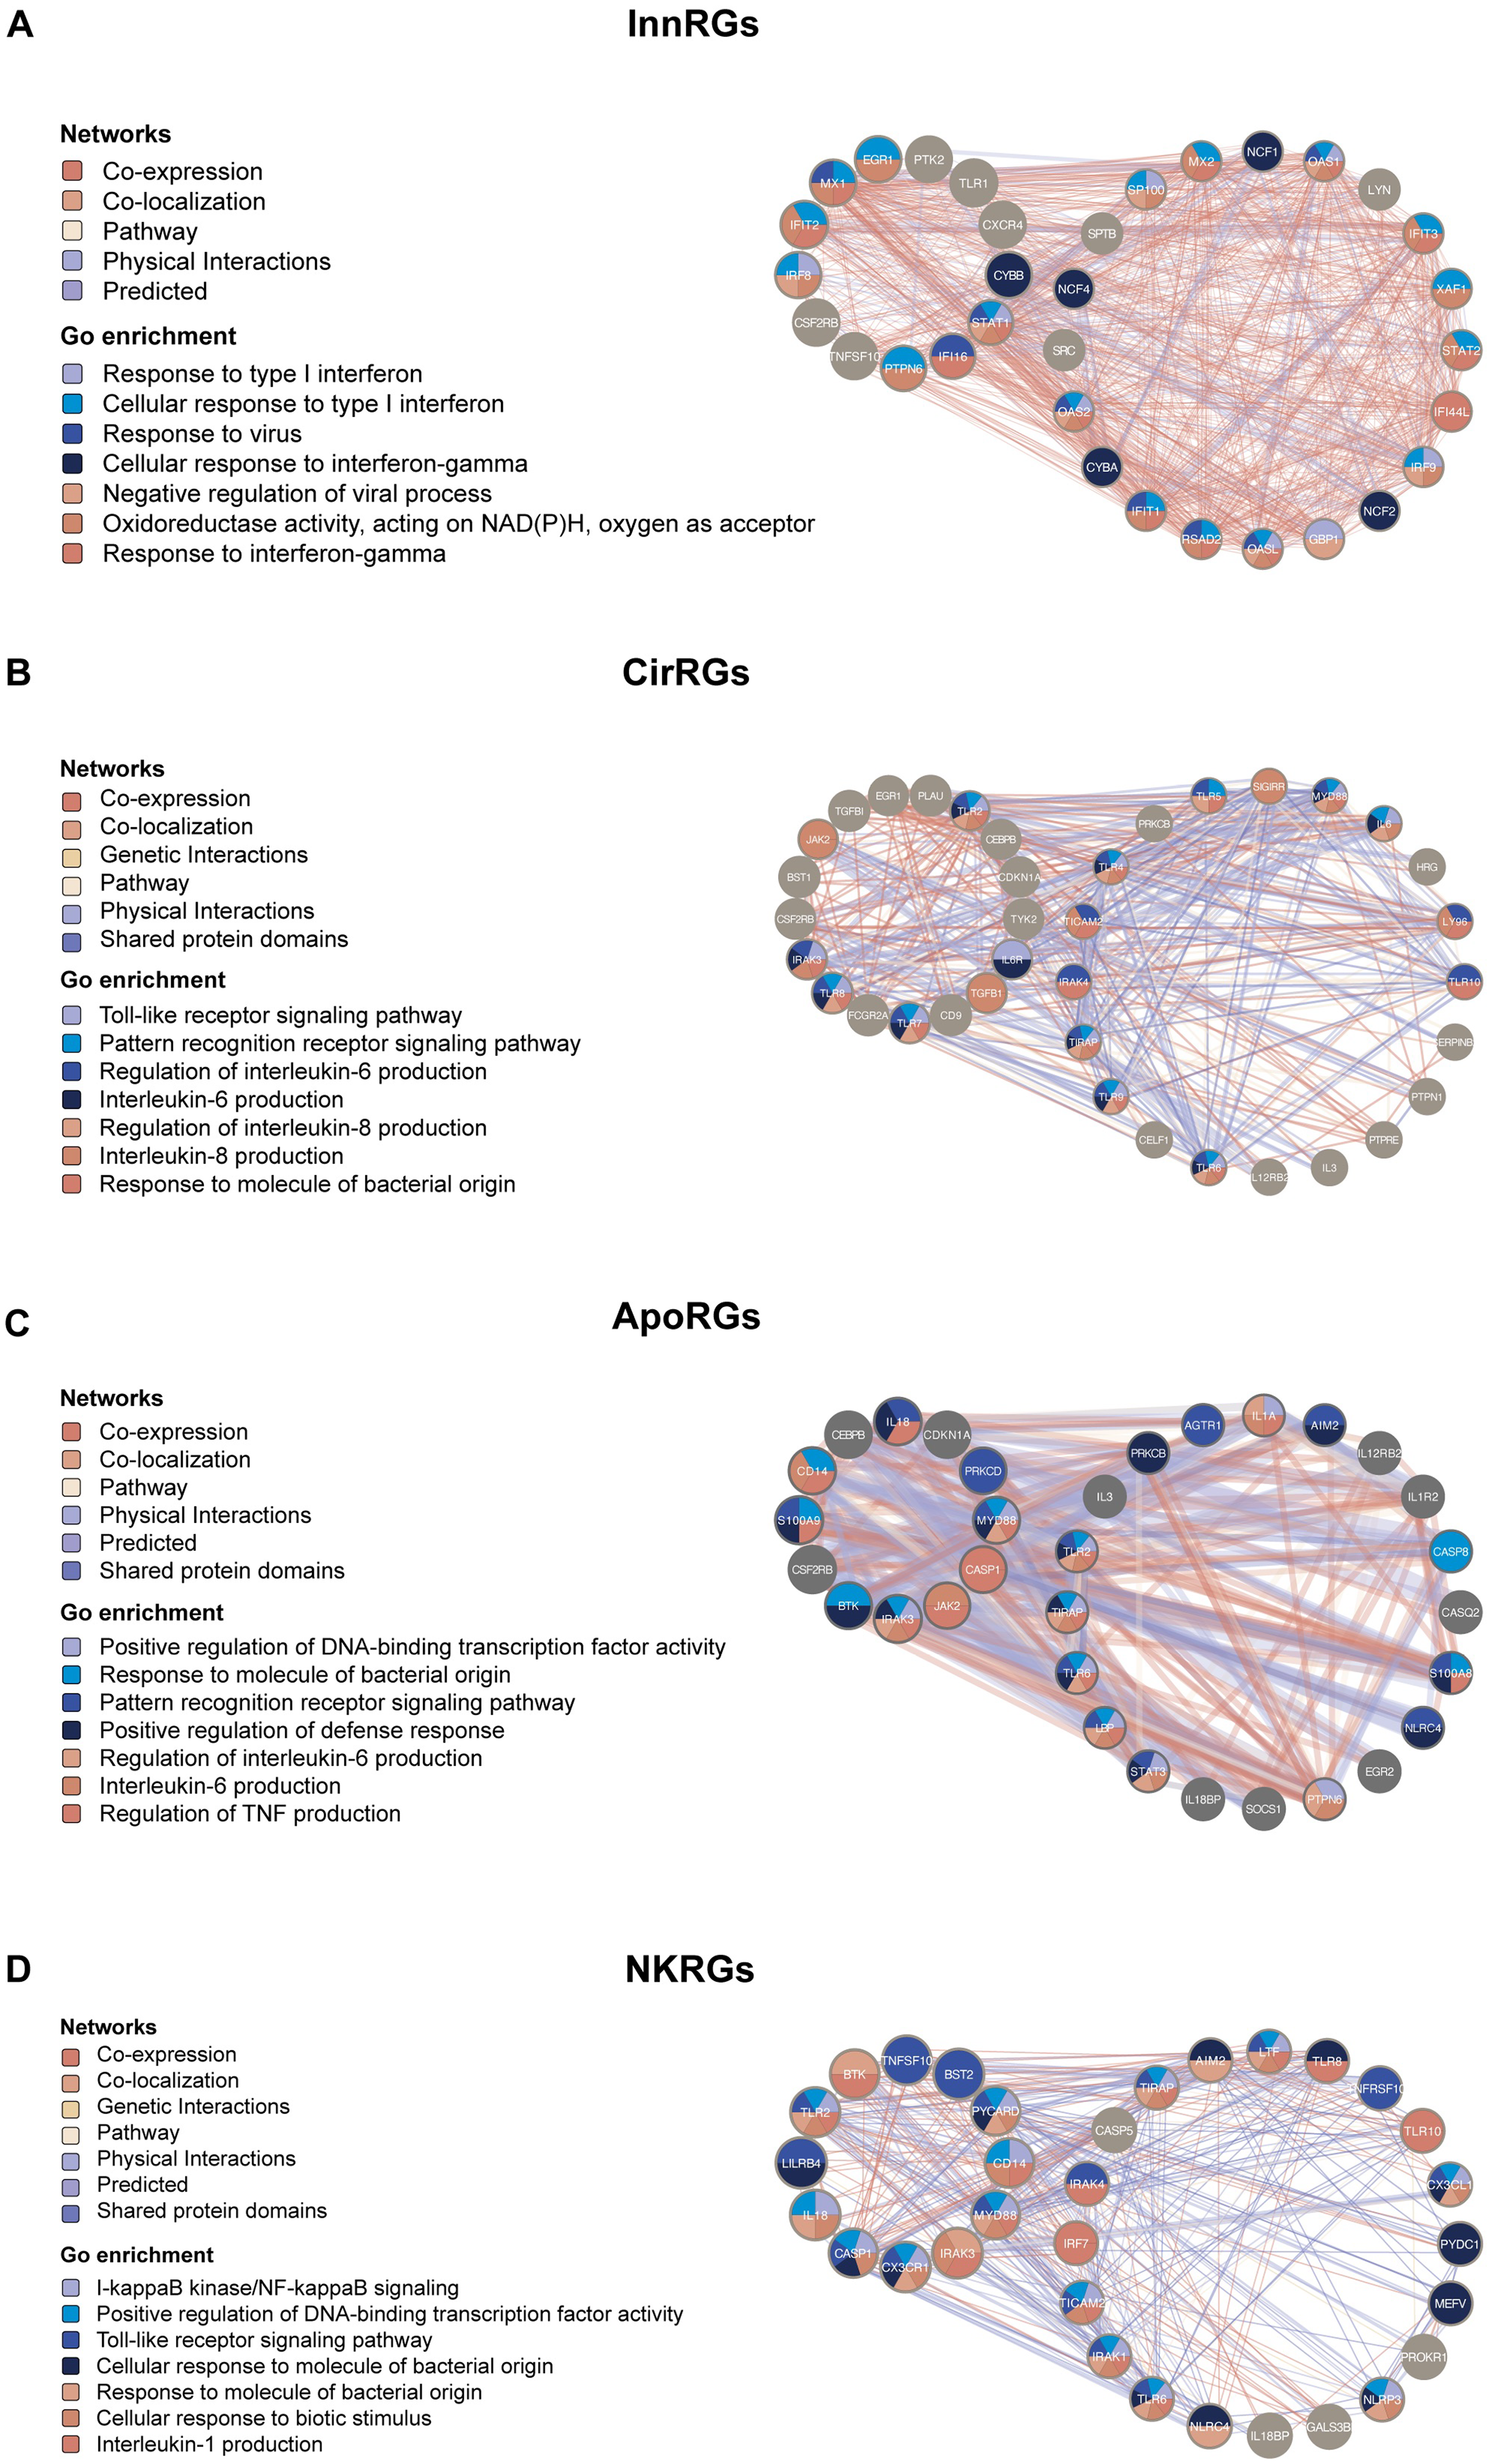
Unraveling gene interaction networks and functional insights into LN pathogenesis. GeneMANIA network analysis revealed a complex array of interactions among hub genes, with colored lines indicating different types of interactions, such as coexpression, colocalization, genetic interactions, pathways, physical interactions, predicted links, and shared protein domains. The central nodes represent the query hub genes, while outer nodes represent automatically identified interacting genes. The network highlights the dense functional connectivity among InnRG and NKRG gene sets, suggesting coordinated regulation. Nodes are color-coded on the basis of enriched Gene Ontology (GO) terms, offering a visual depiction of the diverse functions of genes and their interconnected roles in LN.
In particular, the network revealed intricate interactions among InnRGs, such as CSF2RB, STAT1, and CXCR4, and twenty additional genes, creating a sophisticated genetic framework that supports the immune reactions in LN (Figures 5A-5D). These interactions encompass a wide array of biological activities, from the response to type I interferon (IFN) signaling (e.g., IFIT2 and MX1) to the cellular response to interferon-gamma (e.g., GBP1 and STAT1), and more, delineating a comprehensive landscape of immune response dynamics in the LN.
Our GO enrichment analysis revealed substantial intersections in biological pathways, including those related to interleukin generation and Toll-like receptor signaling (Supplementary Figure 5 and Supplementary Table 9). Enrichment terms such as the regulation of transcription factor activity, pattern recognition receptor signaling pathway, and interleukin-6 production signaling were prominent across multiple hub gene sets, underscoring the interconnected pathways involved in the complex pathophysiology of LN. By elucidating these gene interactions and enrichments, our study revealed potential mechanisms driving LN. This comprehensive mapping not only deepens our understanding of LN complexity but also lays a critical foundation for future research and the development of targeted therapeutic strategies.
ScRNA-Seq analysis of immune cell populations in LN
In our scRNA-seq analysis focusing on diverse cell clusters within LN, we identified a notable disparity in the population sizes of specific immune cells. Specifically, we observed the smallest population of pDCs (proportion: 0.6%) and the largest population of CD56dimCD16+ NK cells (proportion: 13.0%, Figure 6A). These findings are particularly intriguing given the enhanced IFN signaling observed in our pathway analysis, suggesting a complex interplay between immune cell populations and the inflammatory environment in LN. We found that CD56dimCD16+ NK cells exhibited increased expression of perforin, a cytokine known to play a critical role in the inflammatory response and the pathogenesis of LN (Figure 6B). This upregulation suggests a potential for these cells to contribute to the inflammatory environment and renal damage. Similarly, the expression of IFN-γ was higher in CD56dimCD16+ NK cells, indicating their potential involvement in cytotoxic activities that may be detrimental to renal tissues in LN (Figure 6C).

ScRNA-Seq analysis of immune cell populations in LN. (A) Distribution of immune cell populations in LN. Notably, the smallest population of plasmacytoid dendritic cells (pDCs) and the largest population of CD56dimCD16+ natural killer (NK) cells were observed. (B) Expression of perforin in CD56dimCD16+ NK Cells. (C) Expression of IFN-γ in CD56dimCD16+ NK Cells.
Cell-cell interaction in LN
Macrophage subpopulation CM2 as a central hub of inflammation and fibrosis
CM2 dominated the cell-cell interaction network, exhibiting significantly higher outgoing/incoming interaction strength than other cell types (Figures 7A-7B). This subpopulation amplified inflammatory responses via autocrine signaling (CM2→CM2) while may promoting fibrosis in epithelial cells (CE0), leading to upregulation of pro-fibrotic genes in CE0 (Figures 7C-7D). CM2's dual role (pro-inflammatory and pro-fibrotic) suggests its potential link to multi-organ damage in lupus.

Cell-cell interaction network in LN. Global cell-cell interaction network showing (A) number of interactions and (B) interaction weights between cell types. (C) Macrophage subpopulation interaction. (D) Epithelial cell interaction. (E) pDCs and NK cell subsets interaction. (F) T-B cell interaction.
pDCs (CB2b) activate Nk cell subsets via the IFNα-IFNAR1 axis
pDCs (CB2b) preferentially activated CD56bright NK cells [CT5b] (vs. CD56dim subset [CT1]), with robust ligand-receptor pair weights support (Figure 7E).
Reduced Treg (CT3a)-B cell (CB3) interactions reflect immune dysregulation
Lupus patients showed significantly fewer interactions between Tregs (CT3a) and B cells (CB3) (Figure 7F). This disruption likely impairs Treg-mediated suppression of B cells, promoting autoantibody production. Conversely, enhanced interactions between effector T cells (CT3b) and plasma cells (CB1) exacerbated immune dysregulation.
Validation of the mRNA expression of hub genes
Since the InnRG models had the highest mean AUC among all the models, we further studied the hub genes identified by the InnRG models, including CYBB, MX1, CSF2RB, STAT1, IRF8, IFI16, IFIT2, TNFSF10, PTK2, CXCR4, PTPN6, TLR1, and EGR1. The expression levels of key hub genes were validated across multiple cohorts. Expression analysis of key genes CYBB, MX1, CSF2RB, IRF8, STAT1, IFI16, and IFIT2 across multiple diverse LN cohorts revealed significant upregulation in LN patients, with distinct variability and patterns observed (Figures 8A-8G). Comparatively, other genes either showed no significant difference or were more highly expressed in healthy controls (Supplementary Figure 6).

Validation of the mRNA expression of hub genes. (A) Expression levels of CYBB across various cohorts: the ERCB Lupus Glomeruli, the ERCB Lupus Tubulointerstitium, the Peterson Lupus Glomeruli, the Berthier Lupus Glomeruli, and the Berthier Lupus Tubulointerstitium. (B) Expression levels of MX1 across various cohorts. (C) CSF2RB expression in the Berthier Lupus Glomeruli, ERCB Lupus Glomeruli, and ERCB Lupus Tubulointerstitium cohorts. (D) IRF8 expression in the Berthier Lupus Glomeruli and ERCB Lupus Tubulointerstitium cohorts. (E) STAT1 expression in the ERCB Lupus Glomeruli, ERCB Lupus Tubulointerstitium, Berthier Lupus Glomeruli, and Berthier Lupus Tubulointerstitium cohorts. (F) IFI16 expression in the ERCB Lupus Glomeruli, ERCB Lupus Tubulointerstitium, Berthier Lupus Glomeruli, and Berthier Lupus Tubulointerstitium cohorts. (G) IFIT2 expression in the ERCB Lupus Tubulointerstitium, ERCB Lupus Glomeruli, Berthier Lupus Glomeruli, and Berthier Lupus Tubulointerstitium cohorts.
The CYBB expression, along with the alignment of our results with previous research, strengthens the credibility of our study and supports the translational potential of our findings.37,38 We are committed to further experimental validation to substantiate our results and contribute to a deeper understanding of the molecular mechanisms in LN.
ROC curves of hub genes in five validation cohorts
ROC curves were generated for the hub genes that were significantly upregulated in the LN group (CYBB, MX1, CSF2RB, STAT1, IRF8, IFI16, and IFIT2) to evaluate their diagnostic performance in the five validation cohorts. The ROC analysis for CYBB, MX1, CSF2RB, IRF8, STAT1, IFI16, and IFIT2 revealed significant AUC values (AUC > 0.8), indicating their potential as biomarkers (Figure 9).

ROC curves of hub genes in five validation cohorts. (A) CYBB, (B) CSF2RB, (C) IRF8, (D) IFI16, (E) MX1, (F) IFIT2, (G) STAT1.
Correlation analysis of hub genes with renal function and pathological stage in five validation cohorts
CYBB, IFI16, IRF8, STAT1, and MX1 showed notable negative correlations with the GFR, proteinuria, serum creatinine, and blood urea nitrogen (BUN) (Figures 10A-10E). Additionally, increased expression of the CYBB was observed in patients with pathological stage class III disease compared with patients with pathological stage class II disease (Figure 10F) and CSF2RB in patients with pathological stage class IV disease compared with patients with pathological stage class II disease (Figure 10G). IRF8 levels were notably higher in individuals at pathological stage class IV of the disease as opposed to those at class II (Figure 10H).
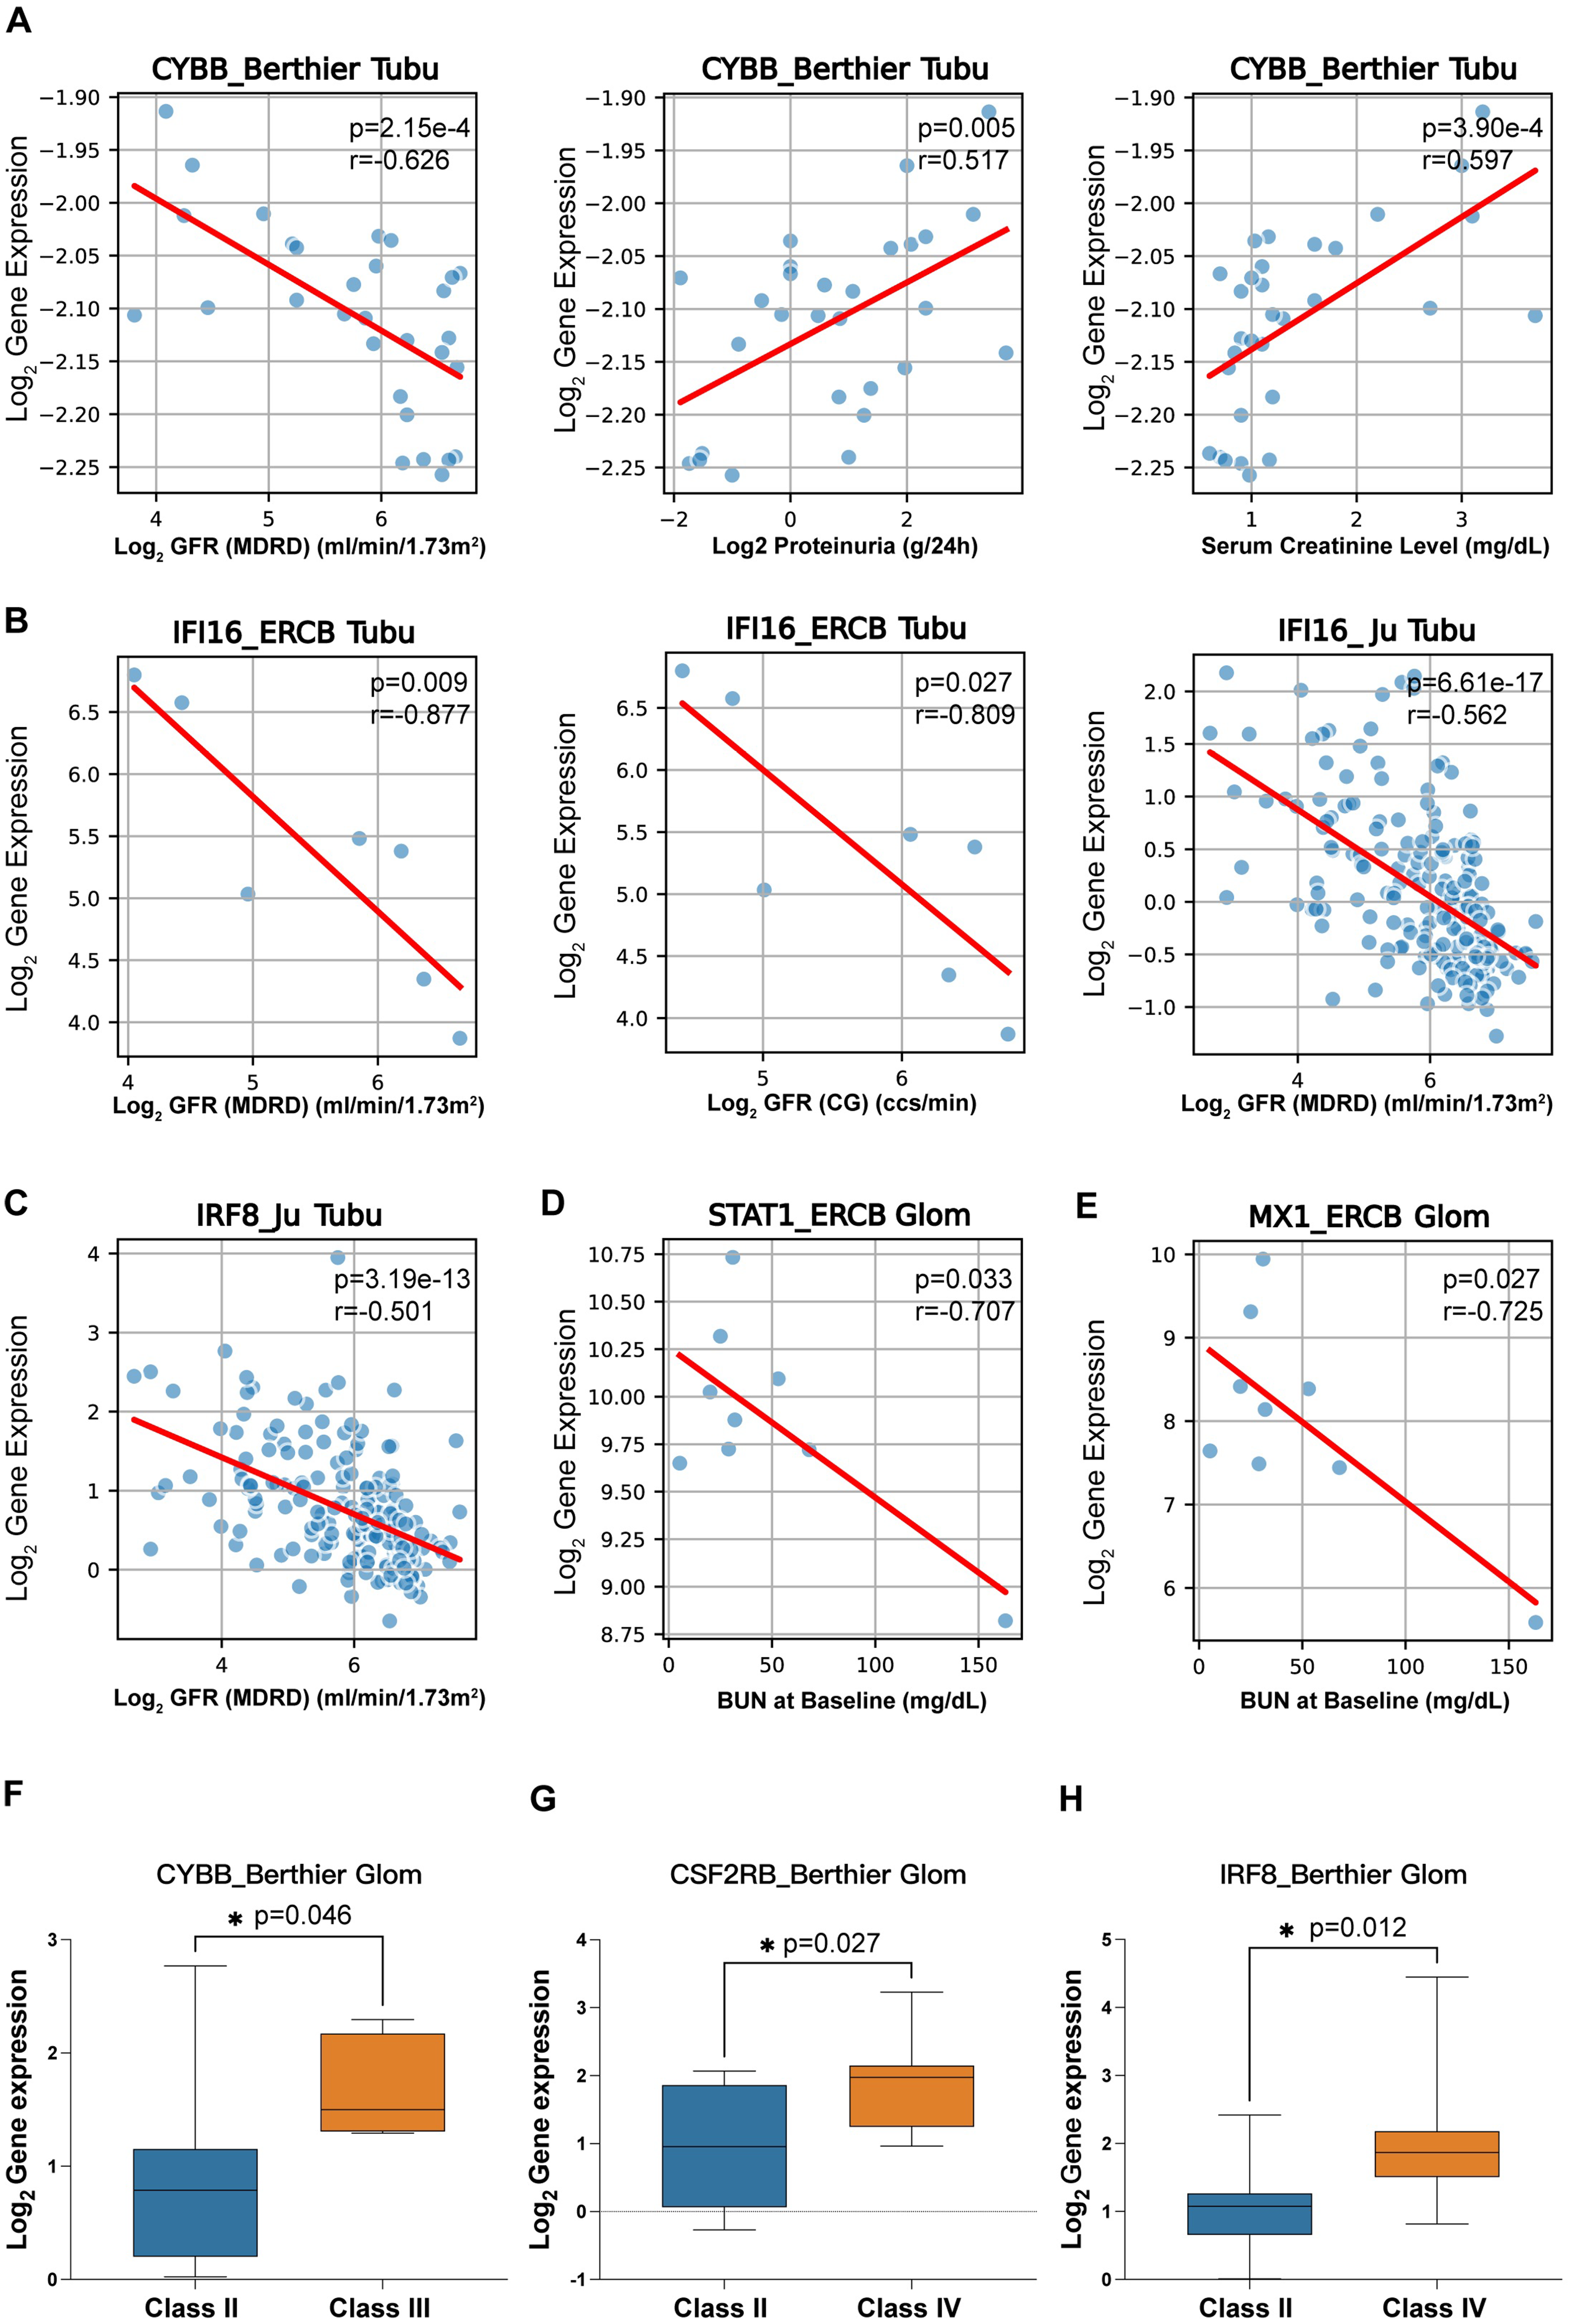
Correlation analysis of hub genes with renal function and pathological stage in validation cohorts. Correlations of the following genes with the glomerular filtration rate (GFR), proteinuria, serum creatinine, and blood urea nitrogen (BUN) levels: (A) CYBB, (B) IFI16, (C) IRF8, (D) STAT1, and (E) MX1. (F) Increased expression of the CYBB in pathological stage class III patients compared with that in class II patients and (G) CSF2RB in class IV patients compared with that in class II patients. (H) Compared with that in class II patients, IRF8 expression in pathological stage class IV patients was elevated.
Protein structure prediction and molecular docking analysis
The protein structures of the hub genes CYBB, IRF8, IFIT2, CSF2RB, STAT1, IFI16, and MX1 were predicted via AlphaFold 3. These predicted structures provide insights into the molecular mechanisms and potential interaction sites of these proteins (Figure 11). Further exploration of the hypothetical therapeutic potential of the CYBB protein was conducted through molecular docking analysis, which demonstrated a potential binding interaction between CYBB and dexamethasone (Figure 12). This analysis provides a structural hypothesis for how dexamethasone might modulate CYBB activity, although this finding serves as a starting point for future experimental verification rather than definitive evidence of efficacy.
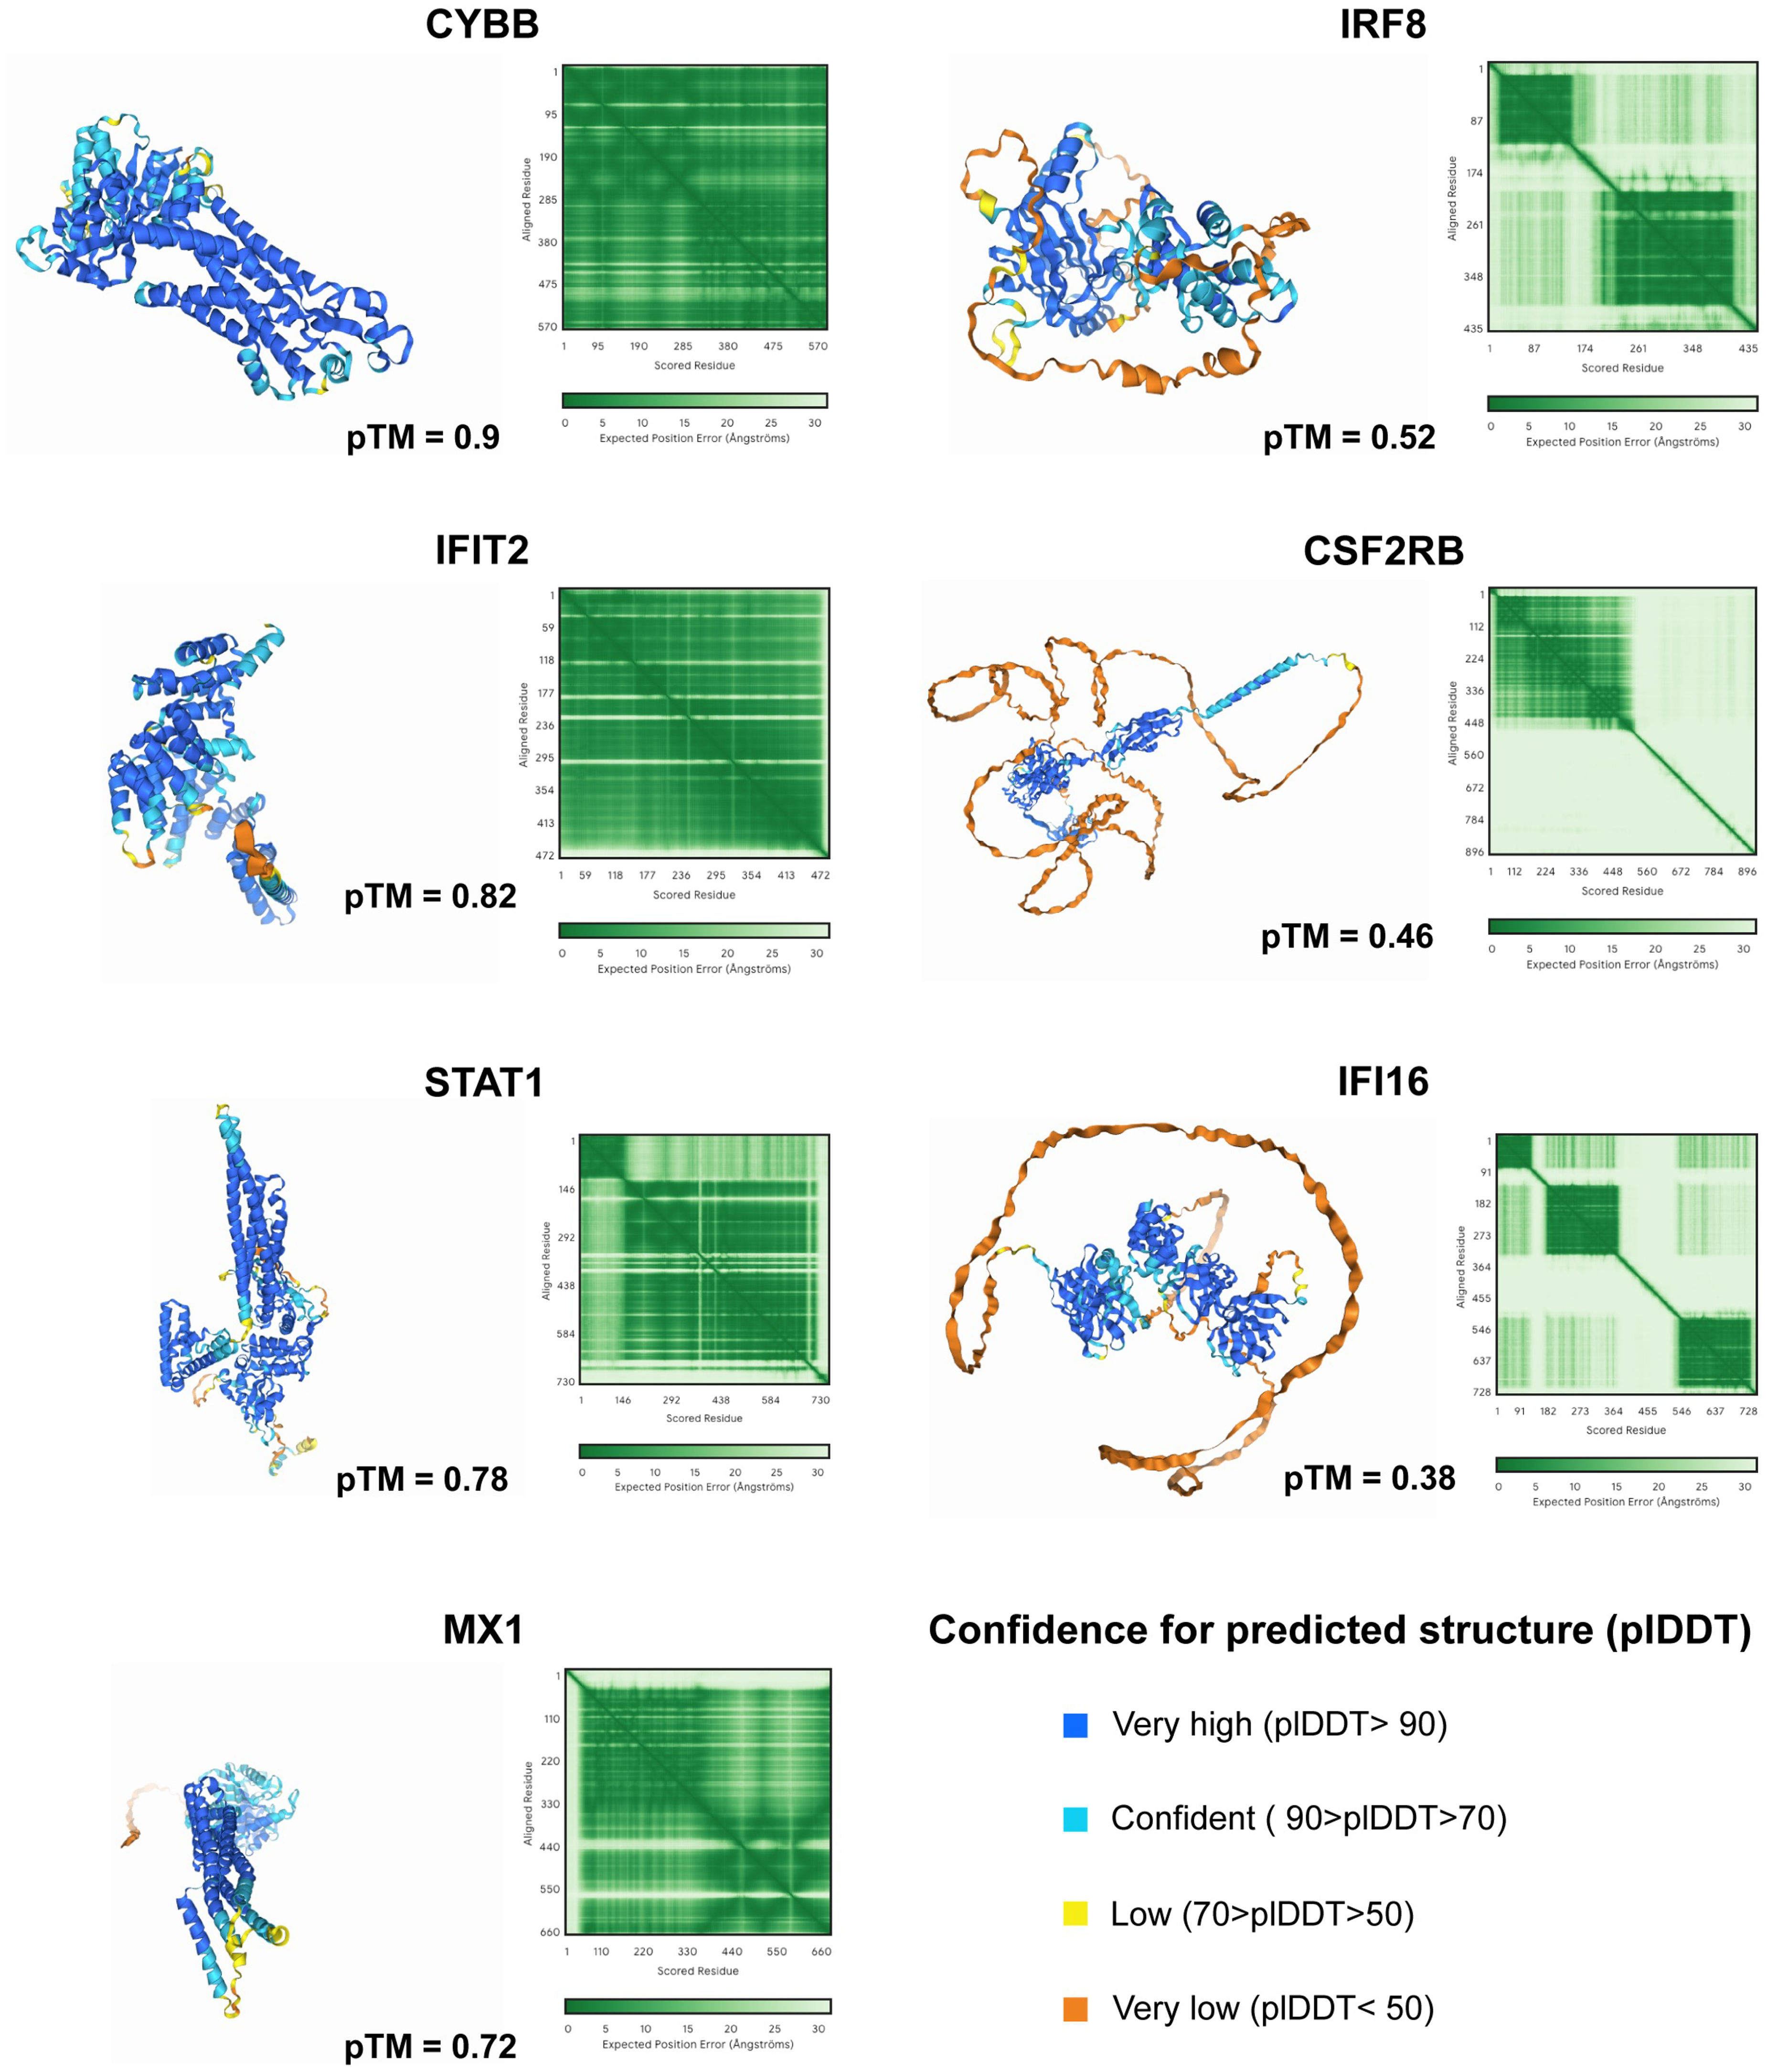
Protein structure prediction of hub genes by AlphaFold 3. Protein structures of CYBB, IRF8, IFIT2, CSF2RB, STAT1, IFI16, and MX1 predicted via AlphaFold 3.

Molecular docking of dexamethasone with CYBB. In silico visualization of the potential binding pose between the CYBB protein (surface representation) and dexamethasone (stick representation). The zoomed-in panel highlights the predicted hydrogen bonds and hydrophobic interactions at the binding pocket. This model serves as a hypothesis for a direct molecular interaction but requires experimental confirmation.
Discussion
At the forefront of precision medicine, our study advances lupus nephritis (LN) research into an uncharted territory. By employing scRNA-seq, we revealed a range of leukocyte meta-programs with unprecedented clarity. Our work not only resonates with but also significantly builds upon prior research, offering deeper, more nuanced insight into the cellular intricacies of LN.
Our novel use of NMF on single-cell data has revealed meta-programs that guide leukocyte activity, enhancing our comprehension of LN beyond previous static depictions.39–41 This methodology has illuminated intricate immune system dynamics, identifying new potential targets for intervention. The discovered meta-programs provide a novel framework for deciphering the complex immunological dynamics in LN. This finding is in concordance with studies showing the pivotal role of initial immune reactions in the advancement of LN.15,42 Our approach offers a sophisticated perspective by integrating machine learning to refine predictive models, highlighting potential biomarkers and therapeutic targets.
The contrasting populations of pDCs and CD56dimCD16+ NK cells, as revealed by our scRNA-seq analysis, provide valuable insights into the immunological landscape of LN. The smaller pDC population, despite the enhanced type I IFN signaling, may reflect differential recruitment and homing mechanisms in the renal tissue, potential cellular exhaustion or dysfunction due to prolonged exposure to type I IFNs, and the sensitivity and detection limits of scRNA-seq technology. These factors could contribute to the lower frequency of pDCs within the renal tissue compared to their systemic IFN responses.
The predominance of CD56dimCD16+ NK cells and their upregulated expression of IFN-γ and perforin align with their role in the immunopathological mechanisms of LN. The increased expression of IFN-γ suggests a pro-inflammatory role for these cells, potentially contributing to the renal damage characteristic of LN. The heightened expression of perforin indicates a potential involvement in cytotoxic activities, which may be detrimental to renal tissues in the context of LN.
The functional implications of the increased CD56dimCD16+ NK cells in LN are multifaceted. Their expression of IFN-γ and perforin, along with their potential roles in disease pathogenesis, suggests that these cells may be key drivers of renal damage in LN. Understanding their specific roles and interactions within the renal microenvironment could offer new avenues for therapeutic intervention. The distinct profiles of pDCs and CD56dimCD16+ NK cells, and their potential impact on disease progression, warrant further investigation. This will not only enhance our understanding of LN pathogenesis but also inform the development of targeted therapies aimed at modulating these critical immune cell populations.
Our cell-cell interaction analysis revealed three key dysregulated axes in LN pathogenesis. First, the macrophage subpopulation CM2 emerged as a central hub, exhibiting the highest interaction weights (both outgoing and incoming) in the network. Its strong autocrine signaling (CM2→CM2) suggests self-reinforcing inflammatory activity, while its prioritized communication with epithelial cells (CE0) implicates CM2 in coordinating both inflammation and fibrosis—a dual role that may explain its association with multi-organ damage in lupus. Second, the preferential activation of CD56bright NK cells (CT5b) by pDCs (CB2b), supported by elevated ligand-receptor pair weights (e.g., IFNα-IFNAR1), highlights a selective crosstalk mechanism that could drive NK cell hyperactivity in LN. Third, the marked reduction in Treg (CT3a)-B cell (CB3) interaction frequency points to a collapse in immune regulation, likely creating a permissive environment for autoantibody production. Conversely, enhanced effector T cell (CT3b)-plasma cell (CB1) interactions further amplify this imbalance. Together, these findings underscore how quantitative shifts in cellular crosstalk, rather than isolated cell-intrinsic defects, orchestrate LN progression through inflammation amplification, regulatory failure, and effector cell hyperactivation.
In conclusion, our findings emphasize the importance of considering the multifaceted nature of immune cell populations in LN. The distinct profiles of pDCs and CD56dimCD16+ NK cells, and their potential impact on disease progression, highlight the need for a deeper understanding of the factors influencing their distribution and activity within the kidney, as well as their systemic impact. This knowledge could provide new insights into the immunological dynamics in LN and potential therapeutic targets for modulating these critical immune cell populations.
In the realm of predictive analytics, our research underscores the prowess of computational biology by presenting an extensive array of 399 predictive models, significantly outperforming conventional methods. This extensive predictive framework sets a new standard for precision diagnostics. Our findings elucidate the role of key biological pathways in LN. The interplay between innate immunity and LN progression underscores its potential as a therapeutic target. The circadian patterns revealed by gene expression levels might explain the daily fluctuations in patient symptoms and suggest the appropriate timing for treatment interventions. 43 These insights into apoptosis and NF-kB signaling not only enhance our understanding of LN pathogenesis but also open new paths for targeted therapies. Further research into these pathways could lead to significant advancements in managing LN. Moreover, our adoption of functional network analysis via GeneMANIA revealed the critical roles of hub genes in LN pathology, shifting the focus from isolated gene studies to a comprehensive network view.
Circadian rhythms are integral to the regulation of numerous physiological processes, including immune function, and their dysregulation in LN can significantly impact disease pathogenesis. 12 Our analysis of circadian rhythm regulatory genes (CirRGs) indicated their involvement in modulating inflammatory pathways, which are crucial for the immune response and inflammation resolution. The circadian clock's influence on the expression of these genes can potentially modulate the severity and progression of LN. Moreover, disruptions in circadian rhythms can lead to an imbalance in the production of cytokines and chemokines by immune cells, contributing to the development of autoimmune diseases such as LN. Interestingly, LN patients often exhibit daily fluctuations in symptom severity, which may be attributed to the dysregulation of circadian rhythms. Recognizing these temporal patterns can guide the timing of therapeutic interventions, suggesting a role for chronotherapy in managing LN.
Apoptosis is a vital process for maintaining cellular homeostasis and preventing the accumulation of autoreactive cells that can lead to autoimmune diseases like LN. 13 Our study highlights the role of apoptosis regulatory genes (ApoRGs) in this context. Dysregulation of these genes can result in the survival of autoreactive cells, leading to a loss of immune tolerance and the onset of LN. Furthermore, apoptosis is instrumental in resolving inflammation and preventing tissue damage. In the context of LN, impaired apoptosis can lead to excessive cell death, thereby contributing to renal damage. This underscores the importance of ApoRGs in both the pathogenesis of LN and as potential therapeutic targets. Understanding the mechanisms by which ApoRGs influence lymphocyte apoptosis could offer new strategies for treatment in LN, emphasizing the need for further research into their role in disease progression and potential as targets for novel therapies.
The validation of the mRNA expression levels of the hub genes across multiple cohorts emphasized the robustness of our findings. The significant variability in the expression of genes such as CYBB, MX1, CSF2RB, IRF8, STAT1, IFI16, and IFIT2 highlights their potential as biomarkers and underscores their importance in the pathophysiology of LN. ROC curve analyses further validated these genes as potential diagnostic tools, with significant AUC values indicating their high diagnostic accuracy.
We acknowledge the conflicting findings regarding the role of CYBB in LN pathogenesis, with some studies suggesting that CYBB inhibits disease progression 44 and others indicating its involvement in promoting inflammation. 45 Our study identified CYBB as a robust marker of progression toward relapse in LN, which is consistent with its high expression in human LN biopsies. However, the dual nature of the role of CYBB in LN necessitates a nuanced understanding of its mechanisms. Recent research has highlighted the context-dependent role of CYBB in immune responses. While CYBB is a key component of the NADPH oxidase complex that generates reactive oxygen species (ROS), its activity can be both proinflammatory and anti-inflammatory depending on the cellular context and stage of the immune response. 46 In the context of LN, our data suggest that elevated CYBB expression is associated with disease activity and may contribute to pathogenic inflammatory processes.
The potential therapeutic effects of targeting CYBB with dexamethasone in LN can be explained by considering the immunosuppressive properties of glucocorticoids such as dexamethasone. 47 Dexamethasone is known to modulate the production of ROS and can suppress the activation of NADPH oxidase,48,49 thereby potentially reducing the inflammatory effects mediated by CYBB. Our molecular docking analysis further supported the interaction between CYBB and dexamethasone, suggesting a hypothetical direct molecular mechanism by which dexamethasone may modulate CYBB activity. Importantly, the therapeutic effect of targeting CYBB is not based solely on of its expression levels but also on the intricate balance between pro-inflammatory and anti-inflammatory signals in the LN. We hypothesize that by targeting CYBB with dexamethasone, the inflammation mediated by CYBB can be reduced, thereby ameliorating LN symptoms. This approach aligns with the known clinical benefits of glucocorticoid therapy in managing LN flares. 50
In conclusion, the role of CYBB in LN is complex and context dependent. Our study provides evidence that targeting CYBB with dexamethasone may have therapeutic effects by modulating its inflammatory activity, offering a potential avenue for precision medicine in LN treatment. Further research is warranted to fully elucidate the mechanisms underlying the dual role of CYBB in LN and to optimize targeted therapies on the basis of individual patient profiles.
Correlation analysis of the hub genes with clinical parameters provided additional insights into the disease. The notable negative correlations between hub gene expression and parameters such as the glomerular filtration rate (GFR), proteinuria, serum creatinine, and blood urea nitrogen (BUN) emphasize their potential role in disease progression and severity. The increased expression of CYBB, CSF2RB and IRF8 in higher pathological stages suggests their involvement in the exacerbation of LN.
Protein structure predictions via AlphaFold 3 offer valuable insights into the molecular mechanisms and potential interaction sites of hub genes, paving the way for targeted therapeutic interventions. Molecular docking analysis of dexamethasone with CYBB further revealed the potential for drug-target interactions, highlighting new therapeutic possibilities.
Limitations and future directions
We acknowledge several limitations that warrant discussion. First, the sample size of our single-cell RNA sequencing cohort, although representative, was modest, which may affect the generalizability of our findings. Future studies with larger cohorts will be necessary to validate our results and enhance the robustness of our predictive models. Second, the heterogeneity of LN, in terms of disease severity and clinical manifestations, poses a challenge in terms of capturing the full spectrum of the disease within our cohorts. Our study may not fully represent the variability of LN across different populations and disease stages, which could influence the applicability of our models in diverse clinical settings. Additionally, while our integrative approach may introduce biases or overfitting, particularly when dealing with high-dimensional data, we have employed rigorous cross-validation strategies to mitigate these issues, but the potential for such biases remains a consideration.
Critically, while we employed robust “in silico” validation using multiple independent external cohorts, our study is primarily computational. We lack new wet-lab experimental validation (e.g., qRT-PCR, Western blot, or functional knockdown assays) in this specific study to confirm the mechanistic roles of the identified hub genes beyond CYBB. Consequently, the molecular docking results should be interpreted as hypothesis-generating structural predictions rather than definitive evidence of binding affinity or therapeutic efficacy. While qRT-PCR results have validated the expression of CYBB, we acknowledge the importance of validating other hub genes such as MX1 and STAT1. In future studies, we plan to conduct comprehensive qRT-PCR validation, alongside knockdown and overexpression studies in relevant cell lines or primary cells to directly assess how modulating these genes affects LN-related pathways, particularly NF-κB signaling. Furthermore, exploring the therapeutic potential of CYBB-dexamethasone interactions in an LN mouse model is a critical next step. To this end, we plan to initiate in vivo experiments to investigate the effects of CYBB modulation in conjunction with dexamethasone treatment, and use flow cytometry and ELISA to quantify the activity of specific pathways, such as apoptosis and innate immunity, in clinical LN samples to fully understand the biological implications of our findings.
In summary, our insights do not merely elucidate disease mechanisms; rather, they shed light on refined diagnostic and therapeutic advancements. These methodologies introduce new standards for studying autoimmune diseases and hold promise for customized patient care. As research continues to build on our findings, we anticipate the refinement of diagnostic and therapeutic tools.
Supplemental Material
sj-pdf-1-ini-10.1177_17534259261426818 - Supplemental material for Advancing lupus nephritis research through multi-omics and predictive modeling
Supplemental material, sj-pdf-1-ini-10.1177_17534259261426818 for Advancing lupus nephritis research through multi-omics and predictive modeling by Lisha Mou, Ying Lu, Zijing Wu and Zuhui Pu in Innate Immunity
Supplemental Material
sj-xlsx-2-ini-10.1177_17534259261426818 - Supplemental material for Advancing lupus nephritis research through multi-omics and predictive modeling
Supplemental material, sj-xlsx-2-ini-10.1177_17534259261426818 for Advancing lupus nephritis research through multi-omics and predictive modeling by Lisha Mou, Ying Lu, Zijing Wu and Zuhui Pu in Innate Immunity
Supplemental Material
sj-docx-3-ini-10.1177_17534259261426818 - Supplemental material for Advancing lupus nephritis research through multi-omics and predictive modeling
Supplemental material, sj-docx-3-ini-10.1177_17534259261426818 for Advancing lupus nephritis research through multi-omics and predictive modeling by Lisha Mou, Ying Lu, Zijing Wu and Zuhui Pu in Innate Immunity
Supplemental Material
sj-tif-4-ini-10.1177_17534259261426818 - Supplemental material for Advancing lupus nephritis research through multi-omics and predictive modeling
Supplemental material, sj-tif-4-ini-10.1177_17534259261426818 for Advancing lupus nephritis research through multi-omics and predictive modeling by Lisha Mou, Ying Lu, Zijing Wu and Zuhui Pu in Innate Immunity
Footnotes
Funding
The authors disclosed receipt of the following financial support for the research, authorship and/or publication of this article: This work was supported by the National Key R&D Program of China (2017YFC1103704).
Declaration of conflicting interests
The authors declared no potential conflicts of interest with respect to the research, authorship, and/or publication of this article.
Data availability
The original contributions presented in the study are included in the article.
Supplemental material
Supplemental material for this article is available online.
References
Supplementary Material
Please find the following supplemental material available below.
For Open Access articles published under a Creative Commons License, all supplemental material carries the same license as the article it is associated with.
For non-Open Access articles published, all supplemental material carries a non-exclusive license, and permission requests for re-use of supplemental material or any part of supplemental material shall be sent directly to the copyright owner as specified in the copyright notice associated with the article.