
Abstract
Pseudomonas aeruginosa is an opportunistic bacterial pathogen of plants. Unlike the well-characterized plant defense responses to highly adapted bacterial phytopathogens, little is known about plant response to P. aeruginosa infection. In this study, we examined the Brassica napus (canola) tissue-specific response to P. aeruginosa infection using RNA sequencing. Transcriptomic analysis of canola seedlings over a 5 day P. aeruginosa infection revealed that many molecular processes involved in plant innate immunity were up-regulated, whereas photosynthesis was down-regulated. Phytohormones control many vital biological processes within plants, including growth and development, senescence, seed setting, fruit ripening, and innate immunity. The three main phytohormones involved in plant innate immunity are salicylic acid (SA), jasmonic acid (JA), and ethylene (ET). Many bacterial pathogens have evolved multiple strategies to manipulate these hormone responses in order to infect plants successfully. Interestingly, gene expression within all three phytohormone (SA, JA, and ET) signaling pathways was up-regulated in response to P. aeruginosa infection. This study identified a unique plant hormone response to the opportunistic bacterial pathogen P. aeruginosa infection.
Introduction
Pseudomonas aeruginosa is a Gram-negative, rod-shaped bacterium with a remarkably broad host range, which includes plants, nematodes, insects, zebrafish, mice, and humans.1–5 P. aeruginosa was first described as a tobacco plant pathogen that caused leaf spotting and necrosis, as well as soft stem rot in seedlings in a field in the Philippines. 6 Arabidopsis thaliana was subsequently established as the model host for studying P. aeruginosa pathogenicity in plants. 1 , 2 , 7 P. aeruginosa pathogenicity in plants is driven by various virulence factors in different bacterial strains and is also dependent on host genotypes. For example, P. aeruginosa strain PA14 caused severe disease symptoms in A. thaliana ecotypes Col-0 and Ll, moderate disease symptoms in ecotype Be, and no disease symptoms in ecotype Ag, 1 whereas P. aeruginosa strain PA29 caused severe disease symptoms in ecotype Ll, weak disease symptoms in ecotype Col-0, and no disease symptoms in ecotypes Ag and Be. 1 Both P. aeruginosa PA14 and PA29 are capable of infecting multiple ecotypes of A. thaliana. However, ecotype Ag is resistant to both strains. 1
P. aeruginosa PA14 was shown to enter A. thaliana leaves through stomata and wounds.
7
A unique feature of P. aeruginosa PA14 infection of A. thaliana is that the bacterium aligns itself perpendicular to leaf mesophyll cells and perforates the cell wall to gain entry into the plant.
7
,
8
Both P. aeruginosa strains PAO1 and PA14 were shown to be capable of infecting the roots of Arabidopsis and sweet-basil (Ocimum basilicum) plants in soil and are capable of causing plant mortality 7 d post inoculation, and both strains can colonize the roots of each plant and form extensive biofilms.
8
Interestingly, P. aeruginosa strains PAO1 and PA14 can block the germination of Arabidopsis seeds through the quorum sensing-controlled production of
Plants regulate microbial colonization of their tissues primarily through the innate immune system. 10 , 11 The activation of the immune response leads to the production of reactive oxygen species (ROS), activation of MAPK signaling cascades, phytohormone biosynthesis, cell wall strengthening, and callose deposition.12–15 Downstream from the recognition of bacteria, the innate immune response in plants depends on the production of a cocktail of phytohormones. There are three main phytohormones involved in plant innate immunity: salicylic acid (SA), jasmonic acid (JA), and ethylene (ET). SA is produced in response to biotrophs or hemi-biotrophs. Biotrophs are pathogens that derive energy from live plant material. 16 In contrast, hemi-biotrophs, including bacterial pathogens P. syringae and P. aeruginosa, can derive energy from living or dead plant material.16–18 JA and ET are produced in response to necrotrophs—pathogens that derive energy from dead plant material.16–18 However, there are instances where the responses mediated by these hormones were driven more by timing and kinetics than the identity of the stimuli. 19
Brassica napus (canola) is an important crop plant worldwide, and has been previously studied in terms of both interactions with plant growth-promoting bacteria (PGPB) and necrotrophic fungi. Canola plants inoculated with Pseudomonas sp. UW4, a PGPB, had increased shoot biomass in the presence of salt. 20 UW4 has this effect because it produces 1-aminocyclopropane-1-carboxylate (ACC) deaminase, an enzyme that breaks down ACC, the precursor molecule for ET biosynthesis, which limits the amount of deleterious ET produced by plants in response to stress. 21 In terms of biotic stresses, interactions between canola seedlings and fungal pathogens (e.g. Plasmodiophora brassicae, Sclerotinia sclerotiorum) have been well characterized.22–27 Bacterial pathogenic interaction with other plants from the Brassicaceae family have also been previously described. The bacterial pathogen Xanthomonas campestris is a seed-borne bacterium that causes black rot of crucifers. 28 In addition, Pseudomonas syringae pathovar tomato strain DC3000 elicits a hypersensitive response in Brassica rapa. 29 , 30 Finally, a fluorescent pseudomonad (Pseudomonas sp. RP2) isolated from field-grown Brassica campestris was shown to be pathogenic to immature B. campestris roots, causing inhibition of growth and development. 31 Pseudomonas sp. RP2 was also shown to penetrate B. campestris root tissue along epidermal cell anticlinal walls. 31 These examples highlight that bacterial pathogens have been shown to cause disease in members of the Brassicaceae family. However, canola’s tissue-specific transcriptomic response to bacterial pathogens has not been studied.
In the present study, canola seedlings’ innate immune response toward the broad host pathogen P. aeruginosa strain PA14 was characterized. The RNA sequencing data revealed that many genes involved in plant innate immune responses, such as systemic acquired resistance (SAR) and defense product biosynthesis, were highly up-regulated. Concomitantly, it was found that photosynthesis genes were significantly down-regulated during the same 5 d infection period. Interestingly, all three phytohormone signaling pathways (SA, JA and ET) were strongly up-regulated throughout the 5 d infection. This work showed that the defense hormone response to different pseudomonad species is varied. The simultaneous up-regulation of all three phytohormone signaling pathways is uncommon as a defense response to highly adaptive phytopathogens such as P. syringae species. However, it is likely a means of fine-tuning plant defense response toward an opportunistic pathogen such as P. aeruginosa.
Methods
Plant growth
B. napus (canola) seeds (Mumms Sprouting Seeds, Toronto, Canada) were surface sterilized using 0.3% Tween™ 20 (Fisher Bioreagents™; Thermo Fisher Scientific, Waltham, MA) and 20% commercial bleach in an aqueous solution, then washed three times using sterile water and planted on MS (Murashige and Skoog basal medium with vitamins from Phytotechnology Laboratories supplemented with 0.5 g/l MES hydrate and 0.5% sucrose at pH 5.7) agar plates. After 7 d, seedlings were aseptically transferred to 50 ml conical tubes containing 5 ml MS liquid medium (where only the roots were submerged in the MS medium). The tops of the conical tubes were sealed with Micropore tape and placed in a tube holder on a growth light stand (Hydrofarm, Petaluma, CA) for 3 d at 22°C, under 16 h of daylight (750 lumens) before infection.
Bacterial growth
P. aeruginosa PA14 is a primary clinical isolate from a burns patient. 32 , 33 P. aeruginosa PA14 was grown in LB medium with shaking at 200 rpm for 16 h at 37°C. Cultures were centrifuged at 9000 g for 5 min, washed twice with sterile 10 mM MgSO4, and then re-suspended in MS liquid medium (components indicated above). Bacterial optical densities (OD) at 600 nm were adjusted to 0.1 (8.0 × 10⁷ cells/ml) for all infections. This bacterial inoculum amount was previously optimized in our lab (data not shown), and is within the range (1.6 × 10⁷–1 × 10⁸ cells/ml) previously reported in the literature for P. aeruginosa root infections. 8 , 34
Canola seedling infection
Ten-d-old canola seedlings had their roots damaged (poked with a sterile P1000 pipette tip), and half of the canola seedlings were infected with P. aeruginosa PA14. The other half of the root-damaged seedlings were treated with sterile MS medium (noninfected controls). All of the following measurements were done at 0 (2 h post infection), 1, 3, and 5 d post infection. The canola seedlings’ tissues (roots and shoots) were separated before being weighed. The numbers of black spots on the leaves were counted as an indicator of disease severity. The root tissues were then ground using a tissue homogenizer, and then bacterial CFUs were counted to measure root colonization.
RNA sequencing
RNA was isolated from the roots and shoots of canola seedlings on d 1, 3, and 5 according to the manufacturer’s instructions using a RNeasy Plant Mini Kit (Qiagen, Valencia, CA). DNA was removed from all the RNA samples using the DNA-free kit (Invitrogen, Carlsbad, CA) following the manufacturer’s instructions. Total RNA (1 μg) was used for preparing the library with TrueSeq RNA sample Prep Kit v2 (Illumina, San Diego, CA) according to the manufacturer’s guidelines with 24 different barcodes (two biological replicates). The libraries were sequenced for 50 cycles on a HiSeq 2500 (Illumina) rapid mode using two lanes of a flow cell. The sequencing was performed at the Tufts University Sequencing Core facility (Boston, MA). FASTQ files were downloaded from the core facility and used for data analysis. The quality of each sequencing library was assessed by examining FASTQ files with FASTQC. RNA sequencing data are available in the ArrayExpress database (www.ebi.ac.uk/arrayexpress) under accession number E-MTAB-7864.
RNA sequencing data analysis
Raw single-end reads were mapped to the B. napus assembly (AST_PRJEB5043_v1) using bowtie2 v2.24 35 with default options. To circumvent the issue of reads mapping to duplicate genes on homologous chromosomes, B. napus gene expression levels were quantified with mmquant v1.2, 36 which collapses genes mapped by multiple reads into single categories. We excluded all multi-gene categories (i.e. cases where reads mapped ambiguously to multiple genes) from downstream analyses. Gffread v0.9.9 (https://github.com/gpertea/gffread) was used to convert the annotation file format from GFF3 to GTF. Custom Python scripts were used to parse this output, which were run on multiple files simultaneously with GNU Parallel v20170722. 37 Homologs of all B. napus genes in A. thaliana were identified by running BLASTn v2.2.31+ 38 on each B. napus gene against all A. thaliana genes. The top matching A. thaliana gene at E values < 0.0001 was taken to be a homolog for each B. napus gene. Next, DESeq2 v1.16.1 39 was run in an R environment (v3.4.3) 40 to identify differentially expressed B. napus genes between control and infected samples after controlling for sequencing lane. The default DESeq2 options were used and then log-fold change shrinkage was performed with the “lfcShrink” function using the adaptive shrinkage estimator method. 41
Venn diagrams of the number of genes called as differentially expressed overlapping across d were generated with the ggVennDiagram v0.3 R package. For the heat map visualization, log-fold changes were set to be an absolute maximum of 2. Also to aid with visualization, each significant gene was assigned as a member of one of 46 high-level Gene Ontology (GO) biological processes (GO SLIM categories) that are used for visualization on the Arabidopsis Information Resource website (www.arabidopsis.org). B. napus genes were assigned membership to these categories based on their A. thaliana homolog. In cases where a gene was found in multiple categories, it was placed in the smallest group. To aid with visualization, 29 GO categories were excluded because they each contained fewer than 100 significant genes. All genes were hierarchically clustered using the complete-linkage method within each GO category grouping independently with the ComplexHeatmap R package v2.0.0.
Gene set enrichment analyses for all GO biological processes were performed on significant genes with absolute lfc > 2 and adjusted P < 0.1 using the topGO R package v2.36.0 and a mapping of A. thaliana genes to GO categories acquired from the TAIR database. The background genes were limited to 19,148 A. thaliana genes with expressed B. napus homologs, and all GO categories with a node size less than 10 were excluded. For visualization, the top 15 (or all remaining significant) GO categories based on fold enrichment were plotted after filtering the significant GO categories based on a minimum corrected P value of 0.05 and a minimum of five significant genes observed. In cases where highly redundant GO categories (based on both the interpretation of the biological process and the exact genes involved) were within the top 15 hits, only one representative GO category was retained. P values were corrected using the Benjamani–Hochberg procedure. 42
All Python and R scripts run for the custom bioinformatics methods are available at this GitHub repository: https://github.com/gavinmdouglas/canola_pseudomonas_RNAseq.
RT-qPCR
RNA was isolated and DNA was removed as described above for the roots and shoots of canola seedlings on d 1, 3, and 5. Reverse transcription reactions were performed using an iScript cDNA synthesis kit (Bio-Rad, Hercules, CA). Complementary DNA (cDNA) concentrations were measured using a Nano-drop instrument (Thermo Fisher Scientific). RT-qPCR reactions were performed using a CFX96 real-time PCR machine (Bio-Rad) using SsoAdvanced™ Universal SYBR® Green Supermix (Bio-Rad). PCR reactions were performed as follows: 95°C for 3 min followed by 40 cycles of 95°C for 10 s and 55°C for 30 s. Fold change was calculated relative to plants treated with sterile MS medium. Gene expression values were normalized to the eukaryotic translational initiation factor 4A1 (EIF4A1). Primers used in this study are given in Supplemental Table S1. Because B. napus is an allopolyploid, it can be difficult to distinguish the exact loci amplified by the RT-qPCR reactions. Accordingly, we compared the RT-qPCR log-fold change results with the mean results for multiple genes per reaction when applicable (indicated in parentheses): ABCG40 (BnaA06g10230D and BnaC05g11890D), BBE4 (BnaC05g20370D and BnaA09g28890D), CYP710A1 (BnaC04g10740D), and RBCSF1 (BnaA02g12800D, BnaA04g08570D, BnaA04g08640D, BnaA04g27920D, BnaA07g14420D, BnaAnng36210D, BnaC04g30810D, BnaC04g30870D, and BnaCnng55860D).
Statistical analysis
All statistical analyses not focused on the sequencing data were conducted using GraphPad Prism v6.0 using the recommended parameters. Multiple grouped sample means within d or within tissue type were analyzed using a two-way ANOVA with a post-hoc (Sidak’s multiple comparisons test) test to determine differences between samples, whereas independent sample means throughout the infection were analyzed using an ANOVA with a post-hoc (Tukey’s multiple comparisons test) test to determine differences between samples. Significance was measured at P < 0.05, and significant differences are reported as asterisks and different letters.
Results
We first investigated whether P. aeruginosa PA14 can cause disease symptoms in an agriculturally important crop such as canola. P. aeruginosa PA14 culture is often infiltrated into the plant leaves using an infection model developed for the well-described plant pathogen Pst DC3000 43 to study its pathogenicity. A root infection model for P. aeruginosa PA14 in Arabidopsis and sweet basil plants has also been used by severing the tips of the roots prior to infection. 8 Here, we adopted a similar infection model by artificially damaging the roots using a pipette tip prior to infection. Since P. aeruginosa is naturally isolated from the soil, we chose the root infection model to characterize the interactions between this bacterium with the roots of canola in this study. There was no significant difference in root mass on d 0 (2 h post infection) between control and infected plants. However, on d 1, 3, and 5, there were decreases of 41%, 66%, and 82%, respectively (Figure 1a). As the infection progressed, canola seedling roots had obvious signs of necrosis (black lesions), and some cells separated from root tissue and settled to the bottom of the conical tube, which may explain mass loss. Significant decreases in shoot mass were only observed between control and infected plants on d 3 and 5 post infection, with decreases of 46% and 56%, respectively (Figure 1b). Infected canola seedling stems lost turgor pressure during the infection (∼3 d post infection), which caused the leaves to wilt at 5 d post infection. There was no significant difference observed from d 0 to 1 in P. aeruginosa PA14 root CFU measured from canola seedlings. However, root CFU decreased by 32% from d 1 to 3, while there was no significant difference observed from d 3 to 5 (Figure 1c).
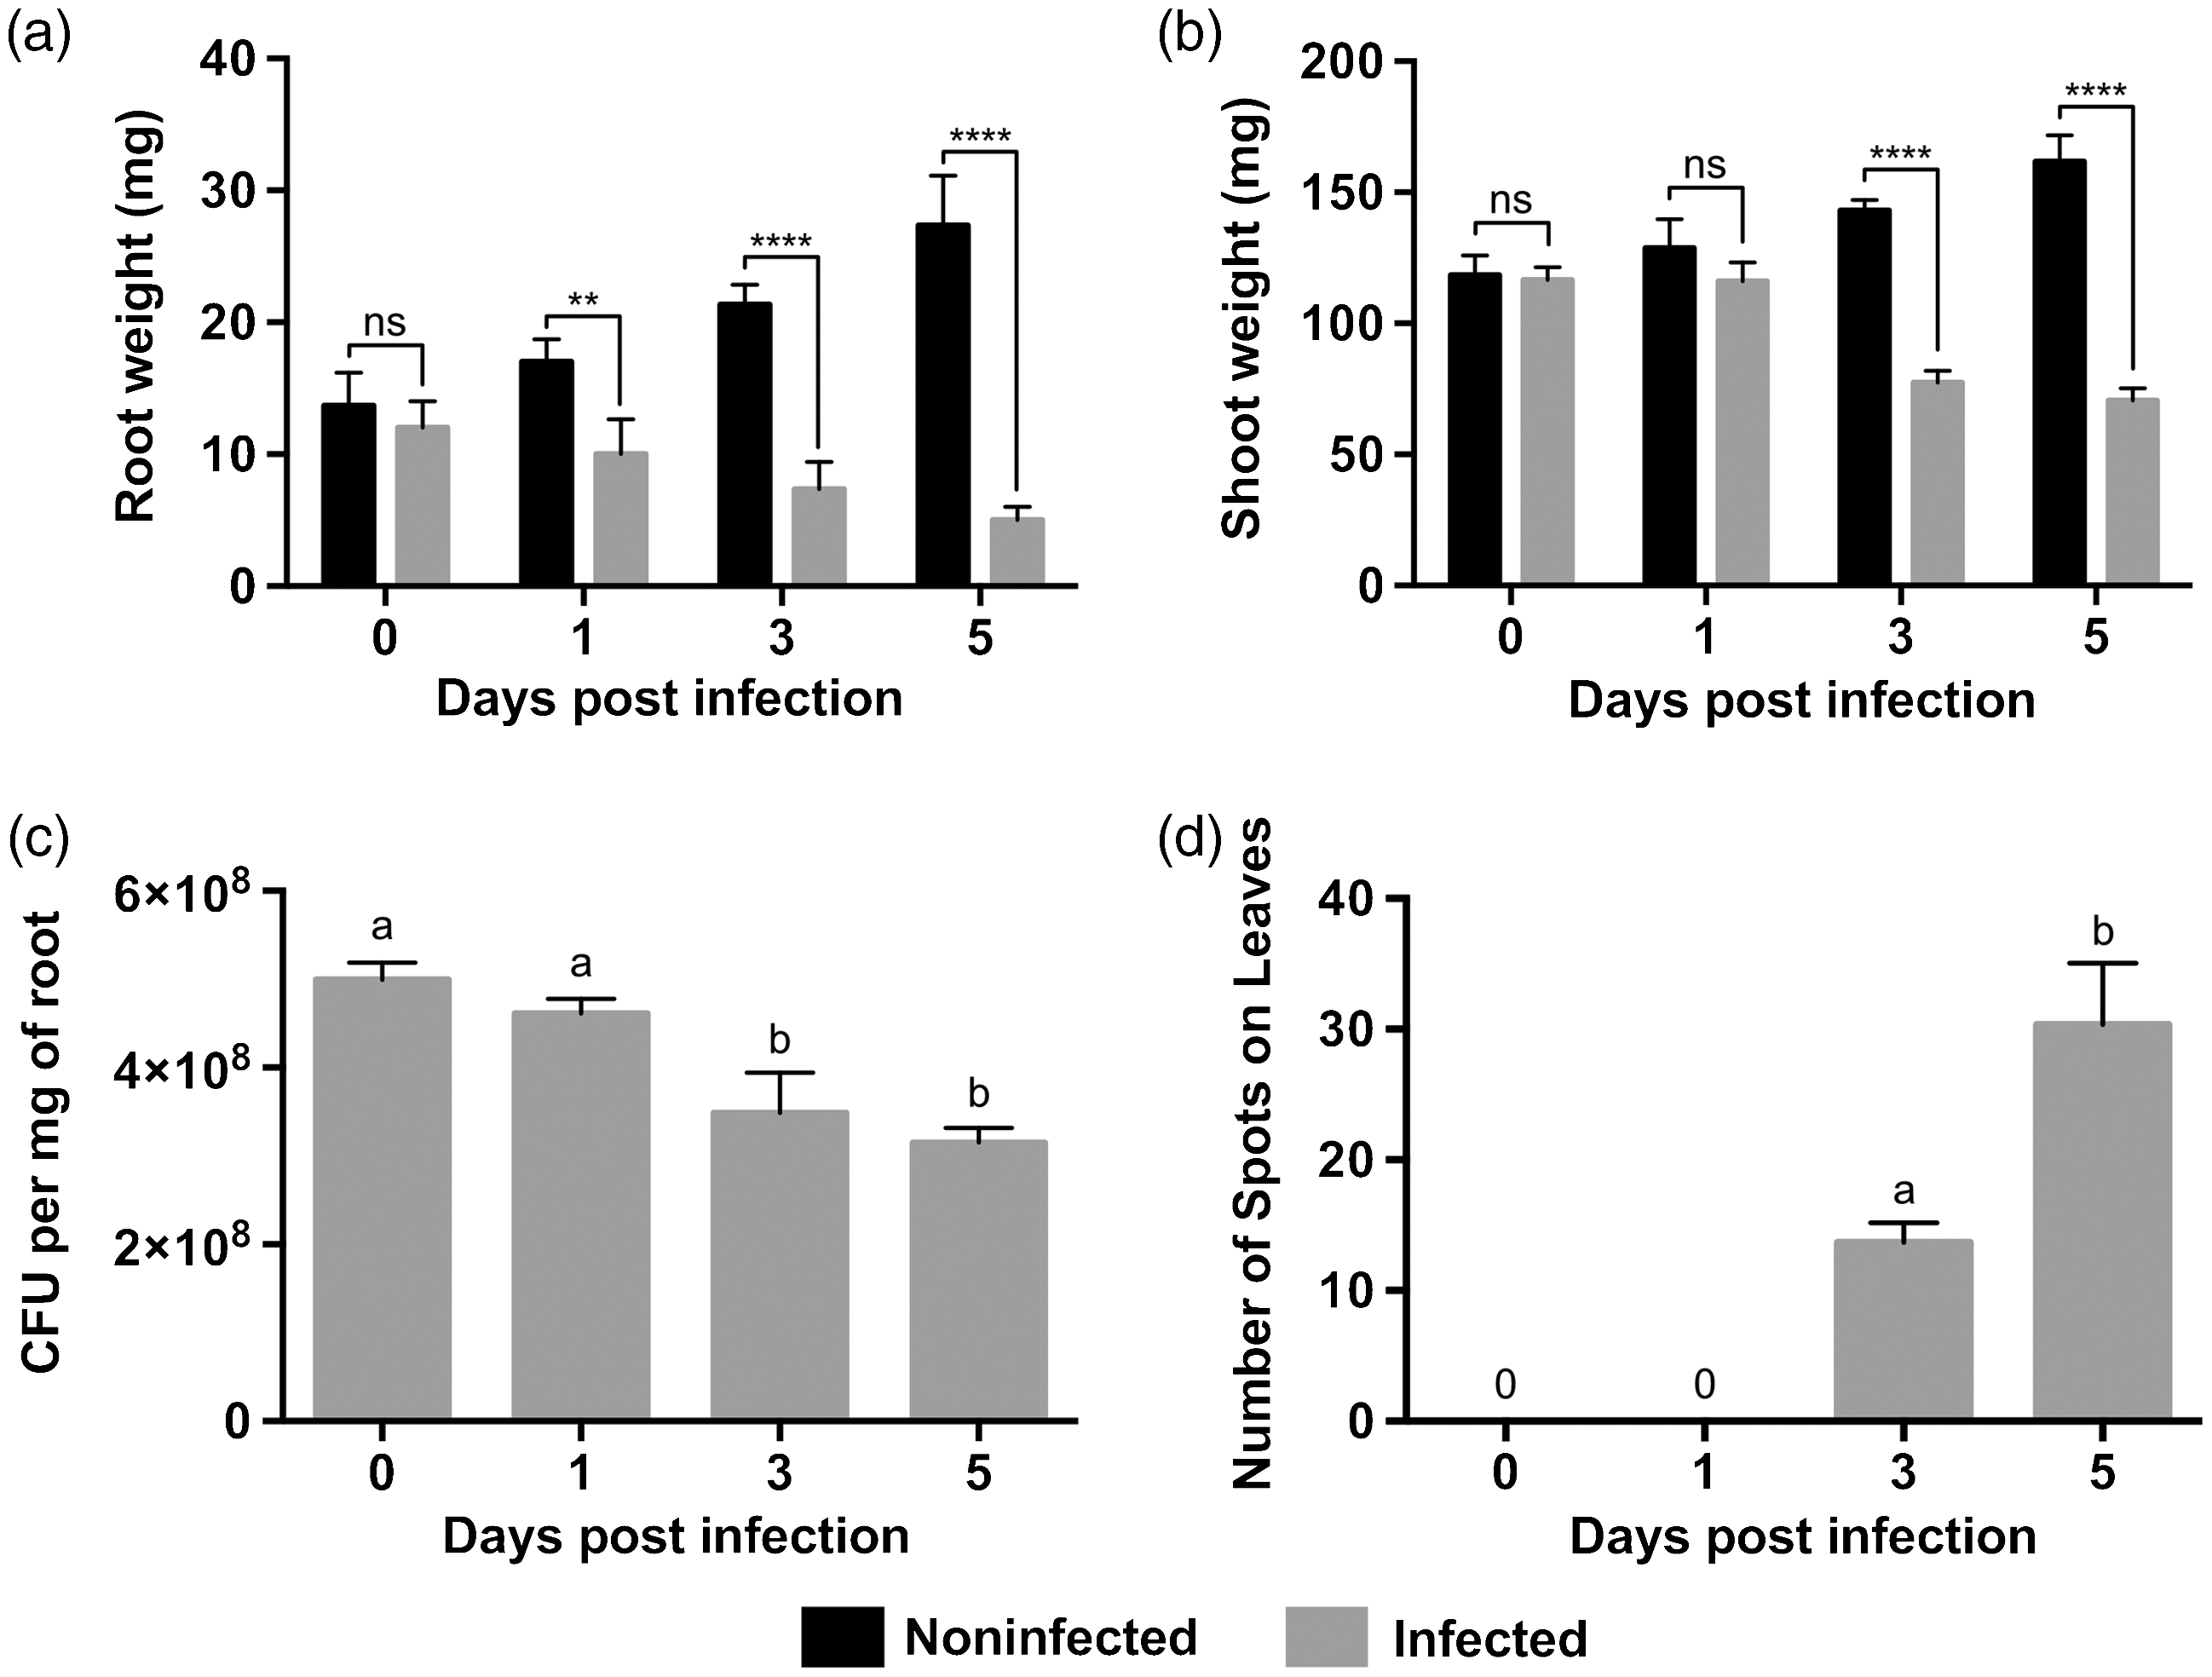
Time course infection of Pseudomonas aeruginosa PA14 in Brassica napus seedlings with damaged roots. B. napus root (a) and shoot (b) mass measured on d 0 (2 h post infection), 1, 3, and 5. P. aeruginosa PA14 root CFU (c) measured on d 0 (2 h post infection), 1, 3, and 5. The number of black spots on B. napus leaves (d) recorded on d 0 (2 h post infection), 1, 3, and 5. Error bars represent SD of three independent biological replicates. Statistical significance was measured at the P value < 0.05 probability level; ns or same letter indicates non-statistically significant differences between groups, whereas an asterisk or different letter indicates statistically significant differences between groups.
Cells within plant leaves typically undergo localized cell death that limits the spread of infection to other areas within the leaf tissue. 44 The number of black spots on plant leaves is indicative of cell death within this region, which is likely a reflection of bacterial infection. The number of spots on the leaves of canola seedlings infected with P. aeruginosa PA14 increased throughout the course of the infection (Figure 1d). There were no black spots observed on canola seedling leaves on d 0 (2 h post infection) and d 1 of the infection (Figure 1d). However, there was a significant increase of 1.2-fold in the number of black spots on infected canola seedlings between d 3 and 5 (Figure 1d).
Then, we examined the plants’ transcriptomic response to P. aeruginosa infection, a response that has not been previously characterized. To examine tissue-specific transcriptomic responses in canola seedlings during an infection with P. aeruginosa PA14, RNA was extracted on d 1, 3, and 5, and subjected to whole transcriptome profiling. The mean of raw read counts was 12,092,538 (SD = 9,299,632) from all samples. The average percentage of these raw read aligned to the B. napus genome was 89.7% (SD = 11.2%). These reads were mapped to 81,824 B. napus genes, which were tested for differential expression between infected and uninfected plants. Based on these tests, there were 7381 genes differentially expressed between infected and control samples on at least 1 d in at least one tissue (DESeq2 adjusted P < 0.1 and absolute lfc > 2). All the differentially regulated B. napus genes in both shoots and roots during the 5 d infection by P. aeruginosa were then summarized by Venn diagrams (Figure 2). It was found that the number of differentially expressed genes was greater in the root tissue on d 1 (3307) and d 3 (3821) compared to d 5 (610; Figure 2a and b). In contrast, the number of differentially expressed genes within the shoots was greater on d 5 (3163) compared to d 1 (993) and d 3 (512; Figure 2c and d). These trends were true for both up- and down-regulated genes (Figure 2).
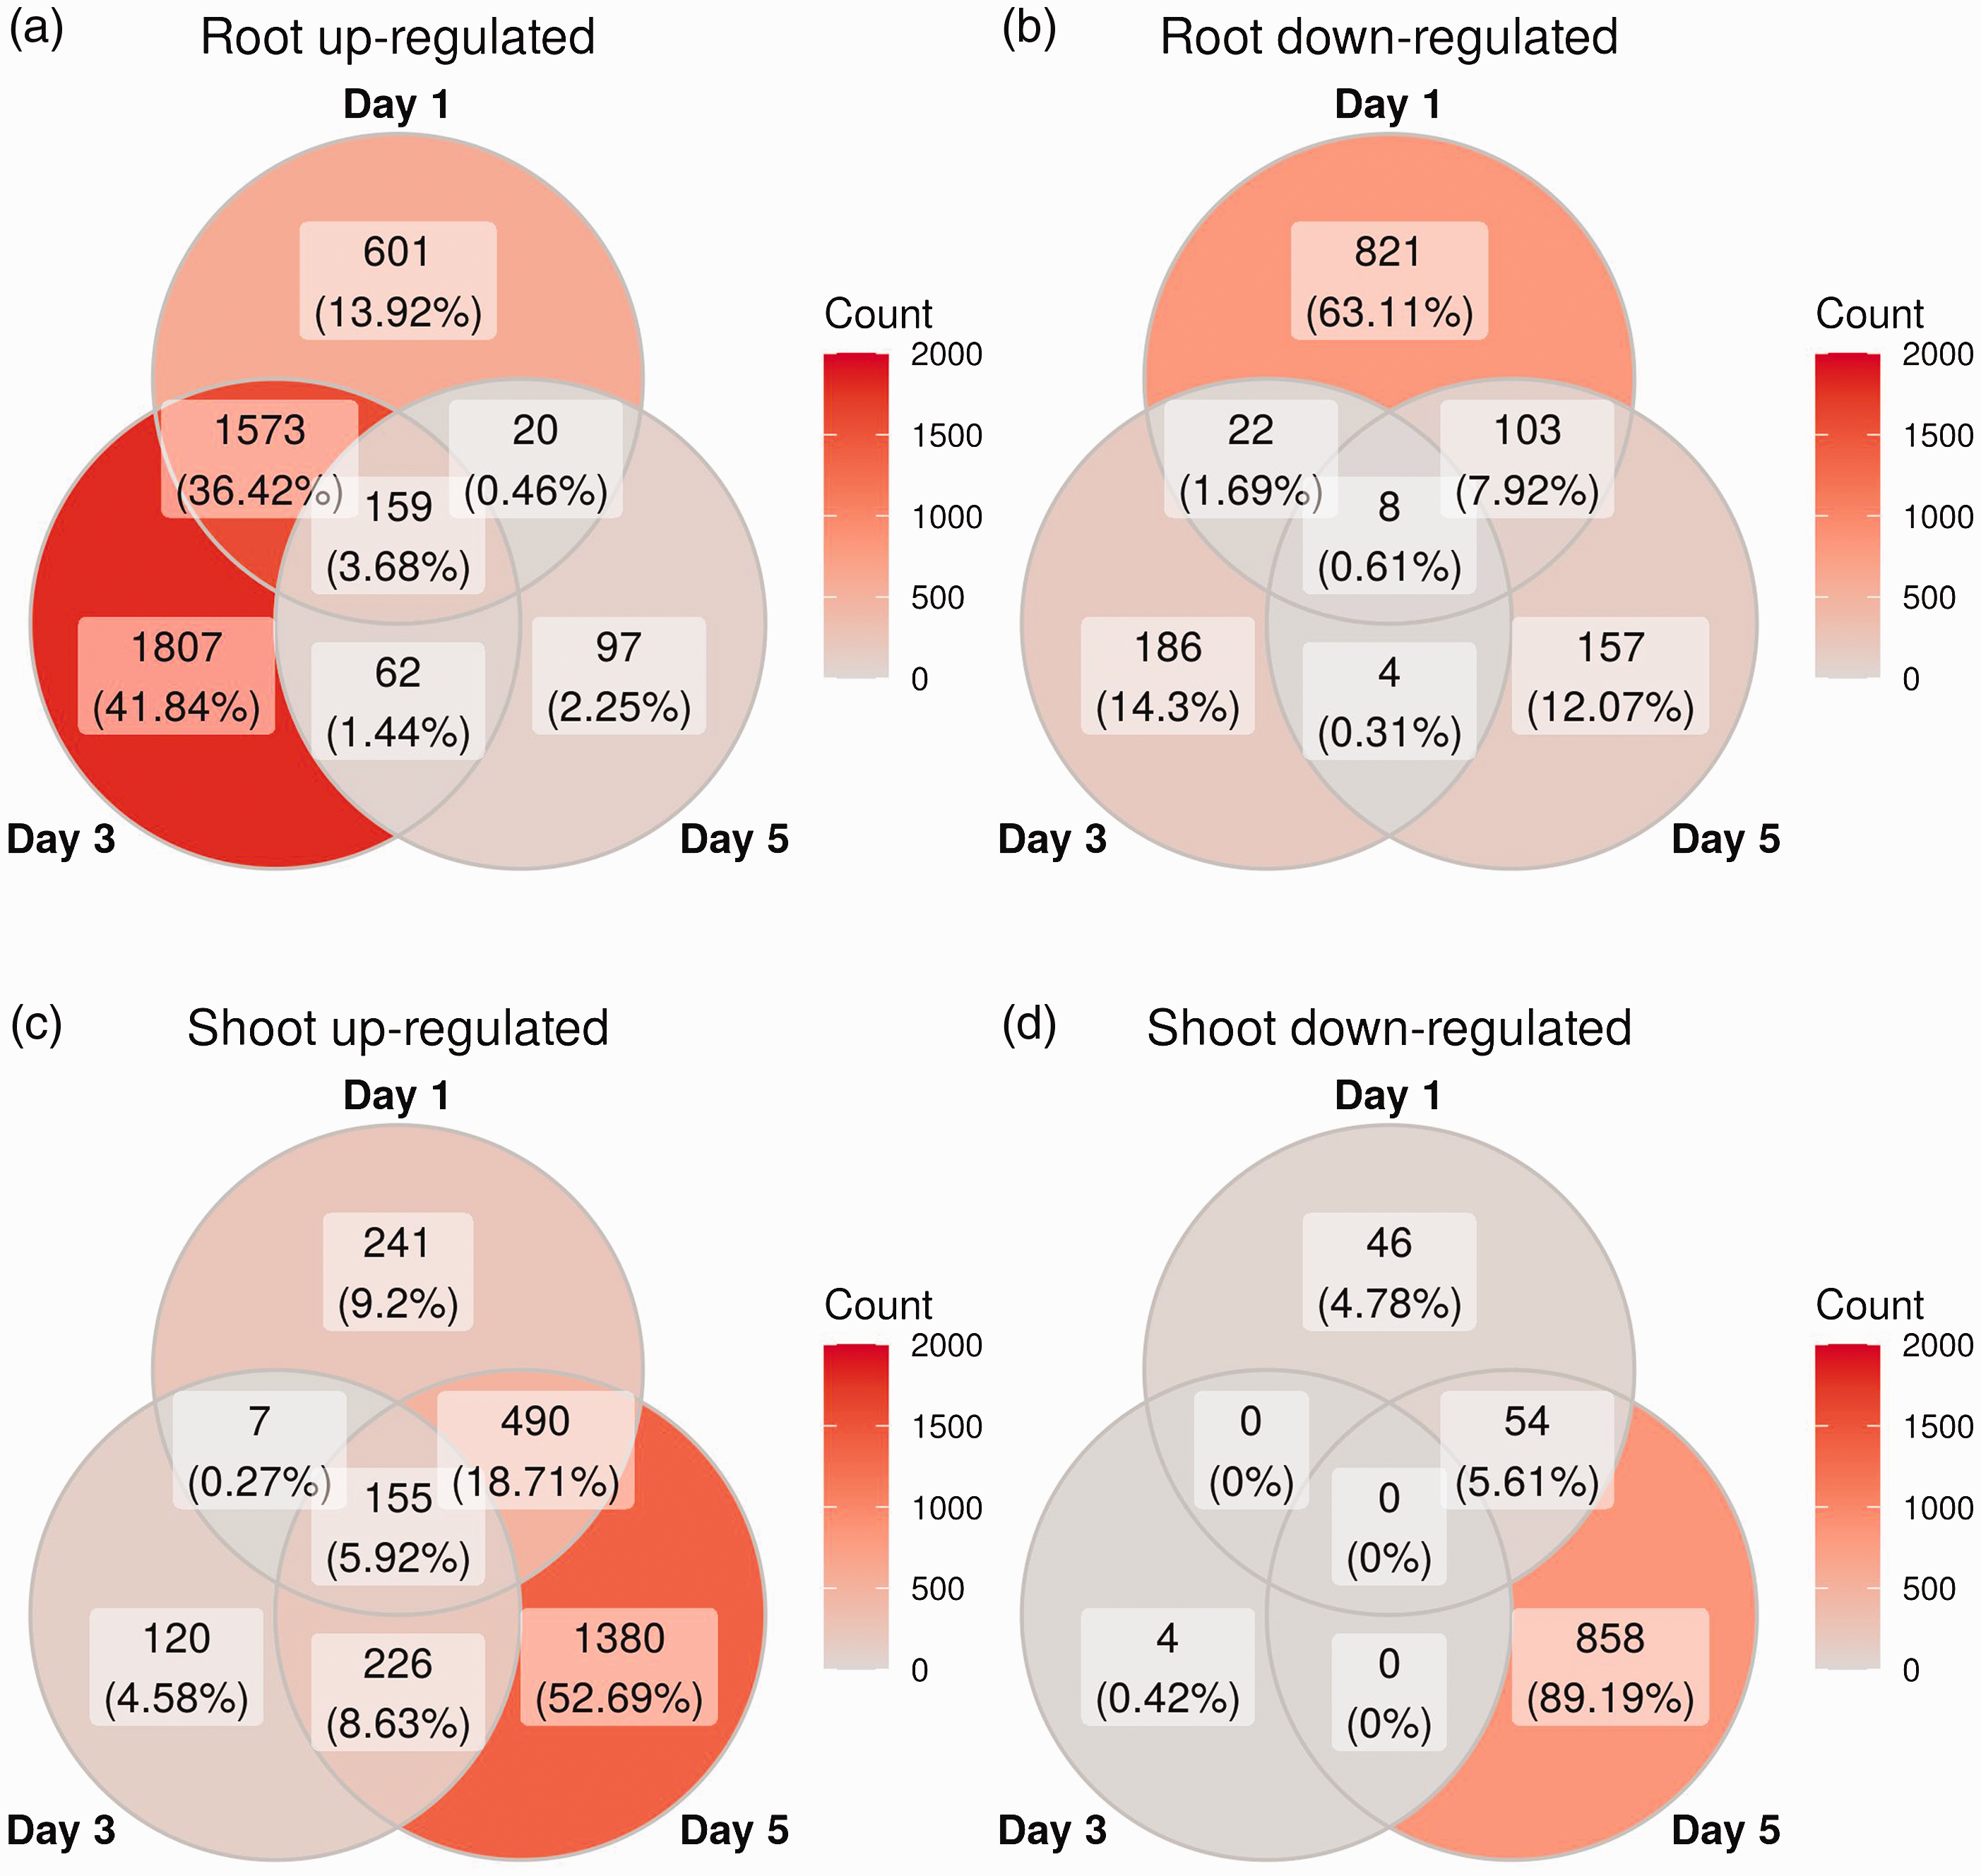
Overlapping differentially expressed genes across d. Venn diagrams of differentially expressed genes for genes with adjusted P-values < 0.1 and absolute log-fold change values greater than two. The four panels are split by tissue and by whether the genes were up- or down-regulated, as indicated at the top of each panel.
Since canola is not a model organism, and therefore lacks complete annotation information for all these differentially regulated genes, we identified canola homologs to genes within the A. thaliana ecotype Col-0 genome, a closely related model organism. We were able to match 64,996 genes from B. napus with significance (E value < 0.0001) to 19,214 A. thaliana genes (mean percent of reads mapped to A. thaliana homologs: 73.0%; SD = 10.9%). In addition to providing basic annotation information, mapping to A. thaliana homologs also enables links from genes to GO categories. We summarized each matching A. thaliana homolog to one of 46 high-level GO biological processes. We then visualized the log-fold change of all 7381 differentially expressed B. napus genes by their corresponding membership within each of these high-level GO biological processes (Figure 3). Based on this approach, we were able to link 6105/7381 (82.7%) of the differentially expressed B. napus genes to high-level GO biological processes for visualization.
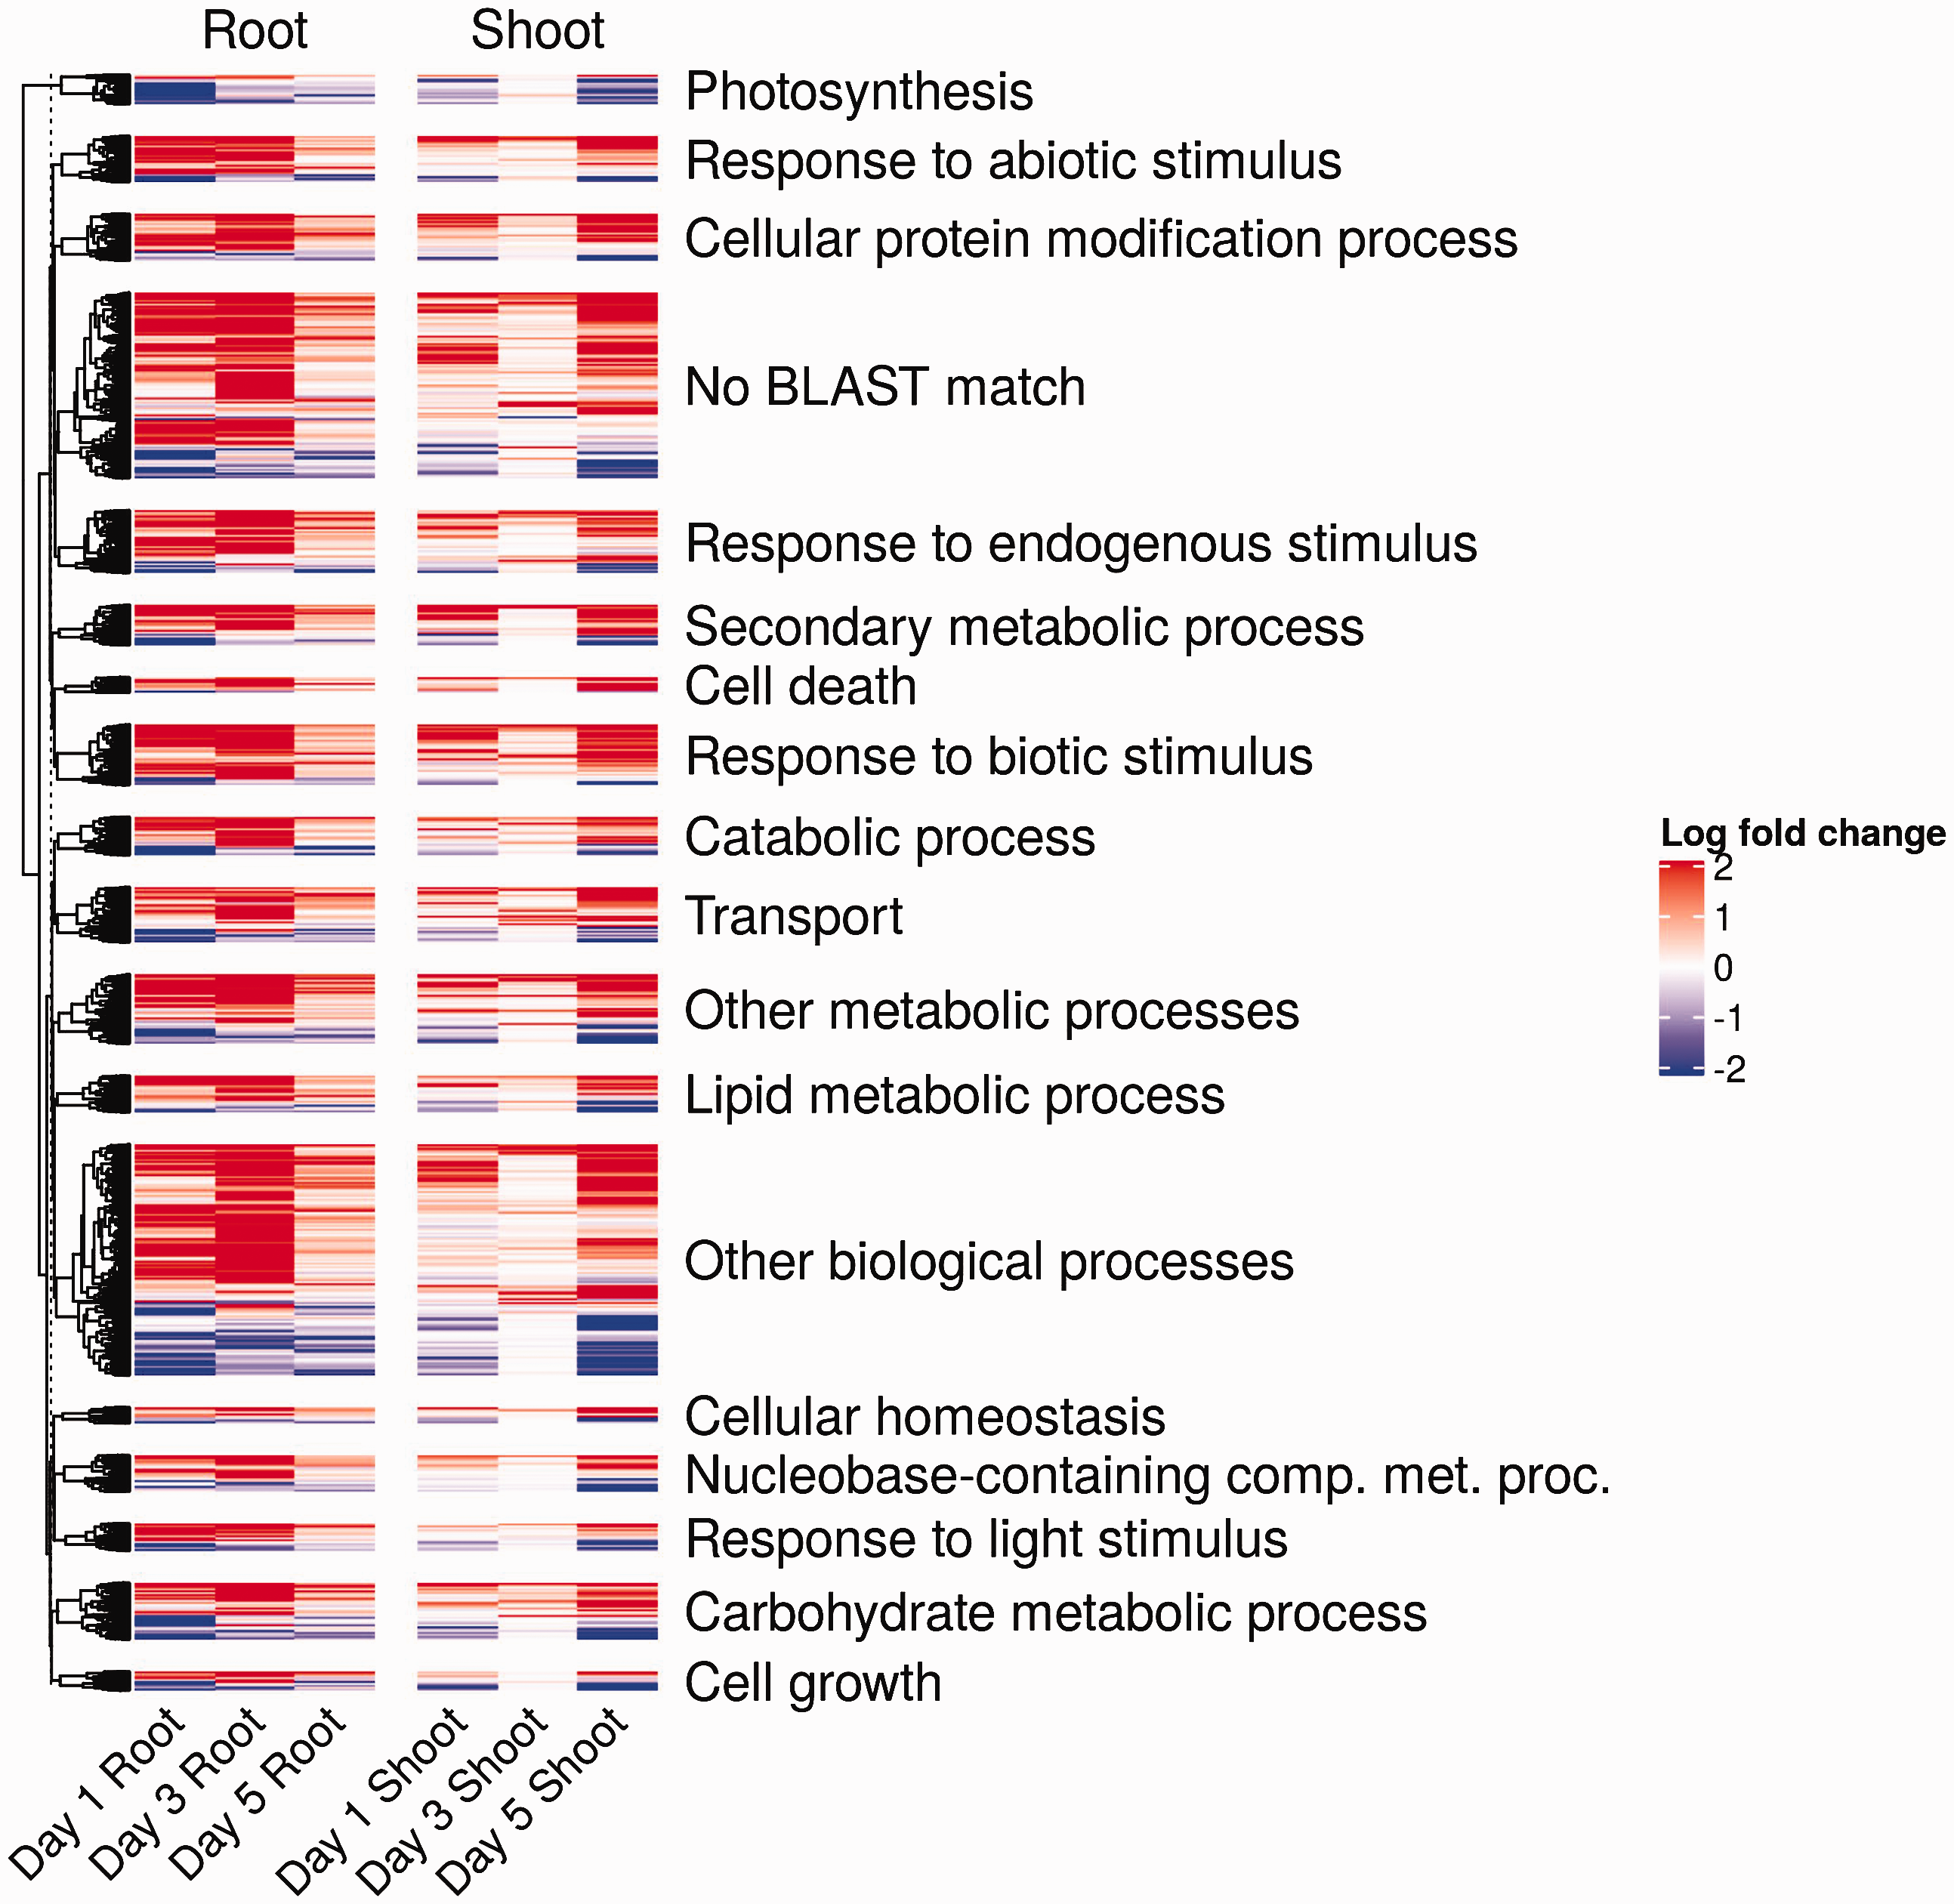
Differentially expressed genes in B. napus during a 5 d infection with P. aeruginosa PA14. Heat map of genes differentially expressed in at least one tissue and on at least 1 d. The log-fold difference represents the difference between control and infected samples. Note that all absolute log-fold change values greater than two were set to two to make this plot easier to visualize. The significant genes are grouped into high-level Gene Ontology (GO) biological processes based on each gene’s matching Arabidopsis thaliana homolog. The category “No BLAST Match” corresponds to B. napus genes without a matching A. thaliana homolog.
To validate our RNA sequencing results, we performed RT-qPCR of 4 B. napus genes identified at differential abundance. The genes chosen are of interest due to their gene products’ involvement in plant defense responses (cytochrome P450 710A1 [CYP710A1], berberine bridge enzyme-like 4 [BBE4] and ABC transporter G family member 40 [ABCG40]) and photosynthesis (ribulose bisphosphate carboxylase small chain F1 [RBCSF1]). A. thaliana genes were aligned to the B. napus genome using BLAST to design specific primers for confirmation (v2.2.31+). 38 We identified clear concordance between the two technologies, with Pearson correlation coefficients (R2) of 0.81 and 0.74 for the root and shoot tissues, respectively (Figure 4).
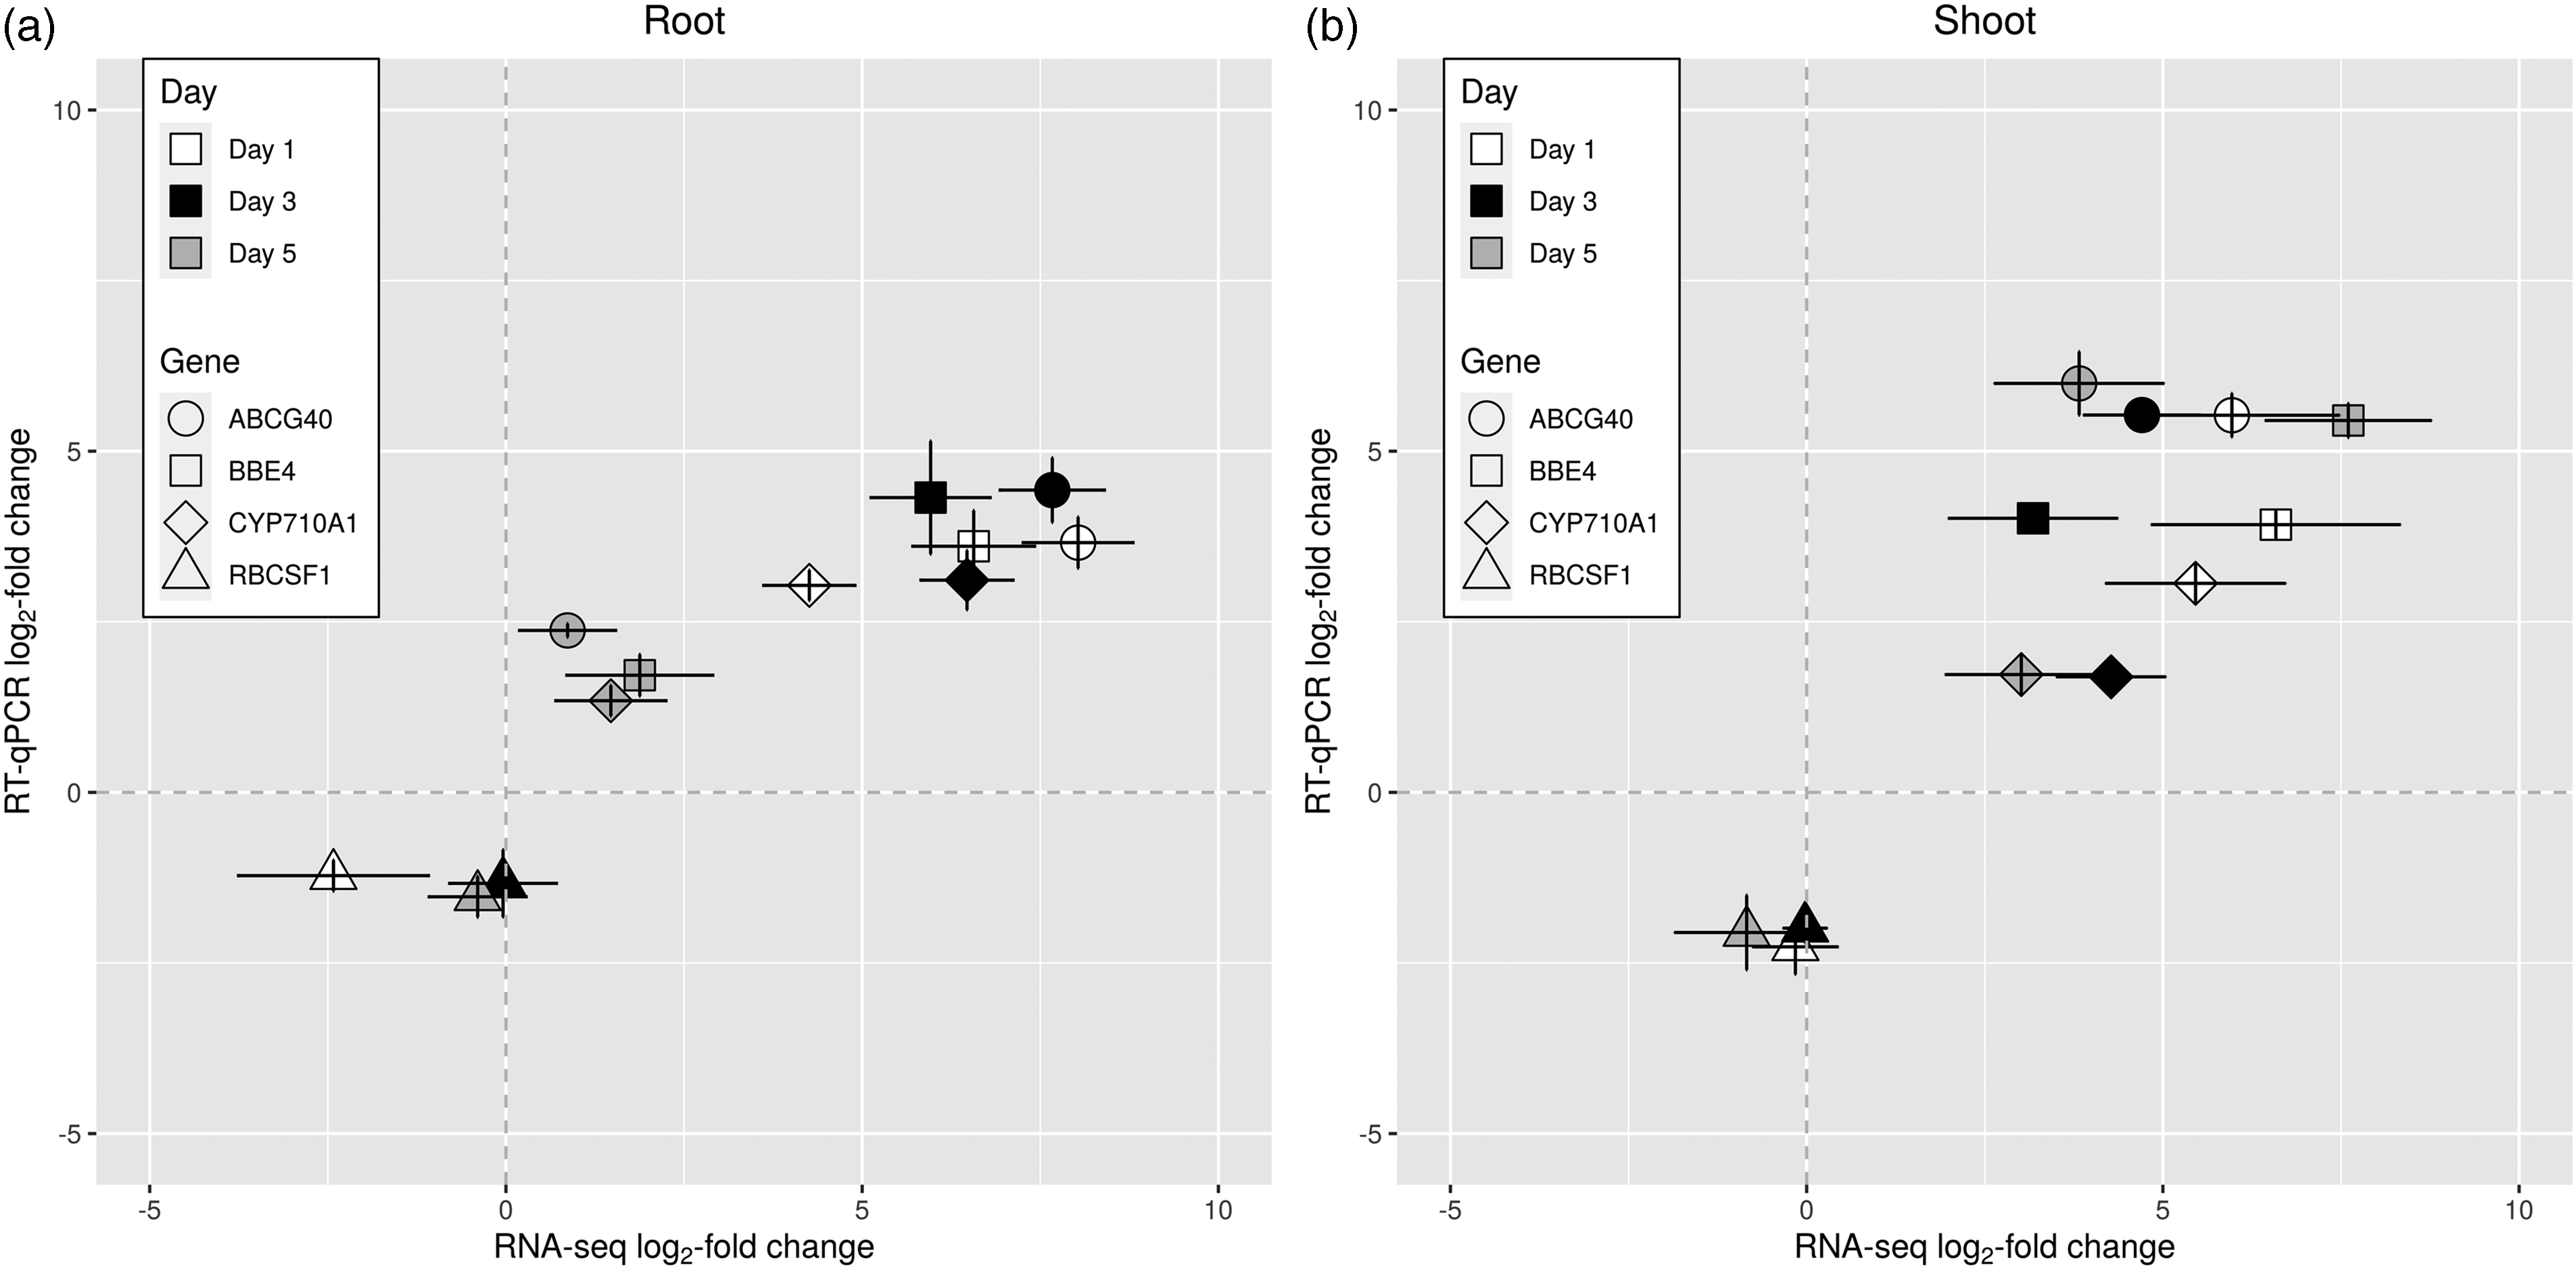
Relative expression (log2) of selected genes within B. napus root and shoot tissues during a 5 d infection with P. aeruginosa PA14. Relative expression of CYP710A1, BBE4, ABCG40, and RBCSF1 was measured on d 1, 3, and 5 using RNA sequencing and RT-qPCR, and the log fold change between control and infected samples was computed. Each point represents the log fold change for a given gene on a certain d in a specific tissue. The gene expression values measured using RNA sequencing and RT-qPCR are plotted as log2 fold change. Values are shown for the (a) root and (b) shoot tissues separately. Error bars represent the SEM for two and three biological replicates for RNA sequencing and RT-qPCR, respectively. Dotted lines correspond to the 0 intersects to aid visualization.
We next investigated whether the differentially expressed B. napus genes in response to P. aeruginosa are enriched for certain GO biological processes. The significantly enriched categories are shown in Figures 5 and 6. In root tissue on d 1 and 3, the top enriched GO categories based on up-regulated genes include processes involved in fruit ripening, negative regulation of leaf senescence, response to oxygen level changes, and production of defense compounds (Figure 5a and b). In contrast, the major significantly down-regulated genes on d 1 were involved in photosynthesis (Figure 5d). No GO categories were significantly down-regulated on d 3. In root tissue on d 5, genes involved in the aromatic and toxic compounds metabolism and SA metabolic process were significantly up-regulated (Figure 5c), whereas, genes involved in fluid transport, various metabolic/catabolic processes, and cell wall biogenesis were significantly down-regulated (Figure 5e).
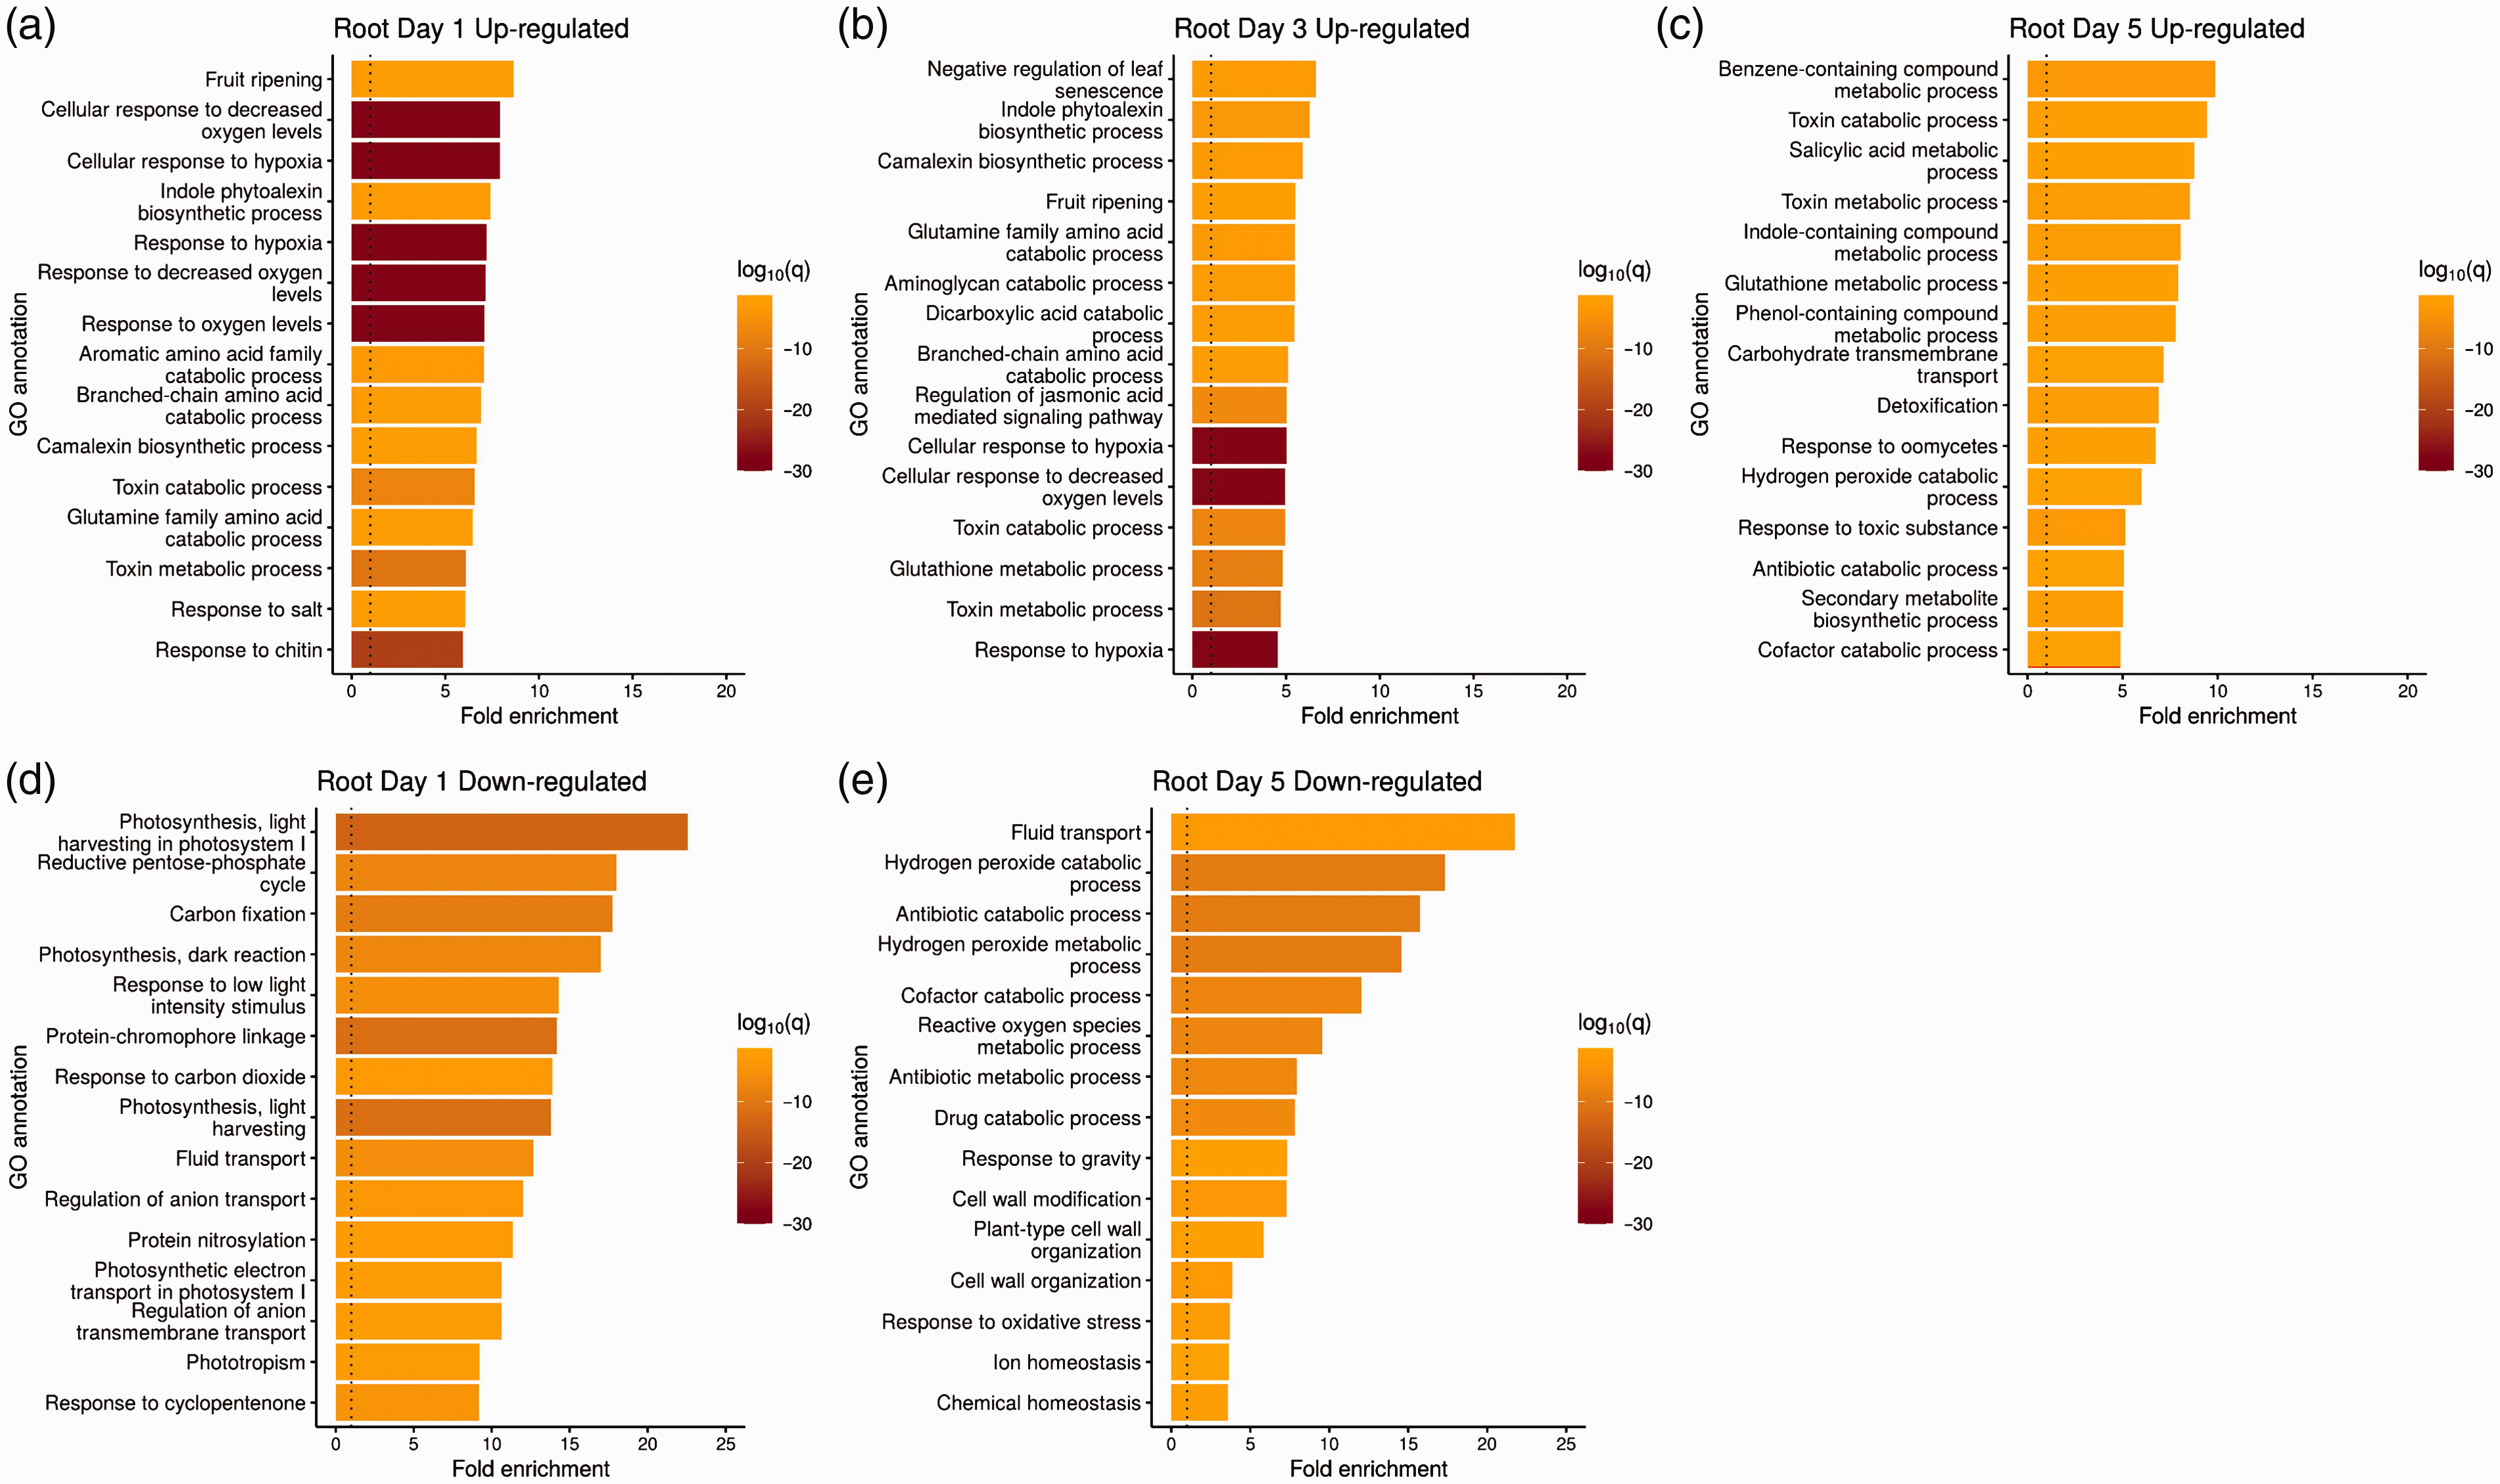
GO analysis of significantly enriched biological processes in B. napus roots during the 5 d infection with P. aeruginosa PA14. Biological processes up-regulated in root tissue on d (a) 1, (b) 3, and (c) 5. Similarly, the biological processes down-regulated in root tissue is shown for d (d) 1 and (e) 5. Note that no GO categories were significantly down-regulated in the roots on d 3. The top 15 GO biological processes based on log-fold change, after removing redundant categories, are plotted. q=q-value, which in this case corresponds to the Benjamini–Hochberg corrected P value. The dotted line indicates where the ratio between uninfected and infected samples is one.
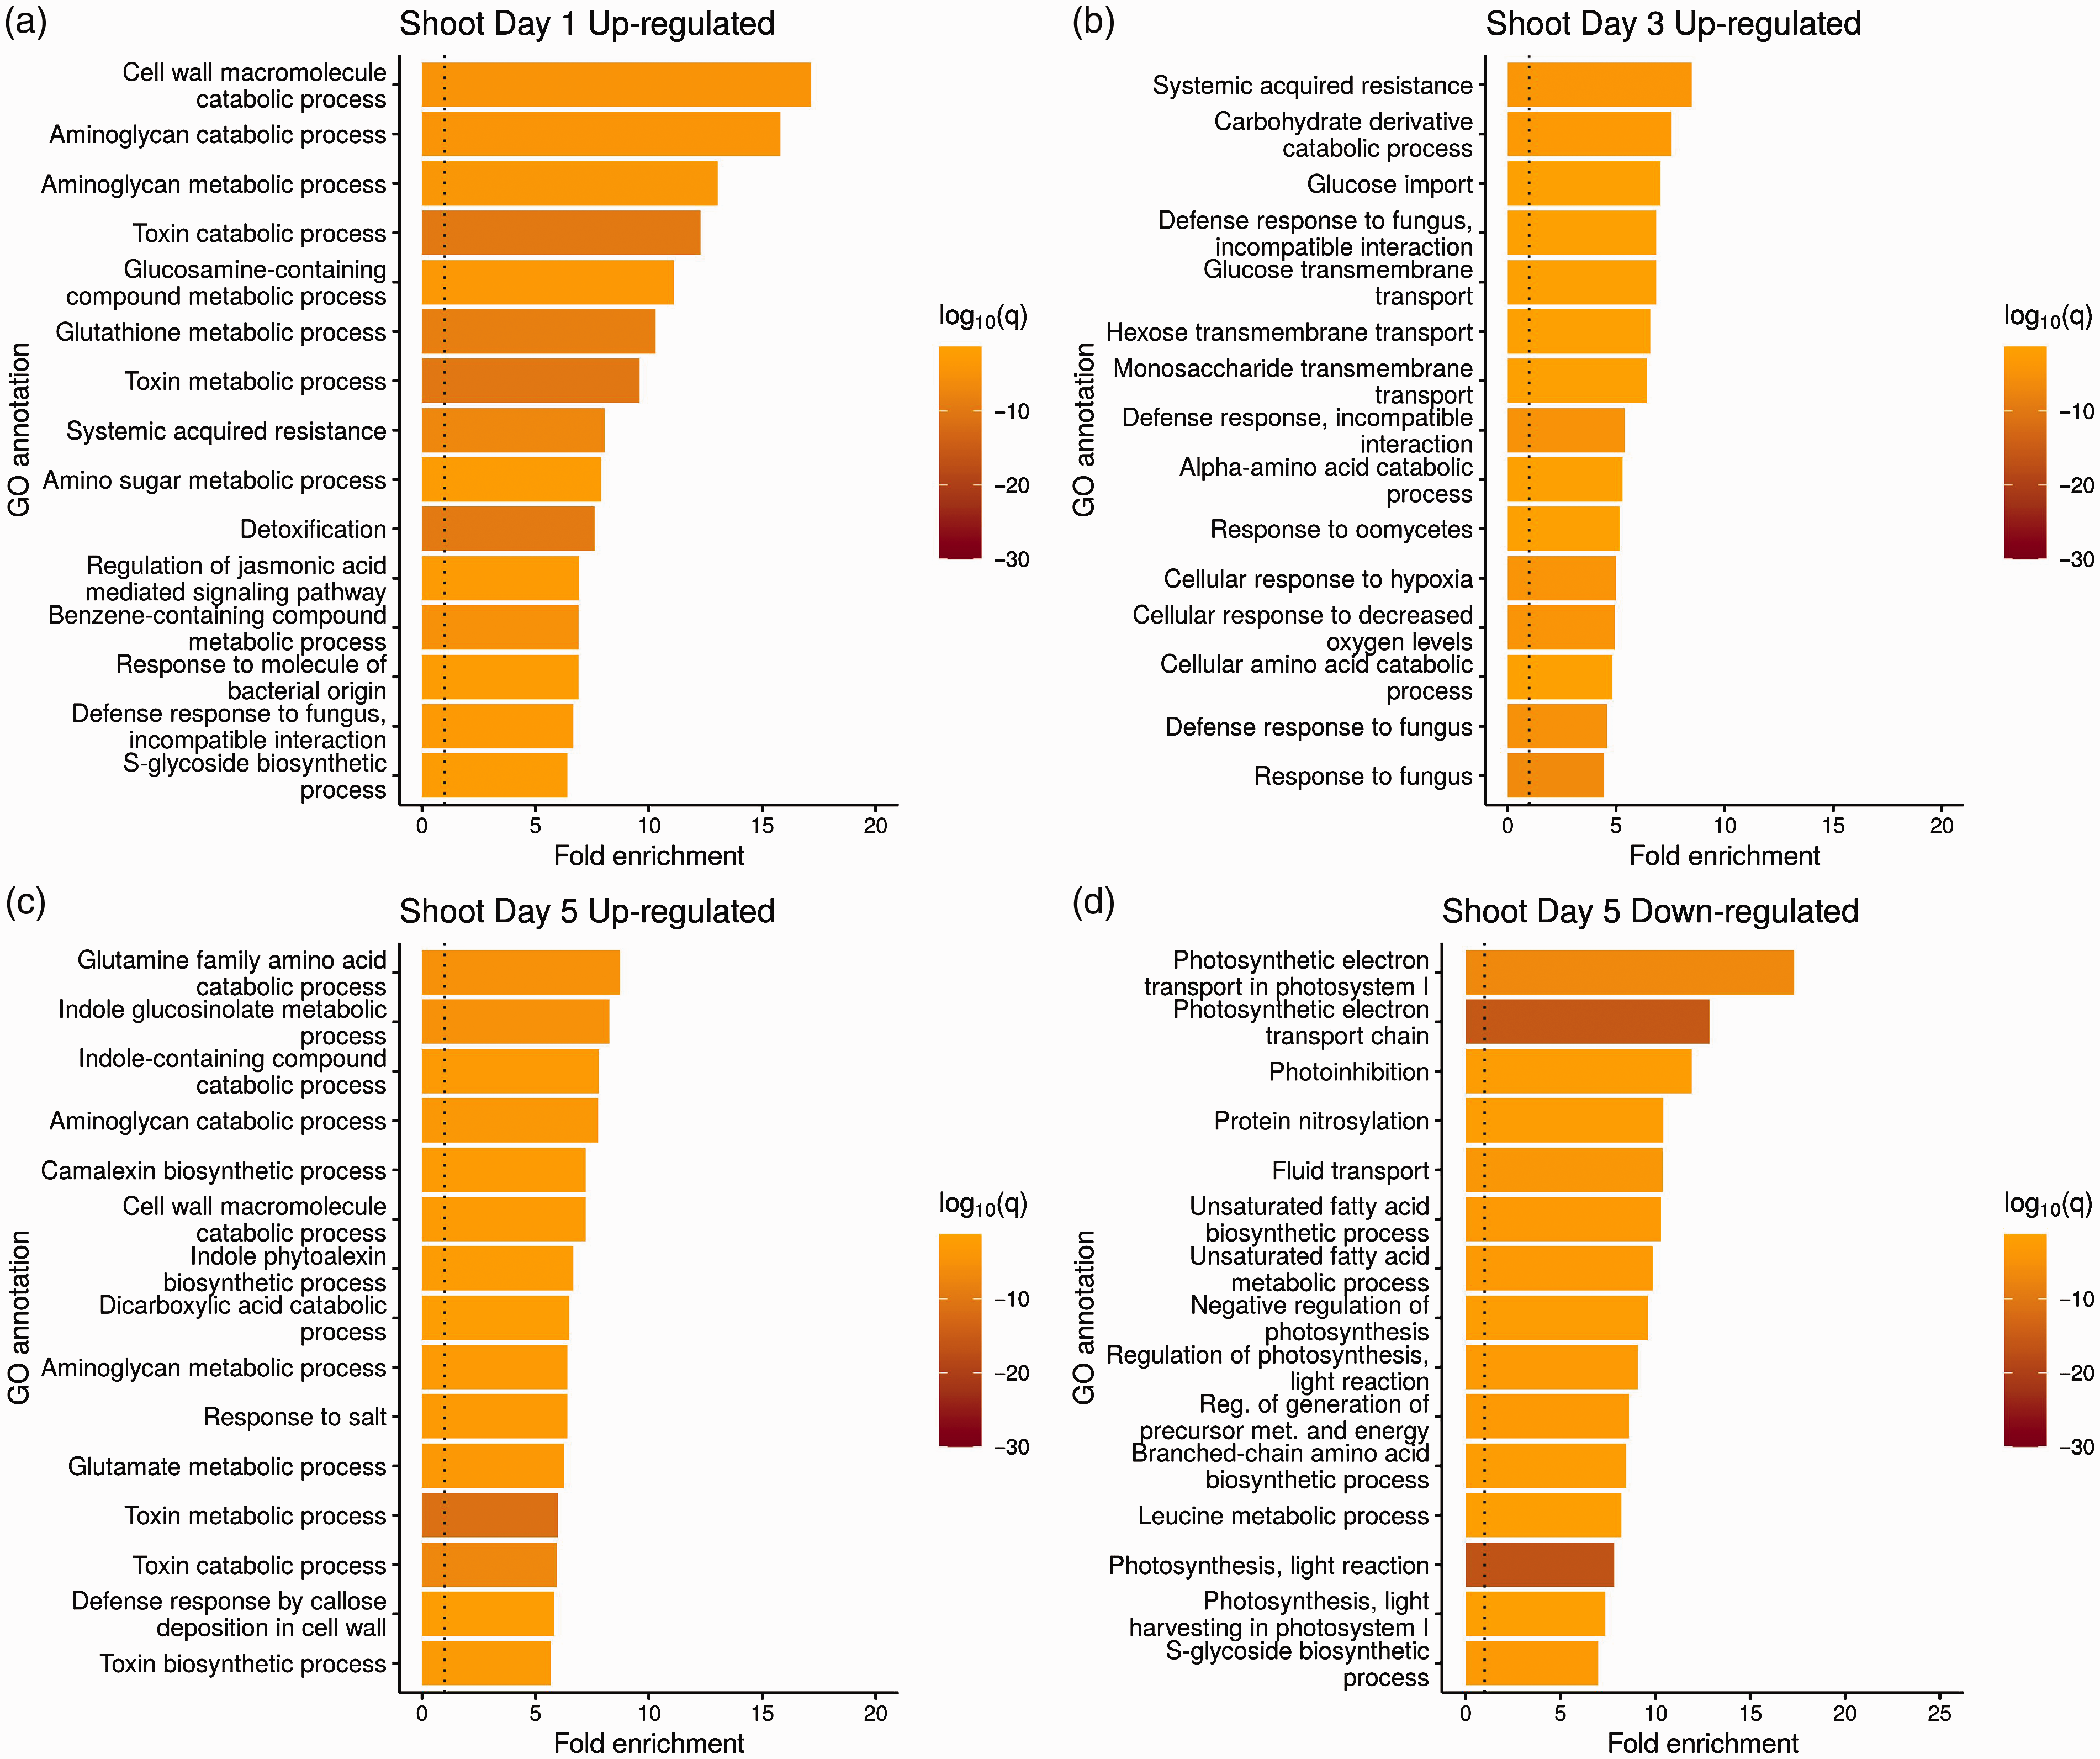
GO analysis of significantly enriched biological processes in B. shoots during the 5 d infection with P. aeruginosa PA14. Biological processes up-regulated in shoots on d (a) 1, (b) 3, and (c) 5. (d) Biological processes significantly down-regulated in the shoots on d 5. There were no other significantly down-regulated GO categories on d 1 or 3 in the shoots. The top 15 GO biological processes based on log-fold change, after removing redundant categories, are plotted. q = q value, which in this case corresponds to the Benjamini–Hochberg corrected P value. The dotted line indicates where the ratio between uninfected and infected samples is one.
In the shoot tissue, genes involved in various defense responses, such as SAR, indole glucosinolate processing, and responses to various microbes, were up-regulated across the three time points (Figure 6a–c). Although 100 and 4 genes were significantly down-regulated in the shoot tissue on d 1 and 3 respectively, there were no GO biological processes that were enriched for these categories. In shoot tissue on d 5, genes involved in various processes of photosynthesis were significantly down-regulated (Figure 6d).
SA, JA, and ET are the three major phytohormones that orchestrate the complex plant innate immunity to pathogens. 17 , 45 Little is known about the plant hormone-mediated responses to P. aeruginosa infection. Many top up-regulated categories contain genes that also belong to hormone responsive genes, such as SAR, indole-phytoalexin biosynthesis, defense response to fungus, and response to molecule of bacterial origin (Figures 5 and 6). When we searched further down the enriched category list, we found that P. aeruginosa PA14 (a hemi-biotrophic pathogen) infection of canola seedlings was associated with higher expression of genes involved in response to SA, JA, and ET in both root and shoot tissues over all three time points (Figure 7). In particular, SA responsive genes were universally up-regulated under all tested conditions, suggesting an important role of SA in mediating plant innate immunity to P. aeruginosa.
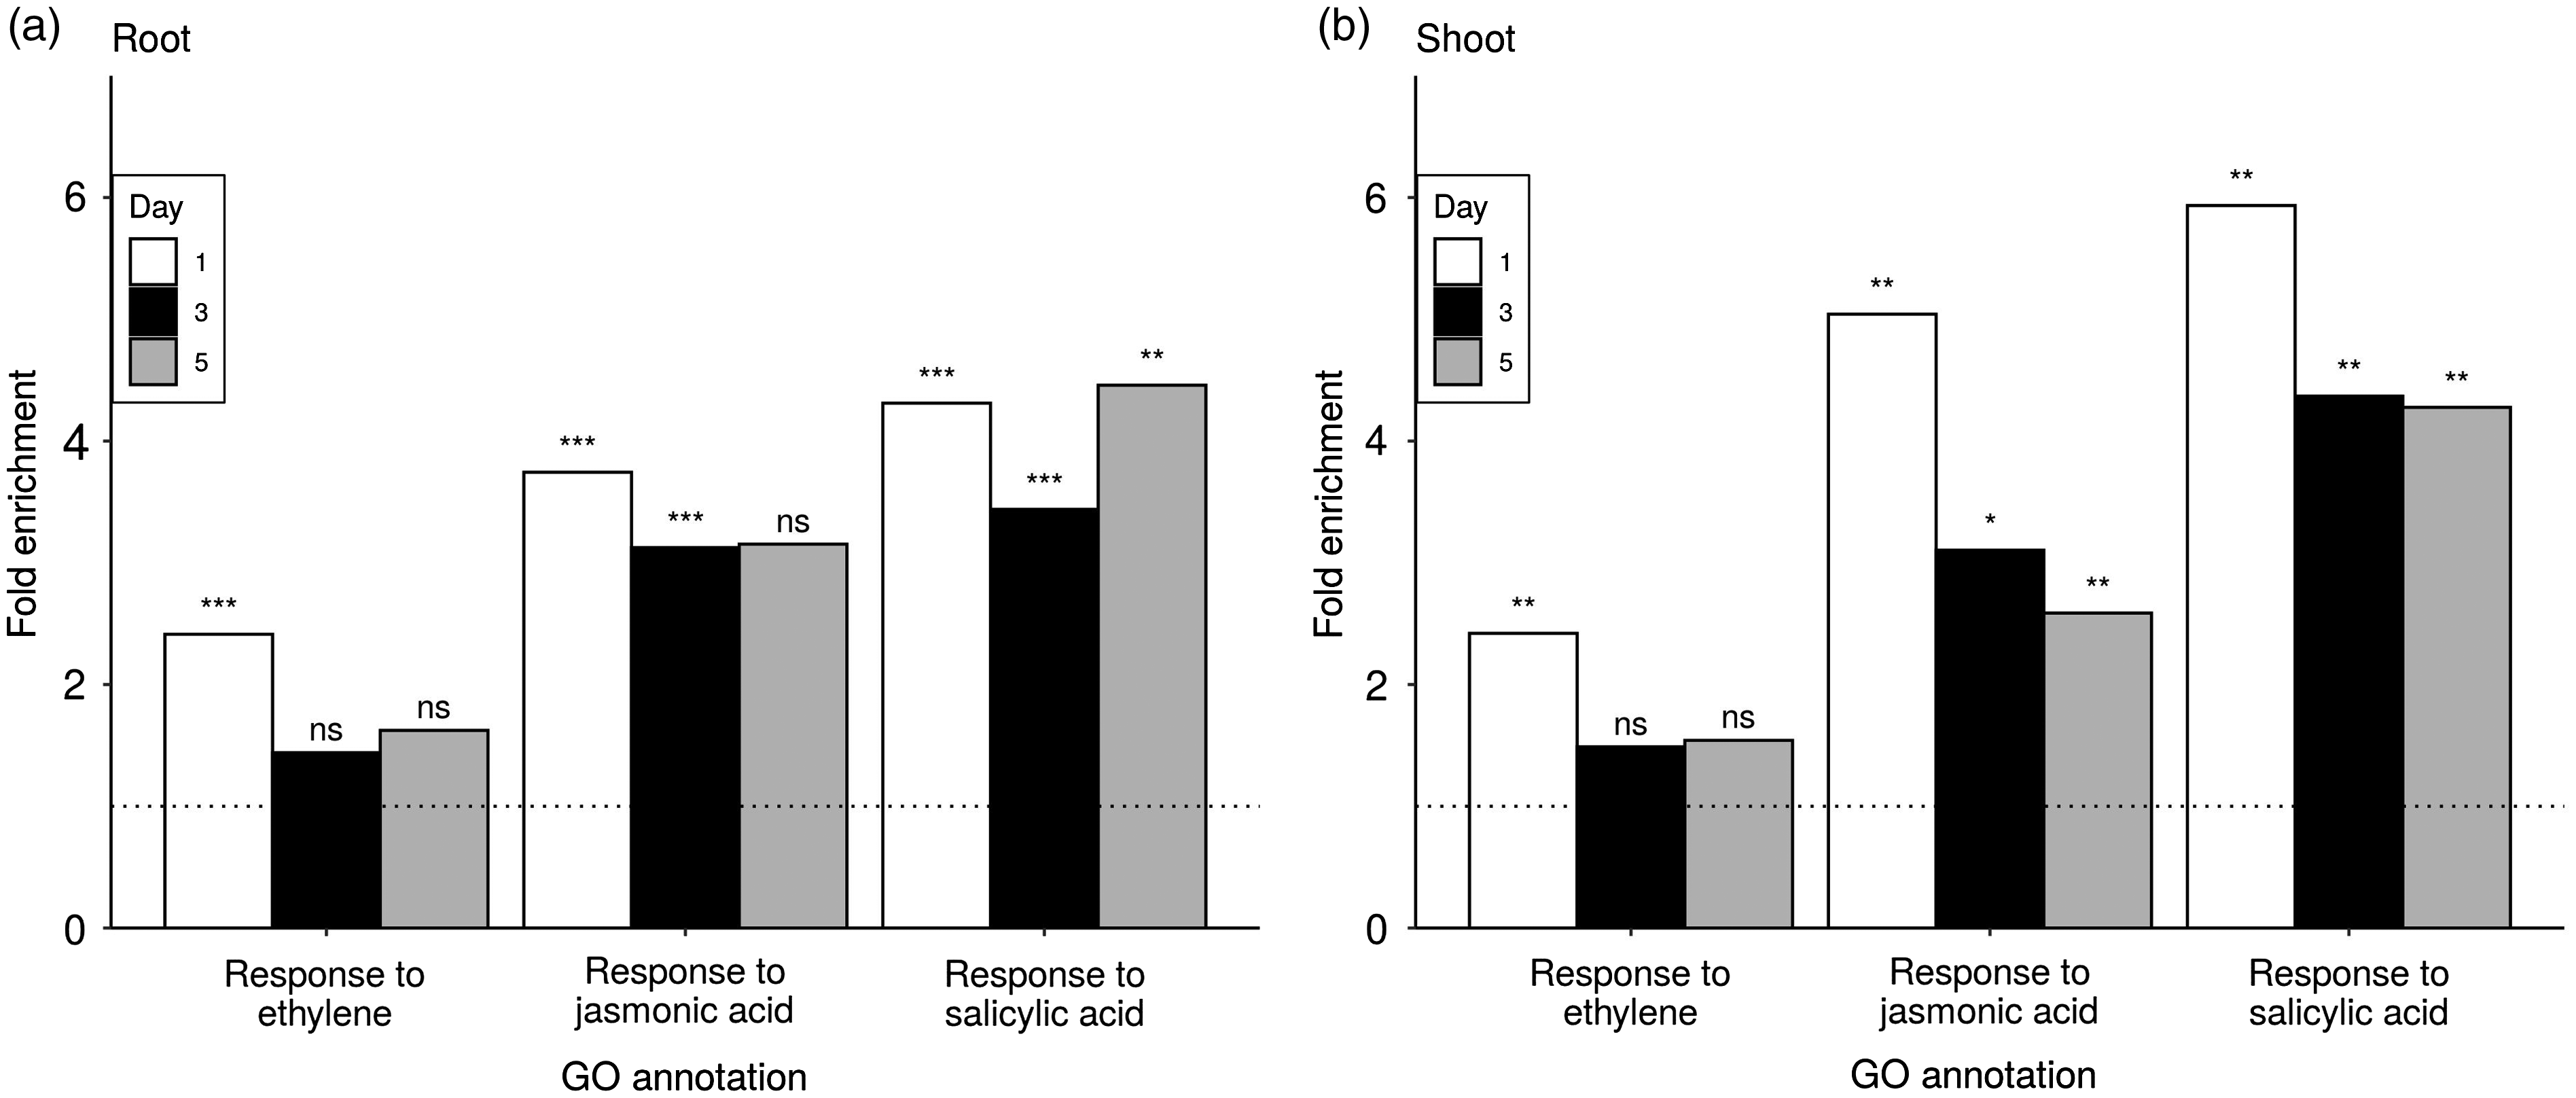
Fold enrichment of GO categories for responses to key phytohormones in infected compared to uninfected samples. Fold enrichment is shown by d and separately for (a) root and (b) shoot samples. The dotted line indicates where the ratio between uninfected and infected samples is one. Significance is indicated above each bar based on the corresponding corrected P value threshold: ***0.0001, **0.01, and *0.1. Nonsignificant instances are indicated by ns. The GO category IDs plotted are GO:0009723, GO:0009753, and GO:0009751.
Although the analyses above based on GO categories are insightful, we also performed a more specific analysis by investigating whether certain genes involved in plant innate immunity showed differential expression following infection. We did this by focusing on a set of 25 genes that are key transcription factors (TFs) regulating innate immunity in A. thaliana 46 with matching homologs in B. napus. These genes are members of several families: the ethylene-response element binding factor ERF family (ERF1-1, ERF6, ERF094, ERF104); the basic-helix-loop-helix MYC family (MYC2, MYC3, MYC4); the basic domain leucine zipper family (TGA1-TGA7); the MYB family (MYB30, MYB44, MYB108); the NAC family (NAC019, NAC055); and the WRKY family (WRKY22, WRKY29, WRKY30, WRKY33, WRKY53, WRKY70). A total of 22/25 genes were significantly differentially expressed between control and infected samples for at least one tissue and time point (adjusted P value < 0.1). Twelve genes displayed large differences between infected and control plants (a log2-fold difference of at least 1.5). In the roots, several of these genes are differentially expressed on d 1 and 3 and almost not at all on d 5 (Figure 8a). The clearest such examples are MYB108, MYC4, NAC055, and several WRKY genes. In contrast, the genes are most strongly differentially expressed on d 5 in the shoots overall (Figure 8b).
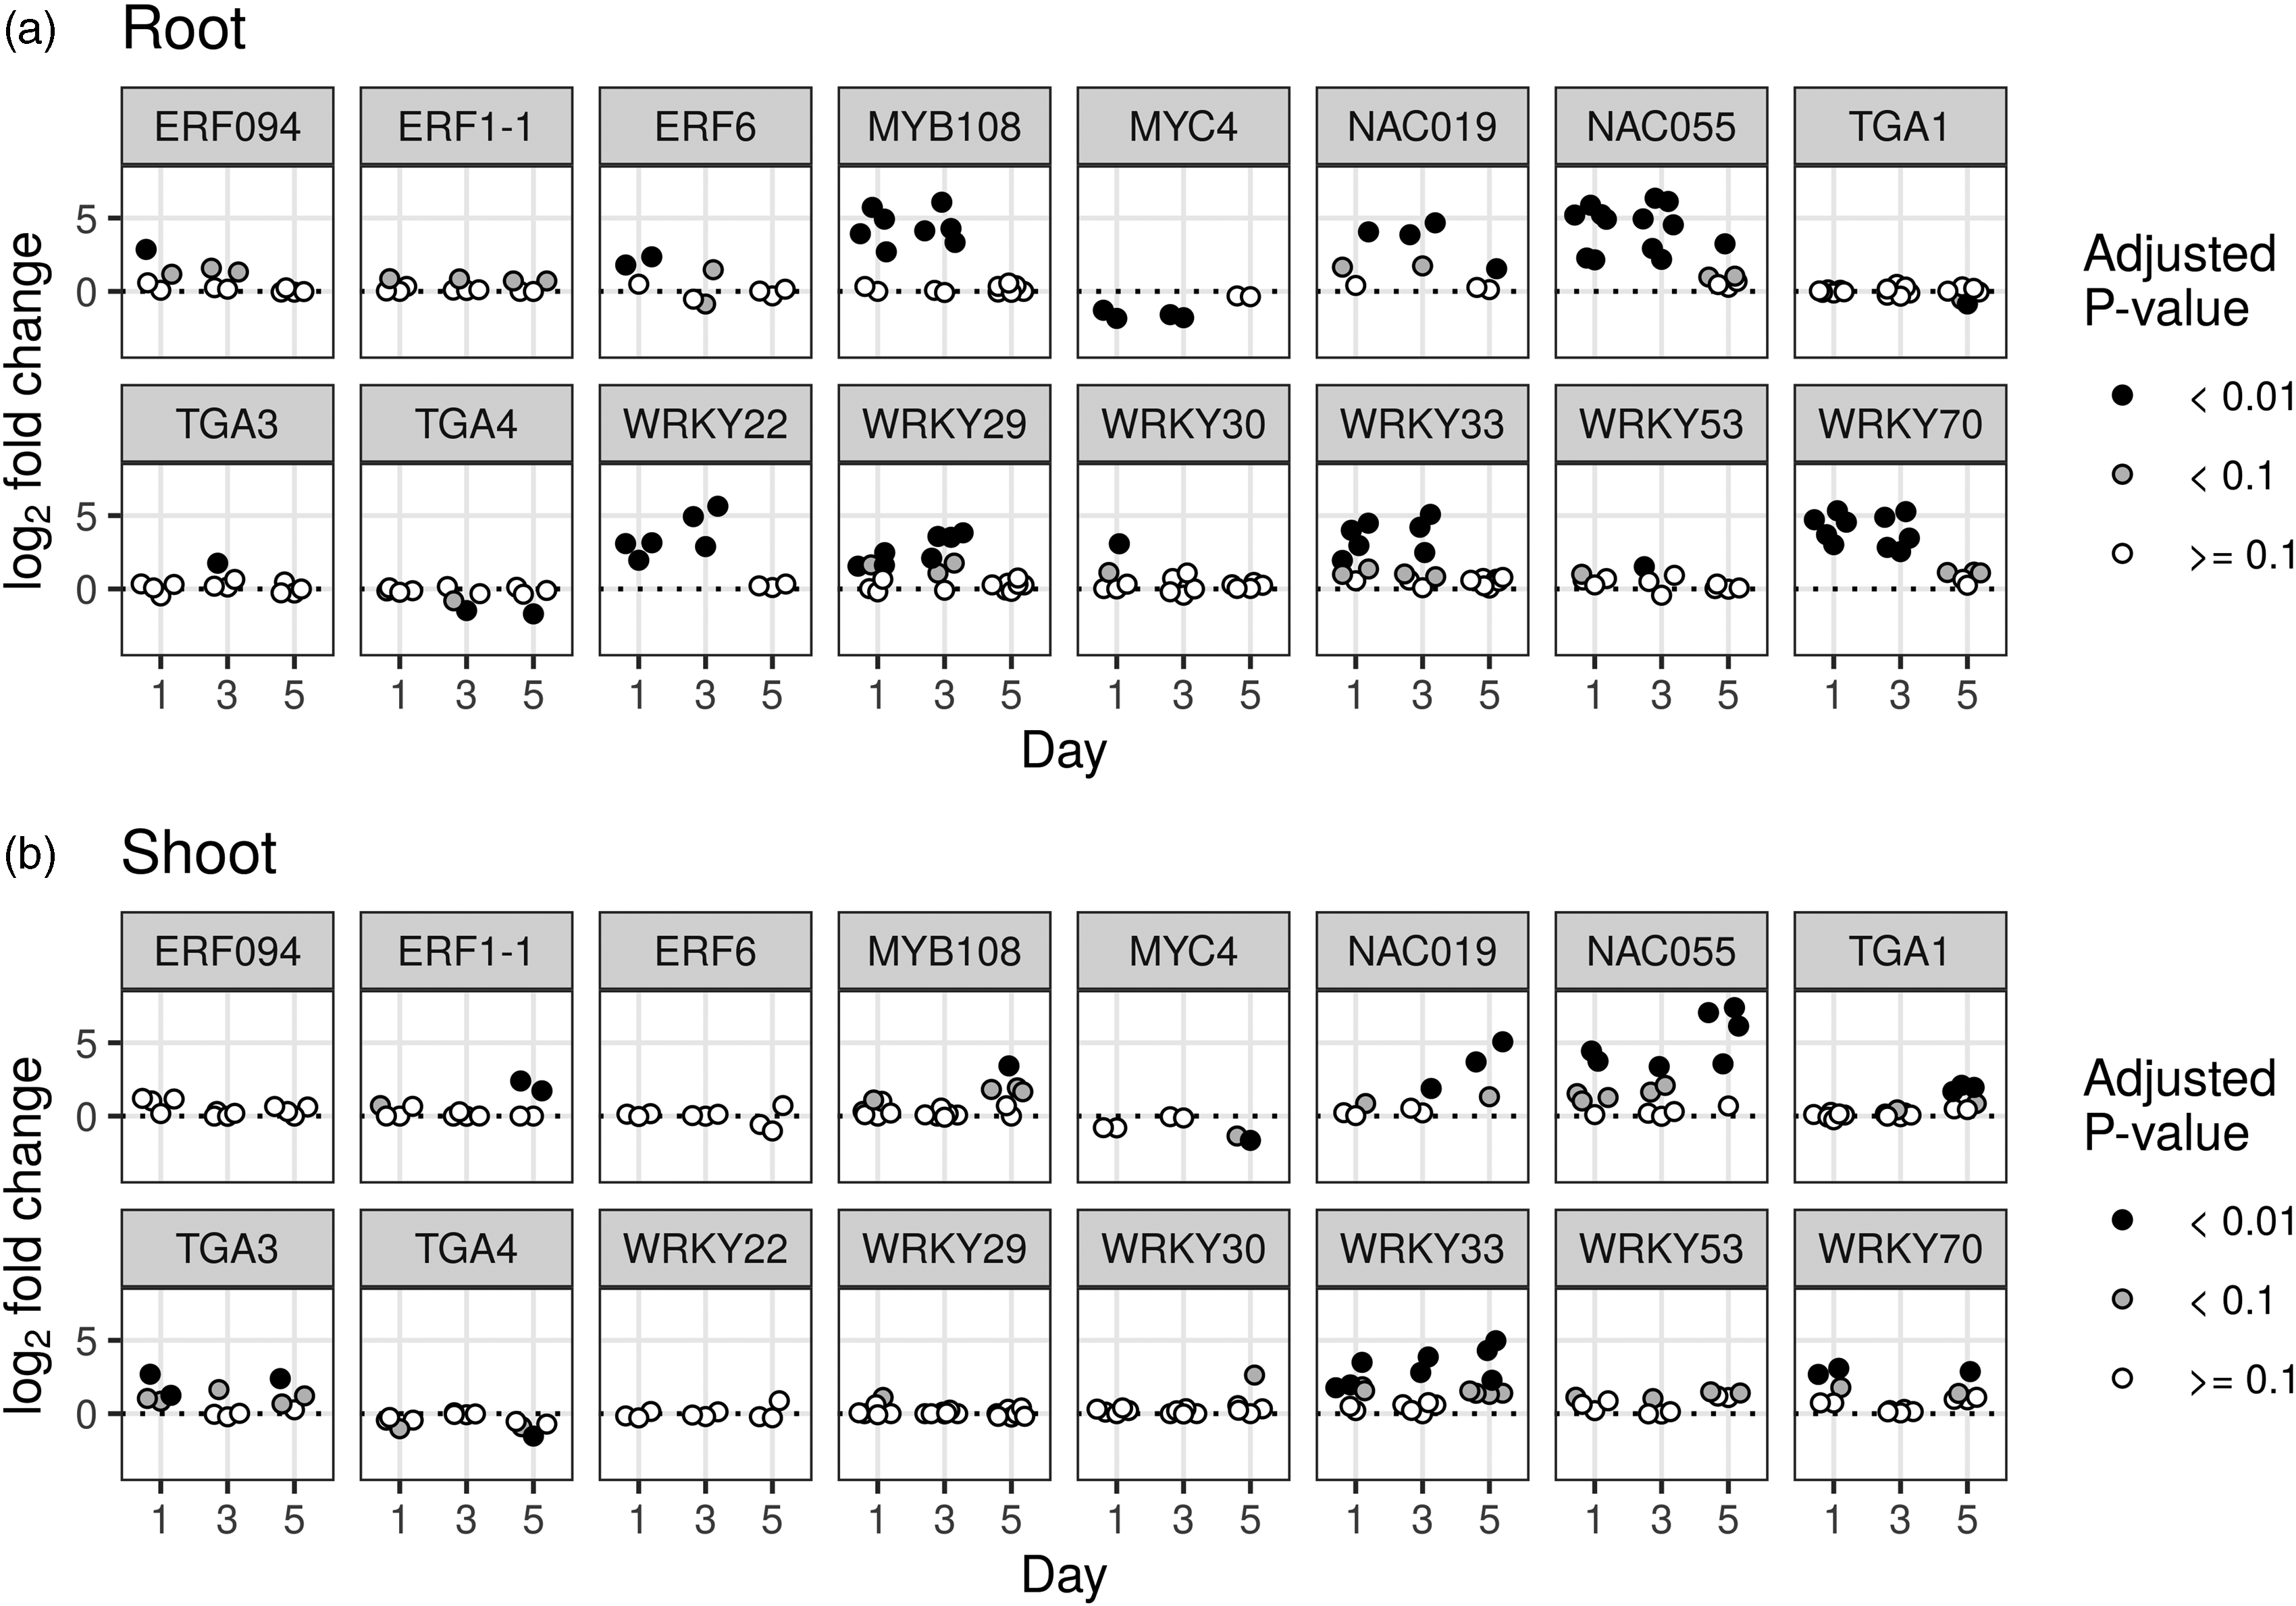
Differential expression of master immunity regulators depending on infection status and tissue. The log2-fold change (infected/control) of master immunity regulator transcription factors in B. napus in (a) root and (b) shoot tissue. Only genes that differ at least once by an absolute log2-fold change of 1.5 are displayed. Each point corresponds to the expression of a different B. napus gene, which had the corresponding A. thaliana immunity regulator gene as its top BLAST hit. The dotted line indicates a log2-fold difference of 0.
Discussion
Roots are essential plant organs, as they allow for the uptake of water and nutrients, anchor plants into the ground, and provide the plant with a large surface area that can interact with microorganisms in the soil. Roots encounter both beneficial as well as pathogenic interactions with surrounding microorganisms, which can increase the uptake of nutrients and stimulate the immune system. 47 , 48 P. aeruginosa is a broad host opportunistic pathogen that is found ubiquitously within the environment. P. aeruginosa strains have been shown to be pathogenic toward plant hosts, 1 , 2 , 8 and it has been suggested that the rhizosphere of agricultural plants act as a reservoir for this bacterium. 49 Previous studies on the interactions between P. aeruginosa and host plants have largely focused on bacterial virulence factors. 1 , 2 , 8 In this study, canola seedling transcriptomic responses toward root colonization by P. aeruginosa PA14 were investigated, and it was shown that three main defense phytohormone (SA, JA, and ET) responses were up-regulated throughout the infection.
Similar to Walker et al., 8 the present study implicates the use of a damaged root infection model. The main difference between the infection model used herein and the one used by Walker et al. 8 is that they cut plant root tips, whereas here roots were damaged using a pipette tip. Infecting canola seedlings with P. aeruginosa PA14 caused significant mass loss on d 1, 3, and 5 in root tissue and on d 3 and 5 in shoot tissue (Figure 1a and b). Similarly, X. campestris pv. vesicatoria root infection of tomato plants caused significant mass loss in seedlings compared to noninfected control. 50 Interestingly, P. aeruginosa PA14 root CFU steadily decreased throughout the 5 d infection (Figure 1c), which suggests that canola seedlings are eliciting an immune response and are reducing the number of bacterial cells. A significant increase in the number of black spots on infected canola seedlings between d 3 and 5 was also observed (Figure 1d).
Next, canola seedlings’ response to P. aeruginosa was examined by performing tissue-specific transcriptomic analysis of plants on d 1, 3, and 5 post infection. To our knowledge, this is the first time a tissue-specific transcriptomic response has been characterized for a P. aeruginosa infection in plants. We identified 7381 genes as differentially expressed between control and infected samples using RNA sequencing analysis (Figure 2), and there is a high degree of congruence between the RNA-Seq and RT-qPCR data (Figure 4). We also observed major differences in the number of differentially expressed genes by d and tissue: the number of differentially expressed genes was higher earlier on in the infection for the root tissue but higher in the shoot tissue on d 5 (Figure 3). This result is not surprising because the roots are the primary site of infection with the infection model that was employed.
We analyzed the RNA sequencing data to look at biological processes in canola seedlings that were significantly up- or down-regulated throughout the 5 d infection with P. aeruginosa. Overall, genes involved in stress, stimulus, and defense responses were up-regulated across the three time points in both root and shoot tissues (see Supplemental File 1 for all significant GO terms). Specific up-regulated biological processes across all three time points and tissues overall were defense responses, secondary metabolites biosynthesis, and response to oxygen-containing compounds (Figures 5 and 6, and Supplemental File S1). On the other hand, it is been well known that plants down-regulate genes involved in growth, such as photosynthesis in response to biotic stimuli (e.g. bacteria, fungi, and viruses).51–53 This is consistent with our observation that down-regulation of photosynthesis genes was the major significant enriched biological processes among all P. aeruginosa–suppressed genes. Altogether, our transcriptomic data showed the overall trend that canola seedlings recognize P. aeruginosa as an invading pathogen and are allocating resources from growth and development toward a defense response to fight the invading pathogen.
GO terms related to responses to oxygen-containing compounds and defense response in general were up-regulated in both root and shoot tissues. An early defense response in plants is the production of ROS and the production of NO. Both the production of ROS and NO are early signaling events involved in the production of phytohormones, 54 and ROS and NO species are both antimicrobial compounds. 55 , 56 Our data showed that genes involved in plant responses to oxygen-containing compounds were induced in the roots first on d 1 after P. aeruginosa infection and lasted to d 3. There was a lag in this response in shoots, which only appeared on d 3. This observation is consistent with the model that the production of free oxygen radicals in the roots may transmit a defense signal to distant plant tissues. 57 , 58 Another response involving long-distance information transfer during an active infection was the induced SAR genes in shoots on d 1 and 3 (Figure 6a and b). SAR is a whole plant defense response following detection of a pathogen and is regulated by the phytohormone SA. 59 The induction of SAR-related genes matched the induction of SA responsive genes in both shoots and roots (Figure 7).
The differential gene expression profile on d 5 in root tissue was distinct from d 1 and 3. The genes involved in detoxification were significantly up-regulated (Figure 5c). In contrast, fluid transport, hydrogen peroxide catabolic processes, and cell wall organization and biogenesis were down-regulated (Figure 5e). It is interesting that the maintenance and remodeling of the plant cell wall is highly down-regulated, given the cell wall’s importance in plant defense. 60 The cell wall is the barrier between pathogens and plant cells, and plants embed defense compounds within their cell wall. ROS production has also been implicated with cell wall protein cross-linking, 61 phytoalexin production,62–65 and callose deposition. 64 , 65 It is possible that plants down-regulated cell wall maintenance due to robust ROS production as a defense mechanism, 66 which can also form a feedback loop to regulate cell wall maintenance and remodeling negatively. 56 This down-regulated response in cell wall maintenance and remodeling appears to be specific to the primary site of infection (i.e. root tissue), since in shoot tissue on d 5, genes involved in responses to photosynthesis and growth were significantly down-regulated (Figure 6d). Overall, these data clearly illustrate that there are tissue-specific transcriptomic responses during pathogen infection, and that plants respond differently at various time points after infection.
All three defense phytohormone (SA, JA, and ET) signaling pathways were up-regulated in root and shoot tissue across the majority of time points (Figure 7). The induction of all three defense phytohormone pathways is intriguing because typically biotrophic and hemi-biotrophic plant pathogens only elicit the activation of a SA-mediated defense response, 17 , 45 whereas necrotrophic pathogens generally elicit a JA/ET-mediated defense response. 45 Moreover, the SA and ET/JA responses are thought to be antagonistic to each other: SA is known to inhibit JA signaling, and ET/JA can inhibit SA signaling.67–69 The highly adaptive hemi-biotrophic phytopathogen P. syringae promotes pathogenesis by producing coronatine (JA mimics) to suppress SA-mediated resistance to biotrophs and hemi-biotrophs. 70 However, other evidence supports a model in which cross-talk between JA/ET and SA signaling can also act in a synergistic manner to fine-tune defense responses that are activated by multiple pathogens and/or pests. 71 , 72 In a few reports, the up-regulation of all three phytohormone signaling pathways has been shown to be involved in induced systemic resistance,73–75 a response generated by beneficial bacteria to protect plants from pathogens and pests. It was also previously shown that microbe-associated molecular patterns can also elicit the expression of genes within SA, JA, and ET signaling pathways. However, this response was short (lasted for around 12 h). 76 Therefore, we hypothesize that the simultaneous up-regulation of SA and JA/ET signaling pathways is likely a means of fine-tuning plant defense response toward an opportunistic pathogen such as P. aeruginosa, unlike the hormone responses manipulated by highly adaptive phytopathogens such as P. syringae species.
TFs play a major role in regulating plant innate immune signaling network. 46 We also tested for similar tissue-specific changes in the expression of 25 genes known as key regulatory TFs of plant immunity. In several cases, we detected early differential expression of these regulators in roots followed by subsequent differential expression in shoots. This pattern could reflect differences in the timing of the immune response to infection related to the localization of the infection. In other words, because the roots were the site of infection, it is expected that this tissue type would first experience a major immune response, whereas the infection would be expected to take longer to impact the shoot. Out of these 25 genes, MYB108, NAC019, NAC055, WRKY22, WRKY29, WRKY33, and WRKY70 showed the highest induction (Figure 8). NAC019 and NAC055 have been shown to be involved in JA–SA crosstalk. They are activated by MYC2 that is released upon perception of JA by COI1 complexes. 77 These two NAC TFs then bind directly to the promoters and activate the expression of genes that regulate SA levels. 78 The four highly induced WRKY TFs are all regulated by the MAPKs MPK3/MPK6 during the process of plant defense of microbial pathogens, either through indirect transcriptional induction (WRKY22, WRKY29, and WRKY70) 79 , 80 or as a direct substrate for phosphorylation (WRKY33). 81 In addition, both WRKY33 82 and WRKY70 83 have been shown to regulate JA/SA responses. The increased expression of these immune regulatory TFs, together with the induction of the hormone-mediated responses, forms an integrative immune signaling response to P. aeruginosa infections.
To conclude, we have demonstrated that P. aeruginosa PA14 triggers a unique transcriptomic response in canola, with all three main defense-related phytohormone signaling pathways being activated in canola seedlings throughout the infection course, reflecting its opportunistic rather than highly specialized nature as a phytopathogen.
Supplemental Material
sj-pdf-1-ini-10.1177_1753425920980512 - Supplemental material for Transcriptomic profiling of Brassica napus responses to Pseudomonas aeruginosa
Supplemental material, sj-pdf-1-ini-10.1177_1753425920980512 for Transcriptomic profiling of Brassica napus responses to Pseudomonas aeruginosa by Jamie Cook, Gavin M Douglas, Janie Zhang, Bernard R Glick, Morgan G, I Langille, Kun-Hsiang Liu and Zhenyu Cheng in Innate Immunity
Supplemental Material
sj-xlsx-2-ini-10.1177_1753425920980512 - Supplemental material for Transcriptomic profiling of Brassica napus responses to Pseudomonas aeruginosa
Supplemental material, sj-xlsx-2-ini-10.1177_1753425920980512 for Transcriptomic profiling of Brassica napus responses to Pseudomonas aeruginosa by Jamie Cook, Gavin M Douglas, Janie Zhang, Bernard R Glick, Morgan G, I Langille, Kun-Hsiang Liu and Zhenyu Cheng in Innate Immunity
Footnotes
Acknowledgements
We are grateful to Renee Raudonis for her critical review of the manuscript.
Declaration of conflicting interests
The author(s) declared no potential conflicts of interest with respect to the research, authorship, and/or publication of this article.
Funding
The author(s) disclosed receipt of the following financial support for the research, authorship, and/or publication of this article: This work was supported by a Discovery Grant (RGPIN 04912) from the Natural Sciences and Engineering Research Council of Canada to Z.C.
Supplemental material
Supplemental material for this article is available online.
References
Supplementary Material
Please find the following supplemental material available below.
For Open Access articles published under a Creative Commons License, all supplemental material carries the same license as the article it is associated with.
For non-Open Access articles published, all supplemental material carries a non-exclusive license, and permission requests for re-use of supplemental material or any part of supplemental material shall be sent directly to the copyright owner as specified in the copyright notice associated with the article.