
Abstract
Despite sepsis being a life-threatening disease, targeted drugs that improve the therapy of affected patients are still lacking. Infants and adults differ in the maturity level of their immune system and this results in distinct reactions to Gram-negative bacteria. To study reactions of human immune cells in vivo, we used NOD scid gamma mice transplanted with human CD34+ stem cells to engraft a functional human immune system. Human cells undergo differentiation and maturation in these mice after transplantation and, accordingly, animals were divided into two groups: 8–13 wk and 15–22 wk after transplantation. Endotoxemia was induced by injecting LPS. Six h later, mice were euthanized. In both groups, LPS stimulation induced a decrease of CD14+ monocytes in peripheral blood, an up-regulation of activation markers on different cell subsets such as myeloid dendritic cells, and a release of the human cytokines TNF-α, IL-6 and IL-10. However, significant differences were detected with regard to the amounts of released cytokines, and 8–13-wk-old mice produced more IL-6, while PTX3 was mainly released by 15–22-wk-old animals. Thus, here we provide a potential model for preclinical research of sepsis in infants and adults.
Introduction
Sepsis is one of the leading causes of death in industrialized countries. In contrast to the systemic inflammatory response syndrome (SIRS), it is characterized by the presence of an infection additional to systemic inflammation. Severe sepsis is defined as sepsis with evidence of acute organ system dysfunction, whereas septic shock is associated with systemic arterial hypotension. 1 To date, these conditions are insufficiently manageable. Thirty to 80% of patients die, even if intensive medical care is provided. 2 Sepsis is a severe medical condition because of the lack of reliable early prognostic markers and owing to the absence of causal drug therapies besides antibiotics, which are unable to relieve the accompanying symptoms. There is an urgent need for the identification of markers that allow for the verification of diagnosis at an early point in time, because survival of septic patients largely depends on an early start of therapy.
Sepsis results from an imbalanced and excessive immune response after infection with pathogens. Vasodilation and vascular leakage are beneficial local host defense mechanisms that become harmful when occurring systemically. Consequently, this inflammatory disorder provokes tissue damage and organ failure. 3
The pathogenesis of sepsis is complex. At first, innate immune cells react to foreign Ags. Pathogens enter the body, activate PRRs and, consequently, leukocytes are recruited and activated. Five families of PRR have been described so far. 4 Among them, TLRs play a pivotal role in the pathogenesis of sepsis. 5 PRRs are present in cells of the innate immune system, for example in macrophages or dendritic cells. 4 Animal models, and especially rodent models, are important tools in preclinical research to gain better insight into fundamental immunological mechanisms underlying the disease. In recent years, different animal models of sepsis have been established. 6 The endotoxemia model is based on an i.p. injection of LPS. Therefore, this model is easy to standardize regarding morbidity, as well as the intensity of inflammation, whereas these same parameters are highly variable in other models that require surgery. 6 Its simplicity and reproducibility simultaneously reflect its major drawback—the fact that complex pathophysiological processes during sepsis caused by viable pathogens might not be reflected by the model. 6 Nevertheless, the endotoxemia model is well suited for research on major immunological changes during sepsis; 7 consequently, it was chosen for the present study.
The examination of animals in septic conditions led to several findings that may contribute to understanding the basic mechanisms of the disease’s pathogenesis, which enabled us to identify potential diagnostic markers and therapeutic targets like IL-6 or TNF-α.8,9 Unfortunately, some of the results generated in rodents could not be translated into clinical context, owing to the differences in the cellular immunity of humans and experimental animals, the broad spectrum of infectious agents in patients and the heterogeneity of subject groups. 10
The development of humanized mice introduced a new chapter of animal models for immunological research. Humanized mice are commonly used for the establishment of malignancy models, 11 and models of infectious diseases like HIV and Dengue virus infection. 12
After the transplantation of human CD34+ cells from umbilical cord blood, immunodeficient mice develop a human immune system within several wk. In these mice, functional populations of human immune cell lines (e.g. B cells, T cells, monocytes and granulocytes) differentiate within wk and are able to release human cytokines like IL-1β, IL-6, IL-10, IL-4, TNF-α and IFN-γ. 13 In our previous studies, we observed that cells that mediate the adaptive immunity in the human immune system undergo a maturation process that continues even after engraftment and differentiation (unpublished data). In contrast, innate immune cell counts vary only slightly from wk 8 to wk 13 after transplantation in peripheral blood, spleen and bone marrow.
Therefore, the aim of this study was to induce and characterize sepsis in humanized mice at two different time points after transplantation of hematopoietic stem cells. Thus, we classified animals depending on the ratio of B- and T-cell counts at different ages. One group of mice was 8–13 wk old and the other group is 15–22 wk old. Using this approach, we tested the hypothesis that the cells of the innate immune system react differently dependent on the time after stem cell transplantation, irrespective of cell counts. Eight to 13-wk-old and 15–22-wk-old mice may therefore react differently to an LPS stimulus. Furthermore, plasma levels of pentraxin 3 (PTX3)—a recently discussed prognostic marker for sepsis in patients 14 —were investigated in the humanized endotoxemia model. Our findings might help to bridge the gap between animal models and patients of different ages suffering from sepsis.
Materials and methods
Ethic statements
Fresh umbilical cord blood was collected from healthy full-term pregnancies. From all women who donated fresh cord blood, written informed consent was obtained and the study was approved by the local ethics committee (ethics commission at the medical faculty of the University of Leipzig: 121-11-18042011).
Animal experiments followed German guidelines for animal experiments and were approved by the local animal protection committee (Landesdirektion Leipzig: registration number TVV 36/12).
CD34+ cell separation from umbilical cord blood
CD34+ cell separation was carried out as described previously. 15 PBMC from fresh umbilical cord blood were obtained by Ficoll-Paque (PAN Biotech GmbH, Aidenbach, Germany) density centrifugation. PBMC were washed three times with PBS containing 0.3 mM EDTA and were then frozen at a rate of 1℃/min in freezing medium containing 10% DMSO as cryoprotectant. For long-term storage, vials were transferred to liquid nitrogen.
To thaw the cells, RPMI 1640 + 10% FCS was heated to 37℃ and thawing was done as quickly as possible. After thawing, the cells were transferred into 45 ml RPMI and centrifuged (300 g, 5 min, 4℃), the supernatant was discarded and cells were washed in PBS with 2 mM MgCl2 + 10 µg/ml DNAse to digest redundant DNA and to avoid agglomeration of cells. After two additional centrifugation steps, CD34+ stem cells were isolated by positive magnetic selection using the CD34-MicroBead-Kit, MS columns and a magnetic separator (Miltenyi Biotec GmbH, Bergisch Gladbach, Germany) according to the manufacturer's instructions.
Generation of humanized mice
NOD.Cg-PrdcscidIL2rγtm1Wjl/SzJ (NOD scid gamma; NSG) mice lacking functional mature murine B cells, T cells and NK cells were obtained from Jackson Laboratory, 16 and were bred and kept under specific-pathogen-free conditions at the University of Leipzig. Newborn mice (24–48 h after birth) of both sexes were irradiated with 1 Gy using a 200 kV X-ray machine (Gulmay) with a dose rate of 1.12 Gy/min, and 3–5 h later these animals were intrahepatically transplanted with 2–4 × 10⁵ CD34+ stem cells. Blood was taken at defined time points after engraftment and analyzed by means of flow cytometric analysis. All humanization procedures were performed as described previously. 16 NSG mice were considered to be humanized and included in the study when 20% or more of all CD45+ cells in peripheral blood were of human origin. 17
Classification of mice into experimental groups
Distribution of adaptive human cells in humanized mice differed depending on time after transplantation. In earlier experiments we noticed that the B-cell/T-cell ratio changes over time. Eight to 13 wk after stem cell transplantation, mice showed more B cells than T cells within the population of human leukocytes (n = 27). We observed a B-cell/T-cell ratio > 4. Mature animals, that is, mice examined 15–22 wk after transplantation (n = 22, showed more balanced proportions of B cells vs. T cells with a B-cell/T-cell ratio < 4. Therefore, we divided the humanized mice into two groups, depending on their B-cell/T-cell ratio.
Exposure to Escherichia coli LPS
Humanized mice were treated i.p. with LPS (from E. coli; serotype 055:B5; Sigma-Aldrich, Taufkirchen, Germany). Animals were administered a dose of 5 mg/kg, which was dissolved in 200 µl sterile NaCl. Mice belonging to control groups received 200 µl NaCl i.p. Mice were sacrificed 6 h after LPS injection. In sum, this protocol included the following experimental groups: mice 8–13 wk after stem cell transplantation treated with LPS (8–13 + LPS), n = 15; animals 8–13 wk after stem cell transplantation that received NaCl (8–13 + NaCl), n = 12; mice 15–22 wk after stem cell transplantation with LPS treatment (15–22 + LPS), n = 11, and their corresponding control group animals 15–22 wk after stem cell transplantation injected with NaCl (15–22 + NaCl), n = 11.
All animals were checked hourly during the experiment. The checked parameters were mass, skin, spontaneous behavior, posture and fur. None of the animals dropped out of the study as a result of critical symptoms generated by LPS treatment. None of the animals died during, or had to be killed prior to the end of, the experimental time.
To evaluate PTX3 levels in plasma, additional groups of animals 8–13 wk after stem cell transplantation (n = 4), as well as mice 15–22 wk after stem cell transplantation (n = 7), were euthanized 24 h after LPS treatment.
Organ harvest
Six or 24 h after injection of LPS or NaCl, mice were sacrificed with carbon dioxide. Blood was taken by cardiac puncture, using a 23-gauge needle. Plasma was obtained by centrifugation of blood and was stored at –80℃. For each animal, one half of the spleen was processed for flow cytometric analysis, while the other half was stored in 4% buffered formaldehyde and processed for histologic examination. Bone marrow was flushed out of femurs using a 27-gauge needle and PBS.
Flow cytometric analysis
To analyze immune cells, flow cytometric assays were performed using blood, spleen and bone marrow cells. Therefore, single-cell suspensions were prepared. Cells were stained using the following Abs (unless otherwise stated, all obtained from BD Biosciences, Heidelberg, Germany): anti-human CD3 FITC (clone UCHT 1), anti-human CD11c PE (cloneB-ly6), anti-human CD14 APC-Cy7 (clone MphiP9), anti-human CD16 PE-Cy7 (clone NKP15), anti-human CD19-PE (clone HIB19), anti-human CD25 APC-Cy7 (clone M-A251), anti-human CD45 APC (clone HI30), anti-mouse CD45 PerCP (clone 30F11), anti-human CD56 V450 (clone B159), anti-human CD86 V450 (clone FUN-1), anti-human CD123 PerCP-Cy5.5 (clone 7G3), anti-human Linage Cocktail 1 FITC and anti-human CD34 PE (clone AC136; Miltenyi Biotec, Bergisch Gladbach, Germany). Cells were incubated with those Abs for 30 min at 4℃ in the dark. Afterwards, erythrocytes were lysed by incubation with BD lysis solution (BD Biosciences) for 10 min at room temperature. Subsequently, samples were washed twice with PBS containing 2% FCS, and were finally analyzed on a FACSCanto II using FACS Diva Software (BD Biosciences).
Histopathology
For histopathology, spleens were fixed overnight in 4% ice-cold formaldehyde. After further processing for histology, all organs were embedded in paraffin and serial 4-µm-thick sections were cut and mounted on SuperFrost Plus® slides (Menzel-Gläser, Braunschweig, Germany). Deparaffinized and rehydrated histological sections were immersed in Mayer's hemalum solution for 3 min and then rinsed in lukewarm running tap water for 10–15 min. This was followed by rinsing the sections shortly in distilled water before counter-staining in 0.2% aqueous eosin staining solution for 6 min. Subsequently, sections were dehydrated and covered with Euparal (Carl Roth, Karlsruhe, Germany).
For each group, a minimum of three hematoxylin and eosin-stained sections of at least five animals were analyzed qualitatively regarding the extent of erythrocyte infiltration and leukocyte depletion. The person analyzing the sections was blind with regard to the experimental group of the respective animal.
Measurement of human and mouse cytokines
Plasma samples of humanized mice were stored at –80℃. After defrosting, levels of human and mouse TNF-α, IL-6 and IL-10 were analyzed using Cytometric Bead Array (all from BD Biosciences: CBA Mouse TNF Flex Set, 558299; CBA Mouse IL-6 Flex Set, 558301; CBA Mouse IL-10 Flex Set, 558300; CBA Human TNF Flex Set, 558273; CBA Human IL-6 Flex Set, 558276; CBA Human IL-10 Flex Set, 558274) according to the manufacturer's instructions. The lower detection limits were: 1.2 pg/ml, human TNF-α; 2.8 pg/ml, murine TNF-α; 1.6 pg/ml, human IL-6; 1.4 pg/ml, murine IL-6; 0.13 pg/ml, human IL-10; 9.6 pg/ml, murine IL-10. If measured values were below these detection limits, they were set to zero.
Measurement of human and mouse PTX3
Human and murine PTX3 levels in plasma samples were measured by means of ELISA (Human Pentraxin 3/TSG-14 Quantikine ELISA Kit, DPTX30; Mouse Pentraxin 3/TSG-14 Quantikine ELISA Kit, MPTX30; both from R&D Systems, Wiesbaden, Germany), according to the manufacturer’s instructions. Absorbance was read at 450 nm and 570 nm with ELISA reader Tecan Sunrise (Tecan, Männedorf, Switzerland). Readings at 570 nm were subtracted from the readings at 450 nm. Data analysis was accomplished using the Magellan™ Software (version 7.1; Tecan), and reported values are based on the appropriate standard curve.
Statistical analysis
SigmaPlot 11.0 (Systat, Erkrath, Germany) and PrismGraph 5 (GraphPad Software, La Jolla, CA, USA) were used for statistical analyses. When Gaussian distribution and equal variance were given (tested by SigmaPlot), Student's t-test for comparisons of two groups or one-way ANOVA for comparisons of more than two groups were used. Otherwise, Mann–Whitney U-test or Kruskal–Wallis test were applied. P-Values ≤ 0.05 were considered statistically significant. To compare intervention groups, data were normalized to their corresponding control group.
Results
Transplantation success and assignment of mice to experimental groups
Newborn NSG mice were transplanted with human CD34+ cells from umbilical cord blood. Eight to 10 wk after transplantation, flow cytometric analysis was performed with peripheral blood to control the transplantation success (Figure S1). Human CD45+ (huCD45+) cells were detectable in the blood of these mice (Figure 1C). To assure comparability and quality of humanization, only mice presenting more than 20% huCD45+ cells of the total leukocyte population in peripheral blood were used for the following experiments. Differentiated cell counts provided evidence of an ongoing change of the human immune system in these mice: 8–13 wk after stem cell transplantation, the proportion of B cells within the huCD45+ population was significantly higher compared with mice examined 15–22 wk after transplantation. Accordingly, T-cell counts were significantly lower in younger animals than in older mice (Figure 1B, D). The amount of monocytes in peripheral blood was similar in both groups. These findings led to the concept of separating mice into two groups dependent on their B-cell/T-cell ratio and on the time after transplantation (Figure 1A). Group 8–13 + LPS was injected with LPS 8–13 wk after stem cell transplantation and group 15–22 + LPS was subjected to that same treatment 15–22 wk after transplantation.
Development of human immune cells in humanized mice. (A) Mice of different ages have been used in the experiment. The figure shows age distribution of all animals that were used in the study. Black bars represent animals 8–13 wk after transplantation (n = 31) and how many mice per age were included in the study. Gray bars show mice 15–22 wk after stem cell transplantation (n = 29). (B) Within the huCD45+ population, subpopulations differ during time course after stem cell transplantation. Retro-orbital blood samples were used and flow cytometric analysis was performed to determine human immune populations in mice before the experiment started. Each symbol represents one animal. Red lines show mean ± SEM. The number of B cells in animals 8–13 wk after stem cell transplantation (n = 31) was significantly higher than in animals 15–22 wk after stem cell transplantation (n = 29), whereas T cells could be detected in a significantly lower number in 8–13-wk-old animals than in 15–22-wk-old animals. The numbers of monocytes in both groups was similar (Mann–Whitney U-test; *** P ≤ 0.001). (C) Newborn mice were intrahepatically transplanted with huCD34+ stem cells. To monitor the transplantation success, peripheral blood was analyzed by means of flow cytometric analysis at different time points after transplantation. The left dot plot shows leukocytes of a successfully transplanted mouse at 15 wk after transplantation. Human and mouse leukocytes can be differentiated. Within all living leukocytes, 35.4% are murine and 53.8% have human origin. In the right dot plot human CD45+ cells are plotted against sideward scatter (SSC). Population (a) represents lymphocytes, whereas population (b) consists of monocytes and population (c) represents granulocytes. (D) Distribution of huCD45+ subpopulations differs during time course after transplantation. Dot plots depict representative percentages of huCD19+ and huCD3+ within the population of huCD45+.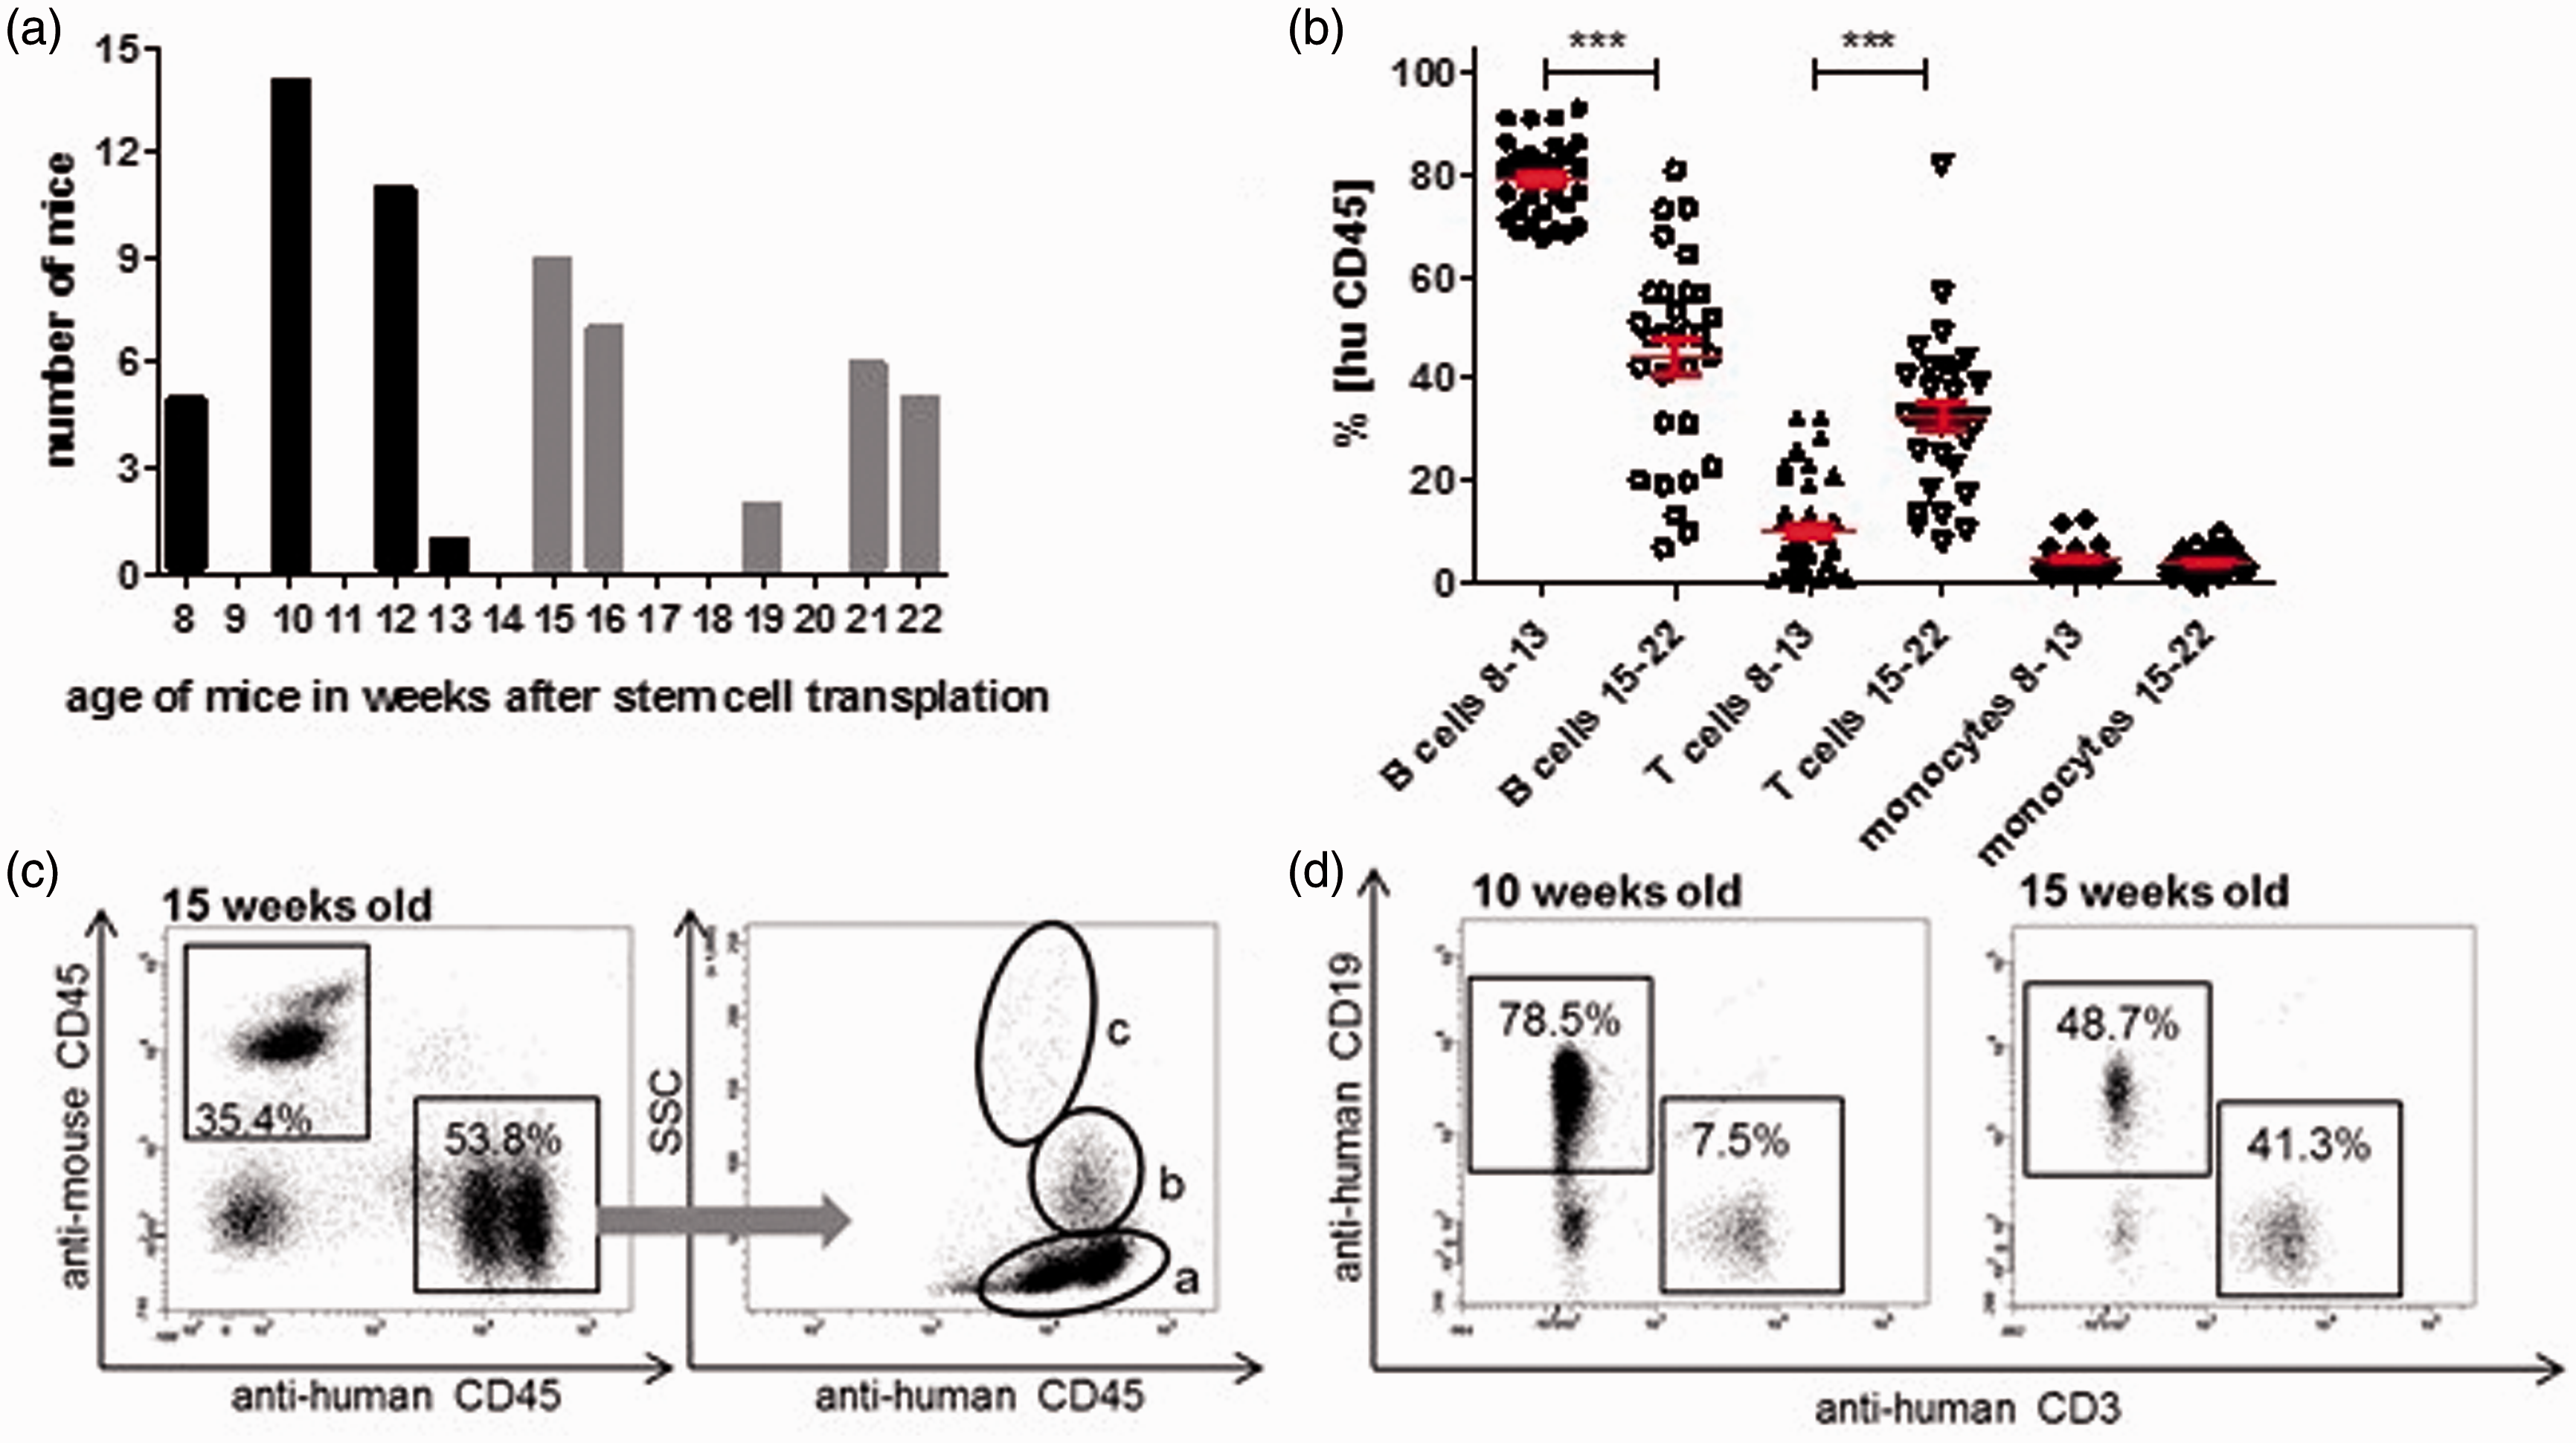
Comparison of both control groups (8–13 + NaCl and 15–22 + NaCl) revealed significantly higher huCD45+ cell counts in blood (53.4% ± 5.5%) of animals 15–22 wk after stem cell transplantation when compared with the immature control group 8–13 wk after transplantation (37.6% ± 3.7%) (Table S1). There was a similar trend with regards to the bone marrow, whereas the number of huCD45+ cells in spleens of both control groups did not differ significantly (P = 0.129). In all investigated organs (blood, spleen, bone marrow), the number of T cells was higher and the number of B cells was lower in 15–22 + NaCl-injected animals than in 8–13 + NaCl-treated mice (Figure 2). In spleens of 8–13 + NaCl mice the relative amount of myeloid DCs (mDCs), plasmacytoid DCs (pDCs) and granulocytes, all cells of innate immune system, was significantly higher than in 15–22 + NaCl mice (Table S1).
B- and T-cell distribution in blood, spleen and bone marrow in mice 8–13 wk after stem cell transplantation and 15–22 wk after stem cell transplantation. Animals 8–13 wk after transplantation (a.t.), as well as 15–22 wk a.t., were injected with NaCl and euthanized 6 h afterwards. Blood samples and organs were used to investigate leukocyte subpopulations by flow cytometry. Columns (mean + SEM) show amounts of B cells and T cells within the population of human CD45+ cells in % for 8–13 and 15–22 wk a.t. animals in (A) blood, (B) spleen and (C) bone marrow. White columns with vertical stripes represent amount of B cells in animals 8–13 wk a.t. (n = 12 in blood, n = 9 in spleen, n = 9 in bone marrow); gray columns with vertical stripes show B cells in animals 15–22 wk a.t. (n = 10 in blood, n = 11 in spleen, n = 11 in bone marrow), white columns with horizontal stripes represent the amount of T cells in animals 8–13 wk a.t. (n = 12 in blood, n = 9 in spleen, n = 9 in bone marrow) and gray columns with horizontal stripes show T cells in animals 15–22 wk a.t. (n = 10 in blood, n = 11 in spleen, n = 11 in bone marrow). Mann–Whitney Rank Sum Test was performed, significant differences are marked by asterisks, *** P ≤ 0.001, *P ≤ 0.05. n.s.: not significant.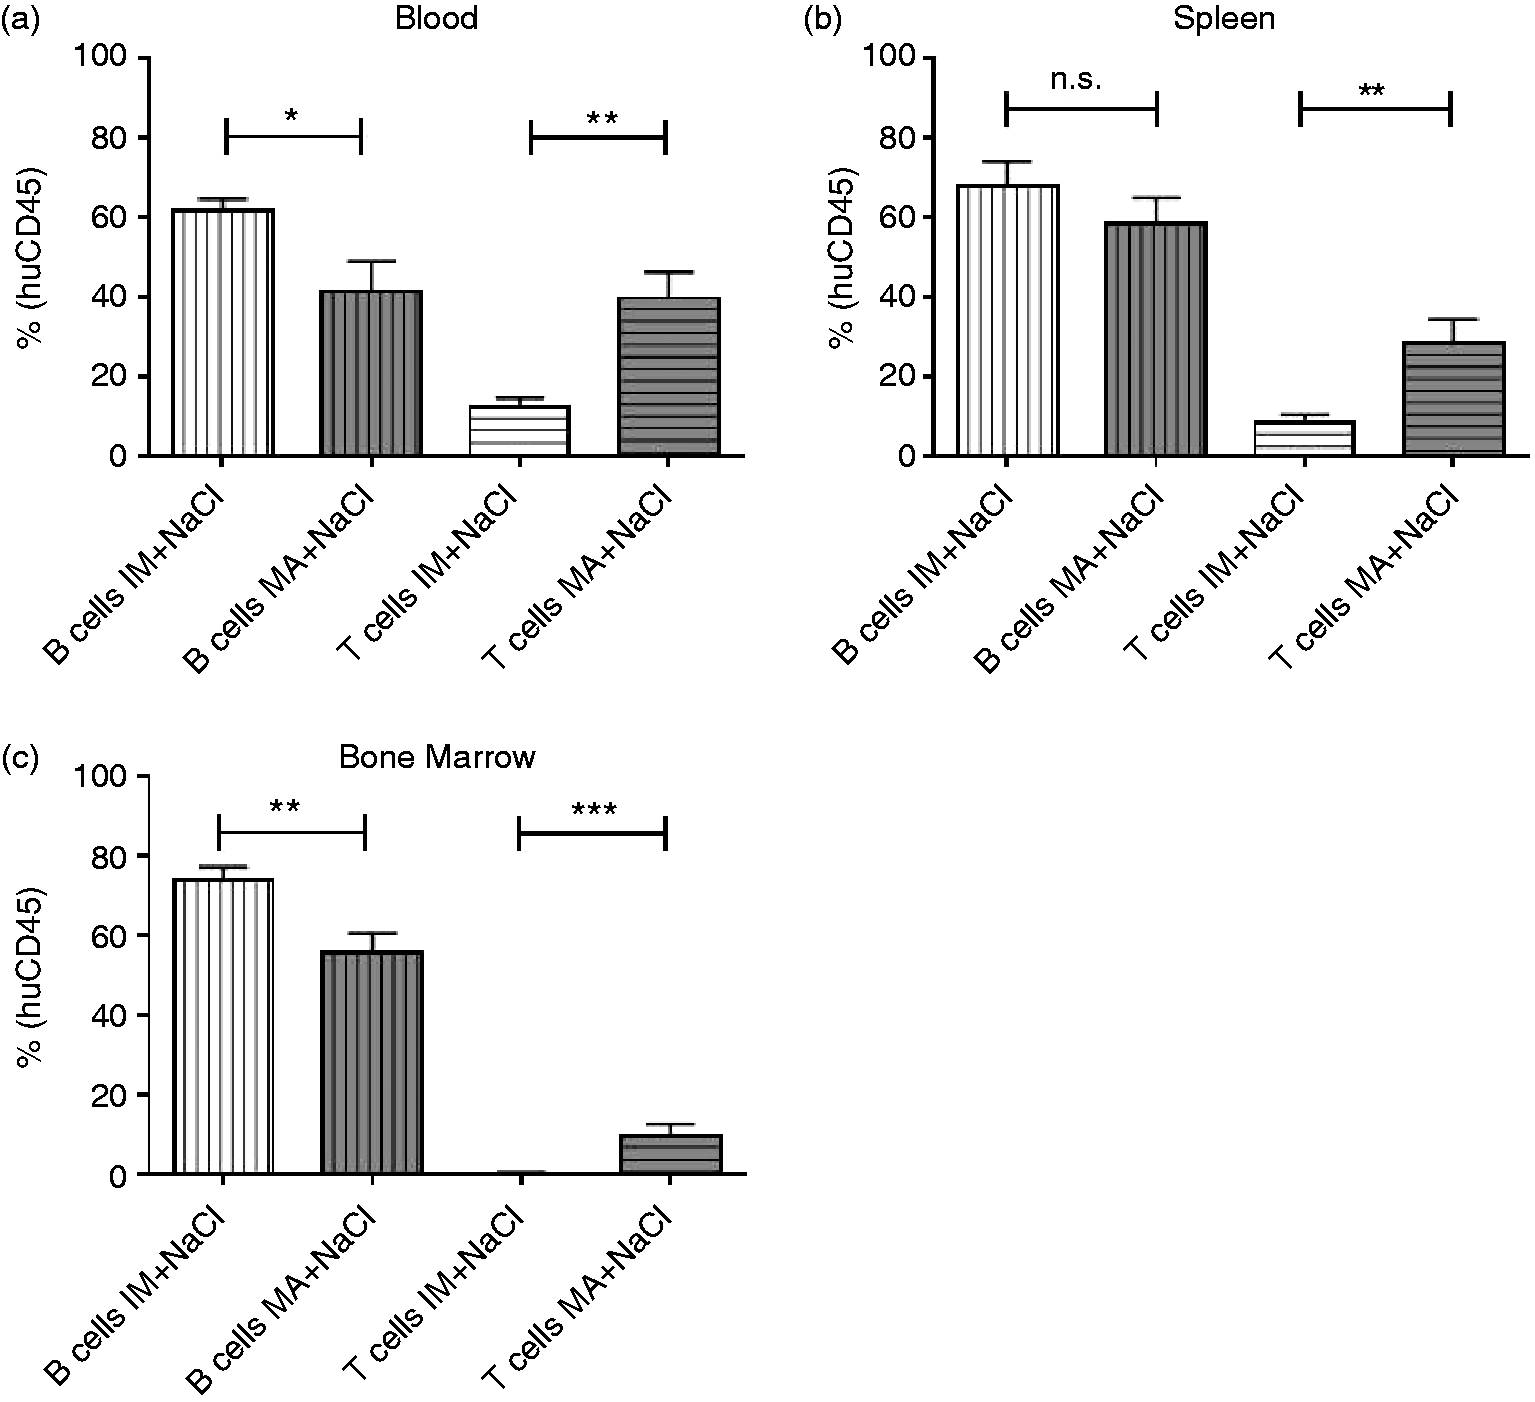
Reaction of cell subset distribution to LPS stimulus
Humanized mice were injected with 5 mg/kg LPS 8–13 or 15–22 wk after stem cell transplantation. Mice were euthanized 6 h after intervention. To monitor changes in human cell subset distributions upon stimulation with LPS, flow cytometry was performed with blood, spleen and bone marrow. To determine changes after LPS treatment, mice were compared with their respective control groups.
All LPS-treated animals showed clinical signs of the treatment like less mobility and buckled posture during the experimental time. None of the animals died prior the end of the experimental time.
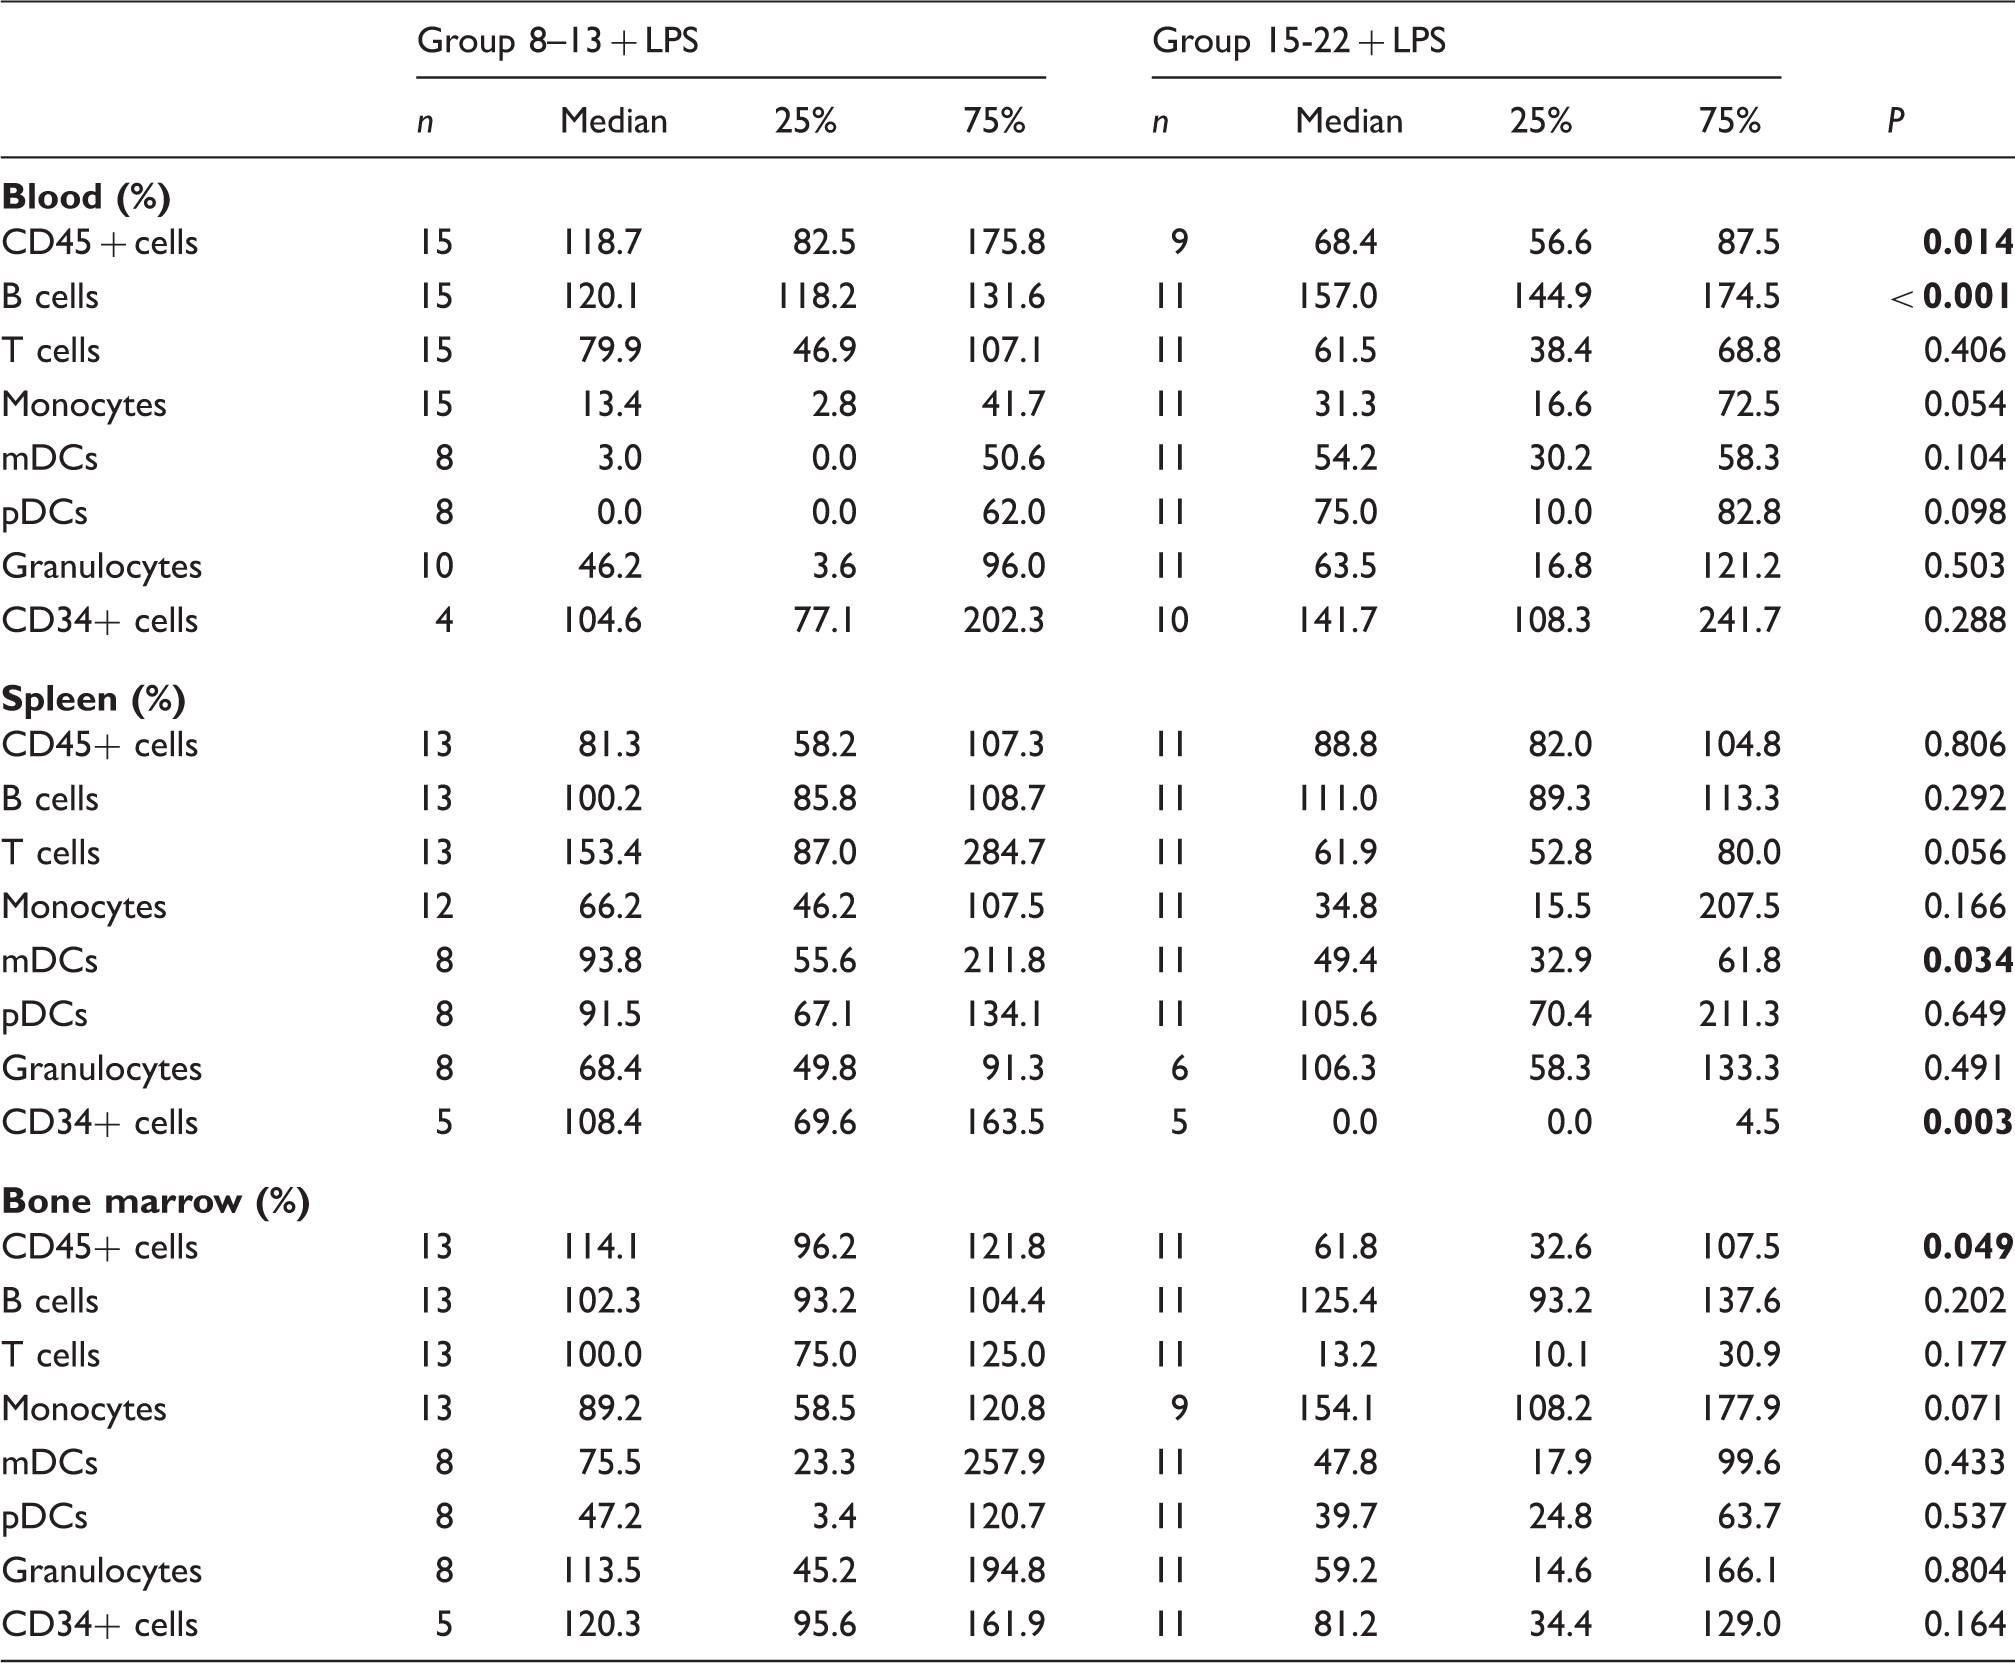
Distribution of different leukocyte cell subsets in blood, spleen and bone marrow in group 8–13 + NaCl, group 8–13 + LPS, group 15–22 + NaCl and group 15–22 + LPS.

Significant values are shown in bold.
Differences of leukocyte subpopulations in blood, spleen and bone marrow between normalized data of intervention groups 8–13 + LPS and 15–22 + LPS.
Data are shown as %-change of control. Significant values are shown in bold.
Expression of surface activation markers after LPS stimulus
mDCs and pDCs (for gating strategy see Figure S2) are important APCs. They originate from myeloid or lymphoid hematopoietic precursor cells and are important links between the innate and the adaptive immune system. DCs recognize Ags and phagocytize them. Afterwards, they become activated and present those Ags together with MHC II and co-stimulatory molecules to T cells. 18 Activation markers like HLA-DR or the co-stimulatory molecules CD80 and CD86 are up-regulated on APCs in response to stimulation by foreign Ags; therefore, they are commonly used as markers for immune stimulation. During activation of human DCs, early signs of activation are up-regulation of MHC II and CD86. 19 In the present study, they were used to monitor the response of human leukocytes to the inflammatory LPS stimulus.
Distribution of activation markers on different cell subsets in blood, spleen and bone marrow in group 8–13 + NaCl, group 8–13 + LPS, group 15–22 + NaCl and group 15–22 + LPS.

Interestingly, there were differences between both control groups (8–13 + NaCl and 15–22 + NaCl) as well. In the blood of NaCl-treated 15–22 mice, the MFI of HLA-DR on monocytes and pDCs was significantly higher when compared with NaCl-treated 8–13 animals. Spleen pDCs of 15–22 + NaCl mice showed a significantly lower MFI of CD86 compared with 8–13 + NaCl mice (Table S2).
Distribution of expression of activation markers on different cell subsets in blood, spleen and bone marrow between normalized data of intervention groups 8–13 + LPS and 15–22 + LPS.
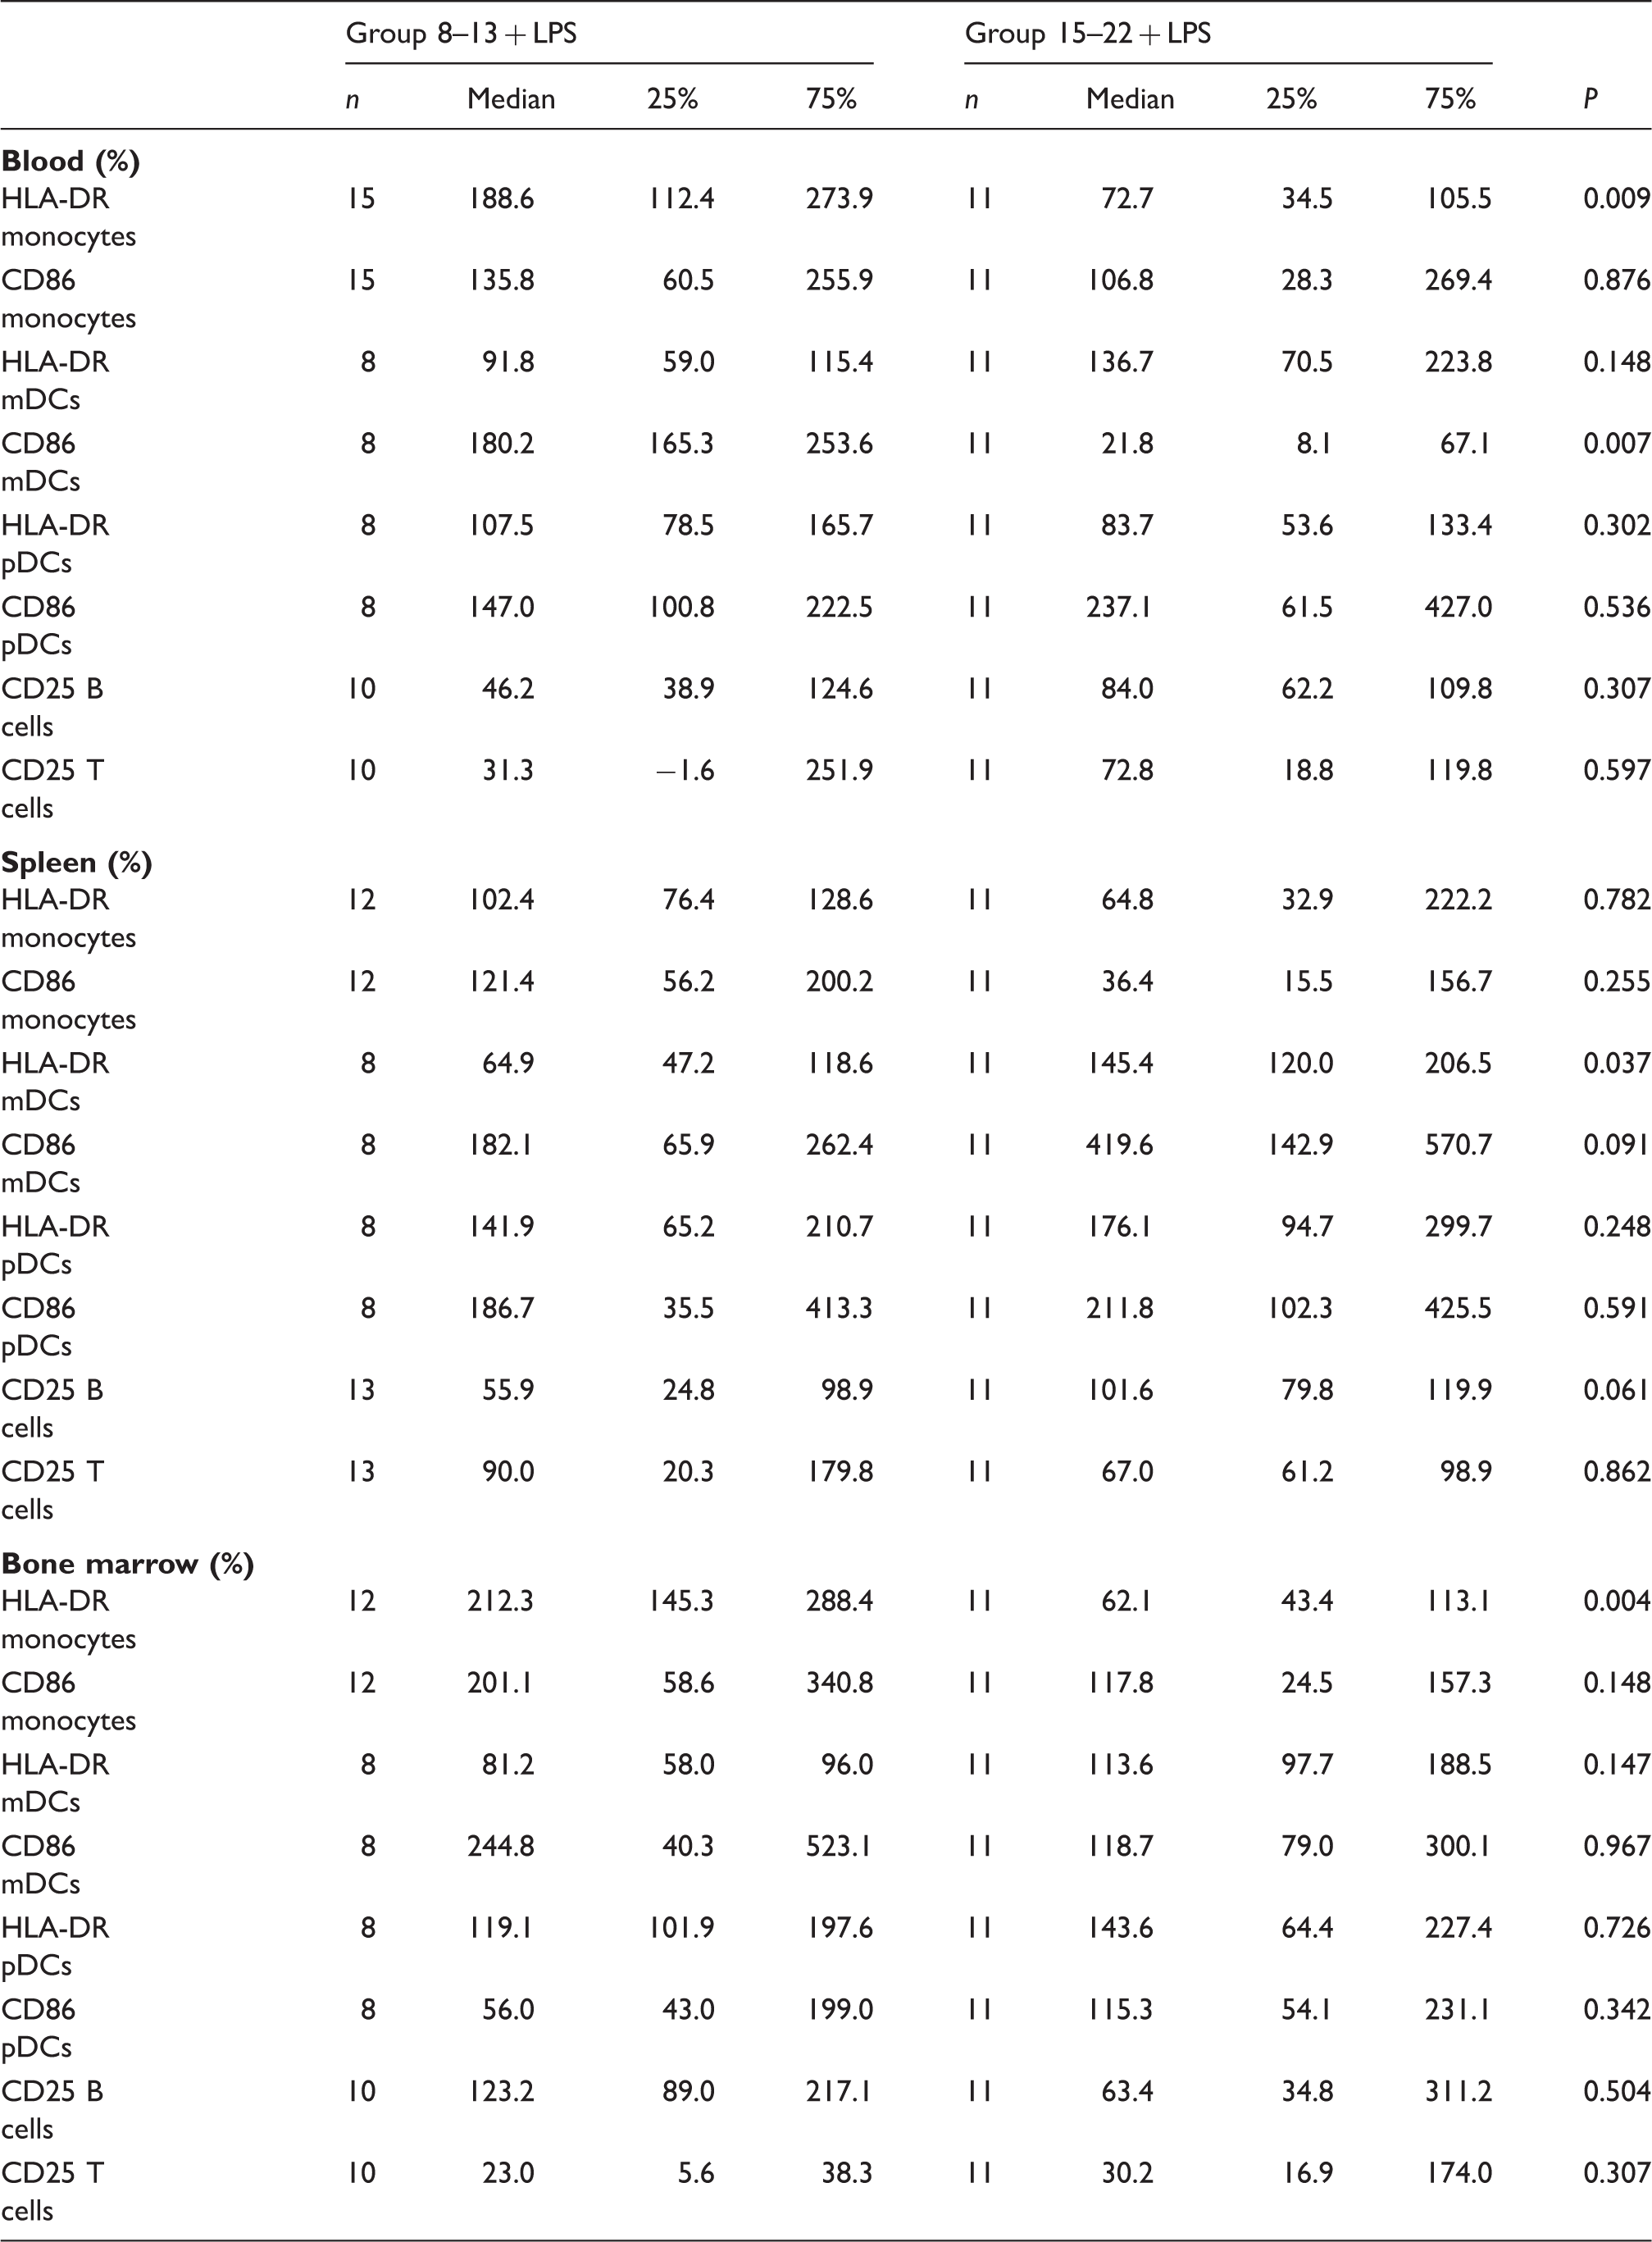
Data are shown in %-change of control.
Histological changes after LPS stimulation
In patients with sepsis or septic shock, marked morphologic changes of spleens become apparent. 20 Thus, spleens of humanized mice with endotoxemia were analyzed histologically in order to evaluate if this feature of the human disease is reflected by our model as well. In comparison with non-humanized NSG mice, which display an immature spleen structure because of their lack of constituting cell types like B and T cells (data not shown), stem cell-transplanted humanized animals showed a regularly developed white pulp with follicles and red pulp with sinusoids covered by lymphocytes, and only few erythrocytes were present.
Histological changes after LPS stimulation were qualitatively analyzed with a focus on the extent of infiltration and leukocyte depletion in the HE stained slices of spleens. Mice of both groups treated with LPS (15–22 + LPS and 8–13 + LPS) showed increased infiltration of erythrocytes and leukocyte depletion compared with animals that received only NaCl (Figure 3). There were no differences between the spleens of older and younger mice, neither between the control groups nor in the LPS-treated groups.
Histological sections of spleens stained with hematoxylin and eosin. (A) Spleen of a representative mouse 8–13 wk after stem cell transplantation that received NaCl. Regularly developed white pulp with lymphocytic follicles is visible (star); sinusoids are covered by lymphocytes (arrow) and few erythrocytes. (B) Spleen of an animal 8–13 wk after stem cell transplantation treated with 5 mg/kg LPS i.p. The mouse was euthanized 6 h after treatment. White pulp is extremely diminished while red pulp predominates. Lymphocytic follicles are decreased in size and erythrocytes fill the space between sinusoids.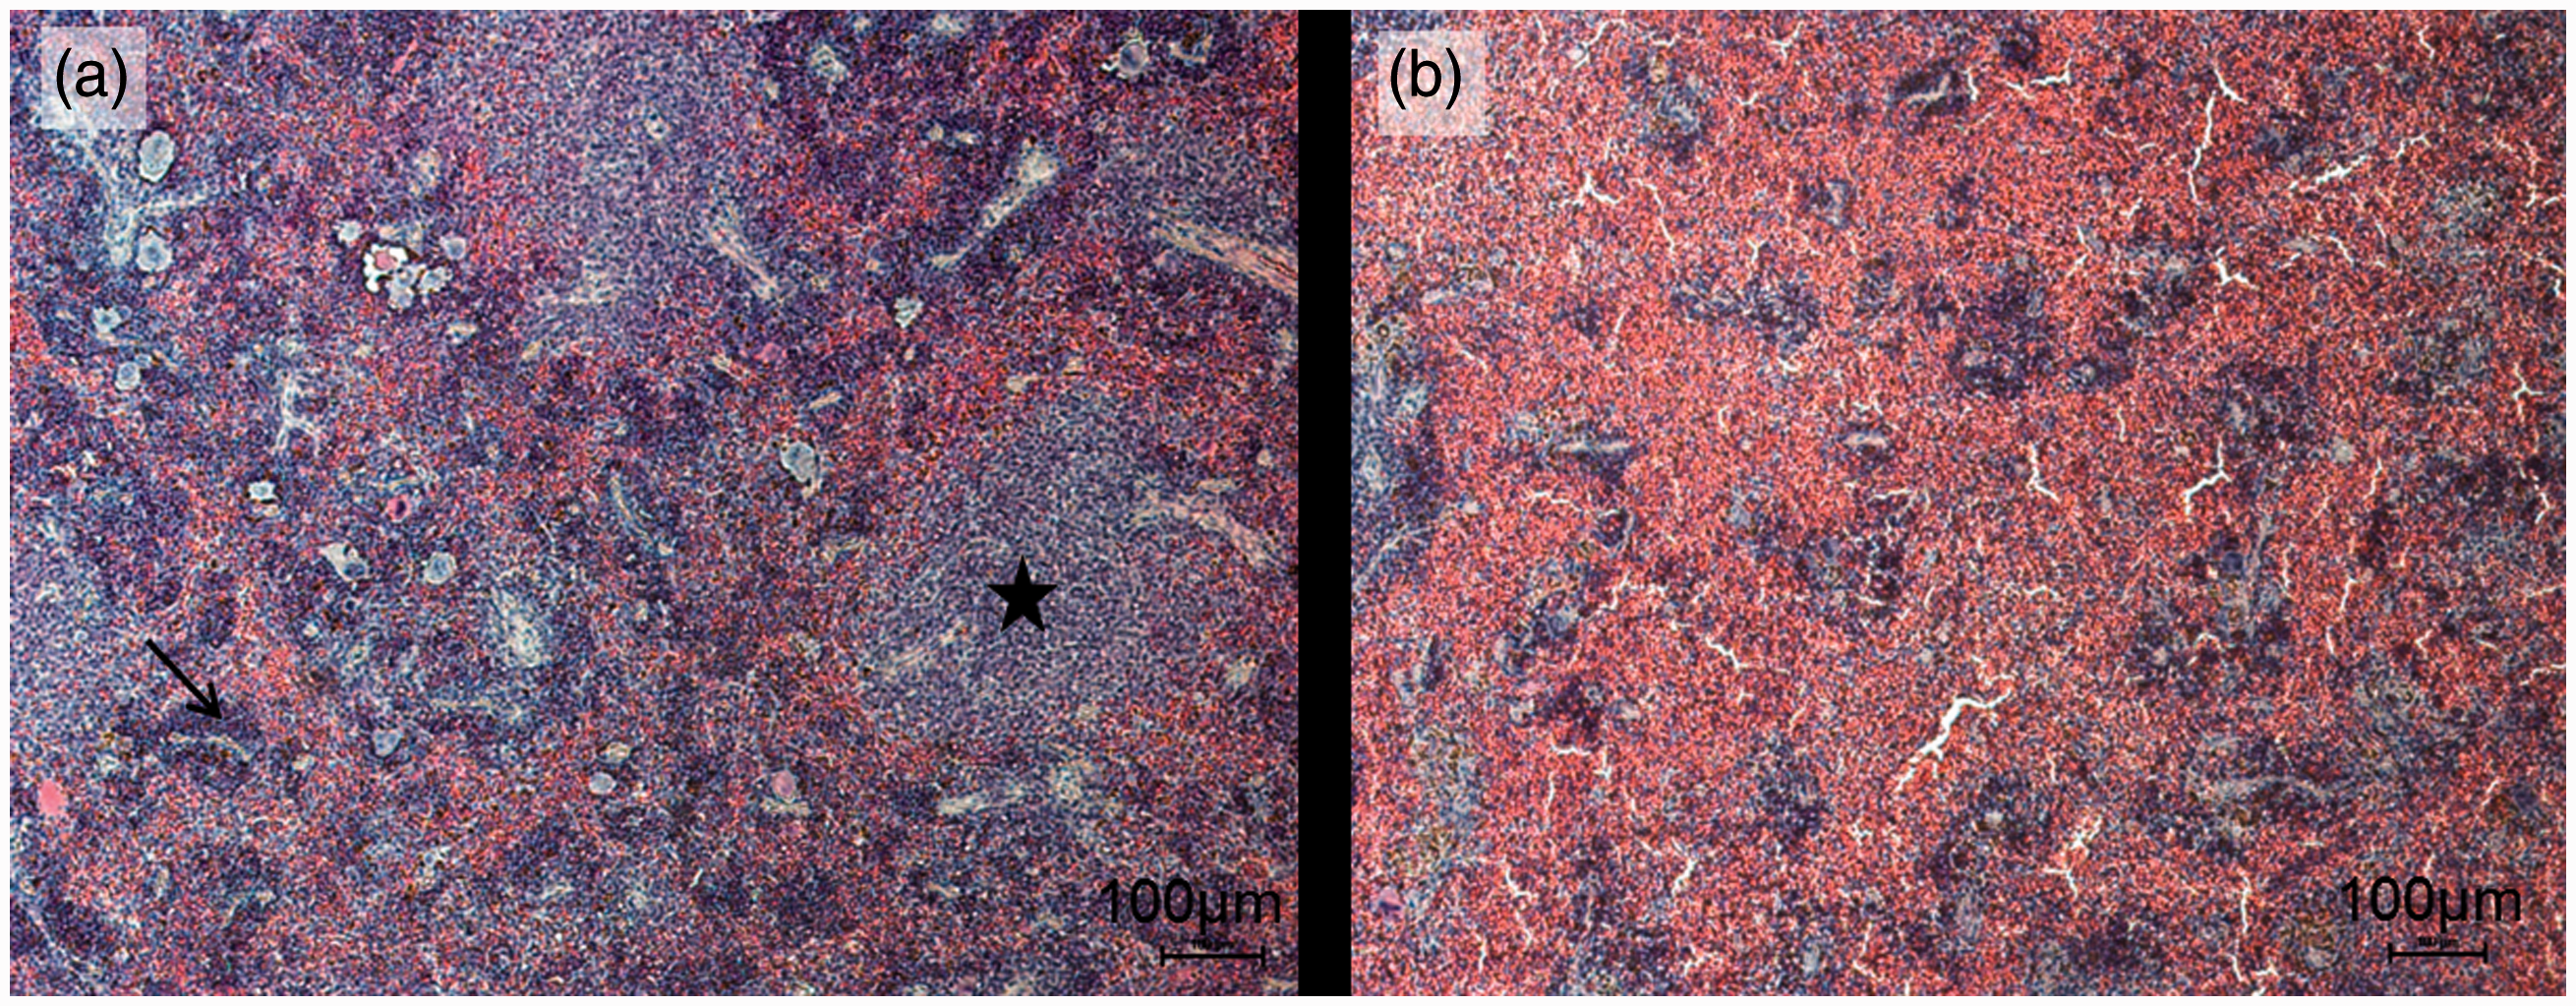
Cytokine production after LPS stimulus
To verify the functionality of human immune cells in the endotoxemia model, cytokine levels in blood plasma were quantified by means of cytometric bead array (CBA). Human cells of both animals 8–13 and 15–22 wk after stem cell transplantation were able to produce different cytokines in response to injection of LPS. When compared with the appropriate control groups (8–13 + NaCl, 15–22 + NaCl), significant increases of plasma levels of TNF-α, IL-6 (data not shown) and IL-10 (Figure 4B) could be measured for both intervention groups (8–13 + LPS, 15–22 + LPS).
Human and murine cytokines in the plasma of humanized mice. Animals were injected with 5 mg/kg LPS or NaCl (0 mg/kg LPS). After 6 h mice were euthanized. Plasma was collected and used for measurements. The concentrations of both human and murine TNF-α, IL-6 and IL-10 were analyzed by cytometric bead array. (A) Means of data of NaCl control group were set 100%. Columns represent change to corresponding control in percent (median + upper limit). Mann–Whitney Rank Sum Test was performed, significant differences are marked by asterisks, *P ≤ 0.05; n.s.: not significant. White columns represent animals 8–13 wk after stem cell transplantation (a.t.) that received 5 mg/kg LPS i.p. (n = 15); gray columns represent animals 15–22 wk a.t. that were injected with 5 mg/kg LPS i.p. (n = 11). (B) Columns represent concentrations of human or murine IL-10, respectively, in pg/ml (median + upper limit). Mann–Whitney Rank Sum Test was performed, significant differences are marked by asterisks, ***P ≤ 0.001, **P ≤ 0.01, *P ≤ 0.05. To compare mice 8–13 wk a.t. and 15–22 wk a.t. Kruskal–Wallis one-way ANOVA was performed. Results did not reach statistical significance. White striped columns represent animals 8–13 wk a.t. that were injected with NaCl (n = 12), white columns represent animals 8–13 wk a.t. that received 5 mg/kg LPS i.p. (n = 15), gray-striped columns represent animals 15–22 wk a.t. that were injected with NaCl (n = 11) and gray columns represent animals 15–22 wk a.t. that were injected with 5 mg/kg LPS i.p. (n = 11).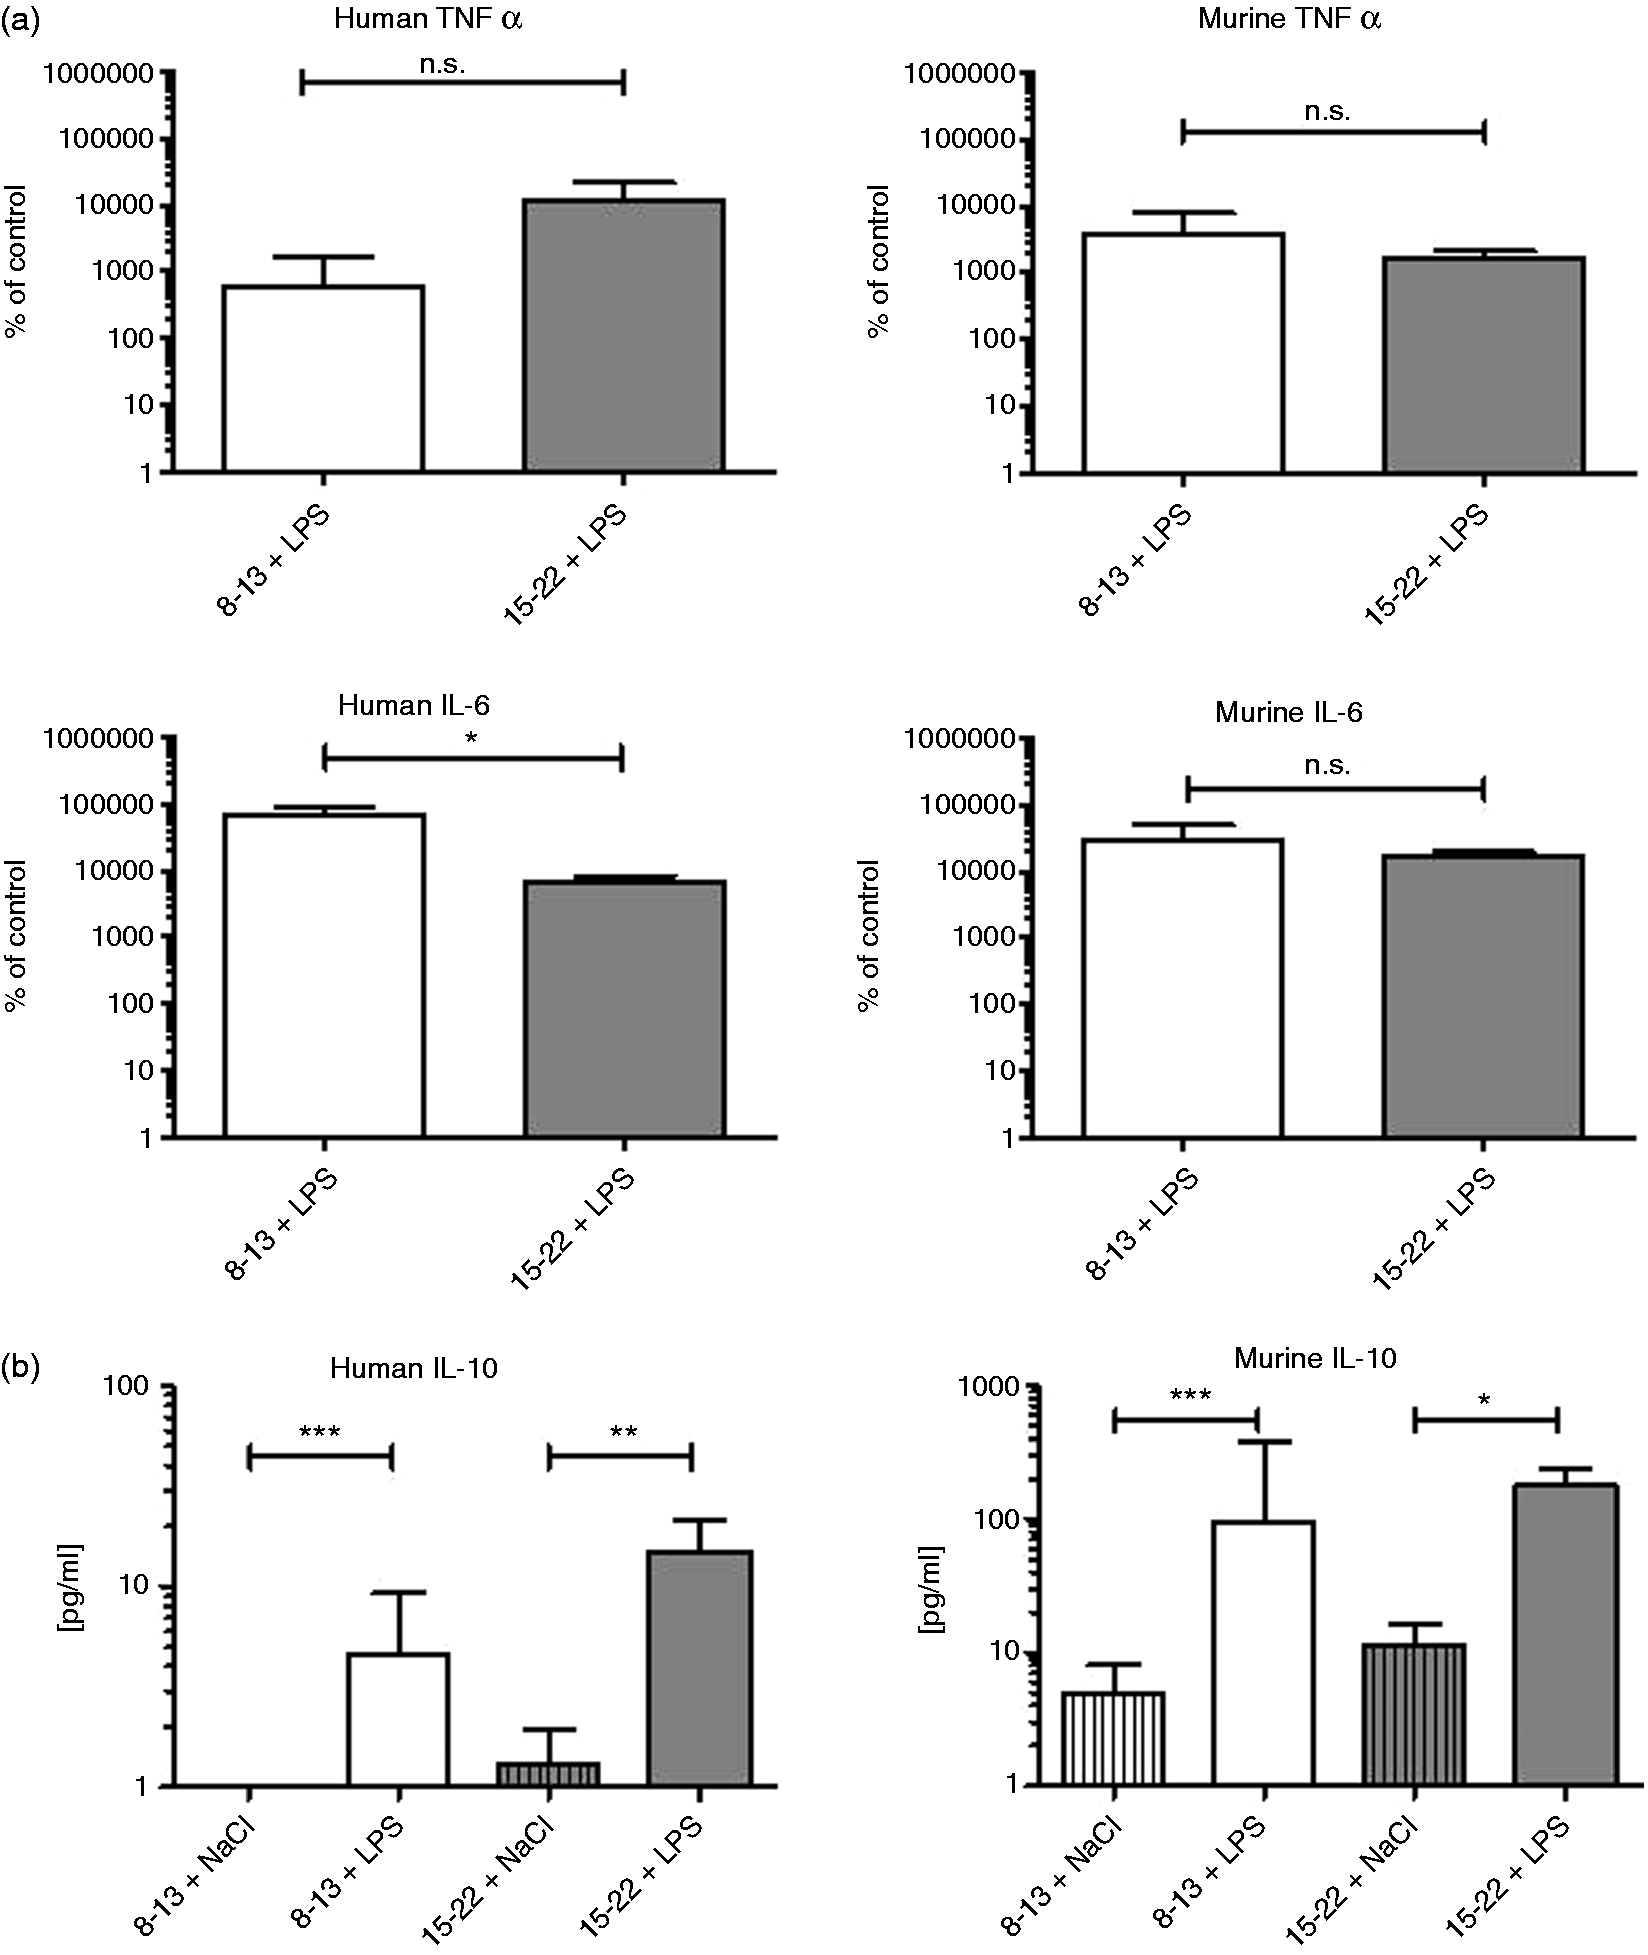
To compare cytokine concentrations in plasma of animals 8–13 and 15–22 wk after stem cell transplantation after LPS stimulus, data were normalized to their control groups. Mean values of respective control groups were calculated and set to 100%. With regard to measurements of IL-10, only absolute values are provided as this cytokine was not detectable in control group 8–13 + NaCl.
There was no statistically significant difference between groups 8–13 + LPS and 15–22 + LPS for human and murine TNF-α, but for human IL-6 (Figure 4A). Non-normalized data of IL-10 levels in animals 8–13 wk vs. animals 15–22 wk after transplantation were not significantly different (Figure 4B). We also determined levels of murine cytokines. To compare data of intervention groups of LPS-injected mice, these data were also normalized to their respective control groups. Between both LPS-treated groups, there was a no significant difference for murine TNF-α and IL-6 (Figure 4).
PTX3 production after LPS stimulus
PTX3 was shown to be a specific prognostic marker of sepsis in patients. 21 To confirm that our humanized endotoxemia model reflects clinical practice, we examined whether PTX3 was elevated in blood plasma of humanized mice treated with LPS.
For this experiment, additional cohorts of animals 8–13 wk and 15–22 wk after stem cell transplantation were sacrificed 24 h after LPS intervention.
Animals at different time points after transplantation were able to produce human PTX3 after LPS stimulation. Compared with their respective control groups (8–13 + NaCl and 15–22 + NaCl), levels of PTX3 increased significantly in LPS-treated 8–13-wk-old and LPS-injected 15–22-wk-old mice (data not shown).
In the plasma of LPS-treated animals 8–13 wk after transplantation that were sacrificed after 24 h, higher concentrations of PTX3 could be detected than in animals 6 h after LPS intervention that were the same age. This difference was also evident in animals 15–22 wk after transplantation (Figure 5). To compare data of LPS-treated animal groups, data were normalized to the respective control groups. Means of control values were set 100%. PTX3 levels 6 h after LPS injection were higher in animals 15–22 wk after transplantation than in mice 8–13 wk after transplantation. Twenty-four h after intervention, concentrations of PTX3 were higher in both LPS-treated groups than in corresponding groups after 6 h. The highest PTX amount was measured in 15–22-wk-old animals, although there was no statistically significant difference between the different intervention groups (Figure 5).
Human PTX3 level 6 h and 24 h after LPS injection. Humanized mice 8–13 and 15–22 wk after stem cell transplantation were treated i.p. with LPS in a dose of 5 mg/kg (8–13 + LPS; 15–22 + LPS). Six or 24 h after treatment mice were sacrificed. Plasma was used to measure human PTX3 by means of ELISA. The means of both control groups (8–13 + NaCl, n = 12; 15–22 + NaCl, n = 9) were set 100%. Columns (median + upper limit) show change to respective control groups in % at different time points after intervention. Twenty-four h after injection of LPS, human PTX3 concentrations increased in animal groups 8–13 + LPS and 15–22 + LPS compared with the corresponding values after 6 h. White column represents PTX3 levels of animals 8–13 wk after stem cell transplantation (a.t.) 6 h after LPS treatment (n = 15), black and white squared column shows animals 8–13 wk a.t. 24 h after intervention with LPS (n = 4), gray column demonstrates animal group 15–22 wk a.t. 6 h after LPS i.p. (n = 11) and the squared gray column shows the concentration of human PTX3 of animals 15–22 wk a.t. 24 h after LPS injection (n = 7). To determine significances between interventions groups Kruskal–Wallis one way ANOVA on Ranks was performed. Results did not reach statistical significance.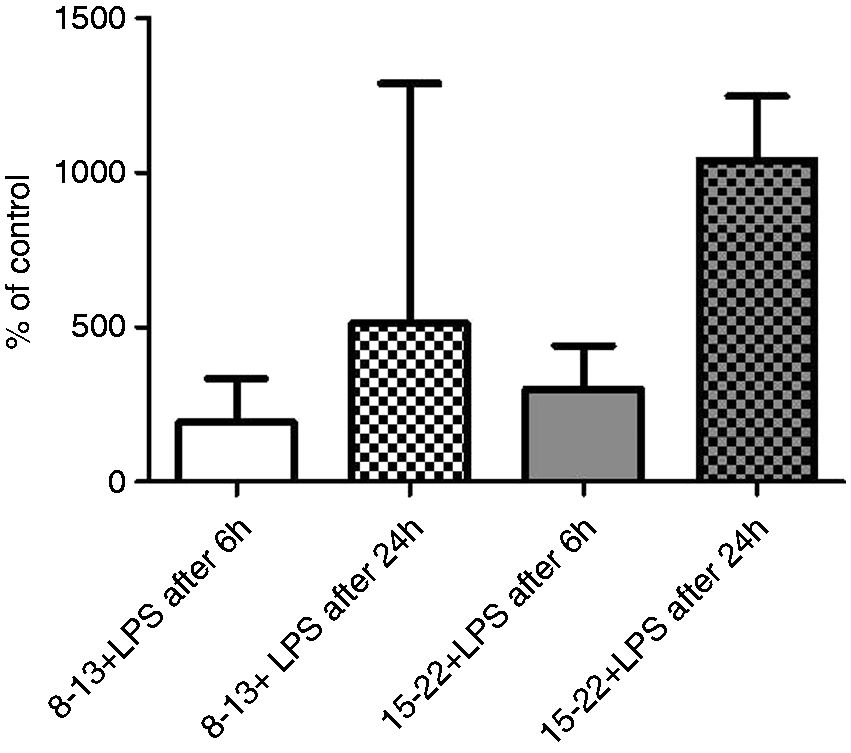
Calculations for LPS-treated mice revealed that numbers of human CD16+ granulocytes and human PTX3 levels of single mice correlated well. The Spearman’s rank correlation coefficient was R = 0.89 (data not shown).
We also determined the concentration of murine PTX3 in the plasma. In LPS-treated mice (8–13 + LPS, 15–22 + LPS), it was highly elevated when compared with the control groups that were injected with NaCl (data not shown).
Discussion
In the present study mice were successfully humanized and developed a human immune system with all main subpopulations that are present in humans, for example human B cells, T cells, monocytes and granulocytes. We saw a process in changing cell distribution of the different leukocyte subpopulations during time after transplantation. Based on the time and on a B-cell/T-cell ratio cutoff, we divided mice into two age groups. Afterwards the two groups were divided into treatment and control groups. The treatment groups were injected i.p. with LPS to investigate the innate immune response of the xenogene immune system dependent of the time after transplantation. Both animal groups (8–13-wk-old and 15–22-wk-old) reacted to LPS stimulation, but the extent of reaction was different. Similar to humans the reaction to endotoxin stimulation is dependent on the maturation of the immune system.22,23 Maddux and Douglas describe a rapid maturation of the immune system until the age of 2 yr in humans. 22 During this time the immune response is relatively hypoinflammatory compared with an adult response. This is explained by a submaximal cytokine production, preferential Th2 cytokine production and a decreased Ag-presenting capacity. In both age groups in our study we could prove a change in distribution of human leukocyte subpopulations and an increase in activation markers on different cell subsets. The decrease of human monocytes after LPS intervention in blood was higher in humanized 8–13-wk-old mice. Furthermore, human cells in these mice produced both pro- and anti-inflammatory cytokines, as well as PTX3. Eight to 13-wk-old mice produced significantly more human IL-6 than 15–22-wk-old mice. The increase of human PTX3 in blood plasma after LPS treatment of 15–22-wk-old mice was higher than in 8–13-wk-old mice. Histological analysis of spleen showed histopathological changes in LPS-treated humanized mice of both groups compared with NaCl-treated control animals. Age-dependent reactions on sepsis were already surveyed in a mouse model. 24 Turnbull et al. performed a CLP (cecal ligation and puncture) procedure with C57BL/6 mice at different ages and found significant differences in the outcome of sepsis. 24
Interestingly, engrafted human hematopoietic stem cells in NSG mice showed a profile similar to the physiological maturation processes in humans. Eight to 13 wk after stem cell transplantation there was a significantly higher number of B cells than T cells within the human leukocyte population in peripheral blood of humanized mice. Fifteen to 20 wk after stem cell transplantation the proportions of B cells and T cells changed, so that humanized mice showed more T cells than B cells (Figure 1B). The kinetics of the different human leukocyte subsets over time has also been described by Lang et al. 25 In particular, their published data about T- and B-cell kinetics underline our findings. In humans, the percentage of B cells is higher at birth and continues to increase for 6 mo, followed by a gradual decrease to adult levels by late childhood or early adolescence. The percentage of T cells gradually increases to adult levels by the same age range. 26 In our humanized mice we observed a similar effect (Figure 1B). Thus, the younger mice (8–13 wk after stem cell transplantation) could reflect the lymphocyte distribution in infants and young children, whereas mature mice 15–20 wk of age might reflect a situation closer to adults. In humans the number of white blood cells, including neutrophils, lymphocytes, basophils and monocytes, declines until the age of 12 yr. In human neonates the count of monocytes is 60% higher than in healthy adults.27,28 Besides the different cell counts of white blood cells there are functional differences, especially between neonates and adults. Differences in innate immunity have been described, including neutrophil, TLR-dependent and DC immune function. Neutrophils of human infants show decreased responses to chemokines. TLR-dependent innate immunity is impaired in neonates, for example TLR2 and herpes simplex virus interaction, leads to overproduction of IL-6 and IL-8. Immature neonatal DCs have diminished Ag-presenting ability. 28 Although younger and older mice showed similar numbers of cells of innate immunity, we wanted to test whether they react differently on an inflammatory stimulus similar to the situation in humans.
The human immune system matures, and during this maturation time it reacts differently in response to stimuli than that of adults. Children aged 1–4 yr are clearly different from adults in terms of underlying disease, mortality and sites of infection in sepsis. 29 The human neonatal innate immune system is also immature compared with that of adults, likely contributing to the increased susceptibility to infection. 30 Thus, many differences between the developing immune system in children and the already matured immune system in adults are observed. We observed a similar change in leukocyte subpopulations regarding time after transplantation of CD34+ cells in humanized mice, and aimed to study the reactions and differences therein after LPS stimulation. Other groups have already studied humanized NSG mice in the context of sepsis. Whereas Unsinger et al. used a different endotoxemia model called cecal ligation and puncture (CLP) and focused on apoptosis of immune cells in sepsis, 31 Skirecki et al. used 4-wk-old NSG mice that were transplanted with stem cells. 32 For actual experiments they used mice 7 wk after transplantation and performed both the LPS injection and CLP. They were interested in stem cell release, for example in the bone marrow in the context of sepsis. 32 The LPS endotoxemia model was also used by Gille et al. 33 In their study, mice at the age of around 10 wk were humanized by stem cells obtained from children with malignancies. A second animal group received cord blood stem cells as pups. These animal groups were compared in the context of sepsis concerning myeloid lineage of immune cells. 33 In the present study NSG mice were transplanted as pups. Therefore, it was possible to see the de novo development of human immune cells in immunodeficient mice and the reaction on an inflammatory insult of this immune system at different maturation stages.
In humanized mice human immune cells and their functionality can be determined in vivo. Using them as model organisms implies closer to the patient’s situation.
Regarding adaptive immunity, sepsis-induced apoptosis of lymphocytes leads to lymphopenia in patients and it involves all types of T cells. 34 By tendency, a decrease of T cells after LPS administration in both younger (8–13 wk) and older (15–22 wk) animals was detectable in the recent study.
The typical decrease of monocytes in sepsis was detectable in both younger and older mice as it was described by Hotchkiss et al. in humans. 35 Monocytes can undergo apoptosis, immigrate to the site of the stimulus or loose the CD14 cell surface marker by differentiating into more specialized subtypes. Werra et al. described in 2001 a monocyte count decrease in patients with septic shock because of a reduced expression of CD14, but the whole complex mechanism still remains unclear. 36 Some groups, for example, Brandtzaeg et al., 37 investigated whether anti-inflammatory cytokines might be responsible for the profound down-regulation of CD14 on monocytes observed in the blood of human septic shock patients. They suggest that the anti-inflammatory ‘principles’ in septic shock plasma have a stronger impact on the activation state of human monocytes than do the pro-inflammatory cytokines. 37 Interestingly, down-regulation of CD14 expression has recently been shown to be sufficient to trigger monocyte apoptosis in humans. 38 To gain more insight into the role of human monocytes in sepsis our humanized model provides a good tool for research in vivo.
Cells of the innate immune system are in focus with regard to pathological processes in sepsis. Tanaka et al. described functional human myeloid subsets in NSG mice that were humanized with cord blood stem cells. 39
Increased expression of MHC class II molecules is generally regarded as an early activation marker of DCs. Furthermore, DCs present Ags to T cells with co-expression of co-stimulatory molecules like CD86.18,19 In our study, HLA-DR and CD86 on monocytes and DCs were up-regulated significantly in blood in LPS-treated groups compared with their respective controls (Table 3). It shows that human cells of the innate immune system that developed in humanized mice are able to react on LPS stimulation. It is known that DCs activate T cells after being activated. By tendency, there was an up-regulation of activation markers of T cells, so it might be suspected if dendritic cells in these mice are able to bridge the gap between innate and adaptive immune system. Chen et al. demonstrated in 2012 that DCs in humanized mice are not able to activate T cells, but they improved the functionality of DCs via systemic injection of cytokines before inducing endotoxemia. 40 They used mice 12–16 wk after stem cell transplantation. We used mice of same age in the group of mice 8–13 wk after stem cell transplantations, and our findings were comparable with those of Chen et al. 40 However, we also used older mice 15–22 wk after transplantation, and they reacted differently than the younger mice in our study. Cells in these mice were more mature and reacted qualitatively different to immature, 8–13-wk-old, animals. The aim of the present study was to test the functionality of the immune system of a humanized mouse model under septic conditions at two different age levels without any further influence. Hence, mice were not pretreated with cytokines. When LPS-treated mice (from both intervention groups) were compared with their respective control groups a slight, but not significant, increase in the activation marker CD25 on T cells was detectable. To unravel if this was mediated by DCs further investigations would be necessary. The activation of T cells is one major task for DCs as APCs. Compared with other studies the T-cell activation in our model is not optimal and confines the model introduced in this study. 40
While interpreting histological slices of spleens qualitatively, it was clearly possible to detect differences between control and intervention groups, but no differences between intervention groups 8–13 and 15–22 wk after transplantation became apparent (see Figure 3). Hematoxylin and eosin-stained spleen slices were examined, and massive lymphocyte depletion became obvious. Hotchkiss et al. showed a shrinking of lymphoid follicles in the spleens of septic patients in comparison with spleens from non-septic patients. 20 Therefore, we conclude that LPS does not only affect humanized mice on the cellular level by producing cytokines or adapting the immunological cell subsets, but also on the level of more complex organized organs like spleen. The massive depletion of leukocytes and the occurrence of erythrocyte infiltration might reflect an upcoming organ dysfunction.20,41
The first stage of sepsis is the hyper-inflammation. In humans, during that period, activation of TLR2 and TLR4 leads to massively increased production of pro-inflammatory cytokines, including TNF-α and IL-6, which are typical for sepsis. 42 During the second stage anti-inflammatory cytokines like IL-10 are released. 43 Septic humanized mice of both ages were able to produce human cytokines in a composition similar to patients. As described previously,44,45 the enormous increase of human IL-6 and TNF-α after LPS administration is remarkable (Figure 4). In addition, we found that the extent of the increase of the inflammatory human cytokine IL-6 under LPS influence is significantly higher in 8–13-wk-old animals than in 15–22-wk-old animals (Figure 4A). In infants it is known that a functional immaturity of TLR2 leads to overproduction of IL-6. 28 Therefore, it might be a hint that the 8–13-wk-old mice reflect this situation better than the older mice used in this study. In general, both pro-inflammatory cytokines tested—IL-6 and TNF-α—increased after LPS stimuli in both groups of treated mice in comparison with their respective control groups. It is known that in endotoxemia models the mentioned cytokines increase massively, and this finding led to the establishment of IL-6 and TNF-α as clinical biomarkers in septic patients. 6 Studies in animals showed that these cytokines cannot work as prognostic markers, but recent findings show that PTX 3 can be useful in this context. 46
PTX3 is a key component of the humoral innate immunity and has lately been discussed as a prognostic marker for septic patients. 14 It is a member of the pentraxin family, which also includes C-reactive protein (CRP) and serum amyloid P component protein. Normally, it is produced locally in response to an inflammatory insult. 47 Cell types that produce PTX3 include macrophages, neutrophils and mDCs, but also endothelial cells, fibroblasts and smooth muscle cells. It seems to play a dual role in innate immunity, as shown by Nauta et al. 48 Immobilized PTX3 binds complement component C1q to induce classical complement activation. Furthermore, its soluble form inhibits the complement activation. 48 Interestingly, PTX3 values correlate positively with severity-of-disease classification scores in sepsis and peak earlier than CRP. PTX3 remains elevated in the acute phase and decreases on recovery in patients with sepsis. Healthy donors have a PTX3 level ≤ 2 ng/ml, whereas in patients with SIRS the concentration of PTX3 can be up to 200–800 ng/ml within 6–8 h. 49
In the present study, younger as well as older mice showed a significantly higher concentration of human PTX3 after LPS stimulation compared with their control groups. Normalized data indicated a tendency that in older mice more PTX3 was measurable in the plasma 6 h, and especially 24 h, after LPS stimulation (Figure 5). Amongst others, granulocytes are one cell population that produces PTX3. Statistical calculations for LPS-treated mice revealed that only numbers of human CD16+ granulocytes and human PTX3 levels of single mice correlated well. The Spearman’s rank correlation coefficient was R = 0.89 (data not shown). Hence, we conclude that in our model human granulocytes may be the source of PTX3.
After LPS treatment all mice of the intervention groups developed clinical symptoms such as ruffled fur, a changed posture and loss of mass. We also treated naive NSG mice with LPS (data not shown) and similar symptoms were detectable. It is very likely that the LPS stimulation, which essentially triggers the unspecific immune reaction, 50 also stimulates the murine granulocytes. Human immune cells need to interact with, for example, host endothelial cells; in this case, interactions with integrins and/or selectins are important. 31 Therefore, the model described in this study cannot reflect the complete clinical situation in humans, but, nevertheless, it provides important insights on a cellular level.
The main purpose of this study was to establish and characterize a humanized mouse model of sepsis that closely reflects the patient situation, owing to the fact that available rodent models are different in their immunological reaction to humans. Consequently, there is an urgent need for functional and close-to-human disease models to study this severe disease. Problems of diverse rodent models for sepsis and septic shock are the difficulties of transferring results from preclinical therapy studies in animals to clinical trials. 51 After establishing humanized mouse models with functional immune cells of lymphoid and myeloid lineage,16,15 it was possible to induce sepsis in this model. 31 In contrast to Unsinger et al. we chose another endotoxemia model to insure standardization of the procedure. 31 Besides the limitations of an animal model the advantage of the present study is the comparison between younger and older humanized mice in context of reactions after LPS administration with a focus on human cells of the innate immune system. Comparable studies in humanized mouse models for infections referring to different reactions to infection stimulation do not exist so far. Human neonates, young children and adults are different in their immune system maturation states and react differently to the same stimuli, such as LPS. Ethical limitations, especially with regard to children and infants, make functional animal models necessary. Therefore, in future it might be possible to test new therapeutic drugs for sepsis in humanized mouse models that closely reflect the situation in children and adults. It was possible to introduce a disease that reflects many aspects of a patient’s situation during sepsis on a cellular and histological level. We were able to demonstrate human PTX3 production by, presumably, human granulocytes. By means of this model new therapeutic approaches could be tested and with the help of diagnostic markers (e.g. TNF-α) and PTX3 as prognostic markers, the outcome of potential new drugs could be evaluated closer to the human situation.
Footnotes
Acknowledgements
The authors thank the staff of the medical experimental center of the University of Leipzig for the professional keeping of the mice. Furthermore, we thank the midwives, mothers-to-be and medical doctors from the Saint Elisabeth Hospital Leipzig for cooperation and the supply of umbilical cord blood.
Declaration of Conflicting Interests
The author(s) declared no potential conflicts of interest with respect to the research, authorship, and/or publication of this article.
Funding
The author(s) received no financial support for the research, authorship, and/or publication of this article.
References
Supplementary Material
Please find the following supplemental material available below.
For Open Access articles published under a Creative Commons License, all supplemental material carries the same license as the article it is associated with.
For non-Open Access articles published, all supplemental material carries a non-exclusive license, and permission requests for re-use of supplemental material or any part of supplemental material shall be sent directly to the copyright owner as specified in the copyright notice associated with the article.