
Abstract
Pulmonary alveolar macrophages (AMs) are important in defense against bacterial lung inflammation. Cluster of differentiation 14 (CD14) is involved in recognizing bacterial lipopolysaccharide (LPS) through MyD88-dependent and TRIF pathways of innate immunity. Sulforaphane (SFN) shows anti-inflammatory activity and suppresses DNA methylation. To identify CD14 epigenetic changes by SFN in the LPS-induced TRIF pathway, an AMs model was investigated in vitro. CD14 gene expression was induced by 5 µg/ml LPS at the time point of 12 h and suppressed by 5 µM SFN. After 12 h of LPS stimulation, gene expression was significantly up-regulated, including TRIF, TRAF6, NF-κB, TRAF3, IRF7, TNF-α, IL-1β, IL-6, and IFN-β. LPS-induced TRAM, TRIF, RIPK1, TRAF3, TNF-α, IL-1β and IFN-β were suppressed by 5 µM SFN. Similarly, DNMT3a expression was increased by LPS but significantly down-regulated by 5 µM SFN. It showed positive correlation of CD14 gene body methylation with in LPS-stimulated AMs, and this methylation status was inhibited by SFN. This study suggests that SFN suppresses CD14 activation in bacterial inflammation through epigenetic regulation of CD14 gene body methylation associated with DNMT3a. The results provide insights into SFN-mediated epigenetic down-regulation of CD14 in LPS-induced TRIF pathway inflammation and may lead to new methods for controlling LPS-induced inflammation in pigs.
Keywords
Introduction
Inflammation is the body’s reaction to injuries such as trauma, hypersensitivity, and infection in order to defend against pathogens. 1 Lung inflammation conditions such as pneumonia are a main threat in pig production. Unlike adaptive immunity, which needs more time for defense against antigens, innate immunity always responds quickly to inflammatory-related stimulations. 2 LPS is a component of the outer membrane of Gram-negative bacteria and one of the most predominant microbial stimulators of inflammation. 3 It activates the innate immune response in monocytes, dendritic cells (DCs), and macrophages. 4 In macrophages, LPS induces the production of pro-inflammatory cytokines, including TNF-α, IL-1β and IL-8, and anti-inflammation mediators such as IL-6 and IL-10. 5 Alveolar macrophages (AMs) reside in the pulmonary alveolus. They constitute a vital component of the alveolar spaces and play a central role in pulmonary innate immunity. 6
Cluster of differentiation 14 (CD14) is a GPI-linked protein and a PRR that binds directly to LPS. It enhances the inflammatory response and induces LPS-dependent production of IL-8 in vitro. 7 It is expressed in AMs, binds with LPS, and activates the TLR4/MD2 complex in AMs. 8 CD14 gene knockdown in macrophages strongly suppresses the secretion of cytokines like IL-6 and LPS-induced TNF-α, which suggests that CD14 is critical for LPS binding to macrophages. 9 After LPS stimulation, CD14-TLR4 activates the MyD88-dependent and MyD88-independent (TRIF) pathways. 10
Epigenetics is the study of mitotically or meiotically heritable changes in gene function that cannot be explained by changes in DNA sequence. 11 DNA methylation is one of the key epigenetic processes that interact with regulatory proteins and non-coding RNAs. 12 It involves the addition of methyl groups to the adenine or cytosine bases of DNA that are associated with DNA methyl transferases (DNMTs), including DNMT1 and DNMT3. DNMT1 has maintenance methylation activity, 13 whereas DNMT3 has roles in de novo methylation. 14 It is well known that DNA methylation of gene promotor regions is associated with gene silencing. 15 In contrast, gene body methylation is positively correlated with gene expression in humans. 16
However, epigenetic effects can be mediated by epigenetic factors like sulforaphane (SFN; 1-isothiocyanato-4-(methylsulfinyl)-butane). SFN is a natural member of the isothiocyanate family, which is mainly found in edible cruciferous vegetables such as broccoli, cabbage, and kale. 17 SFN treatment causes demethylation of the first five CpGs in the promoter region of the nuclear factor erythroid-derived 2-like 2 (Nrf2) gene. 18 It thereby increases messenger RNA (mRNA) and protein expression of Nrf2 and downstream target genes while decreasing the protein levels of DNMT1 and DNMT3a. 18 In porcine satellite cells, SFN produces a major epigenetic repression of myostatin. 19 SFN is reported to have anticancer, 20 antioxidant, antidiabetic 21 and anti-inflammatory 22 effects. It modulates TLR4 activation and inhibits LPS-induced inflammatory responses. 23 SFN also regulates the LPS-induced innate immune responses of porcine monocyte-derived dendritic cells (moDCs) through an epigenetic mechanism. 24
It is well known that CD14 functions in LPS-MyD88 signaling 10 but its activation in the TRIF pathway is debated. LPS initiates TRIF signaling independent of CD14 25 but it has also been shown that CD14 is required for TRIF-dependent signaling. 26 Thus, CD14 may be involved in the TRIF pathway by directly binding with LPS. However, it is poorly understood whether this engagement mechanism of CD14 in LPS recognition and immune response induction is regulated epigenetically. Therefore, we hypothesized that DNA methylation may epigenetically regulate the LPS-inducing CD14-TRIF pathway genes, including CD14, TRIF-TRAF6 sub-pathway genes (TRAF6, RIPK1, NF-κB) and TRIF-TRAF3 sub-pathway genes (TRAF3, interferon regulatory factor (IRF)7, IRF3). The objectives were to identify the role of CD14 in the LPS-induced TRIF pathway, as well as the epigenetic DNA methylation of CD14 (promotor and gene body (CDS) region methylation) associated with SFN treatment in an in vitro porcine AMs model.
Materials and methods
Experimental animals
A total of three 35-d-old female German Landrace piglets (after weaning) were used in this study. Animals were fed in the same unique environmental conditions at the teaching and research station of Frankenforst, University of Bonn, Germany. The feeding and husbandry practices of the animals followed the husbandry regulations and standard guidelines of Zentralverband der Deutschen Schweineproduktion (ZDS). 27 The experiment was approved by the Veterinary and Food Inspection Office, Siegburg, Germany (permission number: 39600309-547115). The piglets were free of all major pig diseases. They were vaccinated against mycoplasma on d 3 and d 10. At the age of 28 d, they were weaned and placed in collective pens. The animals were humanely euthanized with a dose of ketamine followed by T61 (adjusted according to the individual body mass) through the vena cava cranialis. Finally, whole lungs were collected and kept on ice.
Pulmonary AMs isolation
AMs were obtained by bronchoalveolar lavage (BAL) using ice-cold sterile Dulbecco’s phosphate-buffered saline (DPBS 1×, pH 7.4, Life Technologies, Germany) with 5% penicillin-streptomycin (pen-strep) (10,000 U/ml, Life Technologies, Germany) and 5% Fungizone (Life Technologies, Germany), as described by Islam et al. 28 After isolation, the cells were counted in a hemocytometer using a 4% trypan blue exclusion method. AMs (1 × 10⁵ cells/well in a 96-well plate, 5 × 10⁵ cells/well in a 24-well plate, and 2 × 10⁶ cells/well in a six-well plate) were cultured in Roswell Park Memorial Institute (RPMI)-1640 medium (Life Technologies, Germany) supplemented with 10% FBS (Life Technologies, Germany), 1% pen-strep, 1% Fungizone and 1% gentamicin (10 mg/ml, Life Technologies, Germany) in a 5% CO2 humidified cell culture incubator at 37℃ for 24 h. The cell culture medium was then changed at this time and every 2 d thereafter until d 9.
LPS and SFN treatment
We designed two experimental treatments with AMs. First, AMs at 5 × 10⁵ cells/well (24-well plate) and 1 × 10⁵ cells/well (96-well plate) were treated with LPS at different time points. On d 9, cells were treated with 0 (LPS0) or 5 µg/ml (LPS5) of LPS (LPS from Escherichia coli 0111:B4, Invivogen, USA) for 0, 1, 3, 6, 12, 24, 36, or 48 h. Cells without LPS treatment at 0 h were considered as the control. After checking the cell viability and CD14 gene expression results, AMs treated with 5 µg/ml of LPS for 12 h were used for further study.
In the second experiment, AMs were treated with SFN and LPS. S-Sulforaphane (Biomol GmbH, Germany) was prepared in dimethyl sulfoxide (DMSO, Sigma-Aldrich, USA,) and stored at a stock concentration of 50 mmol/l at −20℃. AMs (2 × 10⁶ cells/well) were treated with 0 (SFN0), 5 (SFN5), or 10 (SFN10) µmol/l SFN on d 7 (the maximum concentration of DMSO was 0.05% (v/v) in the medium) for 48 h, followed by LPS (0, 5 µg/ml) on d 9 for 12 h. The SFN-LPS treatments were divided into six groups: SFN0-LPS0, SFN0-LPS5, SFN5-LPS0, SFN5-LPS5, SFN10-LPS0 and SFN10-LPS5. The untreated group (SFN0-LPS0) was served as the control. SFN0-LPS5 was set as the positive control.
Cell viability assay
The cell viability of AMs with (1) LPS treatment at different time points and (2) SFN-LPS treatment sets were investigated with a WST-1 cell proliferation assay kit (Biomol GmbH, Germany). At the end of stimulation, the old cell supernatant was aspirated, and fresh AMs culture medium was added. Then, 10 µl of the reconstituted WST-1 solution was added to each well with a mixture using a pipette. Cells were incubated for 2 h at 37℃ in a 5% CO2 incubator, the supernatants were sucked into a new 96-well plate, and the absorbance of each sample was measured at a wavelength of 450 nm on a Synergy™ 2 plate reader (BioTek, Germany).
Quantitative cell viability data were expressed as mean ± SD, n = 3. The data were statistical analyzed with SAS (version 9.3) using a general linear model using the LPS and SFN treatments as fixed effects. *P < 0.05, **P < 0.01, and ***P < 0.001 were considered as statistically significant.
RNA extraction, complementary DNA (cDNA) synthesis, and quantitative real-time reverse transcription-polymerase chain reaction (qPCR)
Primers and their sequences for qPCR.
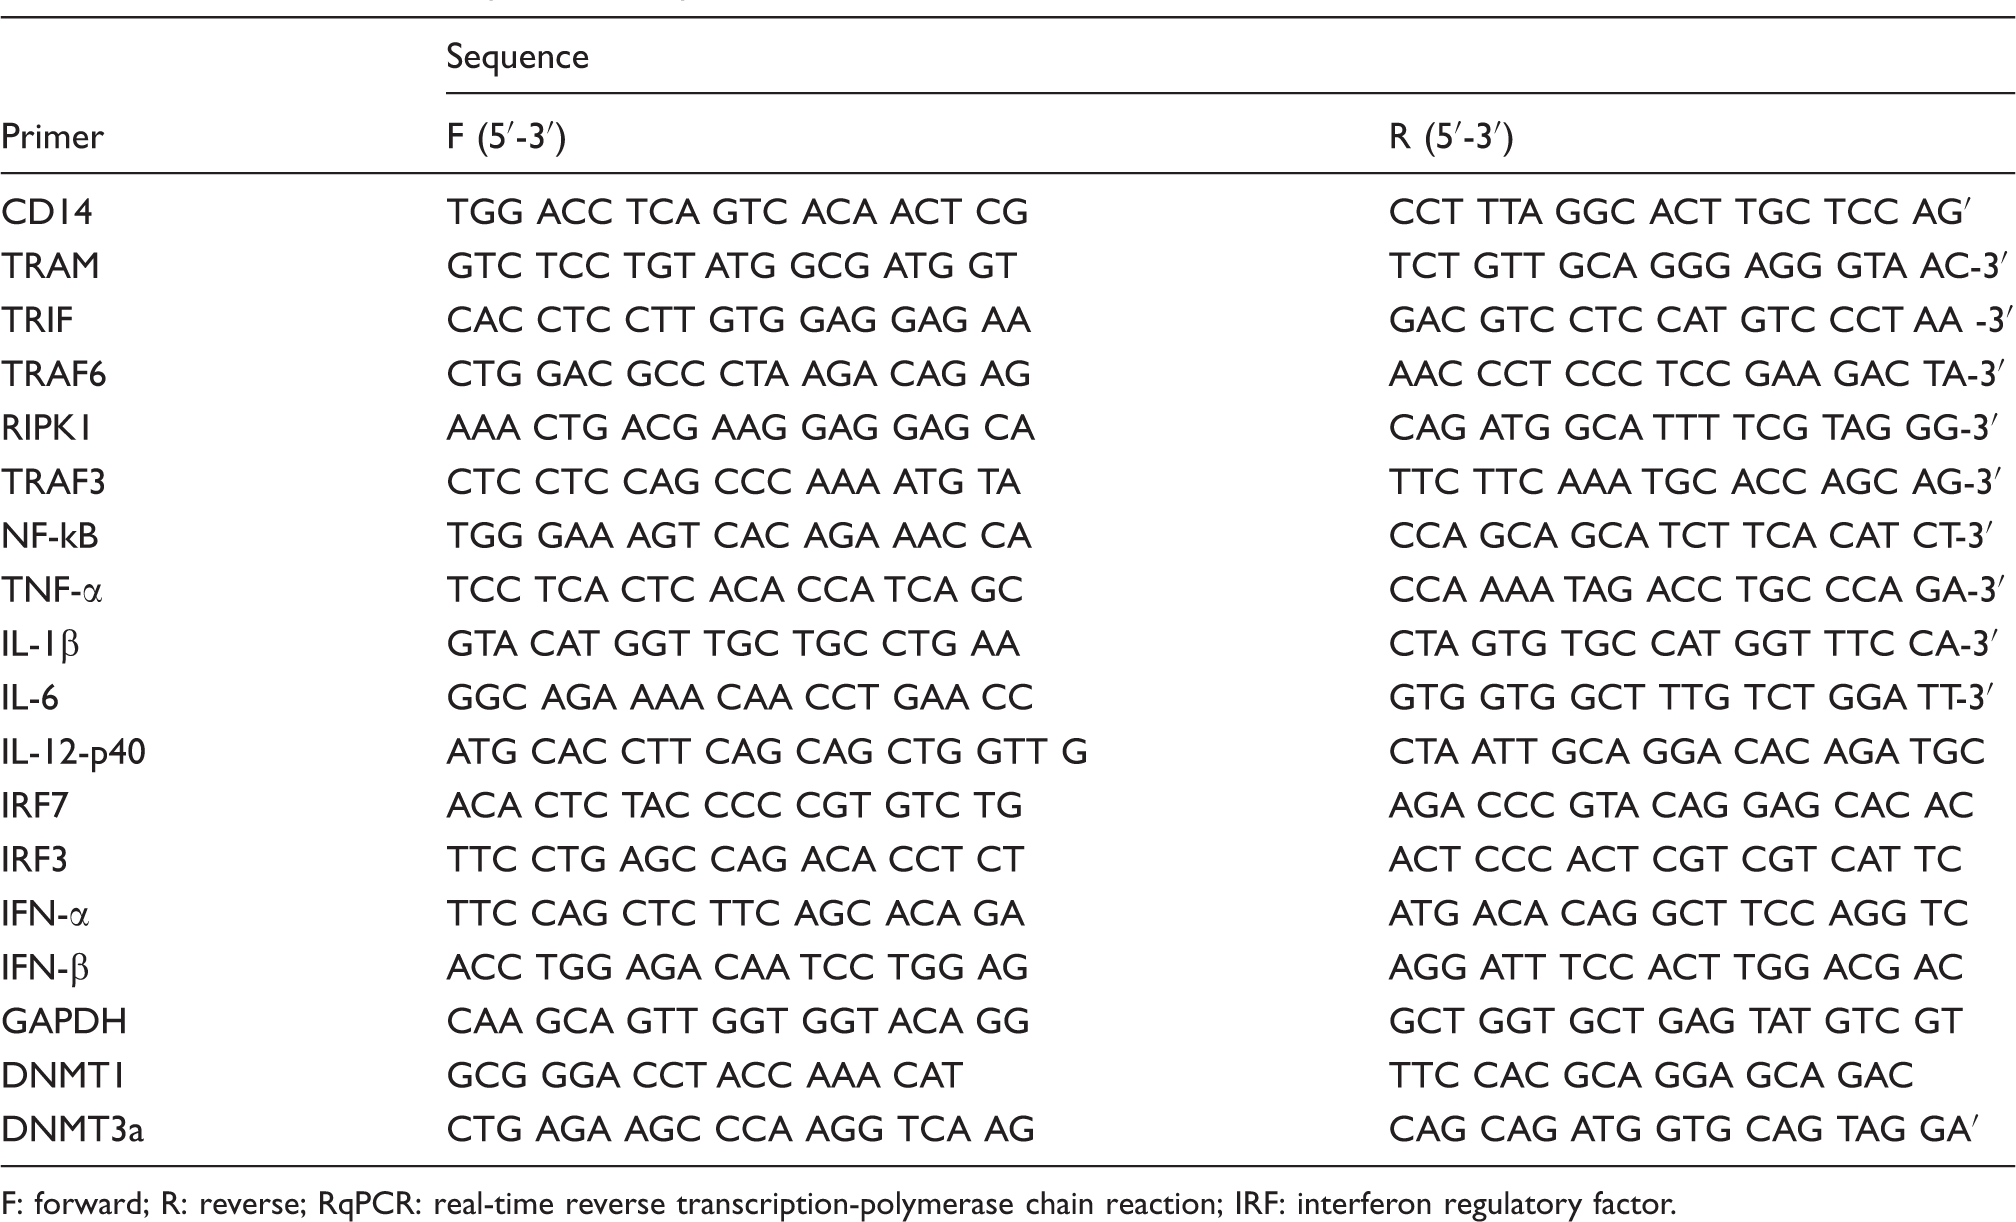
F: forward; R: reverse; RqPCR: real-time reverse transcription-polymerase chain reaction; IRF: interferon regulatory factor.
Gene-specific expression was measured relative to the geometric mean of the expression of a reference gene (GAPDH). The delta Ct (ΔCt) values were calculated as the difference between the target gene and reference gene:

The relative gene expression was calculated as 2(–ΔCt), and the fold change in expression between the treated and untreated AMs was calculated as 2(–ΔCttreated)/2(–ΔCtcontrol)29 (control: untreated group SFN0-LPS0). Relative gene expression levels were checked for outliers, which were identified when values deviated by more than three standard deviations from the raw mean. These extreme values were eliminated from subsequent analysis. Data were analyzed by SAS (version 9.3) with a linear mixed model:

Y: fold change; animal: random effect of the animal; e: residuals.
Group means were expressed as least square means (± standard error (SE)). The values were tested by a Dunnett-Hsu test in order to identify significant differences from the control group (SFN0-LPS0). In addition, a Tukey-Kramer test (pairwise comparisons) was performed to compare other classes with each other. P < 0.05 (* and #), P < 0.01 (** and ##), and P < 0.001 (*** and ###) were considered as statistically significant.
Cytokines protein quantification
The AMs culture supernatants were collected after stimulation with and without SFN for 48 h and with LPS for 12 h to measure cytokines by ELISA. Cytokine levels of IL-1β and TNF-α were measured using porcine-specific IL-1β and TNF-α ELISA kits (Abcam, UK) with minimum detectable dose sensitivities of 6 pg/ml and 20 pg/ml, respectively. Assays were conducted in 96-well microplates according to the manufacturer’s instructions, and the absorbance at 450 nm was measured on a Synergy™ 2 plate reader (BioTek, Germany). Data were expressed as the mean ± SD, n = 3. The statistical differences between protein level values were analyzed by SAS (version 9.3) using a general linear model. *P < 0.05, **P < 0.01, and ***P < 0.001 were considered as statistically significant.
Bisulfite sequencing
CD14 CpG islands prediction
The CpG islands (CGIs) of the whole CD14 promoter region and the complete coding sequence (CDS) (GenBank DQ079063.1, 1762 bp) 30 were identified using the Methprimer online tool.
Genomic DNA (gDNA) extraction and bisulfite conversion of gDNA
AMs treated with the aforementioned SFN-LPS combinations were used for gDNA isolation with an AllPrep® DNA/RNA/Protein Mini Kit (Qiagen, Germany). Sodium bisulfite methylation sequencing was performed to identify the methylation status of CD14 promoter and complete CDS. Three hundred ng of purified gDNA was used for bisulfite conversion according to the protocol of the EZ DNA Methylation-Direct™ Kit (Zymo Research, Germany). The bisulfite-converted gDNA was eluted in 10 μl of M-Elution Buffer, and the samples were stored at −20℃.
Bisulfite PCR amplification and PCR purification
Primers for bisulfite PCR.
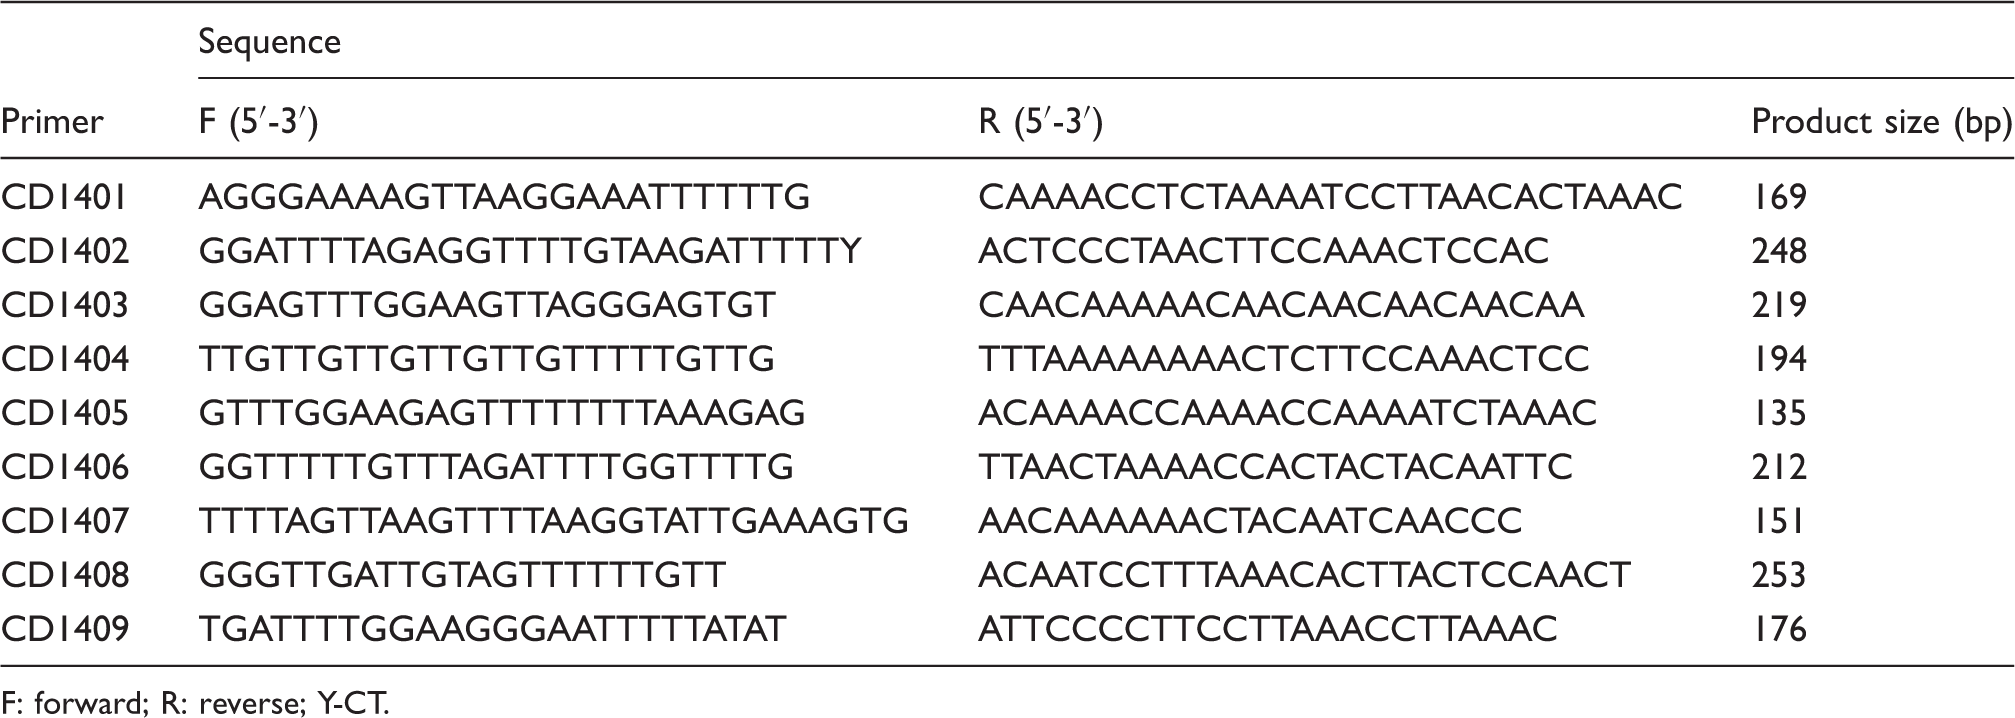
F: forward; R: reverse; Y-CT.
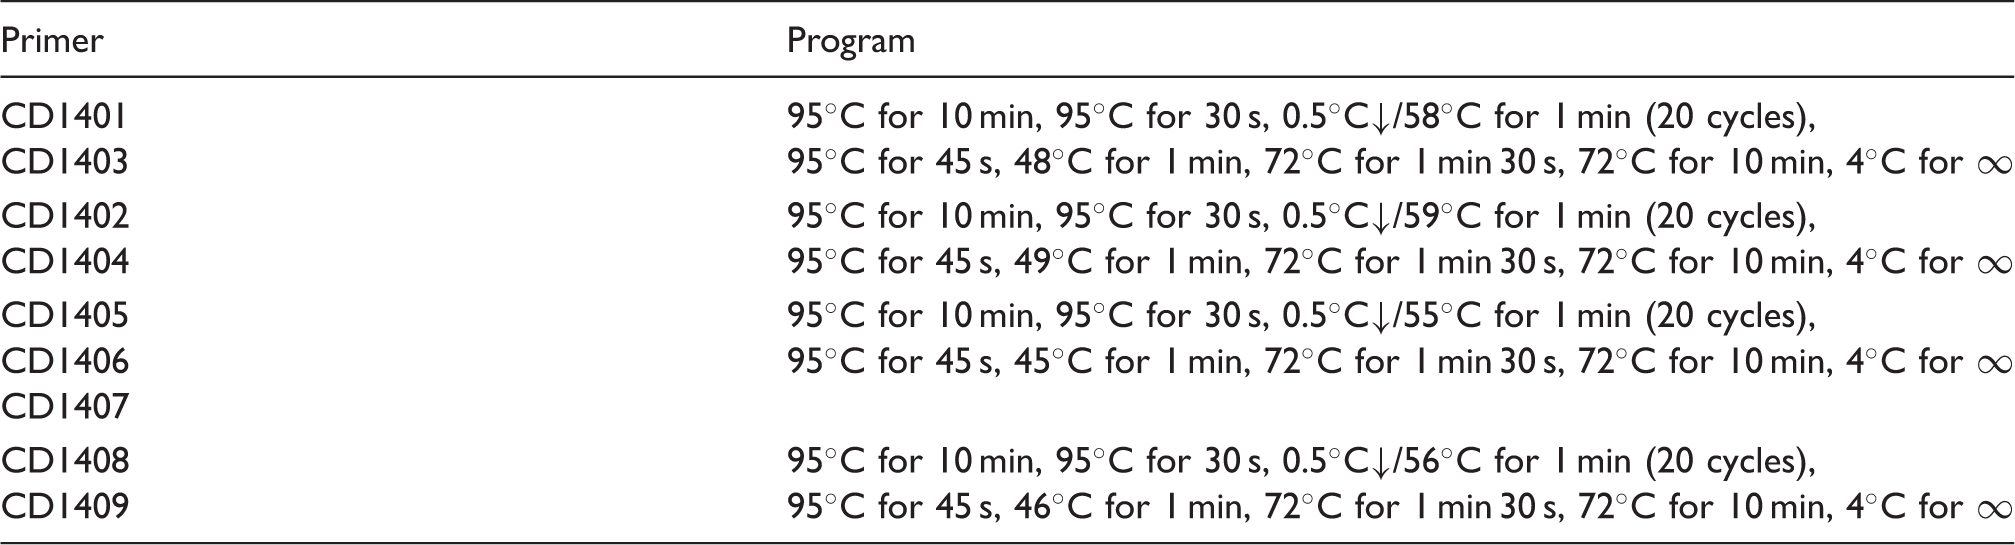
Program of touchdown PCR for bisulfite primers.
Cloning and cloning PCR
The purified bisulfite PCR products were cloned using pGEM®-T Easy Vector Systems (Promega GmbH, A3610). Purified bisulfite PCR products (3 µl) were used for the ligation, and 100 μl of each transformation cell solution was pooled onto duplicate LB/ampicillin/IPTG/X-Gal plates for cloning. The plates were incubated overnight (18 h) at 37℃. The white clones (16 to 24) were selected and picked up. Cloning PCR was performed by Taq DNA Polymerase with messier 13 (M13) primers (F 5′-TTG TAA AAG GAG GGC CAG T-3′, R 5′-CAG GAA ACA GCT ATG ACC, Tm-56℃): 95℃ for five min, 95℃ for 30 s, 56℃ for one min, 72℃ for one min (40 cycles), 72℃ for 10 min s,; 4℃ for ∞. To check the PCR products, 5 µl of each one was loaded onto 2% agarose gel. The gel was run at a voltage of 120 V for 30 min.
Sequencing and DNA methylation analysis
A minimum of eight different positive clones for each treatment sample were randomly selected for sequencing with M13 primer (forward primer). The sequencing was performed with a CEQ8000 sequencer system (Beckman Coulter). Bisulfite sequencing data were performed with default parameters using a BiQ Analyzer. Sequences with conversion rate below 90% were excluded from analysis. The DNA methylation status result of one sample was obtained from at least four sequences with successful sequencing (all four sequences showed the same results of DNA methylation status).
Results
LPS affects AMs cell viability in a time-dependent manner
Inflammatory conditions were induced with 5 µg/ml of LPS in cultured AMs. We first performed a cell viability assay to detect the cell number and activity to determine the effective but nontoxic duration of LPS treatment. The results show that at all time points, there was neither a difference between LPS-treated cells and the control nor between the untreated cells and the control (Figure 1(a)). When treated and untreated groups were compared, LPS had no noticeable effect on the cell viability after 1, 12 and 48 h of LPS post-stimulation (Figure 1(a)). The highest cell viability both of treated and untreated AMs in these three groups was observed at 12 h, which was therefore selected for further study.
AMs cell viability assay results. (a) Relative cell viability of AMs with and without 5 µg/ml LPS treatment (1, 3, 6, 12, 24, 36, 48 h). (b) Relative cell viability of AMs with and without SFN (5, 10 µM) and LPS (5 µg/ml) treatment. All of the data were expressed as the mean ± SD, n = 3. *, **, and *** indicate significant differences at P < 0.05, P < 0.01, and P < 0.001, respectively.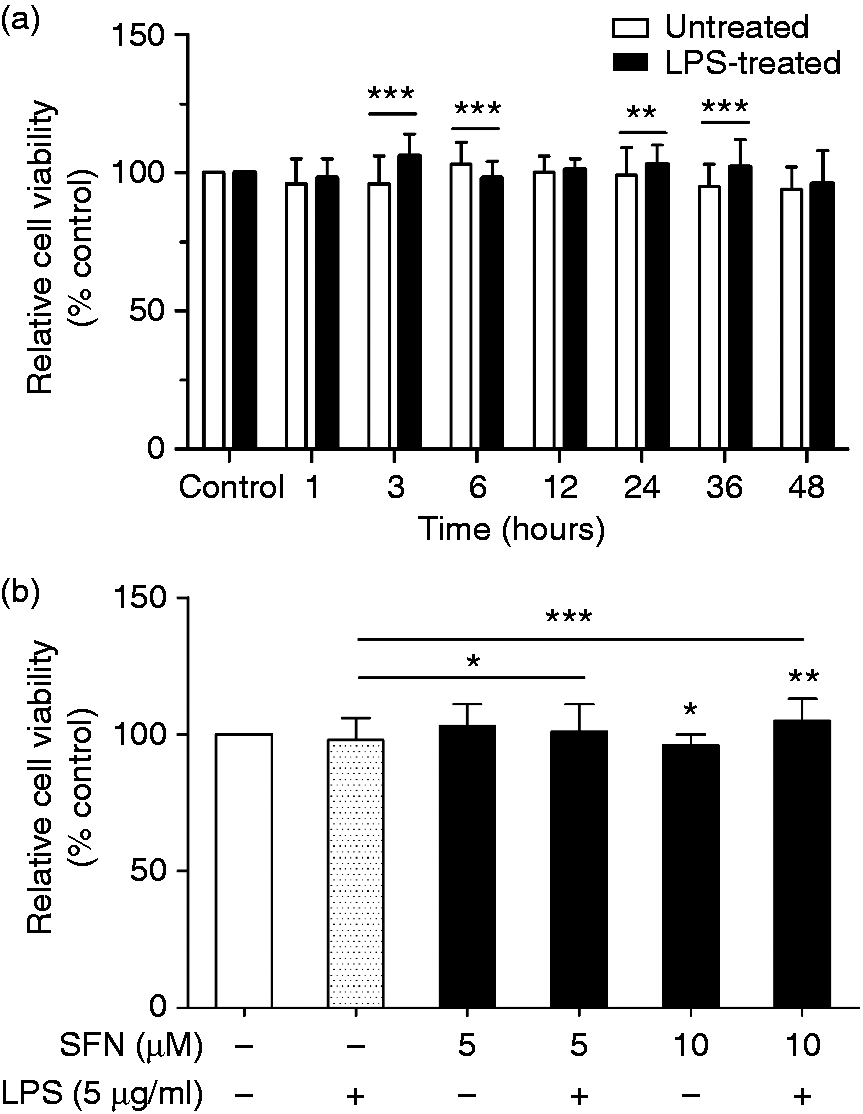
SFN affects AMs cell viability in a dose-dependent manner
In this study, two doses (5 μM and 10 μM) of SFN were chosen to avoid oxidative stress and apoptosis, which occurs at higher concentrations (≥ 20 μM) in vitro. 31 LPS treatment for 12 h was next used as a positive control (SFN0-LPS5). SFN was first added in different doses of 0, 5 and 10 µM on d 7 to determine the effective dose of SFN on AMs cell viability. The cell viability of SFN5-LPS0 and SFN5-LPS5 showed no differences compared to the control group (Figure 1(b)). There were significant differences between SFN10-LPS0 and SFN0-LPS0 (control), and between SFN10-LPS5 and SFN0-LPS0 (control) (Figure 1(b)). SFN pre-treatment significantly improved cell viability in LPS-treated AMs (SFN5-LPS5 and SFN10-LPS5) compared to the positive control (Figure 1(b)).
CD14 mRNA expression was induced by LPS at the time point of 12 h
qPCR was performed to investigate the potential effects of LPS on CD14 gene expression in AMs. The results show that LPS significantly induced CD14 gene expression at 1, 6, 12 and 24 h, while the highest expression occurred at 12 h (Figure 2). At this time, gene expression of CD14 in LPS-treated AMs was significantly higher than the untreated group (LPS0-12 h) and the control group (LPS0-0 h). These results indicated that LPS acts on the CD14 gene expression at 1, 6, 12 and 24 h, but the greatest effect was at 12 h (Figure 2).
Effect of LPS on CD14 mRNA expression in AMs. Fold change of CD14 in AMs with or without 5 µg/ml LPS treatment were assayed at seven time points (1, 3, 6, 12, 24, 36, 48 h). Fold change without LPS treatment at 0 h was set as the control. Comparison between treated and untreated cells is indicated by ‘*’. Comparison between treated group and control (0 h) is indicated by #. All of the data were expressed as least square means ± SE, n = 3. * (#), ** (##), and *** (###) indicate significant differences at P < 0.05, P < 0.01, and P < 0.001, respectively.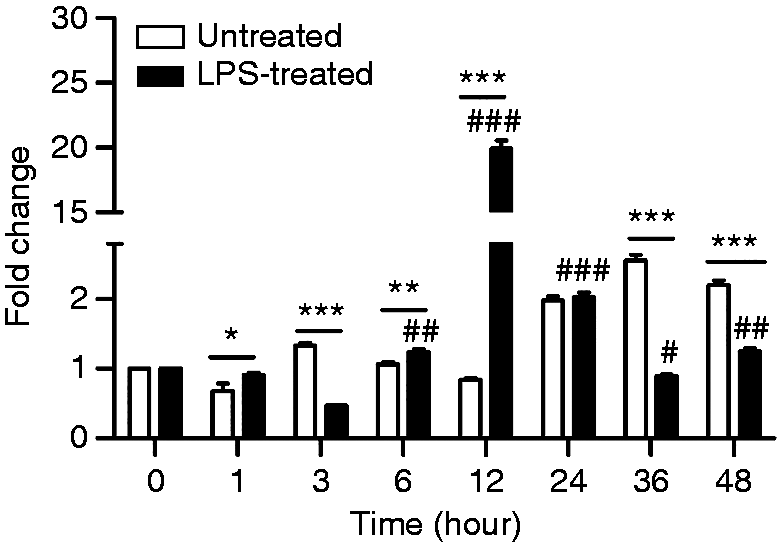
CD14 directly binds with LPS and activates the MyD88-dependent pathway,
10
and it might also be involved in the TRIF pathway by binding with LPS. Therefore, we analyzed AMs treated with 5 µg/ml of LPS for the mRNA expression of CD14 and downstream TRIF pathway genes, including TRAM, TRIF (Figure 3(a)), TRIF-TRAF6 sub-pathway genes (TRAF6, RIPK1, NF-kB, Figure 3(b)), and TRIF-TRAF3 sub-pathway genes (TRAF3, IRF7, IRF3, Figure 3(c)). LPS tended to induce TRAM and RIPK1 gene expression and significantly increased the gene expression of CD14, TRIF, TRAF6, NF-kB, TRAF3, and IRF7.
SFN affects the gene expression regulation of CD14 and downstream genes involved in the effects of the TRIF pathway in AMs. (a) Expression of CD14 and downstream genes TRAM and TRIF mRNA in SFN-LPS stimulated AMs. (b) Gene expression of TRIF-TRAF6 pathway genes in SFN-LPS treated AMs. (c) Gene expression of TRIF-TRAF3 pathway genes mRNA expression in SFN-LPS treated AMs. AMs with or without SFN treatment (5, 10 µM) for 24 h and LPS treatment (5 µg/ml) for 12 h were used in this assay. Fold change in AMs without SFN and without LPS treatment (SFN0-LPS0) was set as the control. Fold change in AMs without SFN treatment but with LPS treatment (SFN0-LPS5) was set as the positive control. Comparison between treatment group and control group is indicated by *. Comparison between SFN-treated group and the positive control is indicated by #. All of the data were expressed as least square means ± SE. n = 3. * (#), ** (##), and *** (###) indicate significant differences at P < 0.05, P < 0.01, and P < 0.001, respectively.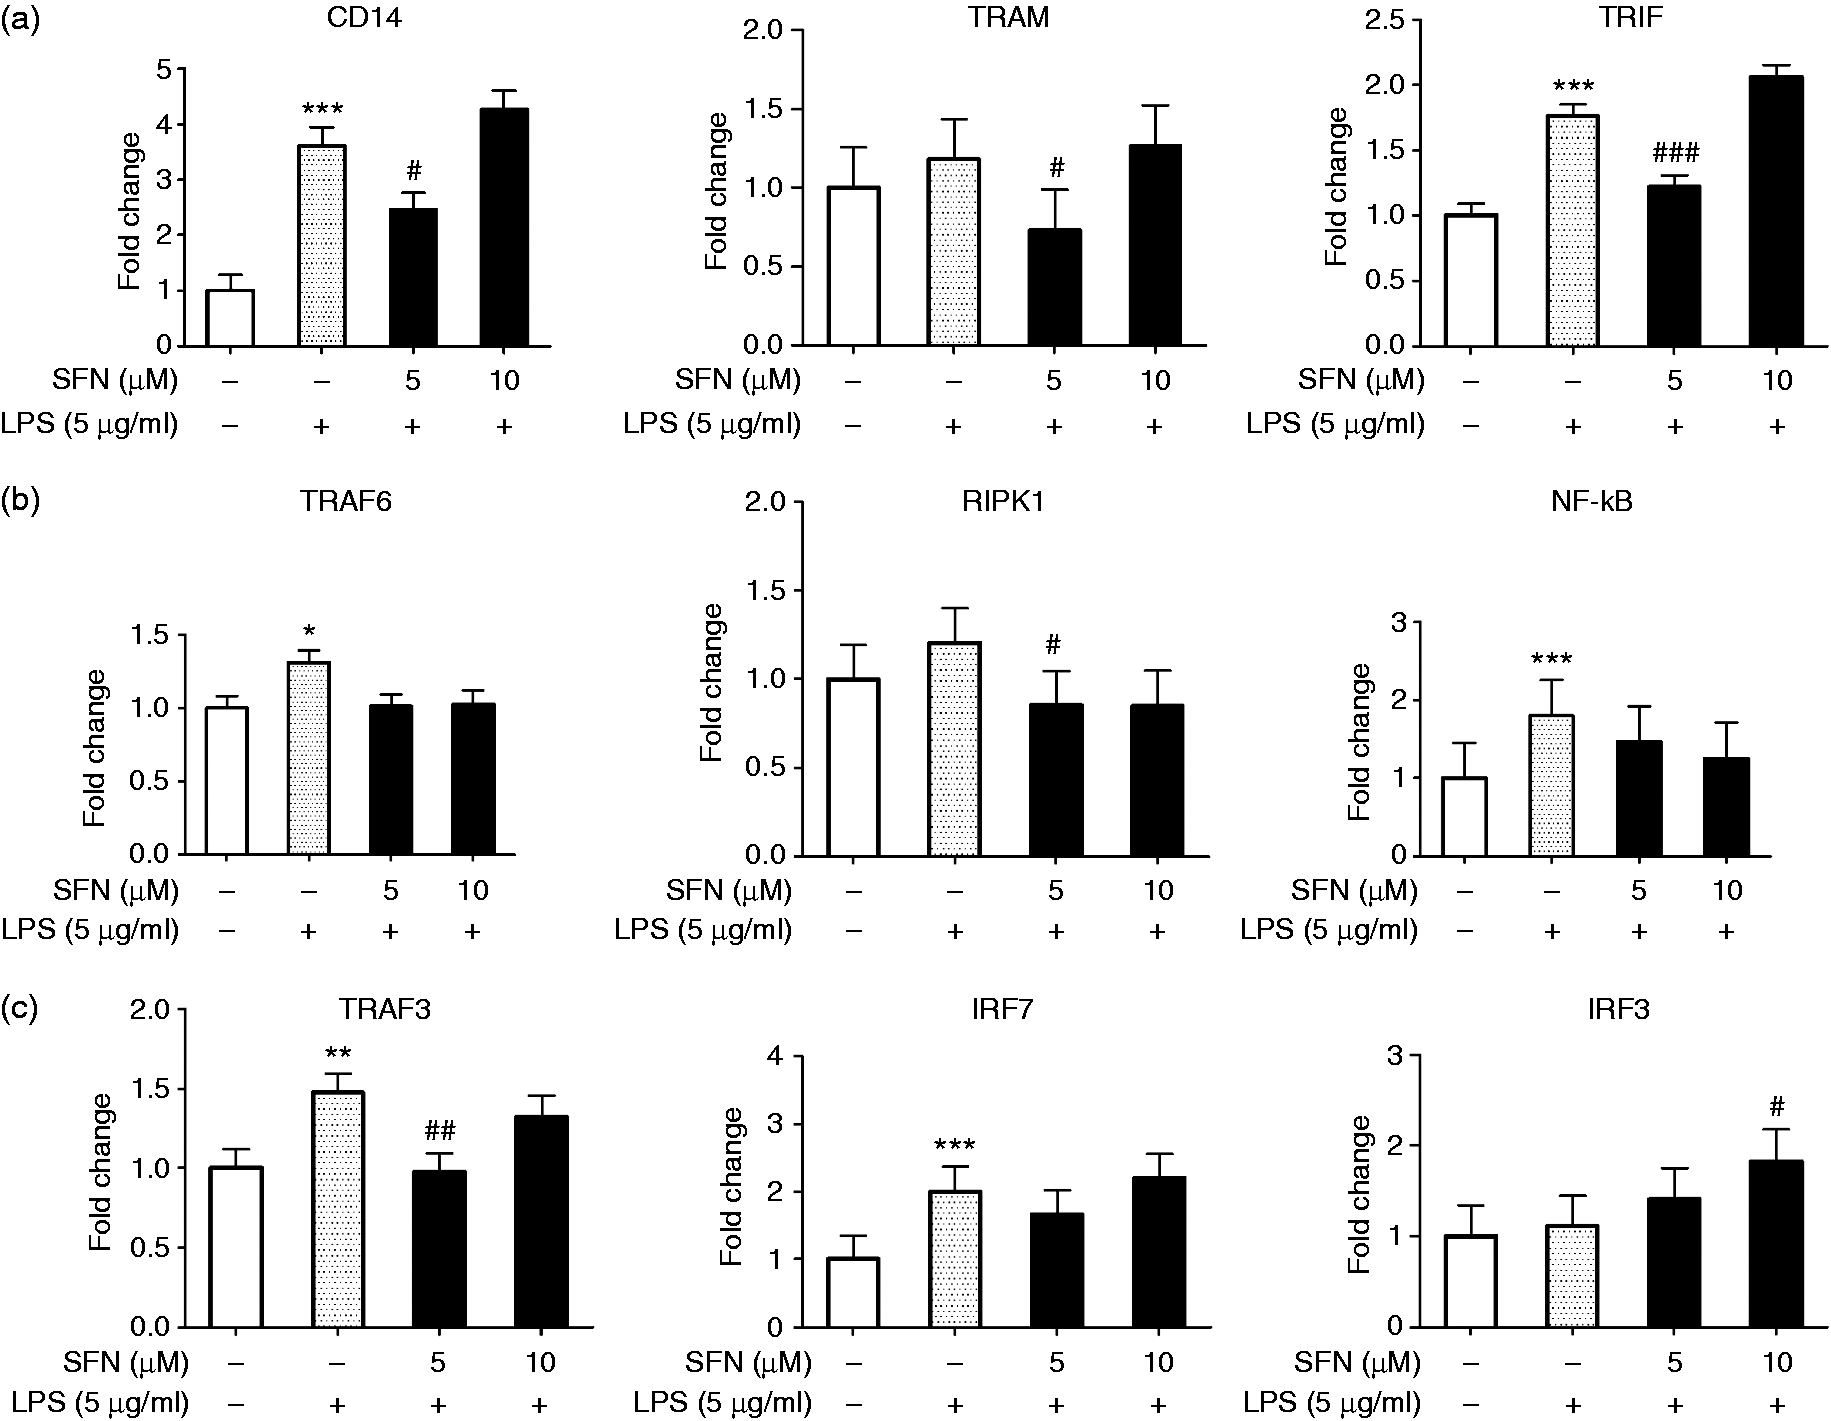
Gene expression of CD14 and downstream genes in the TRIF pathway were suppressed by 5 μM SFN
To explore the effect of SFN on the LPS-induced CD14-TRIF pathway, we examined the relative gene expression of CD14 and downstream genes in the TRIF pathway in SFN-LPS-treated AMs (Figure 3). The SFN0-LPS5 group was set as a positive control. The results clearly show that SFN pre-treatment at a dose of 5 µM significantly inhibited LPS-induced CD14 gene expression (Figure 3(a)). Similarly, gene expression of TRAM, TRIF, RIPK1 and TRAF3 in the SFN5-LPS5 group was significantly down-regulated compared to the positive control (Figure 3). These results suggest that the inhibitory effects of SFN on LPS-induced TRAM, TRIF, RIPK1 and TRAF3 at a dose of 5 µM might be mediated through decreased CD14 mRNA expression. The other genes, including TRAF6, NF-kB and IRF7, showed the same trend, with only IRF3 showing a contrary trend. The results of additional group comparisons can be found in Figure S1 and Figure S2 in the supplementary material.
Cytokine expression was induced by LPS but suppressed by SFN in AMs
In the CD14-TRIF pathway, LPS initiates the TRIF-TRAF6 sub-pathway to produce cytokines like TNF-α, IL-1β, IL-6, and IL-12, while it induces the cytokines expression in the TRIF-TRAF3 sub-pathway, including IFN-α and IFN-β. Therefore, the cytokine gene expression in LPS-stimulated AMs was quantified. The results show that gene expression of TNF-α, IL-1β, IL-6, and IFN-β was significantly increased by LPS treatment (Figure 4), while it was significantly decreased by SFN (Figure 4). Gene expression of LPS-induced TNF-α and IFN-β was significantly decreased in SFN5-LPS5-treated AMs compared to the positive control (Figure 4(a) – (c)). In both SFN5-LPS5 and SFN10-LPS5, SFN significantly inhibited LPS-induced IL-1β gene expression (Figure 4(a)). Gene expression of LPS-induced IL-6 was significantly suppressed by 10 µM of SFN compared to the positive control (Figure 4(b)). The results of additional group comparisons can be found in Figure S3 and Figure S4 in the supplementary material.
SFN altered the gene expression of cytokines in the TRIF pathway in AMs. (a) Relative gene expression of TRIF-TRAF6 pathway-released cytokines in SFN-LPS-treated AMs. (b) Relative gene expression of TRIF-TRAF3 pathway-released cytokines in SFN-LPS-treated AMs. AMs with or without SFN treatment (5, 10 µM) for 24 h and LPS treatment (5 µg/ml) for 12 h were used in this assay. Fold change in AMs without SFN and without LPS treatment (SFN0-LPS0) was set as the control. Fold change in AMs without SFN treatment but with LPS treatment (SFN0-LPS5) was set as the positive control. Comparison between treatment group and control group is indicated by *. Comparison between SFN-treated group and the positive control is indicated by #. All of the data were expressed as least square means ± SE, n = 3. * (#), ** (##), and *** (###) indicate significant differences at P < 0.05, P < 0.01, and P < 0.001, respectively.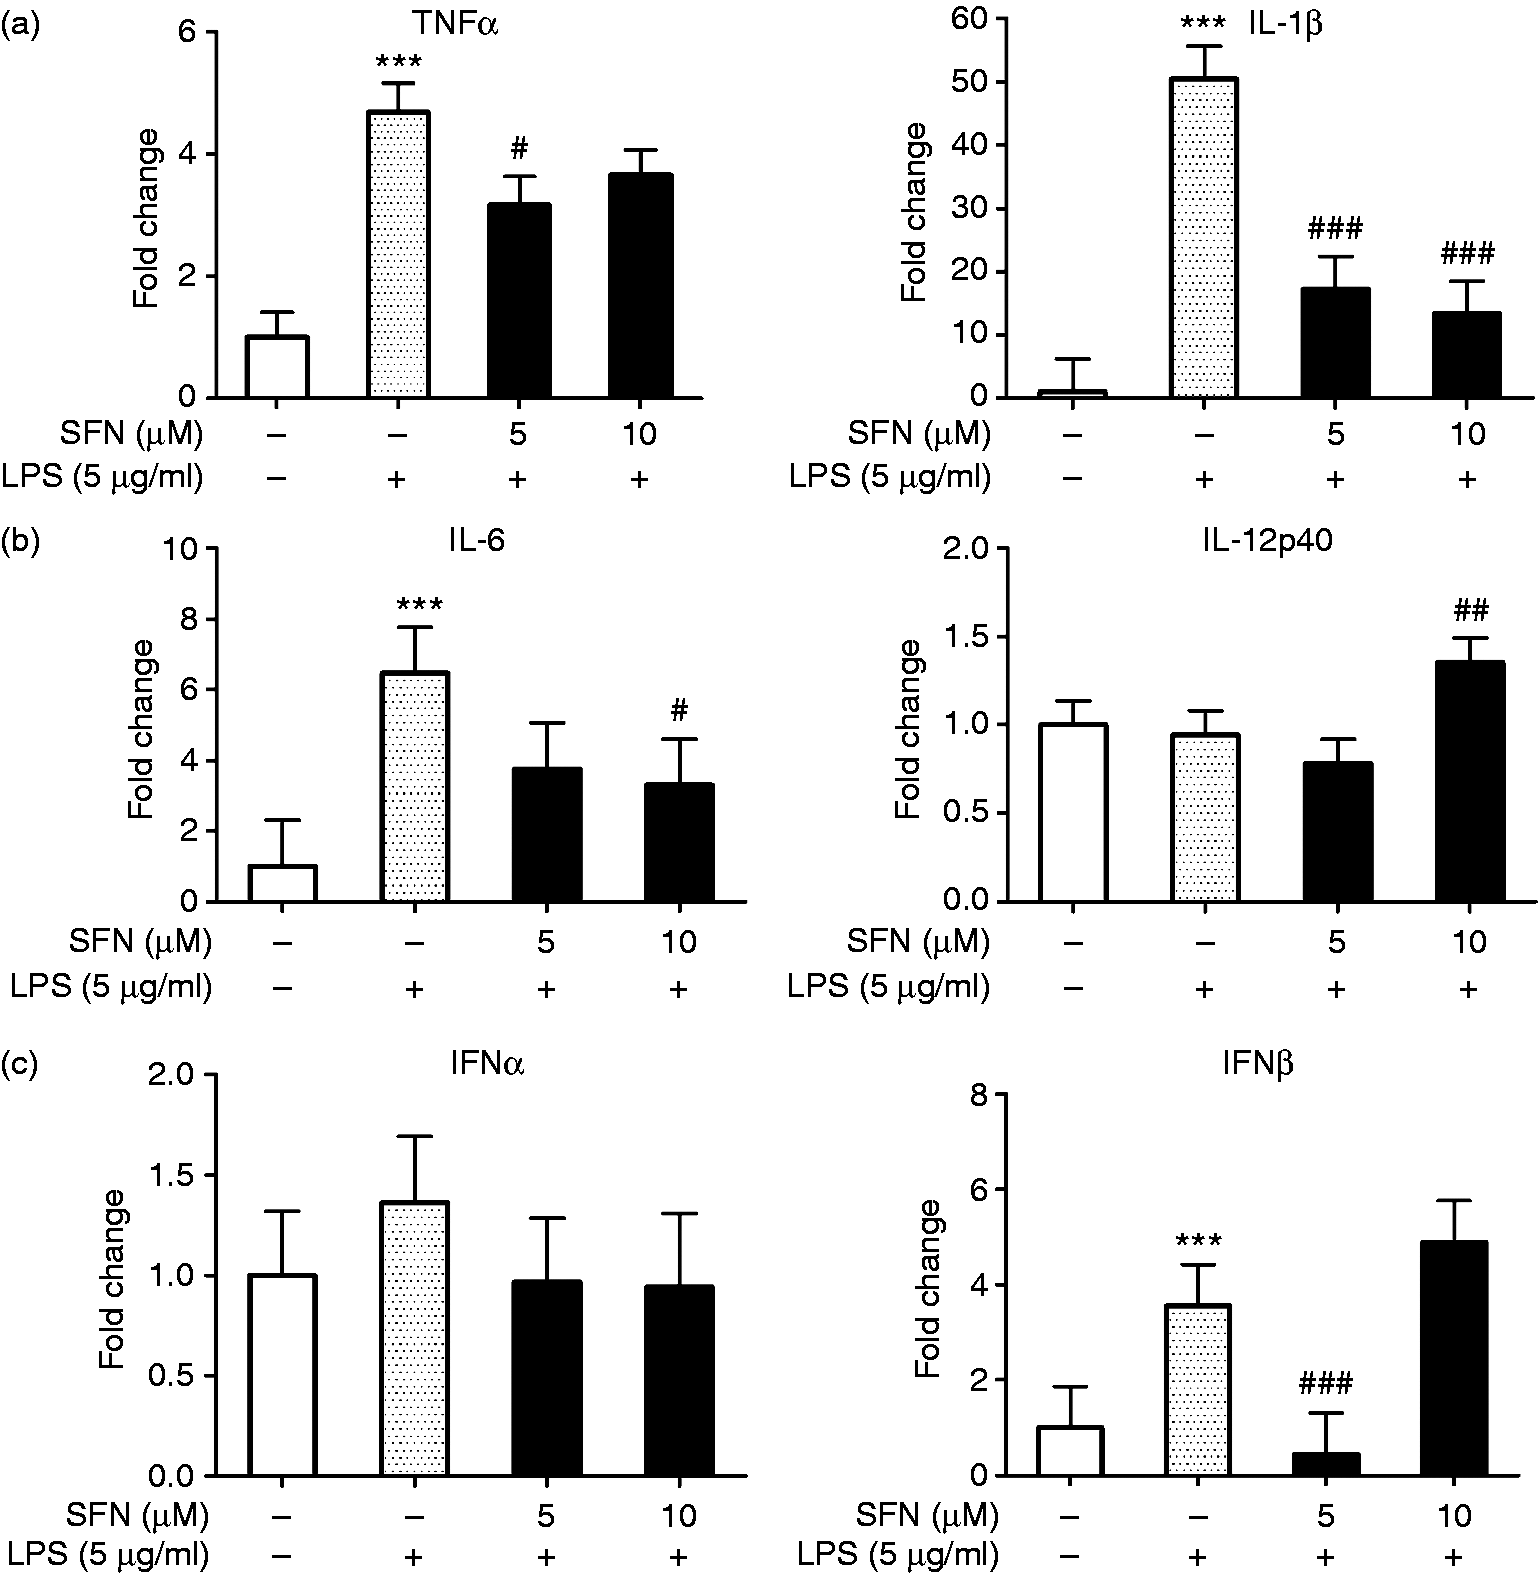
The release levels of TNF-α and IL-1β were examined by ELISA. Similar to the gene expression results, we found that the LPS treatment also significantly increased the levels of TNF-α and IL-1β protein (Figure 5). Furthermore, the TNF-α level was significantly suppressed in both SFN5-LPS5 and SFN10-LPS5-treated AMs compared to the positive control. IL-1β was significantly inhibited in SFN5-LPS5 compared to the positive control (Figure 5).
Pro-inflammatory cytokine levels altered by SFN treatment in AMs. Levels of (a) TNF-α and (b) IL-1β were measured by ELISA. AMs with or without SFN treatment (5, 10 µM) for 24 h and LPS treatment (5 µg/ml) for 12 h were used in this assay. Cytokine level in AMs without SFN and without LPS treatment (SFN0-LPS0) was set as the control. Cytokine level in AMs without SFN treatment but with LPS treatment (SFN0-LPS5) was set as the positive control. Comparison between SFN-treated group and the positive control is indicated by #. All of the data were expressed as mean ± SD, n = 3. * (#), ** (##), and *** (###) indicate significant differences at P < 0.05, P < 0.01, and P < 0.001, respectively.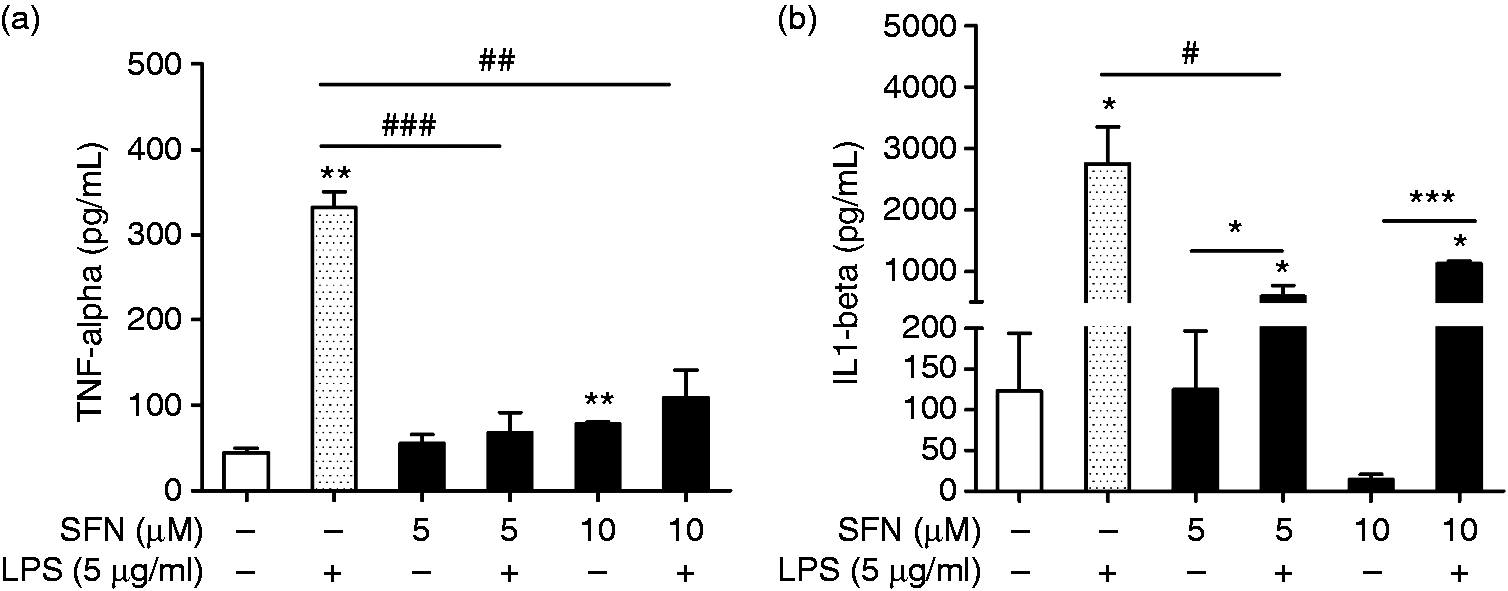
The expression levels of DNMT1 and DNMT3a were altered by SFN
The abnormal gene expression of CD14 and downstream genes may be caused by epigenetic mechanisms. DNMTs are the family of enzymes that catalyze the methyl reaction by transferring a methyl group from S-adenosylmethionine to the 5 position of cytosine on CpG dinucleotides.
32
To know more about the epigenetic modulations that occur in CD14 regulated by SFN, we examined the expression of DNMT1 and DNMT3a in SFN-LPS-treated AMs. To our surprise, DNMT3a gene expression was increased by LPS but significantly suppressed by SFN treatment at a dose of 5 µM (Figure 6(b)). The SFN-mediated inhibition of DNMTs (especially DNMT3a) could be an important contributing factor in CD14 DNA methylation regulation and the role of SFN in anti-inflammation. The results of additional group comparisons can be found in Figure S5 and Figure S6 in the supplementary material.
SFN altered expression levels of (a) DNMT1 and (b) DNMT3a genes. Relative DNMT1 and DNMT3a gene expression were measured in SFN-LPS-treated AMs. AMs with or without SFN treatment (5, 10 µM) for 24 h and LPS treatment (5 µg/ml) for 12 h were used in this assay. Fold change in AMs without SFN and without LPS treatment (SFN0-LPS0) was set as the control. Fold change in AMs without SFN treatment but with LPS treatment (SFN0-LPS5) was set as the positive control. Comparison between SFN-treated group and the positive control is indicated by #. All of the data were expressed as least square means ± SE, n = 3. # indicates significant differences at P < 0.05.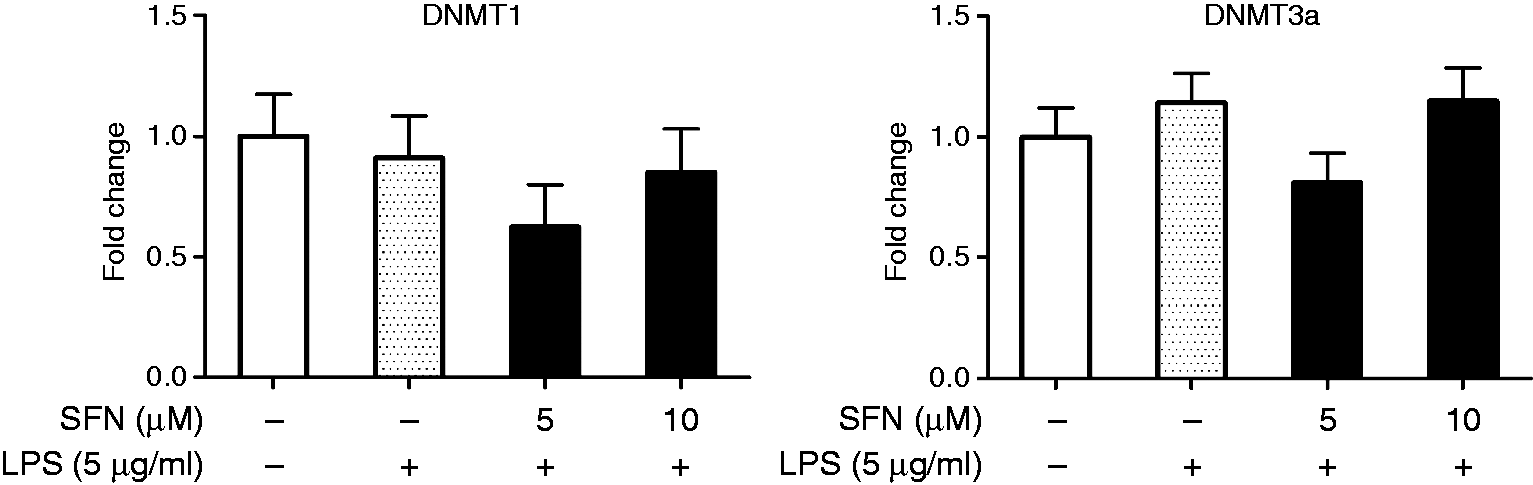
Gene body (CDS) methylation of CD14 was inhibited by SFN in LPS-treated AMs
It is well known that DNA methylation plays an important role in gene regulation and gene expression. To further explore the epigenetic regulation of CD14 in the TRIF pathway in SFN-LPS-treated AMs and the molecular mechanism of SFN-induced CD14 repression, we analyzed the DNA methylation status of the CD14 promotor region and (gene body) CDS region using bisulfite sequencing. The distribution of CpG islands and CpG sites in the CD14 promotor contain 5′-UTR (1 – 492 bp) and CDS (493 – 1694 bp) (GenBank DQ079063.1, 1762 bp of whole sequence) was predicted using MethPrimer. Two CpG islands were found in the whole sequence: one with a length of 196 bp starting from 400 bp to 595 bp and another from 601 bp to 1417 bp (Figure 7). In total, 135 CpG sites were found in the whole sequence, including 22 CpGs in the promotor and 5’-UTR regions, and another 113 in the CDS region (Figure 7).
CpG island prediction of CD14 promotor and CDS. Primers 1 to 9 are the bisulfite PCR primer regions in the CD14 promotor and CDS. CDS: coding sequence.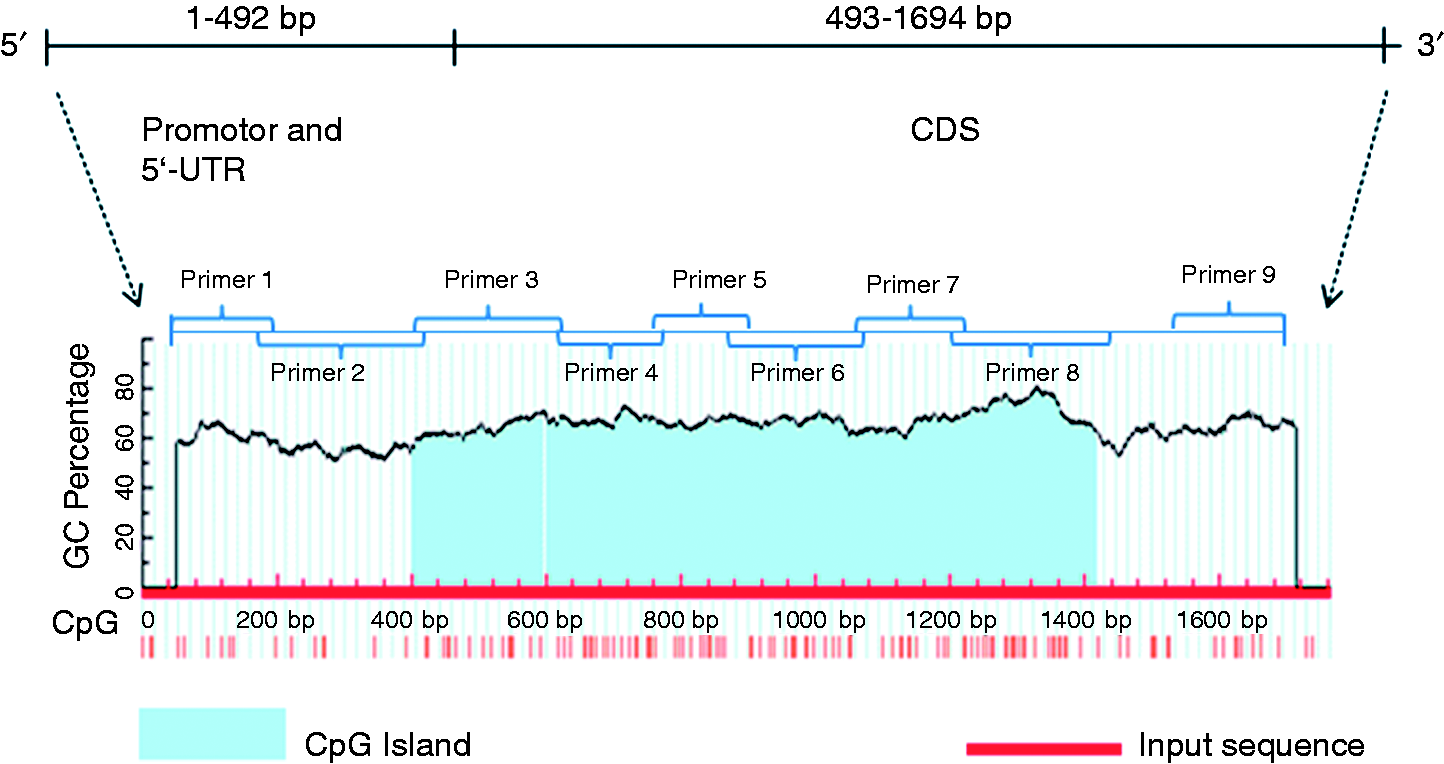
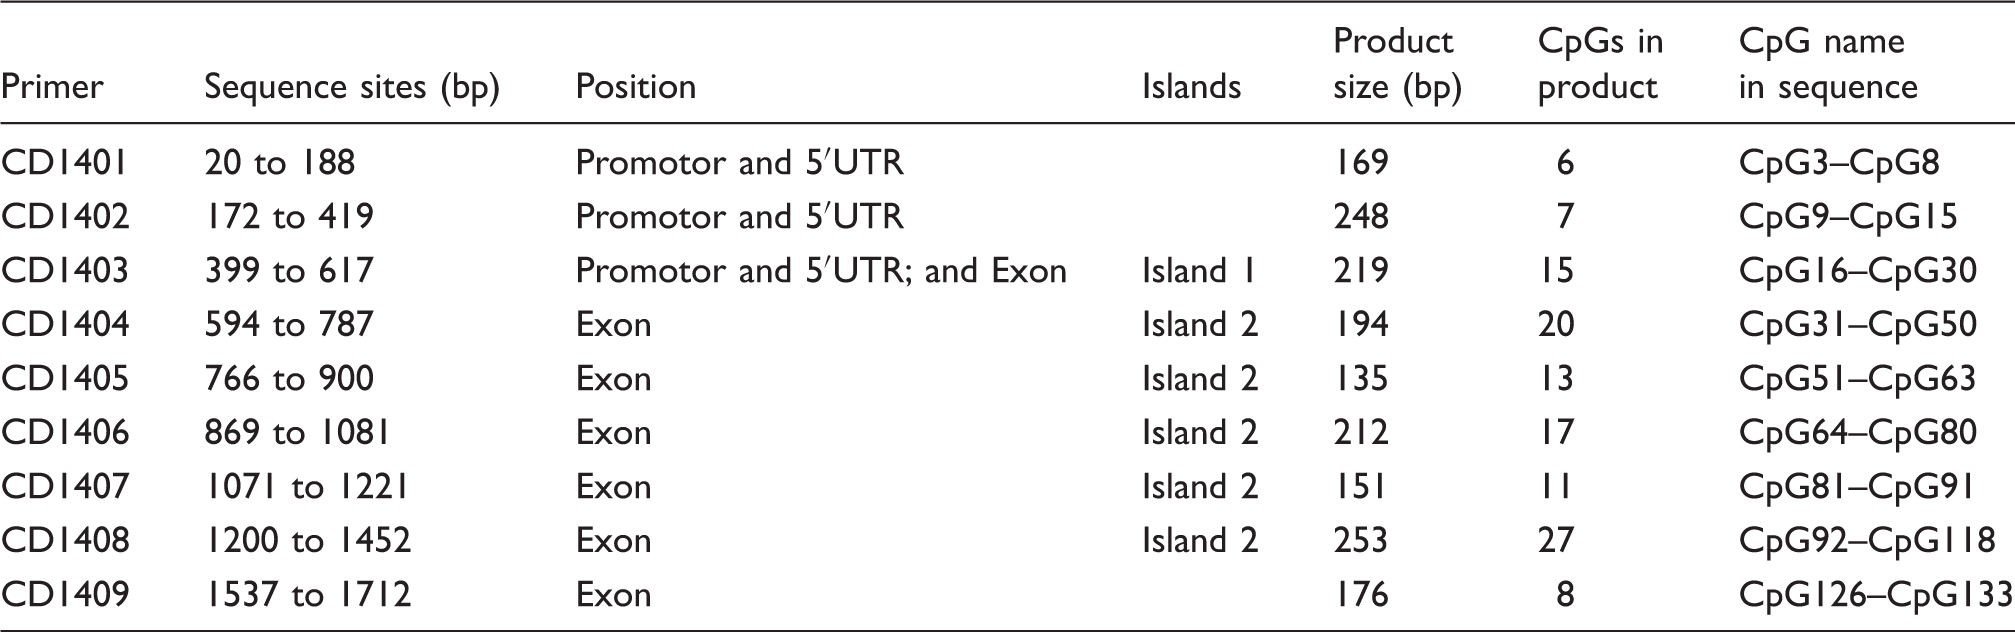
CpGs in the products of primers and their positions in the original sequence.

CD14 methylation alteration was induced by SFN in AMs. (a) Methylation status of the CD14 promotor and 5’-UTR region of AMs treated with SFN (0, 5, 10 µM) and LPS (0, 5 µg/ml). There was no methylation alteration in CD14 promotor and 5’-UTR. (b) Methylation status of the CD14 CDS region of AMs treated with SFN (0, 5, 10 µM) and LPS (0, 5 µg/ml). At least eight white cloning PCR products were used for sequencing. The result of one sample shown above is from at least four sequences (all four showed the same results of DNA methylation status). CD14 methylation in CDS (primer 6 and primer 9) were increased by LPS but suppressed by SFN. Blue squares (): un-methylated; red squares ( ): methylated; open squares: unknown; Blank lines (
 ): sequence of each primer product.
In LPS-induced AMs, the methylation status of CD14 in primer 6 with both SFN5-LPS5 and SFN10-LPS5 cells was suppressed. Similar results were found in the primer 9 region, where methylation was induced by LPS and resulted in 25% methylation in SFN0-LPS5 AMs, compared to only 12.5% methylation in the control group. Methylation was repressed by SFN, which led to 0% methylation in cells treated with SFN5-LPS0 and SFN10-LPS0. In LPS-induced AMs, demethylation was shown in the SFN10-LPS5 group (12.5% methylation) but not in SFN5-LPS5 (25% methylation) in this region.
Discussion
LPS leads to inflammation in mammals by inducing the production of inflammation cytokines, including TNF-α and IL1-β in macrophages.3,33 CD14 is a PRR that binds directly to LPS and facilitates the TRIF pathway. 34 As a histone deacetylase (HDAC) inhibitor, SFN has an anti-inflammatory effect. 22 In the present study, we demonstrated that CD14 mediates the LPS-induced TRIF pathway in AMs to secrete proinflammation and inflammatory cytokines. Additionally, SFN inhibited the LPS-induced inflammation in the TRIF pathway by CD14 regulation through epigenetic alteration.
CD14 is responsible for binding with LPS and transfers LPS molecules to TLR4/MD2. 35 It has been associated with the immune-phenotype variation and IFN-γ secretion in LPS-stimulated skin fibroblasts. 36 CD14 gene knockdown in macrophages inhibited the secretion of inflammatory cytokines induced by LPS, including IL-6 and TNF-α. 9 CD14 takes part in the induction of inflammatory response, and E. coli induces LPS-dependent production of IL-8 in vitro. 7 Nonetheless, it is unclear whether CD14 is involved in LPS-induced TRIF signals. This is in accordance with previous findings that LPS induces CD14 mRNA expression in AMs of pigs. 37 We found that CD14 gene expression was significantly increased by treatment with 5 µM of LPS for 12 h. Meanwhile, the mRNA expression of the downstream genes TRIF, TRAF6, NF-kB, TRAF3 and IRF7 were also up-regulated significantly. The mRNA expression of inflammation cytokines, including TNF-α, IL-1β, IL-6, and IFN-β, were significantly up-regulated in LPS-stimulated AMs. Importantly, CD14 mediated the TRIF signals and induced inflammatory cytokine expression in LPS-challenged AMs.
Epigenetic control, including DNA methylation and histone acetylation, may play a crucial role in regaining immune-responsive genes related to pathogen recognition and subsequent signaling. 38 Recent research presented chemical inhibitors such as 5-aza-2-deoxycytidine (AZA), trichostatin A (TSA), and SFN as epigenetic modifiers.19,39–41 As an HDAC inhibitor, SFN also has anti-cancer, 20 along with anti-inflammatory activity.22,23 SFN suppresses the LPS-induced secretion of inflammatory mediators like TNF-α, IL-1β, and IL-6.42,43 We found that 5 µM of SFN suppresses the gene expression of CD14 and its downstream genes, including TRAM, TRIF, RIPK1, and TRAF3, which are involved in the TRIF pathway for recognizing LPS or bacteria. In addition, SFN also suppresses the production of LPS-induced inflammatory cytokines in a dose-dependent manner, including TNFα, IL-1β, IL-6, IFN-α, and IFN-β. As shown, CD14 gene expression was significantly up-regulated in LPS-induced AMs but suppressed in SFN5-LPS5 AMs. These data indicate that CD14 may play an important role in the LPS-induced TRIF pathway and the process of inflammation.
Many studies have shown that the DNA methylation modification that occurs in gene promoters is a key molecular mechanism that leads to gene expression changes. 44 Studies recently demonstrated that DNA methylation in a gene body also leads to altered gene expression. 45 DNA methylation of a gene body region can alter gene expression, which is shown by a positive correlation. 39 The high densities of hypo-methylated CpG-rich regions crossing the gene body are preferentially associated with gene down-regulation. 46
Although several recent studies investigated the role of gene body DNA methylation in gene expression, its function is poorly understood. To identify potential epigenetic changes that mediate the effect of SFN on CD14 gene expression, we assessed the methylation status of CpG islands embedded in the CD14 promotor and the whole CDS (gene body) region. Surprisingly, our results showed that there was no methylation change in the CD14 promotor either within or beyond the CpG islands, but methylation alterations were found in the CD14 gene body region (Figure 8(b)). The results showed that CD14 gene body methylation was induced by 5 µM of LPS in AMs (Figure 8(b), primer 6 and primer 9 region). Therefore, CD14 gene expression was increased in LPS-treated AMs. These results indicate that gene body DNA methylation is positively connected with CD14 gene expression.
However, CD14 gene body methylation was decreased by HDAC inhibitor SFN. The results showed that CD14 gene body methylation was inhibited by both 5 µM SFN and 10 µM SFN (Figure 8(b)). Unexpectedly, the gene body regions show sustained DNA demethylation and down-regulation of gene expression after SFN treatment. It is possible that the CD14 gene expression suppressed by SFN depends on the methylation inhibition of the CD14 gene body in LPS-induced AMs. Therefore, CD14 plays a role as not only an LPS-receptor, but also as an LPS-induced inflammation regulator that mediates the TRIF pathway genes along with the expression and secretion of cytokines through the epigenetic changes in gene body methylation by SFN.
Another important discovery is that changes in CD14 DNA methylation may be related to the expression of DNA methylation enzymes DNMT1 and DNMT3a. It is well known that DNMT1 is the key maintenance methyltransferase, whereas DNMT3a and DNMT3b play roles in de novo activity. We found that SFN down-regulated LPS-induced DNMT3a mRNA expression at the dose of 5 µM. It is suggested that CD14 is involved in the TRIF pathway and the suppression of LPS-induced CD14 gene expression is associated with the suppression of CD14 gene body methylation, which might be caused by the down-regulation of DNMT3a gene expression in AMs due to SFN pre-treatment.
In summary, we have demonstrated that CD14 is involved in the TRIF pathway by LPS treatment at the time point of 12 hours. The possible epigenetic mechanisms were also explored, such as demethylation in the gene body region related to CD14 repression in SFN pre-treated AMs. This alteration in DNA methylation is probably related to DNMT3a expression.
Supplemental Material
Supplemental material for LPS-induced expression of CD14 in the TRIF pathway is epigenetically regulated by sulforaphane in porcine pulmonary alveolar macrophages
Supplemental Material for LPS-induced expression of CD14 in the TRIF pathway is epigenetically regulated by sulforaphane in porcine pulmonary alveolar macrophages by Qin Yang, Maren J Pröll, Dessie Salilew-Wondim, Rui Zhang, Dawit Tesfaye, Huitao Fan, Mehmet U Cinar, Christine Große-Brinkhaus, Ernst Tholen, Mohammad A Islam, Michael Hölker, Karl Schellander, Muhammad J Uddin and Christiane Neuhoff in Innate Immunity
Footnotes
Acknowledgments
We thank Ludger Buschen from the Frankenforst Experimental Research Station for Animal Husbandry, Nadine Leyer for performing sequencing, and Helga Brodeßer and Stephanie Fuchs for technical assistance. We would like to extend acknowledgment to the China Scholarship Council for supporting Qin Yang.
Declaration of Conflicting Interests
The author(s) declared no potential conflicts of interest with respect to the research, authorship, and/or publication of this article.
Funding
The author(s) received no financial support for the research, authorship, and/or publication of this article.
References
Supplementary Material
Please find the following supplemental material available below.
For Open Access articles published under a Creative Commons License, all supplemental material carries the same license as the article it is associated with.
For non-Open Access articles published, all supplemental material carries a non-exclusive license, and permission requests for re-use of supplemental material or any part of supplemental material shall be sent directly to the copyright owner as specified in the copyright notice associated with the article.