
Abstract
Resident macrophages play a central role in maintaining tissue homeostasis and immune surveillance. Here, we used single cell-based qPCR coupled with flow cytometry analysis to further define the phenotypes of large and small resident peritoneal macrophages (LPMs and SPMs, respectively) in mice. We demonstrated that the expression of Cxcl13, IfngR1, Fizz-1 and Mrc-1 clearly distinguished between LPMs and SPMs subsets. Using these markers, the dynamics of peritoneal macrophages in a Staphylococcus aureus-induced peritonitis model were analyzed. We found that S. aureus infection triggers a massive macrophage disappearance reaction in both subsets. Thereafter, inflammatory monocytes rapidly infiltrated the cavity and differentiated to replenish the SPMs. Although phenotypically indistinguishable from resident SPMs by flow cytometry, newly recruited SPMs had a different pattern of gene expression dominated by M2 markers combined with M1 associated features (inos expression). Interestingly, S. aureus elicited SPMs showed a robust expression of Cxcl13, suggesting that these cells may endorse the role of depleted LPMs and contribute to restoring peritoneal homeostasis. These data provide information on both resident and recruited macrophages dynamics upon S. aureus infection and demonstrate that single-cell phenotyping is a promising and highly valuable approach to unraveling macrophage diversity and plasticity.
Introduction
Macrophages are central to the maintenance of tissue homeostasis as they contribute to the initiation, progression and resolution of inflammation after infections or tissue injury. 1 The macrophage population is highly heterogeneous and reflects its adaptation to distinct tissue environments and specialized functions. The analysis of several molecular markers is often needed to achieve a precise characterization of different macrophage subsets. Under inflammatory conditions, this task is even more complex as resident macrophages are partly or totally depleted and further replenished through the recruitment of blood monocytes or local proliferation. 2 The study of the peritoneal macrophage (PM) population has proven useful to better understand these cellular dynamics. Indeed, since the studies of Cohn,3–5 spectacular progress has been made in highlighting the ontogeny of PMs and in unraveling their dynamics at homeostasis and during inflammation of the peritoneal cavity. Current knowledge has recently been collated in an extensive review. 6 Briefly, resident PMs are composed of two subsets that can be distinguished by flow cytometry based on their size and the differential expression of several cell surface markers. 7 Large PMs (LPM), which are defined as F4-80high and MHC IIlow cells, account for most of the mouse PM population (± 90%), whereas small PM (SPM) are F4-80low and express high levels of MHC II molecules.7,8 At steady state, LPMs are long-lived cells originating independently from hematopoiesis, as suggested by their high expression of F4-80, which is considered as a hallmark of yolk sac progenitors.9,10 Their renewal is likely to occur within the omentum, a connective tissue of the abdominal organs. 11 Conversely, SPMs are short-lived cells originating from circulating monocytes. Upon inflammatory conditions, the LPM subset undergoes a macrophage disappearance reaction (MDR) as a result of various cell processes, including migration, death or adherence (reviewed in Barth et al. 12 ). In parallel with LPM depletion, blood monocytes infiltrate the peritoneal cavity and differentiate into inflammatory macrophages sharing many features with resident SPMs.7,8 It was then assumed that resident SPMs appear unaffected by MDR. However, very few studies have analyzed the fate of SPMs at early time points (< 4 h) after inflammatory challenge in the peritoneal cavity. Although it has been clearly established that SPMs are developmentally independent of LPMs, 7 the opposite remains debated, especially when the LPM subset is strongly depleted in conditions such as an inflammatory reaction or following irradiation ablation. 13
Thus, our purpose was to study the dynamics of SPMs upon sterile or infectious peritonitis in an attempt to further understand its relation with LPM renewal. Using a combination of FACS and C1 Single-Cell Auto Prep and BioMark nanoscale quantitative PCR (Fluidigm, South San Francisco, CA, USA), we found molecular markers exclusive to each of the PM subsets, highlighting the role played by LPMs and SPMs in maintaining homeostasis of the peritoneal cavity. Further analysis of these markers in SPMs recruited upon thioglycolate-induced peritonitis or Staphylococcus aureus i.p. challenge provided further clues that this subset may, indeed, contribute to compensating the LPM MDR and regulating the inflammatory process. Furthermore, this study brings new knowledge about resident and recruited SPM dynamics and their phenotypic changes during S. aureus infection.
Materials and methods
Mice
All experiments were performed with SPF C57BL/6 female 8-wk-old mice (Janvier Labs, Le Genest-Saint-Isle, France) following approval from the institutional animal care and use committee. Mice were housed in an accredited research animal facility of the National Veterinary College (Toulouse, France) that is fully staffed with trained husbandry, technical and veterinary personnel. Every effort was made to minimize animal suffering and distress. These experiments were performed by FELASA-accredited investigators (no. 311155580).
Flow cytometry and PM cell sorting
Peritoneal cells were harvested by injecting 5 ml HBSS-FCS (5%) 2.5 mM EDTA buffer, incubated with anti-CD16/CD32 mAb to block FcRII/III receptors and further stained with fluorochrome-conjugated mAb. From doublets, dead cells were excluded using 7-AAD, and CD115Pos cells were gated. From CD115Pos, eosinophils and dendritic cells were gated out using CCR5 and CD11c markers, respectively. The F4-80high IAb-neg and F4-80low IAb-high populations correspond, respectively, to LPMs and SPMs. 7 Inflammatory monocytes correspond to F4-80low Ly6Chigh IAb-neg. Samples were processed on a MACSQuant (Miltenyi Biotec, Bergisch Gladbach, Germany) cytometer and analyzed using FlowJo (TreeStar, Ashland, OR, USA) software. The sorting of LPMs or SPMs from naïve mice was performed using FACSAria (BD Biosciences, Franklin Lakes, NJ, USA) using the same gating strategy. From each mouse, 1 × 10⁵ LPMs and 1 × 10⁵ SPMs were sorted and purity was checked (>95%). Finally, LPMs or SPMs sorted from each mouse were pooled to achieve final suspensions of 1 × 10⁶ cells/ml of each subset.
Inflammatory challenges of the peritoneal cavity
Macrophage disappearance reaction was evaluated according to three models of peritonitis. We used two TLR pro-inflammatory agonists, ultrapure LPS (Escherichia coli O111:B4) and the synthetic lipopeptide Pam3Csk4 (both from Invivogen, San Diego, CA, USA) binding to TLR4 and TLR1/TLR2 heterodimers, respectively. These TLR agonists were injected into the peritoneal cavity at dose of 50 µg/mouse in sterile PBS (Gibco, Waltham, MA, USA). In parallel, we infected mice i.p. with a methicillin-susceptible strain of S. aureus (HG001) as previously described. 14 Briefly, HG001 strain was cultured in TSB overnight and sub-cultured in TSB for 3 h to reach mid-log growth phase (OD 600 ± 1.0 nm). Colony-forming units (CFU) were determined by OD measurement at 600 nm with a spectrophotometer. Mice were inoculated at 107 CFU/g mouse and CFU numbers in the inoculums were verified by plating serial dilutions on Chapman agar. At indicated time points, mice (for ligand injection, n = 3 mice per group and per time point, and for S. aureus infections, n = 10 mice per time point) were sacrificed and PerC harvested. Thioglycolate broth (4%)-elicited peritoneal cells were prepared as described previously. 15 After 4 d of incubation, SPMs were sorted from PerC as indicated above and pooled (1 × 10⁶ cells, n = 5 mice) for qPCR analysis.
PKH26PCL labeling of resident PMs and analysis of SPM differentiation
In vivo, phagocytic resident peritoneal cells were stained using PKH26PCL fluorescent cell linker kit (Sigma, St. Louis, MO, USA) as previously described. 16 PKH26PCL was injected into the peritoneal cavity, as recommended by the manufacturer. After 2 h incubation (T0), mice (n = 5) were sacrificed, peritoneal cells harvested and PKH26PCL-positive cells were characterized with a combination of mAb, as indicated above. Alternatively, at T0, mice were inoculated i.p. with S. aureus (see above). Mice (n = 10 per time point) were sequentially sacrificed from 12 h up to 196 h post-infection and peritoneal exudates were collected. From PerC, CD115Pos F4-80low PKH26PCLneg Ly6Gneg cells corresponding to inflammatory monocytes were analyzed for the expression of Ly6C and MHCII at indicated time points.
Single-cell capture and qPCR
For single-cell preparation, 1 × 10³ LPMs or SPMs from sorted suspensions were placed in the cell input well of the C1 Array Integrated Fluidic Circuits (IFC) (10–17 µm; Fluidigm). The remaining cells were pelleted and analyzed by RT-qPCR as a pool. The viability of single cells captured on the C1 Array was assessed with the Live/dead Cell viability/Cytotoxicity kit (Invitrogen, Carlsbad, CA, USA). The wells containing either dead cells or cell doublets were excluded from subsequent analyses. Isolation of mRNA from pooled resident LPMs and SPMs, thioglycolate or S. aureus-elicited SPMs was performed with the RNAeasy kit (Qiagen, Hilden, Germany). Reverse transcription and PCR were performed with the Cells-to-Ct™ kit (Ambion, Thermofisher, France), C1 Single-Cell Auto Prep Modules Kit (Fluidigm) and pooled primers (500 nM). A list of 38 genes related to macrophage activation and differentiation was established based on previous publications. Primers were designed using Primer3Plus software (Supplementary Table 1). Single cells or pooled cells were then analyzed by qPCR using 48.48 Dynamic Array IFCs and the BioMark System (Fluidigm). The IFCs were processed and the instruments were operated according to the manufacturer’s instructions. Briefly, prior to loading into the IFC, 2 µl preamplified cDNA was mixed with adequately diluted 2× TaqMan Master Mix (Applied Biosystems, Foster City, CA, USA), 20× DNA Binding Dye Sample Loading Reagent (Fluidigm), 20× Evagreen (Biotium, Hayward, CA, USA) and Tris low EDTA buffer. A total of 5 µl cDNA sample + reagent mix and 5 µl primers (5 µM) were dispensed into the dedicated inlets of the IFC. The IFC was loaded in the IFC Controller MX and was then transferred to the BioMark System for 35 PCR cycles. Ct values were calculated from the system’s software (BioMark Real-time PCR Analysis; Fluidigm).
Single-cell data processing and visualization/statistical analysis
Statistical analysis was performed with R v3.0.2 in RStudio using the Singular Analysis Toolset 3.0 from Biomark, as well as the R ‘stats’ and ‘randomForest’ packages. Principal component analysis and hierarchical clustering analysis were carried out using scaled data. Hierarchical clustering was based on Euclidian distances and groups were merged according to Ward's criterion. Correlation between macrophage disappearance reaction and incubation time was assessed with Pearson’s test.
Results
As observed in previous studies,7,8 LPMs accounted for most of the resident PMs and were F4-80high IAb-neg, whereas SPMs were F4-80low IAb-pos (Figure 1). Of note, both macrophages subsets expressed MCSF-receptor (CD115). Based on this phenotype, each subset was sorted by flow cytometry and further analyzed by RT-qPCR as a single cell or a pool at steady state or upon peritonitis (Figure 1).
The gating strategy used to analyze and to isolate resident LPMs and SPMs. Doublets, cell debris and dead cells (7-AADpos) were excluded by electronic gating as indicated. LPMs and SPMs were sorted after gating on CD115pos cells, according to the expression and intensity of F4-80 and IAb: LPM (F4-80high IAb low) and SPM (F4-80low IAb high). Sorted cells were processed and separated with the C1 Single-Cell Auto Prep system or pooled and analyzed for gene expression with BioMark (Fluidigm).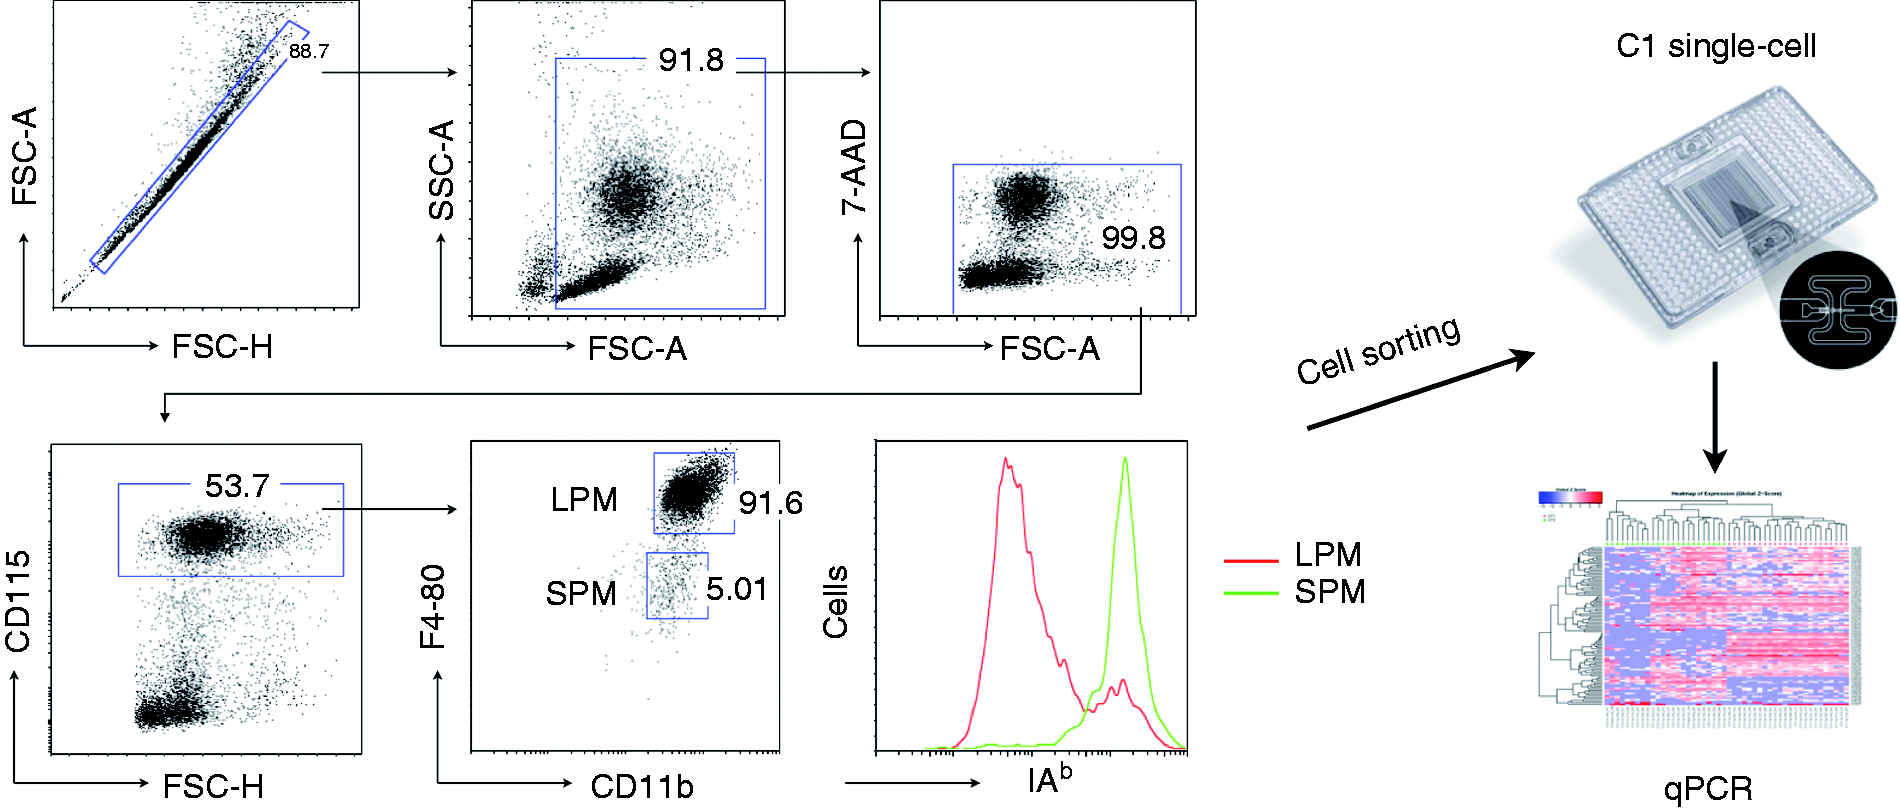
Single-cell analysis of resident LPM and SPM subsets reveals new specific molecular markers
Steady-state LPMs and SPMs were analyzed by RT-qPCR at the single-cell level. Along the capture and selection processes, 37 viable LPMs (97% purity) and 37 viable SPMs (96% purity) qualified for analysis. Principal component analysis of the gene expression profile of LPMs and SPMs sharply distinguished between the two subsets (Figure 2A). This was confirmed by hierarchical clustering analysis (HCA) that further defined three clusters: cluster 1 (n = 36 cells) was exclusively composed of LPMs, whereas SPMs segregated in two clusters. The differential expression of six genes between LPMs and SPMs explained this near-perfect clustering (Figure 2B). LPMs were characterized by the exclusive and systematic expression of Cxcl13 (37/37 LPMs and 0/37 SPMs). Similarly, IFNGR1 expression was detected in LPMs but not in SPMs, although not all LPMs expressed this gene (27/37 LPMs and 0/37 SPMs). The expression of SR-A and Ccl24 also discriminated between the two subsets and was more pronounced in LPMs (Figure 2B). By contrast, Fizz1 and Mrc1 were more frequently expressed in SPMs than in LPMs (23/37 and 22/37 SPMs, respectively, and 6/37 and 5/37 LPMs, respectively). Interestingly, the expression of these two genes was highly correlated in the SPM subset strongly suggesting that the SPM population could be further divided into two subsets (cluster 2 and cluster 3 in Figure 2B). Representing gene expression of the six differentially expressed genes as a violin plot (Figure 2C) showed that steady-state LPMs was a rather homogenous subset. This violin plot representation also confirmed the higher expression of SR-A and Ccl24 in LPMs. In contrast, the expression of Fizz-1 and Mrc-1 clearly indicated a bimodal repartition of resident SPMs. This repartition was consistent with the clusters determined by HCA. To confirm this hypothesis, the frequency of CD206, the mannose receptor encoded by Mrc-1, was determined among resident SPMs subset using flow cytometry (Figure 2D). This analysis showed that 55% of resident SPMs expressed high levels of CD206 at their membrane and confirmed the results obtained at the gene level. Indeed, as observed in HCA, cluster 3 (right side of the heat map) was composed of 21 SPMs characterized by a high expression of Fizz-1 concomitantly with an increased expression of Mrc1. Cluster 2 was composed of SPMs almost devoid of Fizz-1 expression (only 2/16 SPMs) and exhibiting a lower Mrc-1 expression than cells from cluster 3. Consequently, clusters 2 and 3 represented 43% and 57% of the SPM population, respectively, which was consistent with the flow cytometry results. Furthermore, the cytometry data confirmed that LPMs expressed no or low levels of CD206.
Single-cell RT-qPCR analysis of resident LPMs and SPMs. Each single-cell suspension was isolated from five C57BL/6-naïve mice. (A) Principal component analysis, (B) ascendant hierarchical clustering and (C) violin plot analysis, based on single-cell LPM and SPM gene expression. Single-cells clusters are indicated as C1, C2 and C3, where n represents the number of single cells composing each cluster. ‘X’ indicates an LPM with an abnormal classification. (D) Flow cytometry analysis of CD206 (mannose receptor encoded by Mrc-1) in resident LPM and SPM subsets.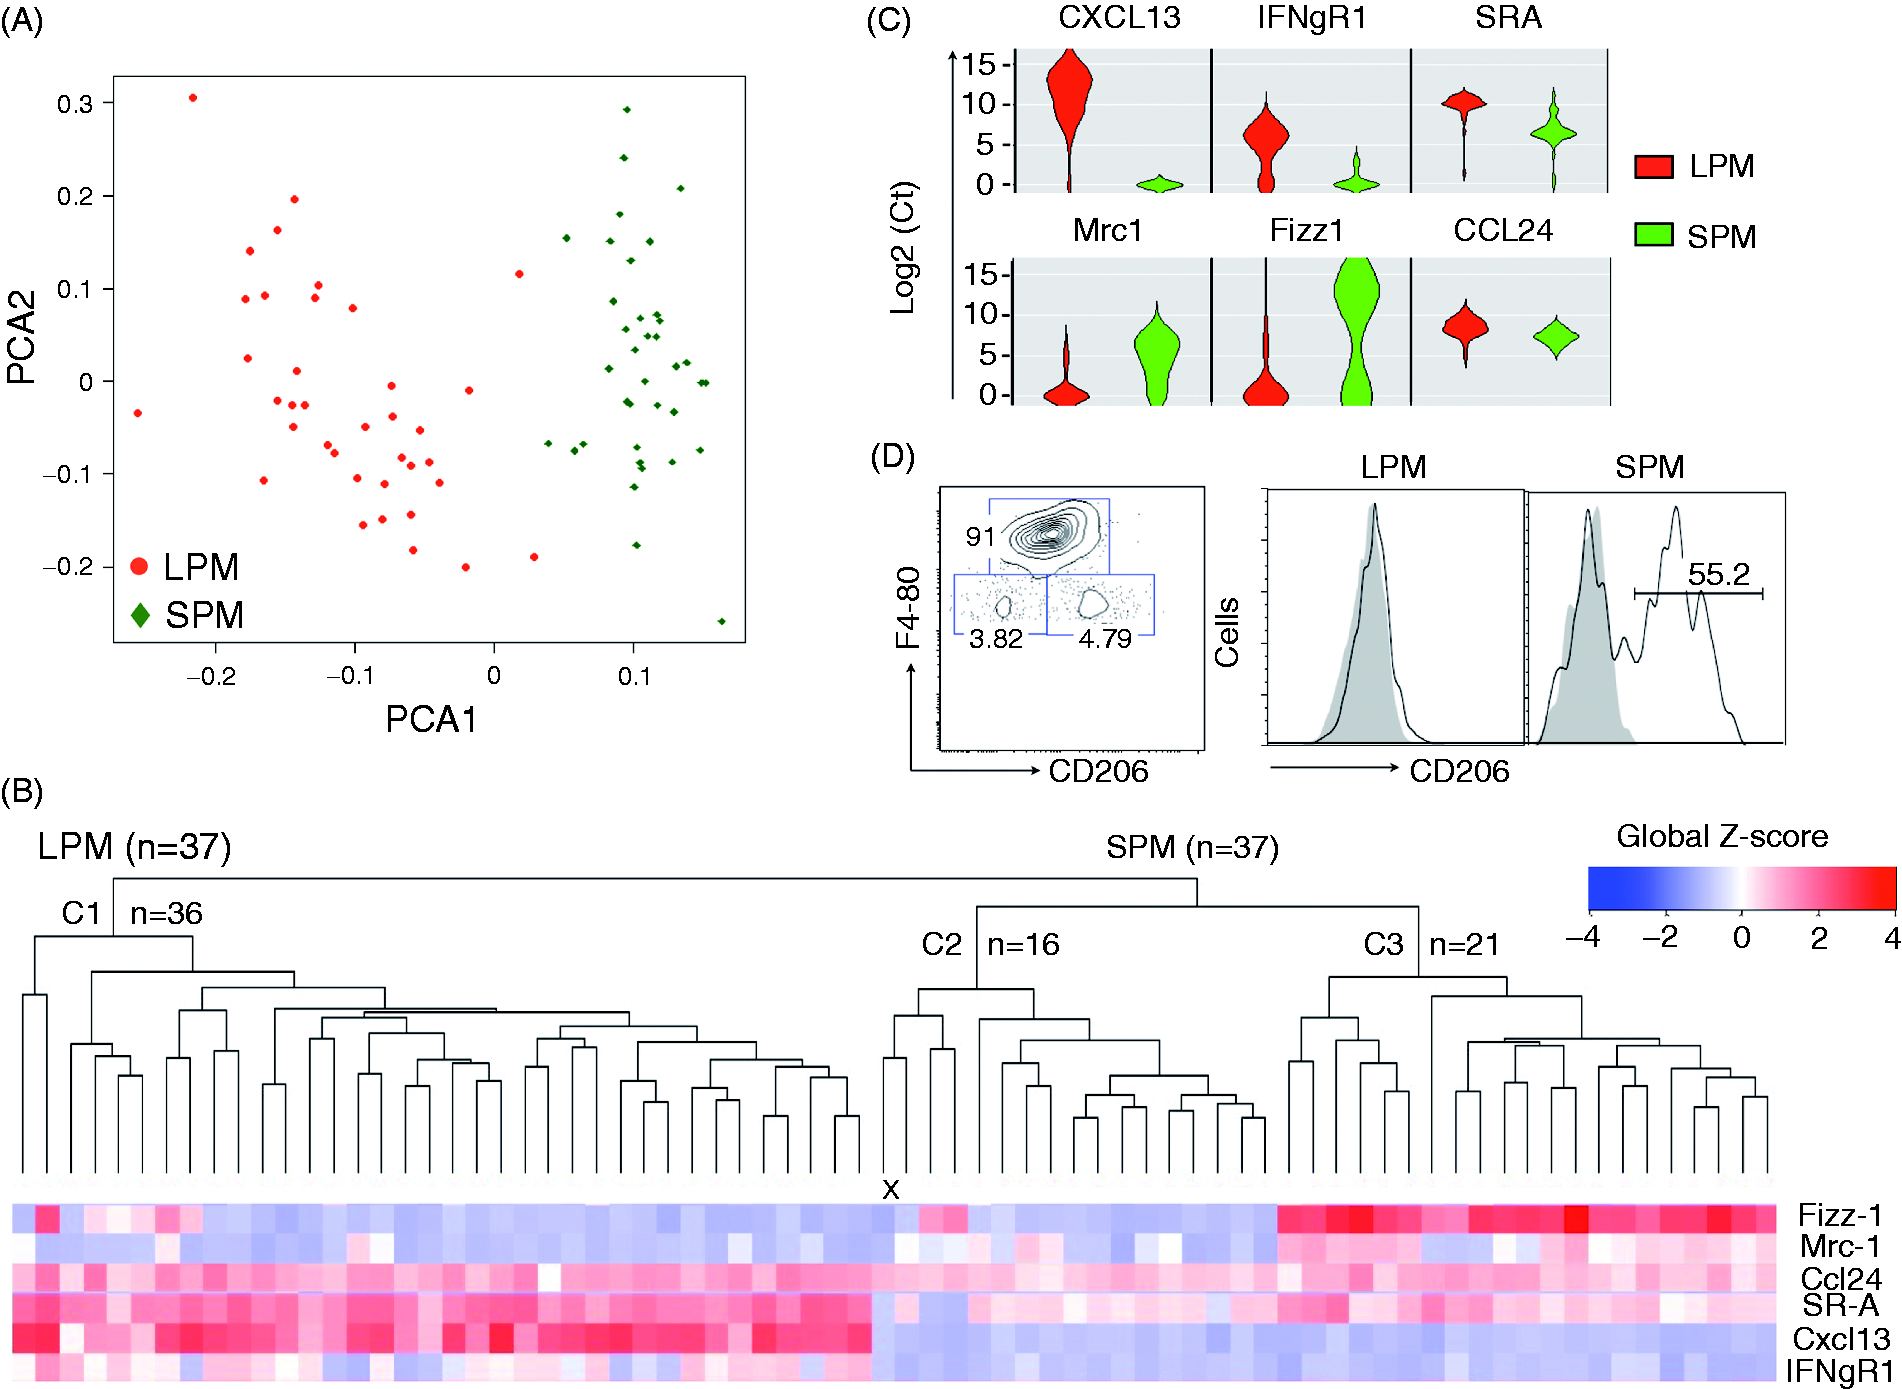
To further analyze the expression of these genes in PM subsets, we induced a sterile peritonitis by injection of thioglycolate broth into the cavity. This is a widely used way to induce peritoneal inflammation with a substantial recruitment of inflammatory monocytes that culminates in SPM accumulation in exudates. Four days after thioglycolate i.p. challenge, newly recruited SPMs were the most abundant peritoneal macrophage subset, as previously observed (data not shown).
7
At this time, we isolated thioglycolate-elicited SPMs (TE-SPMs) and compared their profile of gene expression with that of resident SPMs (Res-SPMs) using the gene expression levels of resident LPMs as a reference (Figure 3). The expression of common markers associated with macrophage polarization was heterogeneous in TE-SPMs and suggested a mixed M1/M2 profile. As reported elsewhere and compared with Res-SPMs and LPMs, TE-SPMs showed an increased expression of pro-inflammatory genes like Tnfa, Ccl4 and Ccl5 but not inos, which are considered as canonical markers of classical activation (M1). However, the expression of anti-inflammatory genes like Il-10 and Tgf-b was also increased in TE-SPMs and suggested an alternative activation (M2). Similarly, Ym-1 expression, a reliable marker of M2 polarization in murine macrophages, was up-regulated in TE-SPMs, whereas others M2 markers such as Arg-1, Klf4 or Mrc-1 (and Fizz-1, to a lesser extent) were down-regulated. Interestingly, compared with Res-SPMs, TE-SPMs exhibited a strong up-regulation of Cxcl13, a gene that appeared to be a hallmark of LPMs. However, IFNGR1 expression, which was also identified as a robust marker of LPMs, was absent from TE- SPMs.
RT-qPCR analysis of pooled resident LPMs and SPMs or TE-SPMs. Each cell subset was isolated and pooled from five naïve mice for resident peritoneal macrophage subset analysis or five mice injected with 4% thioglycolate broth. Gene expression in Res-SPMs and TE-SPMs, collected 4 d after i.p. challenge, is expressed as log2 fold change (FC) of basal expression of target genes in the LPM subset, used here as a reference (*P < 0.05, **P < 0.01, ***P < 0.001).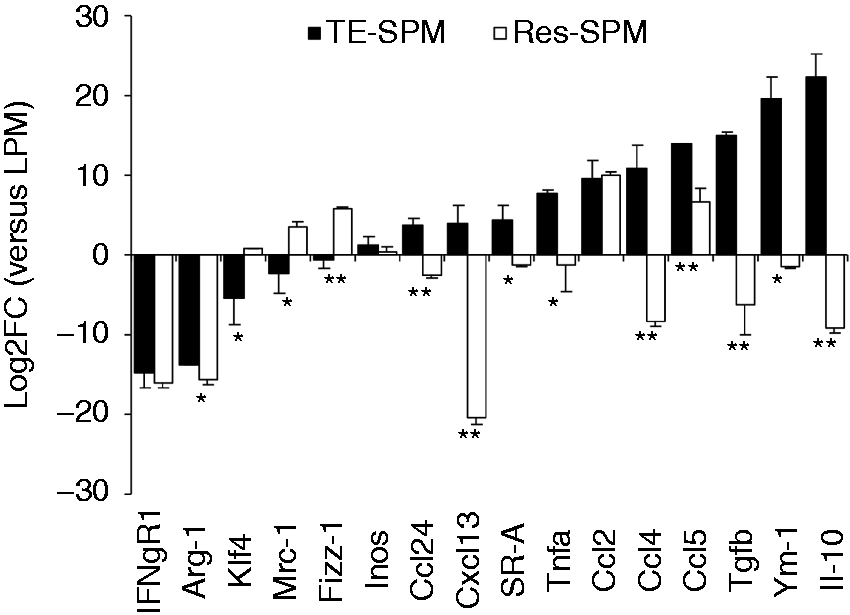
The next objective was to follow the fate of these different PMs subsets during a peritoneal infection induced by S. aureus.
Compared with TLR ligand, S. aureus induces a massive macrophage disappearance reaction in both subsets of resident peritoneal macrophages
So far, it has been considered that only LPMs disappear from peritoneal cells upon inflammatory challenge of the cavity, whereas the SPM subset expands.
7
However, these observations were often conducted at late time points after induction of the inflammatory response. Here, we focused our analysis on early time points as indicated (Figure 4A). Compared with TLR2 and TLR4 ligands, respectively Pam3Csk4 and LPS, live S. aureus injection induced a massive MDR in both LPM and SPM subsets (Figure 4A). Indeed, the SPM subset was completely depleted as soon as 2 h p.i. and <10% of the original numbers of LPMs remained. This was the first proof that resident SPMs could effectively be affected by MDR. However, at 12 h p.i., the LPM subset was totally depleted, but SPM numbers rose (Figure 4A). To confirm these observations, we performed cell tracking experiments using PKH26PCL, a dye that specifically labels phagocytic cells. Prior to S. aureus infection, the i.p. injection of PKH26PCL efficiently labeled resident PMs (Figure 4B, gate R1). As our previous results indicated that upon S. aureus infection resident SPMs and LPMs were completely depleted at 2 h and 12 h post-infection, respectively, we analyzed the frequency of F4-80pos PKH26PCLpos cells at 12 h after infection. At this time, all cells in R1 gate had disappeared, whereas a newly recruited population of F4-80low PKH26PCLneg cells was observed (Figure 4B, right panel, gate R2).
S. aureus infection induces MDR of both LPM and SPM subsets. (A) Numbers of LPMs, SPMs and inflammatory monocytes (Mo) were determined using flow cytometry at indicated time points after S. aureus (1 × 10⁷ CFU/g) (n = 10 mice per point) or Pam3Csk4 of LPS (n = 3 mice per point for each TLR ligand). (B) PKH26PCL was injected in the peritoneal cavity and F4-80pos peritoneal cells were analyzed using flow cytometry at T0 (left panel) and T12 h after S. aureus infection (right panel) (n = 5 mice per point).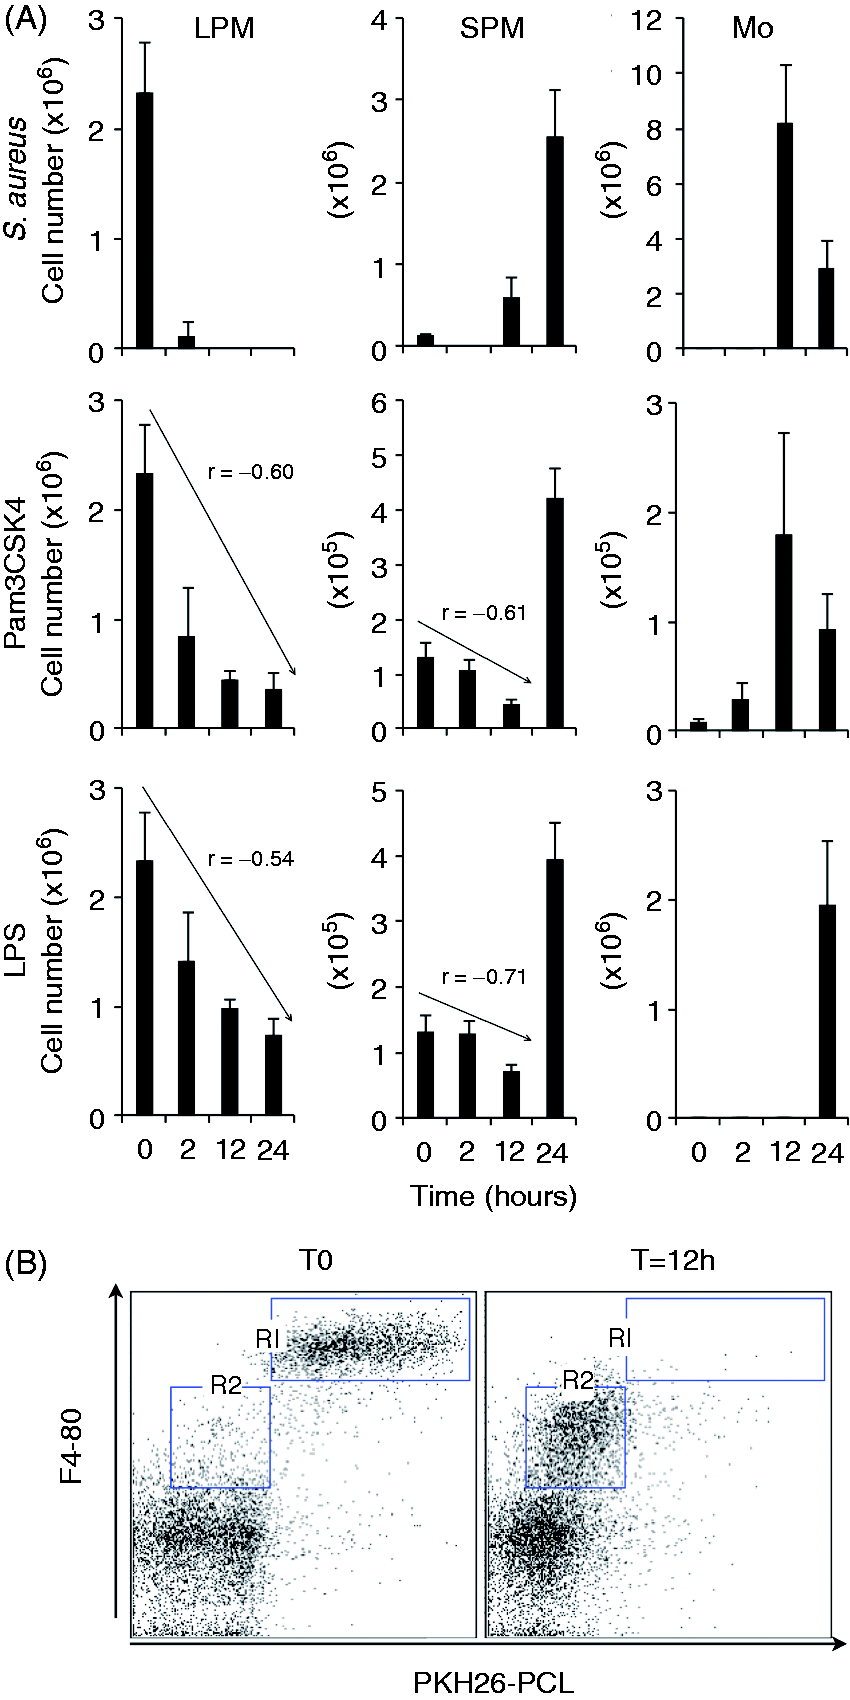
The i.p. injection of Pam3 and LPS also induced a MDR, as judged by decreasing numbers of LPMs over time. This was confirmed using Pearson’s correlation test (LPS: r = –0.51 and Pam3: r = –0.60) (Figure 4A). However, even after 24 h of incubation, LPM depletion remained incomplete. In parallel, SPMs numbers decreased but only between steady state and 12 h post-injection (LPS: r = –0.71 and Pam3: r = –0.61) (Figure 4A), as their numbers increased at 24 h post-challenge. Taken together these results confirmed that resident LPMs after an inflammatory challenge undergo MDR that also affects SPMs but at earlier time points. Indeed, unlike LPMs, SPMs compartment seems rapidly replenished by inflammatory monocytes infiltrating the peritoneal cavity (Figure 4A).
After S. aureus infection, the resident SPM subset is rapidly replenished by inflammatory monocytes with increased levels of inflammatory cytokines
We focused our analysis on cells newly recruited in the peritoneal cavity 12 h after S. aureus challenge. The F4-80pos PKH26PCLneg cell subset (from Figure 4B, R2) expressed high levels of Ly6C (90% of Ly6Chigh cells) but was mainly IAb-neg (85% of IAb-neg cells) (Figure 5A, left panel) and corresponded to blood iMo. By measuring the mean fluorescence intensity levels of Ly6C and IAb markers over time in R2 gate, we observed a continuum of differentiation characterized by a progressive loss of Ly6C expression, whereas, in parallel, expression of IAb increased (Figure 5A, middle and right panels, and Figure 5B). At 72 h p.i., most of cells in gate R2 were F4-80low, expressed high levels of IAb (>65%) and had a markedly reduced expression of Ly6C. Of note, although lower than in LPMs, F4-80 expression slightly increased upon this differentiation process. This phenotype is consistent with inflammatory SPMs. However, even at a later time point (168 h p.i), this phenotype remained unchanged and, based on the analyzed markers, it was impossible to determine whether a part of this SPMs subset was undergoing further differentiation steps toward the LPM phenotype.
Shortly after S. aureus challenge iMo infiltration replenishes SPMs subset and correlates with inflammatory cytokines production in peritoneal exudates. F4-80pos PKH26PCLneg cells from R2 (see Figure 4) were further analyzed by flow cytometry. (A) Representative contour plot from two individual experiments with five mice at each time point showing the frequencies of Ly6Cpos and IAb pos cells among the cell population in R2 at indicated time points. (B) Mean fluorescence intensity measurement of Ly6C and IAb on F4-80-positive cells along the time after S. aureus i.p. injection (n = 5 mice per time point). (C) Ab array based (C-Series; RayBiotech, Norcross, GA, USA) semi-quantitative analysis of cytokine secretion in peritoneal lavage fluid at steady state, 4 and 16 h after S. aureus challenge (n = 5 mice per time point). Bars represent the densitometry (dots chemiluminescence)-based quantification of relative cytokine levels. Letters (a, b or c) indicate statistical differences between time points.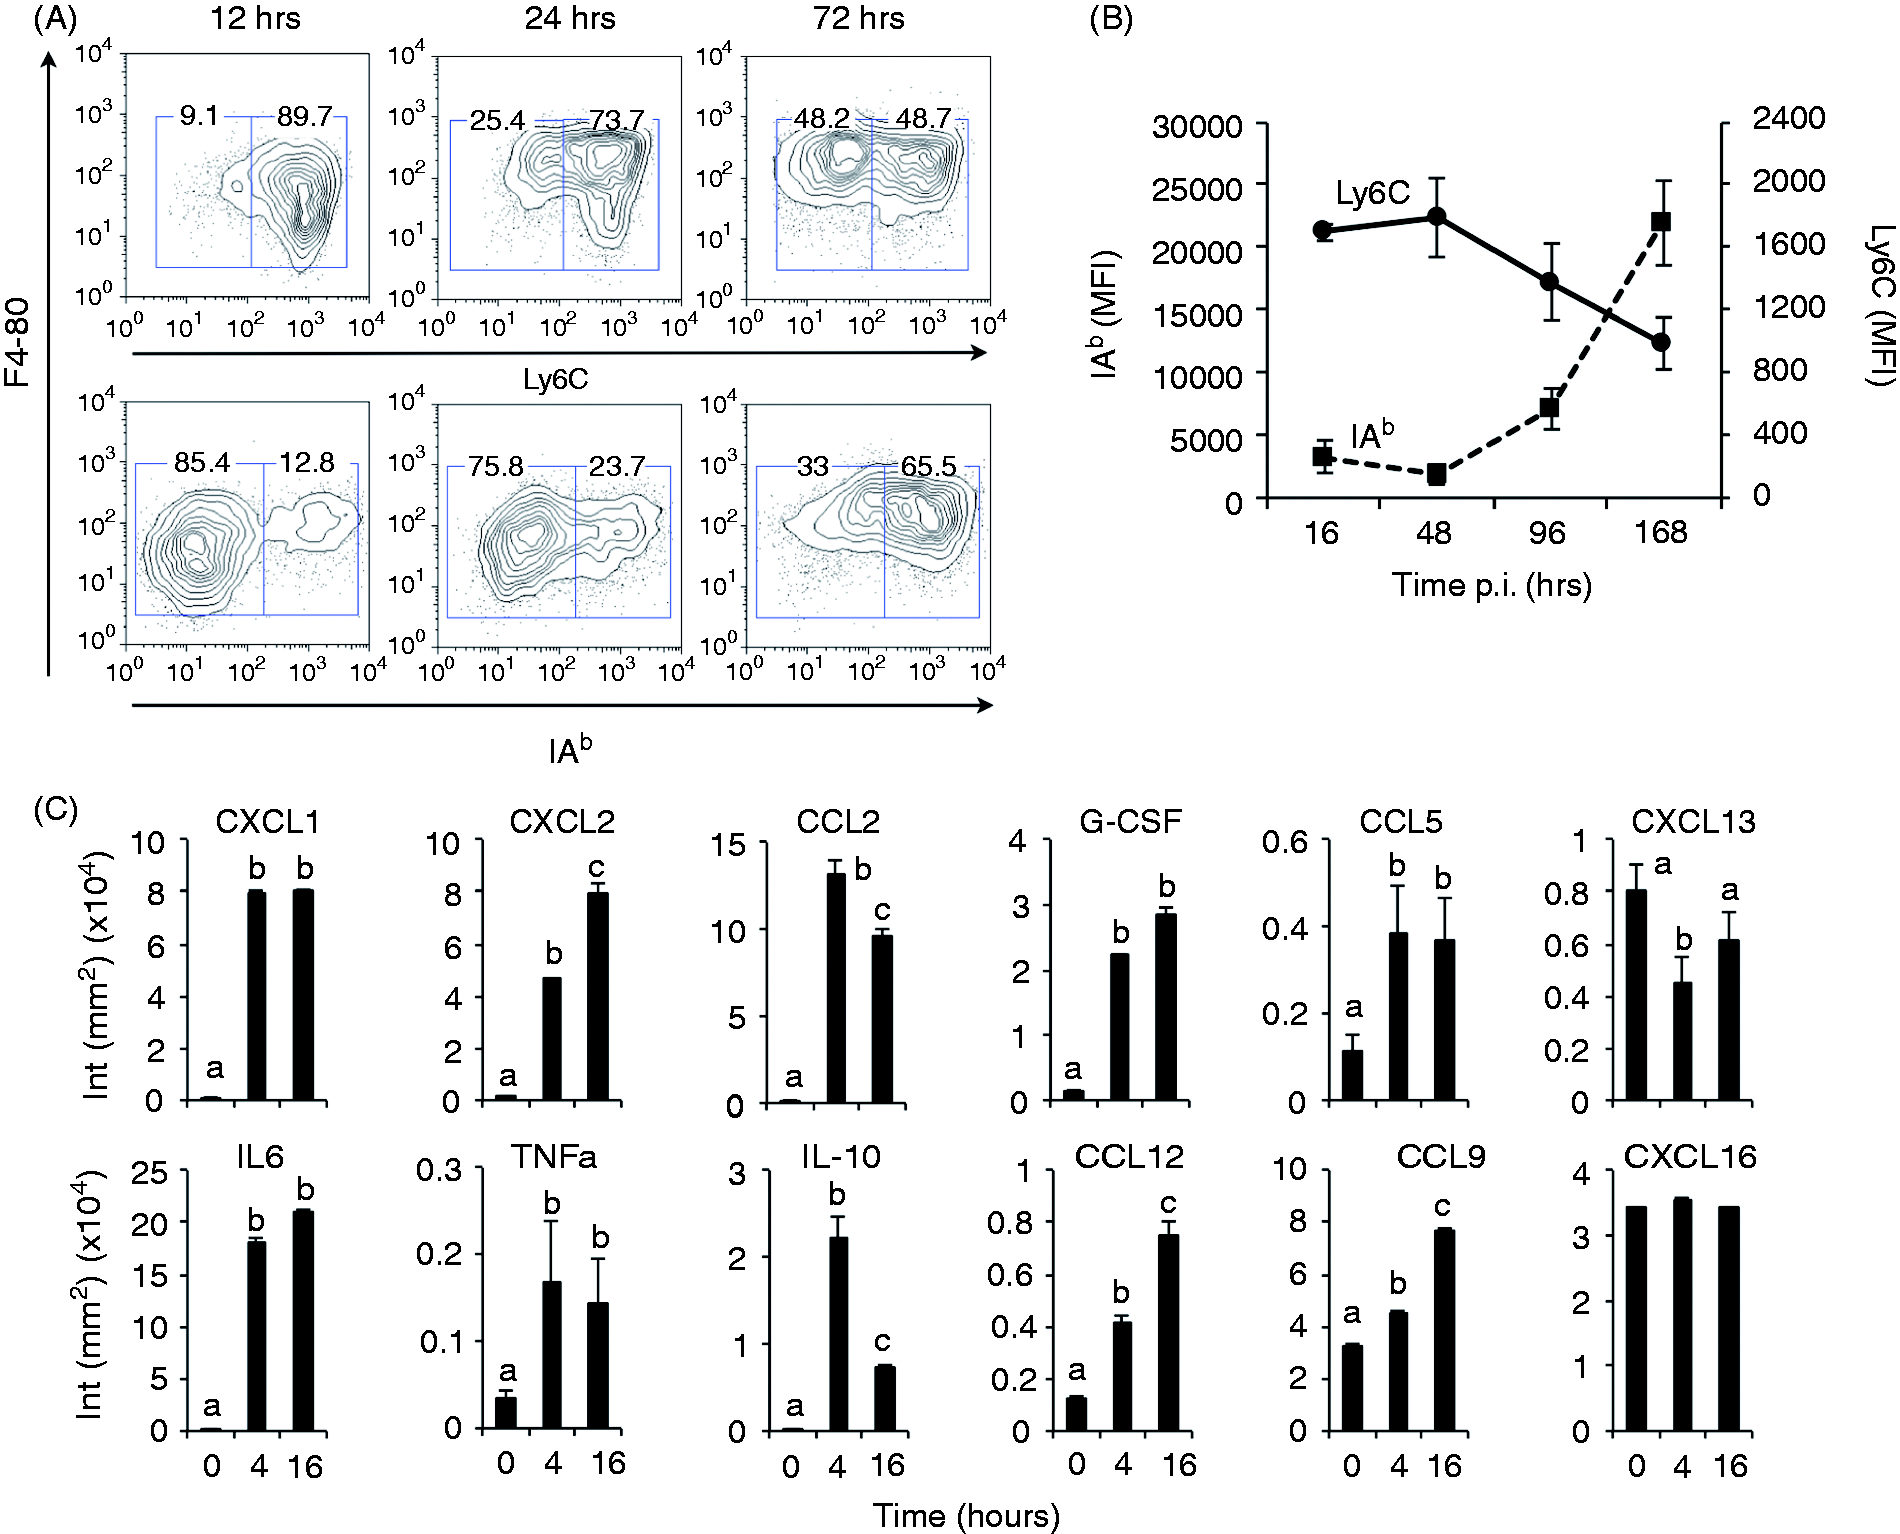
In parallel, we analyzed the secretion of cytokines and chemokines in peritoneal exudates at different time points (Figure 5C). For most of the inflammatory cytokines assayed, including CXCL1 and CXCL2, TNF-α, IL-6, etc., the secretion levels gradually increased from undetectable at steady state to substantial amounts at 16 h p.i. This pattern of secretion correlated well with the increased numbers of iMo/SPM. However, three cytokines presented a different pattern of secretion that was inconsistent with iMo/SPM dynamics. First, IL-10 levels peaked at 4 h but appeared to be rapidly down-regulated at 16 h p.i. The high levels of CXCL16 were unchanged throughout the infection kinetics and remained similar with steady-state levels. Interestingly, CXCL13 concentration, identified in our study as a valuable marker of the LPM subset, fluctuated. High levels were detected at steady state but rapidly decreased at 4 h p.i. to increase again 16 h p.i. Based on our previous observations, these secretion kinetics seemed to be correlated with the global dynamic of PMs in S. aureus infection characterized by the strong LPM MDR and the progressive reconstitution of the PM population by iMo that further differentiated in SPMs. This suggested that, as observed in TE-SPMs, iMo/SPM recruited in S. aureus infection could contribute to the restoration of CXCL13 levels.
S. aureus-elicited SPMs present a mixed polarization phenotype that could contribute to cell renewal and return of homeostasis in the peritoneal cavity
In the previous experiment, we could not ascertain that the cytokines we measured were effectively produced by iMo/SPMs. To determine if the cytokine source was really S. aureus-elicited SPMs (SaE-SPMs), we sorted CD115Pos cells at 16 h p.i. RT-qPCR analysis revealed that, compared with LPMs and Res-SPMs, SaE-SPMs expressed relevant M2 polarization markers such as Arg-1, Il10 and Ym-1. The expression levels of Mrc-1 and kfl4, known as M2 markers, were similar to those expressed by Res-SPMs. However, SaE-SPMs overexpressed M1 polarization markers such as Nos2 (inos), Tnfa or Ccl2. Interestingly, SaE-SPMs expressed higher levels of Cxcl13 than Res-SPMs or even than LPMs. However, as for Res-SPMs, SaE-SPMs showed a reduced expression of IFNGR1 compared with LPMs. The overall expression pattern made SaE-SPMs phenotypically different from Res-SPMs and LPMs.
At the protein level, SaE-SPMs mainly produced chemokines, including CCL9, CCL2, CXCL1 and CXCL2 (Figure 6B, C). This secretion pattern was also characterized by a substantial production of G-CSF. A robust secretion of IL-6 was also observed. Of note, the secretion levels of TNF-α and IL-10 were moderate and far below the levels of the cytokines/chemokines mentioned before. This later observation was not in agreement with RT-qPCR results (Figure 6A), indicating that both Tnfa and Il10 were significantly expressed in SaE-SPM. Nevertheless, the secretion levels of CXCL13 were fully compatible with their relative expression levels, confirming that SaE-SPMs efficiently produce this chemokine.
Inflammatory Mo/SPMs contribute to CXCL13 production and present a mixed polarization profile during S. aureus resolution phase. (A) SaE-elicited SPMs were isolated and pooled from five C57BL/6 infected mice. Gene expression in Res-SPMs and SaE-SPMs is expressed as log 2fold (FC) change of basal expression of target genes in the LPM subset, used here as reference (*P < 0.05, **P < 0.01, ***P < 0.001). The detection of cytokines secreted by CD115pos cells isolated at 16 h p.i. from S. aureus-infected mice (n = 5) was performed using AB array (C-Series; RayBiotech). (B) Representative membrane revelation for indicated cytokines and (C) semi-quantitative analysis of cytokine production based on dot chemiluminescence intensity.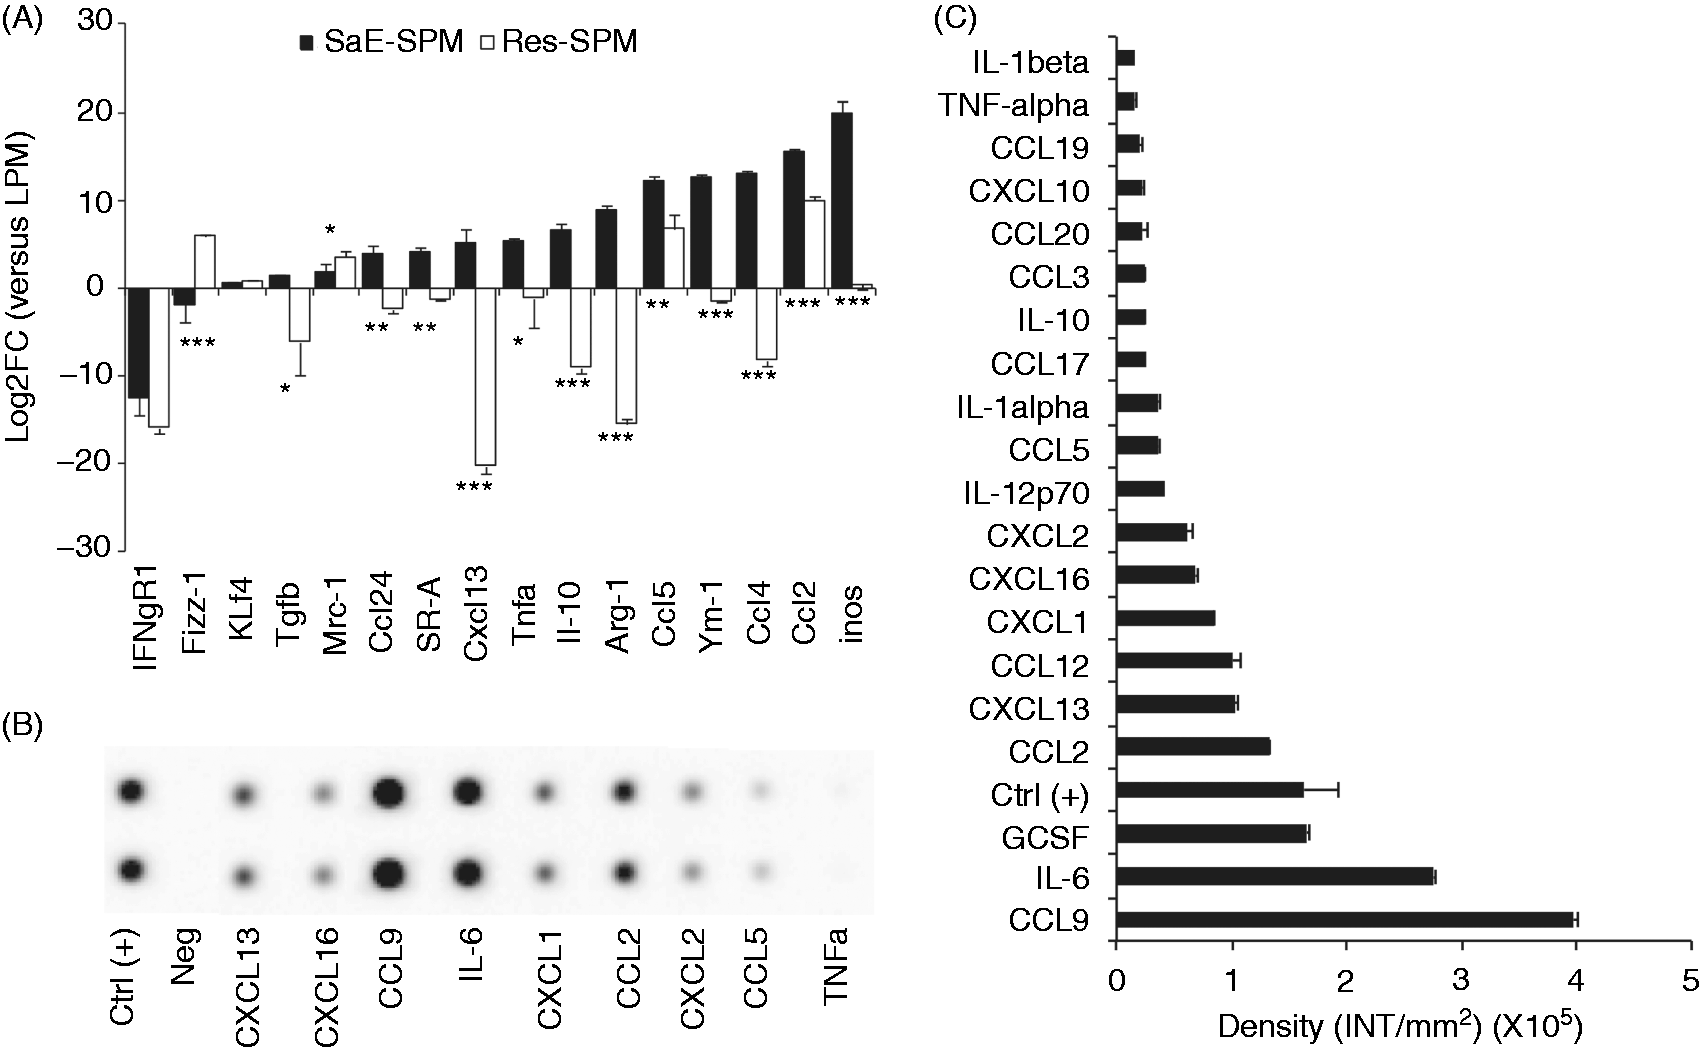
Discussion
Based on single-cell RT-qPCR analysis, we have found new molecular markers specific for the LPM subset, highlighting its role in maintaining homeostasis of the peritoneal cavity. The Cxcl13 gene encodes a chemokine associated with B1 cell homeostasis. CXCL13 is produced by mesothelial cells in the omentum and by PM, and promotes the recruitment of B1 cells to these tissues; 17 indeed, mice lacking CXCL13 are B1 cell-deficient in the pleural and peritoneal cavities but not in the spleen. 17 Our study reveals that at steady state, only LPMs seem involved in CXCL13 production and, consequently, in peritoneal B1 cell homeostasis. This is consistent with a previous observation indicating that CD11bhigh F4-80high peritoneal cells harboring a macrophage morphology were a major source of CXCL13. 18 In conjunction with single cell RT-qPCR data, the CXCL13 secretion kinetic along S. aureus infection is supplementary proof that LPMs are very likely contributing to this chemokine secretion at steady state. Indeed, the massive MDR of LPMs induced by S. aureus injection led to a sharp decrease in CXCL13 levels in peritoneal exudates 4 h p.i. Next, paralleling SPM replenishment, CXCL13 levels increased at 16 h p.i., suggesting that newly recruited iMo, which differentiate into SPMs, could produce the chemokine. The ability of iMo to produce CXCL13 is still debated. The study of Carlsen et al., 19 demonstrated that a main source of CXCL13 were newly extravasated CD14Pos cells in rheumatoid arthritis and ulcerative colitis. However, the study Hojgaard et al. reported that expression of CXCL13 following thioglycolate injection was caused by resident cells but not recruited macrophages. 20 This later finding is not in line with the detection of Cxcl13 expression in TE-SPMs in our study. As i.p. injection of thioglycolate does not induce a complete MDR of resident macrophage (data not shown), the statement of Hojgaard et al. is conceivable. However, our RT-qPCR analysis and immunoassay conducted on isolated SaE-SPM showed that Cxcl13 was transcribed and CXCL13 readily produced, ruling out the latter hypothesis. Interestingly, a recent study demonstrated that eosinophils control the resolution of inflammation in a mouse model of zymosan-induced peritonitis by up-regulating expression of macrophage CXCL13. 21 This finding makes this chemokine a candidate marker of M2 regulatory or wound-healing macrophages. This hypothesis is supported by the substantial expression of M2 markers recorded in SaE-SPMs. However, Cxcl13 expression in SaE-SPMs (or TE-SPMs) does not prove these cells fully acquired a LPM phenotype and would further differentiate to replenish LPMs compartment as SaE-SPMs were still phenotypically distinct from LPMs even 7 d after infection. Rather, we believe our findings indicate that newly recruited SPMs could compensate for LPM MDR by endorsing a part of their functionalities to restore homeostasis after an inflammatory insult. The co-expression of both M2 and M1 markers in SaE-SPMs raises the question of whether it is a single population with a hybrid phenotype or if there is a population mixture. The recent study of Lastrucci et al. suggests that both hypotheses could be true. 22 Indeed, 3 wk after a zymosan-induced peritonitis, F4-80Pos macrophages persisting in the omentum were found either single positive for iNos labeling, either single positive for Arg-1 or double positive for both markers. These results are consistent with the phenotype of SaE-SPMs we observed. Undoubtedly, a single-cell analysis is the next step to undertake to answer this point fully.
Our study also revealed marked expression of IFNGR1, SR-A and, to a lesser extent, Ccl24 in LPMs. The significant expression of SR-A, coding for scavenger receptor class A involved in numerous functions of macrophages, 23 including the binding and phagocytosis of pathogens, and also clearance of apoptotic bodies, highlighted a dual function of LPMs in homeostasis and immune surveillance of the peritoneal cavity.
Based on this strong expression of IFNGR1 it can be assumed that LPMs may respond more efficiently to IFN-γ stimulation than resident SPMs that did not express this gene. It was previously demonstrated that resident PMs efficiently respond to LPS+IFN-γ stimulation by secreting substantial amounts of NO. 24 This previous observation is somewhat consistent with our findings, although it is not possible to determine to which PMs subset the NO secretion was attributable. In view of the IFNGR1 expression recorded in the present study, it is reasonable to speculate that LPMs would be the main subset responding to IFN-γ. And yet it was shown that the frequency of IL-12-producing cells after in vitro LPS+IFN-γ stimulation was higher within myelo-monocytic cells from mice exposed to zymosan and Trypanosoma cruzii than the frequencies of IL-12-producing cells in unstimulated mice. 8 Therefore, this previous study indicated that, compared with LPMs, SPMs recruited during sterile or infectious peritonitis can respond more readily to LPS+IFN-γ stimulation. However, our study and others have demonstrated that functionalities of resident or recruited SPMs differ as a result of their respective activation status. 25 However, qPCR analysis of Res-, TE- or SaE-SPMs showed that IFNGR1 was not expressed in any of those macrophages subsets. This suggests that a major part of SPMs response is driven through a TLR4/MyD88 rather than an IFNGRI/STAT1 pathway when stimulated with LPS+IFN-γ.
By contrast, the expression of Fizz1 and Mrc1 was highly correlated in the Res-SPM subset. The expression of Fizz1 (retnla or RELM-α) was previously detected in contexts favoring the M2 phenotype, such as infestation by nematodes, but little is known about its precise function. The production of Fizz1 by alternatively activated macrophages limits type 2 cytokine-mediated pulmonary inflammation after challenge with Schistosoma mansoni eggs. 26 However, its expression in resting SPMs is difficult to explain. Our study also revealed a strong expression of Mrc1 in SPMs. The mannose receptor (MR or CD206), recognizes terminal mannose, N-acteylglucosamine and fucose residues on glycans attached to proteins found on the surface of some microorganisms, 27 and also has several homeostatic functions, including the clearance of glycoproteins, such as sulfated hormones and glycoproteins released in response to a pathological event.28,29 This observation, in association with Fizz-1 expression, suggests that SPMs may also take part in the peritoneal cavity homeostasis and repair of micro-injuries. Moreover, violin plot analysis of Mrc-1 expression showed a bimodal distribution of individual SPMs with around 60% of SPMs expressing Mrc-1 and this was confirmed by the cytometry analysis. It remains possible that the SPM subset was contaminated by a set of unidentified cells, although our sorting strategy excluded the most evident sources, including eosinophil and dendritic cells. Indeed, both of these cell types can express low levels of F4-80. Post-sorting FSC/SSC profile of the SPM subset was not consistent with contamination by eosinophils (data not shown). Moreover, the significant expression of Kruppel-like factor 4, Klf4, which is restricted to the monocytic lineage, 30 definitely rules out this hypothesis. Contamination by dendritic cells is also unlikely because F4-80 is not expressed on peritoneal dendritic cells,2,7 and sorted SPMs were CD11cneg. It is thus difficult to establish whether these Res-SPMs sub-subsets are independent populations or whether they are interconnected by differentiation. However, as resident SPMs derive from blood monocytes that do not express CD206, 31 it is likely that the CD206neg Res-SPMs subpopulation exist in an intermediary state of differentiation of blood monocytes recently recruited from circulation into the cavity.
Finally, our study demonstrated that MDR intensity was linked with the nature (and probably the dose) of the inflammatory stimulus. The MDR induced by S. aureus injection resulted in a fast and complete disappearance of both subsets of resident PMs. In previous studies, we and others have demonstrated that macrophage lysis by S. aureus was an NLRP3 inflammasome-dependent cell death termed pyroptosis consecutive to caspase-1 activation and mediated by the secretion of α-toxin.14,32,33 Using this model of peritonitis, we showed here that, like LPMs, res-SPMs were affected by MDR. Using TLR ligands as inflammatory stimuli, we reached the same conclusion, but Res-SPMs depletion remained incomplete and rapidly compensated by iMo recruitment, which is further differentiated in inflammatory SPMs. However, based on the previous study of Davies et al., 34 we cannot exclude that a proliferative burst of residual resident SPMs or SPMs newly differentiated from recruited iMo could participate in SPM replenishment. Furthermore, we guess that our observation may have further involvements when analyzing the phenotype and functions of so-called ‘SPMs’ along the inflammatory process. Indeed, the presence of retentive Res-SPMs may distort phenotyping of newly recruited SPMs that, despite a similar monocytic origin, present a distinct phenotype.
In these circumstances, single-cell analysis should be the best approach to avoid this concern; it represents a valuable tool with which to investigate resident and recruited populations of macrophages in different tissues, at homeostasis or upon inflammatory process, especially when these are constituted of a mix of subpopulations themselves endowed with a remarkable plasticity.
Supplemental Material
Supplemental material for Single-cell analysis reveals new subset markers of murine peritoneal macrophages and highlights macrophage dynamics upon Staphylococcus aureus peritonitis
Supplemental Material for Single-cell analysis reveals new subset markers of murine peritoneal macrophages and highlights macrophage dynamics upon Staphylococcus aureus peritonitis by Solène Accarias, Clémence Genthon, David Rengel, Séverine Boullier, Gilles Foucras and Guillaume Tabouret in Innate Immunity
Footnotes
Ackowledgements
We thank the Genotoul technical platform (Toulouse, France) and specifically Dr Fatima-Ezzahara L’Faqihi-Olive (INSERM, U563-CPTP, CHU Purpan) for her expertise with cell sorting at Imagerie-Tri platform. We thank Dr T Msadek (Institut Pasteur, Biology of Gram-Positive Pathogens Unit, Paris France) for his kind gift of S. aureus strain used in these study.
Declaration of Conflicting Interests
The author(s) declared no potential conflicts of interest with respect to the research, authorship, and/or publication of this article.
Funding
The author(s) disclosed receipt of the following financial support for the research, authorship, and/or publication of this article: Dr. S. Accarias was founded by the French Direction Générale de l'Enseignement et de la Recherche (DGER) and the National Institute for Agricultural Research (INRA).
References
Supplementary Material
Please find the following supplemental material available below.
For Open Access articles published under a Creative Commons License, all supplemental material carries the same license as the article it is associated with.
For non-Open Access articles published, all supplemental material carries a non-exclusive license, and permission requests for re-use of supplemental material or any part of supplemental material shall be sent directly to the copyright owner as specified in the copyright notice associated with the article.