
Abstract
Sarm1 is the fifth Toll/IL-1 receptor (TIR) domain-containing adaptor protein identified to regulate TLR downstream signaling. Unlike the other TIR domain-containing adaptor proteins, Sarm1 is predominantly expressed in the brain. Our previous study indicated that Sarm1 regulates dendritic growth, axonal extension and neuronal polarity. Here, we investigated whether Sarm1 is involved in innate immunity in the brain. First, regional and cell-type distribution of Sarm1 in mouse brains was revealed using double immunostaining. Sarm1 was widely distributed in different regions of brains, including the cerebral cortex, hippocampus, amygdala, cerebellum and midbrain. Moreover, Sarm1 is present in both projection and inhibitory neurons, but, interestingly, not in microglial cells—the main immune cells in the brain. These results suggest that Sarm1 is unlikely to regulate microglial activity in a cell-autonomous manner. However, compared with wild type littermates, the RNA expression levels of several inflammatory and antiviral cytokines were altered in the embryonic and adult brains of Sarm1 knockdown transgenic mice. These data imply that Sarm1 influences cytokine expression in neurons. In conclusion, our findings suggest that Sarm1 regulates the innate immune responses of the central nervous system through regulating the inflammatory and anti-virus cytokines produced by neurons.
Introduction
TLRs are the most well-studied type of pattern recognition receptors. They are expressed in a variety of cells in both vertebrates and invertebrates where they recognize both pathogen- and damage-associated molecular patterns to initiate innate immunity.1–3 TLRs mainly interact with Toll/IL-1 receptor (TIR) domain-containing adaptors, such as Myd88, Myd88-adaptor-like (Mal), TIR-domain-containing adapter-inducing interferon-β (TRIF) and TRIF-related adaptor molecule (TRAM) through cytoplasmic TIR domains to activate the downstream signaling pathways.1–4 Sterile alpha and HEAT/Armadillo motif containing 1 (Sarm1) was the fifth TIR domain-containing adaptor to be discovered; 4 however, the function of Sarm1 in innate immune response remains uncertain. Sarm1 was originally shown to down-regulate TRIF-dependent TLR3 and TLR4 signaling, and attenuate the expression of TNF-α, IL-8 and CCL5 in human embryonic kidney (HEK) cells and PBMC. 5 However, compared with wild type mice, lower levels of TNF and reduced microglial activation were found in Sarm1-/- brainstems after West Nile virus infection, 6 suggesting that the function of Sarm1 in neural innate immune response may not be simple down-regulation.
Although Sarm1 was originally studied with respect to innate immunity, it is predominantly expressed in the brain.7,8 In Caenorhabditis elegans, Sarm1/tir-1 has been shown to regulate left–right asymmetric expression of odorant receptor genes in olfactory neurons. 9 And, in mammals, Sarm1 has been shown to play multiple roles in controlling neuronal morphology. 8 Using cultured hippocampal neurons, we recently demonstrated that Sarm1 interacts with transmembrane heparan sulfate proteoglycan syndecan-2 and mediates the function of syndecan-2 to control dendritic arborization. 8 In addition, Sarm1 also regulates axonal extension and the establishment of neuronal polarity. 8 The function of Sarm1 in neuronal morphology is likely through the MKK4-JNK pathway, which influences microtubule stability and controls neuronal morphology. 8 In addition to neuronal morphogenesis, Sarm1 is also required for the injury-induced axon death pathway in both flies and rodents. 10 All these studies indicate that Sarm1 is crucial for the regulation of neuronal morphology.
Our previous study demonstrated that Sarm1 is expressed in neurons. 8 However, the anatomic distribution of Sarm1 in the brain has not yet been analyzed in detail. To further explore the function of Sarm1 in the brain, here we investigated the cell-type expression patterns and regional expression patterns of Sarm1 in mouse brain using double fluorescence immunostaining. We found that Sarm1 is widely distributed in different brain regions and expressed in a variety of neurons, but notably not in microglia. However, knockdown of Sarm1 altered expression of several cytokines in the brain suggesting that Sarm1 also regulates inflammatory and anti-virus cytokine expression in the brain. In view of these results, microglial cells are unlikely to be directly affected by Sarm1. A more likely scenario is that Sarm1 directly regulates cytokine expression in neurons to contribute to innate immunity in the brain.
Materials and methods
Abs
The primary Abs used for immunohistochemistry and immunoblotting were as follows: rabbit monoclonal anti-CaMKII (EP1829Y; Abcam, Cambridge, MA, USA); rat monoclonal anti-CD11b (M1/70; Abcam, Cambridge, MA, USA); rabbit polyclonal anti-GAD65/67 (AB1511; Millipore, Taipei, Taiwan); rabbit monoclonal anti-calbindin (C12D26; Cell Signaling, Danvers, MA, USA); rabbit polyclonal anti-tyrosine hydroxylase (H-196; Santa Cruz, Dallas, TX, USA); rabbit polyclonal anti-Iba1(019-19741; Wako Chemicals, Osaka, Japan); rabbit polyclonal anti-IL6 (AAM15G; AbD Serotec, Raleigh, NC, USA); rabbit polyclonal anti-IFNβ (ab140211; Abcam, Cambridge, MA, USA); mouse anti-valosin-containing protein (VCP) Ab (612183; BD Transduction Laboratories, Taipei, Taiwan); and HRP-conjugated goat anti-mouse IgG Ab (NA931; GE Healthcare, Taipei, Taiwan); mouse monoclonal anti-Sarm1 was generated as described. 8
Immunohistochemistry
Adult B6 mice (∼8 wk old) were anesthetized and transcardially perfused first with PBS and then 4% paraformaldehyde (PFA) in PBS. After removing the skull, the brains were post-fixed in 4% PFA at 4℃ for 12–15 h (overnight). Vibratome slices (50 µm) were permeabilized with 0.3% Triton X-100 in PBS for 10 min at 23–25℃ (room temperature). For blocking, slices were incubated in a solution containing 3% horse serum, 2% BSA and 0.3% Triton X-100 in PBS for 2 h at room temperature with gentle shaking. Primary Abs were diluted in the blocking solution and incubated with brain slices for 2 days at 4℃ with gentle shaking. After washing out excess Abs, secondary Abs conjugated with Alexa 488 and 555 (Invitrogen, Carlsbad, CA, USA) and DAPI were incubated with the slices for 2 h at room temperature on a shaker. After washing, slices were mounted onto glass slides and soaked in Vectashield Mounting Medium (H-1000; Vector Laboratories, Burlingame, CA, USA) for imaging. For fetal brain staining, whole embryos at E14.5 were washed with PBS and fixed in 4% PFA for 2.5 h at 4℃. After washing in PBS, the embryos were rotated in 30% sucrose at 4℃ overnight. After OCT embedding and cryosectioning (20 µm), sections were blocked with 5% horse serum and 0.2% Triton X-100 in PBS for 30 min with gentle shaking. Primary Abs were diluted in blocking solution and incubated overnight at 4℃. Secondary Abs were incubated as described for adult brain sections. Images were acquired using a confocal microscope (LSM700, Carl Zeiss, Oberkochen, Germany), and Zen2009 (Carl Zeiss, Oberkochen, Germany) acquisition and analysis software. All samples were imaged at 20–22℃. For publication, images were processed using Photoshop (Adobe, Taipei, Taiwan) with minimal adjustment of brightness or contrast to the entire images.
Western blot analysis
Whole brains of adult mice were homogenized with a glass pestle in PBS-based lysis buffer containing 1 mM EDTA, 10 mM β-glycerol phosphate, 1 mg/ml leupeptin, 1 mg/ml aprotinin, 1 mM PMSF and 20 mM NaF. After quantification, equal amounts of brain lysates were boiled with sample buffer containing 100 mM 2-mercaptoethanol at 95℃ for 5 min. For microglia lysate, BV2 cells seeded in 6-well plates were treated with LPS (InvivoGen, San Diego, CA, USA) at concentrations of 5 or 10 µg/ml for 24 h and harvested for immunoblotting. Ten micrograms of total lysate was separated by 10% SDS-PAGE and then transferred onto a polyvinylidene fluoride membrane. After transfer, the membrane was treated with blocking solution (2.5% non-fat milk in 0.3% TBST (Tris buffered saline with 0.3% Tween-20)) followed by incubation with mouse monoclonal anti-Sarm1, mouse anti-VCP and rabbit anti-Iba1 Ab at 4℃ overnight. Proteins were detected with HRP-conjugated goat anti-mouse IgG Ab and visualized with Western Lightning Plus ECL (PerkinElmer, Waltham, MA, USA), according to the protocol provided.
Quantitative and single-cell RT-PCR
For quantitative RT-PCR, total RNAs were extracted from E14.5 whole brain and adult cortex by homogenizing the tissue with Trizol reagent according to the manufacturer’s instructions (Invitrogen, Carlsbad, CA, USA). The RNA of BV2 and Neuro-2 A cells were collected by directly lysing the cells cultured on 10-cm dishes with Trizol. For the single-cell RT-PCR assay, the individual somata of cultured mouse cortical neurons were visualized with an inverted Axiovert 2000 microscope (Carl Zeiss, Oberkochen, Germany) equipped with a 40 × objective lens/NA 0.6 (LD Plan-Neofluar; Carl Zeiss, Oberkochen, Germany) and collected using a glass micropipette. The somata were immediately put into a solubilization solution [0.5% NP-40 and 1 U/µl RNaseOUT recombinant ribonuclease inhibitor (Invitrogen, Carlsbad, CA, USA) in diethyl pyrocarbonate (DEPC) water]. After freezing and thawing, total RNAs were extracted by using Trizol. Extracted total RNAs were further incubated with DNase I (New England Biolab, Ipswich, MA, USA) for 30 min at 37℃ to remove contaminating DNA. For brain tissues, BV2 and Neuro-2 A, 5 µg of total RNA was applied for cDNA synthesis using Transcriptor First Strand cDNA Synthesis Kit (Roche Diagnostics, Mannheim, Germany) with an anchored-oligo(dT)18 primer. For single-cell experiments, all of the RNA underwent reverse transcription. The PCR reaction was performed using the Universal Probe Library (UPL; Roche Diagnostics) and LightCycler480 system (Roche Diagnostics). The primers and their paired probes, designed using the Assay Design Center Web Service (http://qpcr.probefinder.com/roche3.html), were as follows: IL-6-F: 5′-GCT ACC AAA CTG GAT ATA ATC AGG A-3′ and IL-6-R: 5′-CCA GGT AGC TAT GGT ACT CCA GAA-3′, with UPL Probe #6; Cyclophilin-F: 5′-TGC CCA GCA GTT TAG TAC CC-3′ and Cyclophilin-R: 5′-TGC TTC CCT GTC TCC ACA GT-3′, with UPL Probe #64; IFNβ-F: CTGGCTTCCATCATGAACAA and IFNβ-R: AGAGGGCTGTGGTGGAGAA, with UPL Probe#18; MECP2-F: CAGCTCCAACAGGATTCCAT and MECP2-R: TCTTCTGACTTTTCCTCCCTGA, with UPL Probe#33; Dnmt1-F: CAAATAGATCCCCAAGATCCAG and Dnmt1-R: CGGAACTAGGTGAAGTTTCAAAAA with UPL Probe#2; Sarm1-F: GCTTGCTGGAGCAGATCCT and Sarm1-R: TCACGCCTAGACCGATGC with UPL Probe#102. IL1β-F: AGTTGACGGACCCCAAAAG and IL1β-R: AGCTGGATGCTCTCATCAGG with UPL Probe#38. IL10-F: CAGAGCCACATGCTCCTAGA and IL10-R: TGTCCAGCTGGTCCTTTGTT with UPL Probe#41. IL12b-F: GCTTCTTCATCAGGGACATCA and IL12b-R: CTTGAGGGAGAAGTAGGAATGG with UPL Probe#1. TNFα-F: TTGTCTTAATAACGCTGATTTGGT and TNFα-R: GGGAGCAGAGGTTCAGTGAT with UPL Probe#64. CCL5-F: TGCAGAGGACTCTGAGACAGC and CCL5-R:GAGTGGTGTCCGAGCCATA with UPL Probe#110. Iba1-F: GGATTTGACGGGAGGAAAAG and Iba1-R: TGGGATCATCGAGGAATTG with UPL Probe#3. Each sample was analyzed in triplicate to avoid pipetting errors. PCR products after each cycle were monitored by the fluorescent signal. The PCR included the following steps: pre-incubation at 95℃ for 10 min, 45 cycles of 10 s denaturation at 95℃, 30 s annealing at 60℃, 1 s extension at 72℃ and a cooling process at 40℃ for 30 s. The relative expression level of the target gene in each sample was calculated with the 2−ΔΔCt method using the crossing point (CP) value and normalizing to the level of cyclophilin or L13. Sample sizes (numbers of animals) are indicated in the figures.
Results
Sarm1 is mainly expressed in neurons in mouse brain
We used various markers and Sarm1 mAb
8
to characterize the distribution of Sarm1 in different brain regions. Sarm1 was widely expressed in different regions of the cerebral cortex, including the retrosplenial agranular cortex, motor cortex and sensory cortex (Figure 1A). Sarm1 was also distributed in every layer of the cerebral cortex (Figure 1A). Based on the distribution pattern and cell morphology, we speculated that the Sarm1-positive cells were neurons. To confirm this, we performed double staining with Sarm1 and CaMKII, a marker for projection neurons, and GAD65/67, a marker for interneurons. Basically, we found that all the CaMKII-positive cells were Sarm1-positive (Figure 1A, upper panel). In GAD65/67-positive interneurons, although the Sarm1 immunoreactivity was weaker, Sarm1 was also present in every GAD65/67-positive interneuron (Figure 1A, lower panel). We concluded that Sarm1 is widely expressed in neurons localized in different regions and different layers of the cerebral cortex.
Expression of Sarm1 in both projection and inhibitory neurons in mouse cerebral cortex and hippocampus. Adult mouse brains were subjected to double immunostaining using Sarm1 and CaMKII or GAD65/67 Abs as indicated. (A) Cerebral cortex; (B) hippocampus. CaMKII is a marker for projection neurons; GAD65/67 is a marker for inhibitory neurons. In (A) the right panels are areas from the motor cortex region shown at higher magnification. All the CaMKII-positive neurons express Sarm1. Similarly, all GAD65/67-expressing neurons also express Sarm1. In (B) Sarm1 was expressed in all cell layers CA1, CA2, CA3 and the dentate gyrus (upper panel). The upper right panel is a high magnification image of the CA1 region. As shown in the lower panel, most of the interneurons are located outside the cell layers. The GAD65/67-positive interneurons also express Sarm1 (lower right panel). Scale bars: 200 µm in the left panels of (A) and (B); and 20 µm in the right panels of (A) and (B). DG: dentate gyrus; MC: motor cortex; RSA: retrosplenial agranular cortex; SC: sensory cortex; SL: stratum lacunosum; SM: stratum moleculare; SO: stratum oriens; SR: stratum radiatum.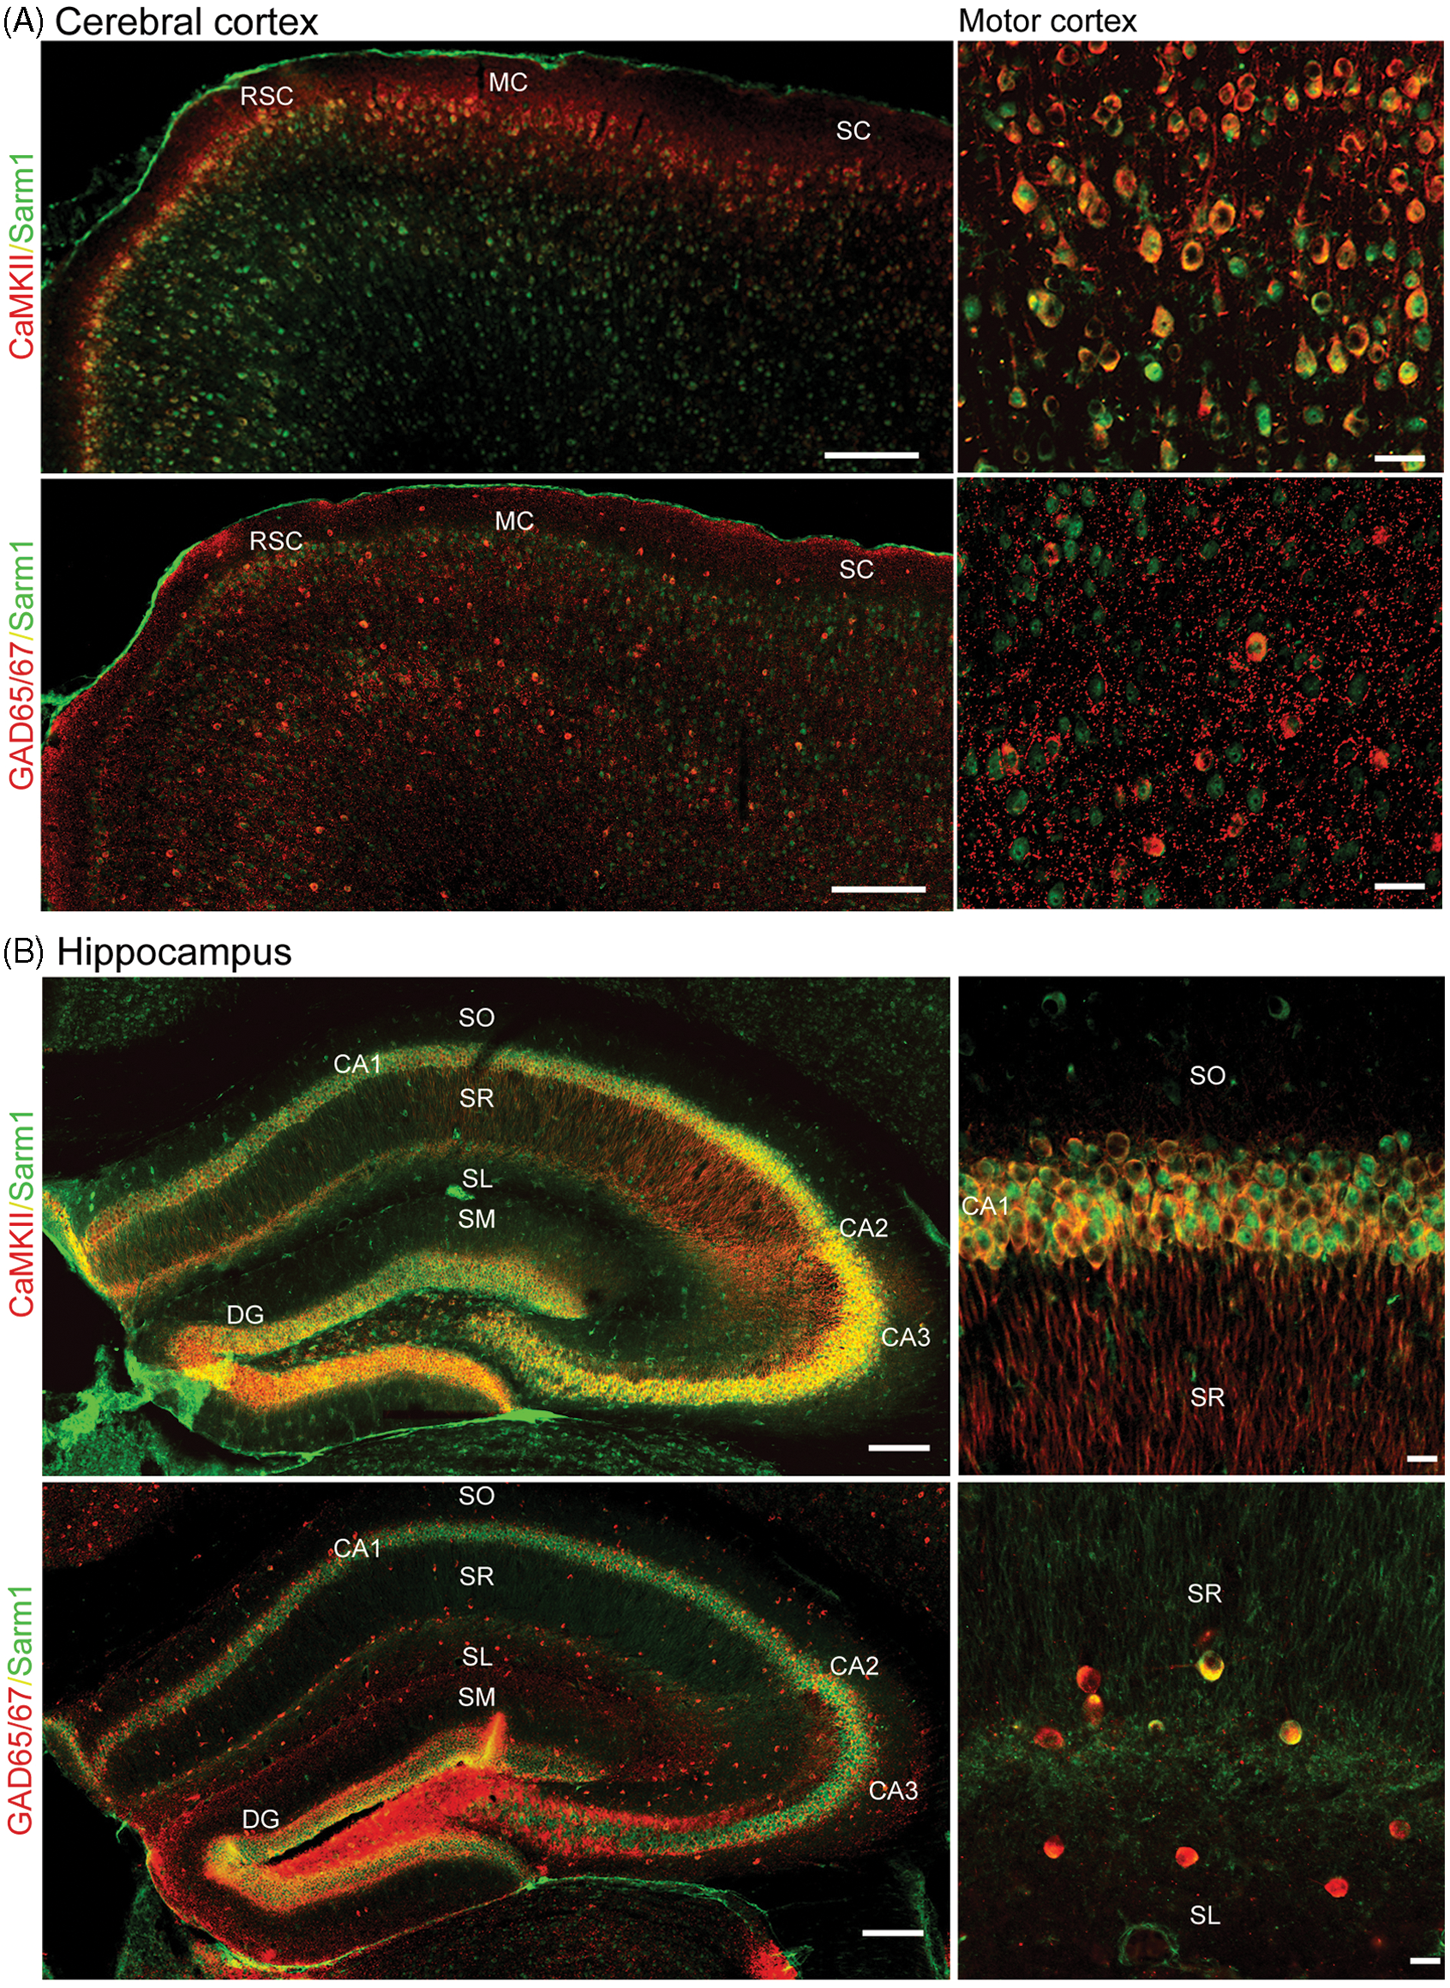
In the hippocampus, Sarm1 was also expressed in all regions, including the dentate gyrus, CA3, CA2 and CA1 (Figure 1B). Similar to the cerebral cortex, CaMKII- and GAD65/67-positive cells also expressed Sarm1 (Figure 1B). In the amygdala, Sarm1 was present in both CaMKII-positive projection neurons and GAD65/67-positive interneurons (Figure 2A, B).
Distribution of Sarm1 in amygdala, cerebellum and midbrain. (A) Sarm1 expression cells were scattered in the amygdala. Most of these cells are CaMKII-positive projection neurons. Co-localization of Sarm1 and CaMKII in the lateral and basal amygdala is shown at high magnification in the right panels. (B) GAD65/67-positive inhibitory neurons in the amygdala also express Sarm1. High magnifications indicating the co-localization are shown in the right panels. Scale bars: 200 µm in the left panels of (A) and (B); and 20 µm in the right panels of (A) and (B). (C) In the cerebellum, Sarm1 is mainly expressed in the Purkinje cells marked by calbindin. High magnification of lobe VII in the right panel shows that all calbindin-positive Purkinje cells express Sarm1. Calbindin-negative basket cells located in the Purkinje cell layer also express Sarm1, but at a relatively lower level. Scale bars: 500 µm in the left panels; 100 µm in the right panel. (D) Sarm1 was also expressed in the midbrain. The dopaminergic neurons in the ventral tegmental area (VTA) were labeled by tyrosine hydroxylase (TH) Ab. High magnification of VTA is shown in the right panel. Scale bars: 200 µm in the left panels; 20 µm in the right panel. LA: lateral amygdala; BA: basal lateral amygdala. GC: granular cell layer; M: molecular layer; P: Purkinje cell layer.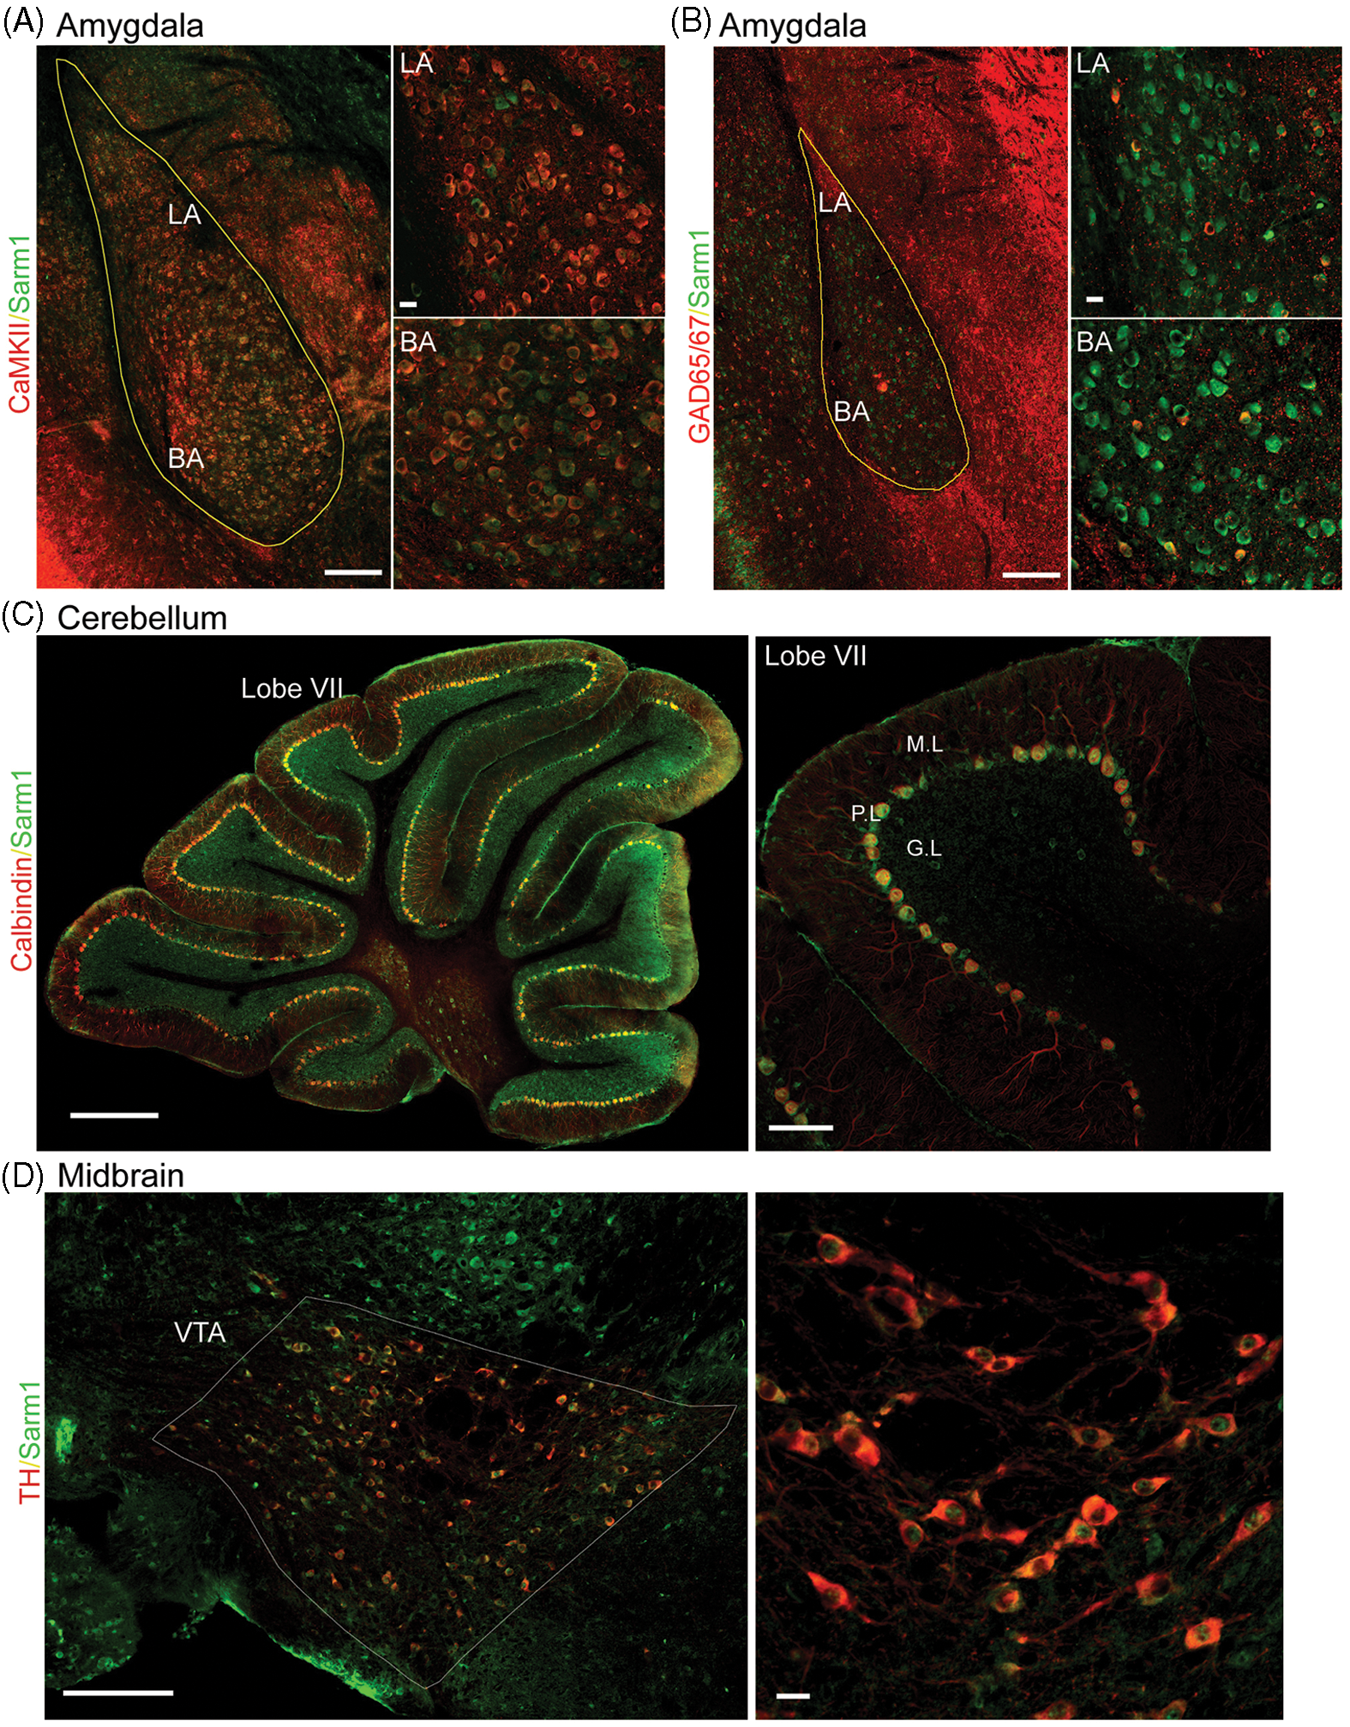
In the cerebellum, Sarm1 was predominantly expressed in Purkinje neurons, which were labeled by calbindin (Figure 2C), and a weaker Sarm1 signal was also found in interneurons in the granular cell layer and molecular layer (Figure 2C). In addition to the forebrain and cerebellum, Sarm1 was also expressed in the midbrain (Figure 2D). Double -staining with Ab recognizing tyrosine hydroxylase, an enzyme catalyzing the conversion of the amino acid L-tyrosine to L-3,4-dihydroxyphenylalanine, further indicated that Sarm1 was expressed in the dopaminergic neurons of the ventral tegmental area of the midbrain (Figure 2D).
In conclusion, the results of the fluorescent immunostaining covering different areas of mouse brain indicated that Sarm1 is widely expressed in brain and is present in a variety of neurons.
Sarm1 is not detectable in microglial cells
The aforementioned results indicate that Sarm1 is mainly expressed in neurons. However, a previous study showed that a deficiency of Sarm1 results in the impairment of microglial activation.
6
To examine whether Sarm1 is expressed in microglia, we performed double immunostaining with Abs recognizing Sarm1 and CD11b or Iba1, the markers that label both resting and activated microglia. Unexpectedly, we did not find Sarm1 immunoreactivity in microglial cells in mouse cerebral cortex (Figure 3A, B) or hippocampus (Figure 3C). Therefore, it seems unlikely that Sarm1 directly regulates the innate immune response mediated by microglial cells.
Lack of Sarm1 expression in microglia. (A) CD11b+ microglial cells are dispersed in the cerebral cortex; however, none of CD11b + cells express Sarm1. (B) High magnification of (A). The arrow indicates an example showing typical microglia morphology, which is negative for Sarm1 expression in its cell body, nucleus and cell processes. Arrowheads indicate examples of the CD11b-positive signals located in Sarm1-positive neurons. (C) In the stratum radiatum of the hippocampus, which is mainly comprised of neuronal fibers, CD11b+ microglias also showed a dispersed pattern and none of them expressed Sarm1 protein. (D) Z-Series analysis of CD11-positive punta in a neuron. (i) Z-Stack of images in the x–y plane (focal section: 3/9, section thickness: 1µm) (ii) cross-section of z-axis projection image from y planes. (iii) Cross-section of z-axis projection image from x planes. The series z stacks of (ii) and (iii) indicates invasion of microglia into neighboring neuron. Scale bars: 50 µm in (A) and (C); 10 µm in (B) and (D). (E) The absence of Sarm1 proteins in microglial BV2 cells. Sarm1 was not detectable in the cell lysate of BV-2 microglia with immunoblotting, even after LPS treatment at the doses of 0.5 µg and 1 µg/ml for 24 h. (F) Sarm1 expression in BV2 cells examined by quantitative RT-PCR. The left panel is a comparison of Sarm1 expression levels in murine neuroblastoma Neuro-2A (N2A) cell line, BV2, and BV2 activated by LPS treatment. In the right panel, microglia marker, Iba1, was specifically expressed in BV2, but not in N2A. Sample size is n = 3 for each group. *P < 0.05; ***P < 0.001.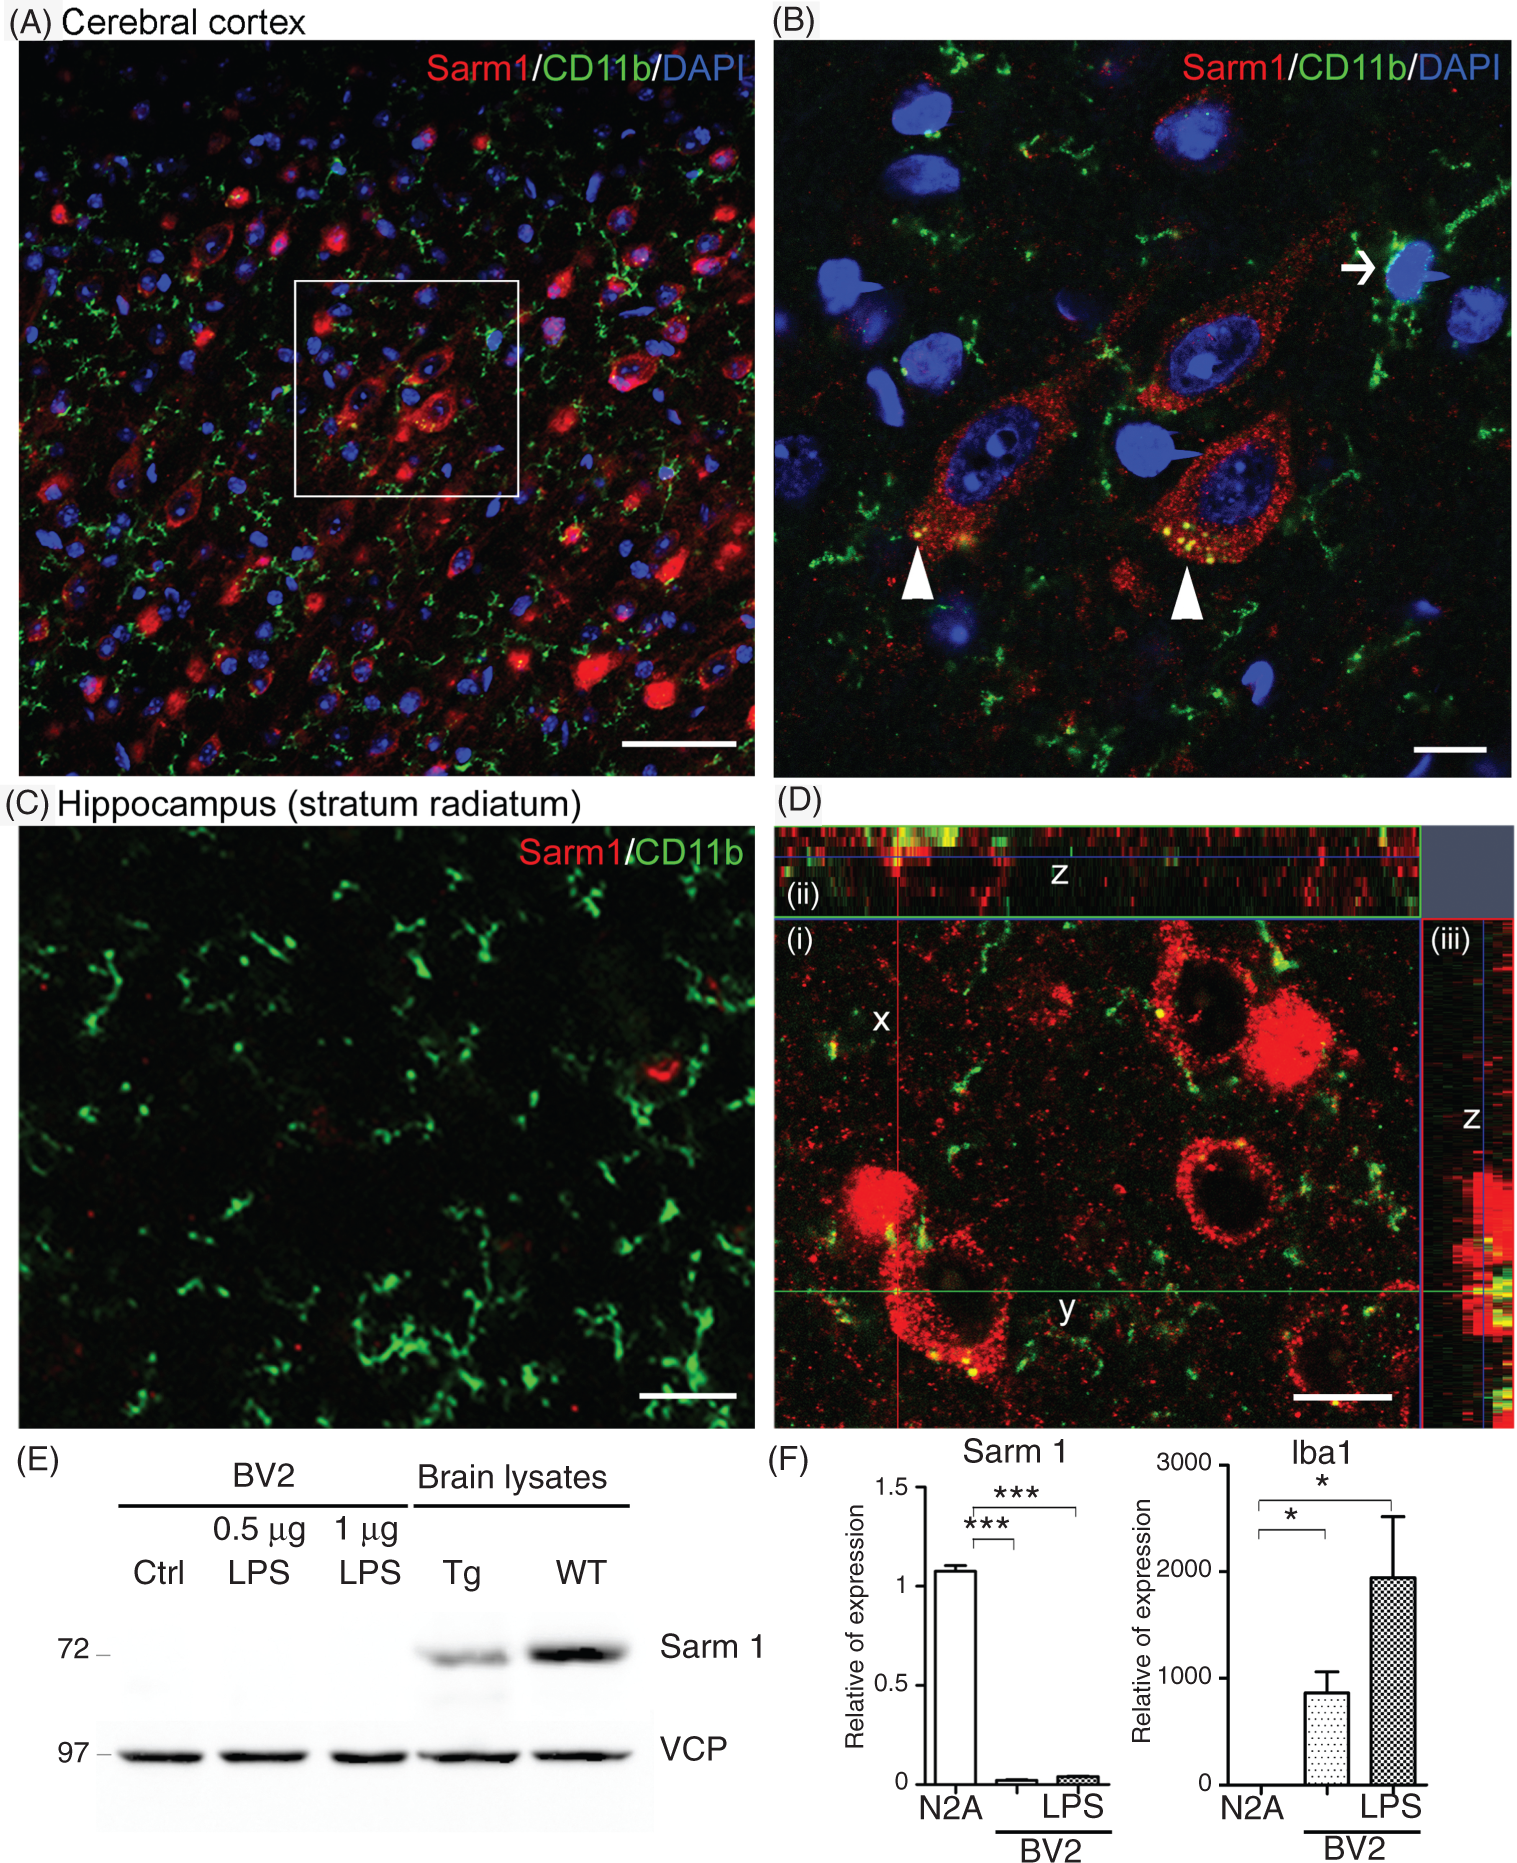
We noticed that CD11b-positive puncta were occasionally present in Sarm1 positive neurons (Figure 3B, arrowheads). The signals were not a staining artifact because Z-series analysis showed that the CD11b-positive signals in neurons were actually the processes extending from neighboring microglia (Figure 3D). Recently, a study in larval zebrafish showed that neurons steer the processes of resting microglia and promote the contacts between microglia and neurons in a neuronal activity-dependent manner. 11 The tight contact between microglial cells and neurons in zebrafish is similar to our finding in mouse brains. This suggests that the reciprocal modulation between resting microglia and neurons is likely an evolutionally conserved regulation.
To confirm the absence of Sarm1 in microglial cells, we further examined Sarm1 expression in murine microglial BV2 cells, which are commonly used as a cell line representing primary microglial cells. 12 By immunoblotting, Sarm1 proteins were undetectable in BV2 cell lysates (Figure 3E). In addition to immunoblotting, we further performed the more sensitive quantitative RT-PCR to examine the Sarm1 expression in BV2 cells. Compared with the positive control, murine neuroblastoma Neuro-2A cells, the Sarm1 RNA level in BV2 cells was extremely low (Figure 3F). The weak signals of Sarm1 in BV2 cells were not due to the poor quality of RNA because the microglial marker Iba1 was easily detected in BV2 cells (Figure 3F). As LPS stimulation induces Sarm1 expression in PBMC, 5 we then wondered whether Sarm1 would be up-regulated after LPS treatment in BV2 cells. However, in contrast to PBMC, LPS did not induce Sarm1 expression in BV2 cells at the protein or RNA level, although LPS induced Iba1 expression (Figure 3E, F). The experiments using BV2 cells supported the earlier double immunostaining result and together strongly suggest that Sarm1 is not noticeably expressed in microglial cells.
In addition to the adult brain examined in the above experiments, we also investigated the expression pattern of Sarm1 at embryonic d 14.5 (E14.5). In the cortical plate, Sarm1 co-existed with MAP2, a neuronal marker (Figure 4A, B), indicating neuronal expression of Sarm1 at the embryonic stage. In addition to the cortical plate, Sarm1 was also expressed highly in the marginal zone and at a moderate level in the intermediate zone (Figure 4A, B). We then examined whether Sarm1 is expressed in microglia at the embryonic stage. At E14.5, microglial cells labeled with Iba1 Ab were sparsely distributed in mouse brains (Figure 4C). We still did not find Sarm1 expression in microglial cells at E14.5 (Figure 4D). Similar to adult brains, at the embryonic stage some microglial cells tightly interacted with Sarm1-positive neurons (Figure 4D, lower right panel). Taken together, the experiments using adult and embryonic mouse brains and BV2 cells indicate an absence or extremely low level of expression of Sarm1 in microglial cells.
Expression pattern of Sarm1 in embryo brains at E14.5. Sarm1 was double stained with MAP2, which delineates the regions of the cortical plate. In this caudal section, Sarm1 was expressed in the cortical plate, where it was co-localized with MAP2. In addition, Sarm1 was also expressed in the marginal zone and the intermediate zone. (B) Higher magnification of (A). (C) Sarm1 was double stained with microglia marker Iba1. The cell population of microglia at E14.5 was smaller than that in the adult brain shown in Figure 3. (D) Z-Series analysis of Sarm1 expression in Iba1-positive microglia. (i) Z-Stack of images in the x–y plane (ii) cross-section of z-axis projection image from the y planes. (iii) Cross-section of z-axis projection image from x planes. The series z stacks of (ii) and (iii) suggest that microglia per se do not express Sarm1, but are often surrounded by cell extensions containing Sarm1 signals from neighboring cell. Scale bars: 200 µm in (A) and (C); 10 µm in (B) and 5µm in (D). mz: marginal zone; cxp: cortical plate; sp: subplate; iz: intermediate zone; svz: subventricular zone; vz: ventricular zone; cp: caudoputamen; LV: lateral ventricle.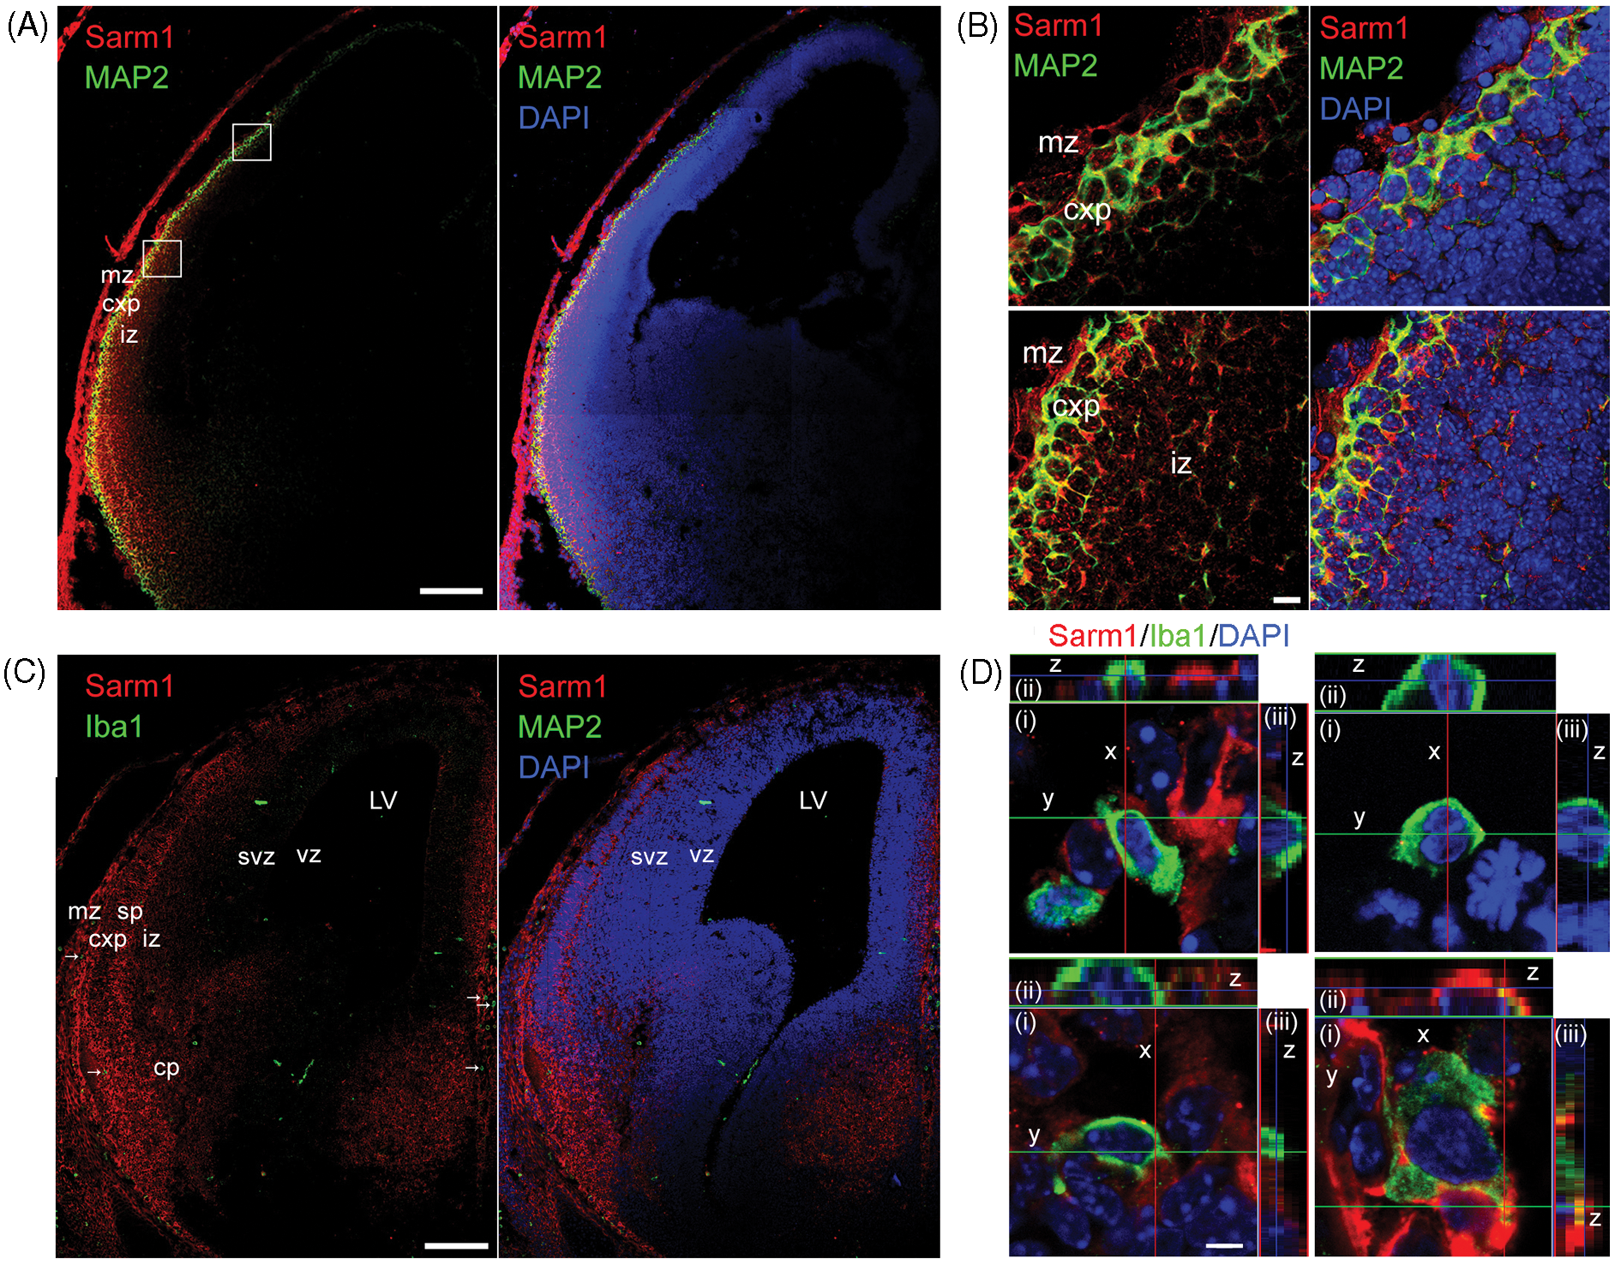
Forebrain neurons express IL-6 and IFN-β
Previous studies have demonstrated the expression of inflammatory cytokine IL-6 and antiviral cytokine IFN-β in sympathetic neurons and cerebellar neurons.13–15 Here, we further investigated the expression of IL-6 in forebrains. Using single-cell RT-PCR to analyze cultured cortical neurons we found that some mouse cortical neurons express the IL-6 transcript, even under normal culture conditions (Figure 5A, B). In addition, double immunostaining was performed to investigate the protein expression of IL-6 and IFN-β in adult mouse brains. Both IL-6 and IFN-β Abs revealed a small punctate pattern in mouse brain sections (Figure 5C, D). The puncta were localized in MAP2-positive cells, indicating neuronal expression of IL-6 and IFNβ (Figure 5C, D, left panel). Although microglial cells are recognized as professional immune cells in brains, we barely detected IL-6 and IFN-β in resting microglia (Figure 5C, D, right panel). Perhaps, expression of IL-6 and IFN-β in microglial cells are induced by immune challenge.
Neurons express IL-6 and IFN-β. (A), (B) Single-cell RT-PCR was performed to investigate the expression of IL-6 mRNA in cultured mouse cortical neurons at 4 day in vitro. (A) The representative images before and after collecting the soma of a neuron for single-cell PCR. Scale bar: 20 µm. (B) Single-cell RT-PCR. The results of eight single neurons are shown. Two negative controls, medium (M) and non-template control (NTC), are shown to indicate the specificity of PCR. (C) IL-6 was double stained with neuronal marker, MAP2, or with microglia marker, CD11b. (D) IFN-β was double stained with MAP2 or with CD11b. Scale bars: 10 µm in (C) and (D). SR: stratum radiatum.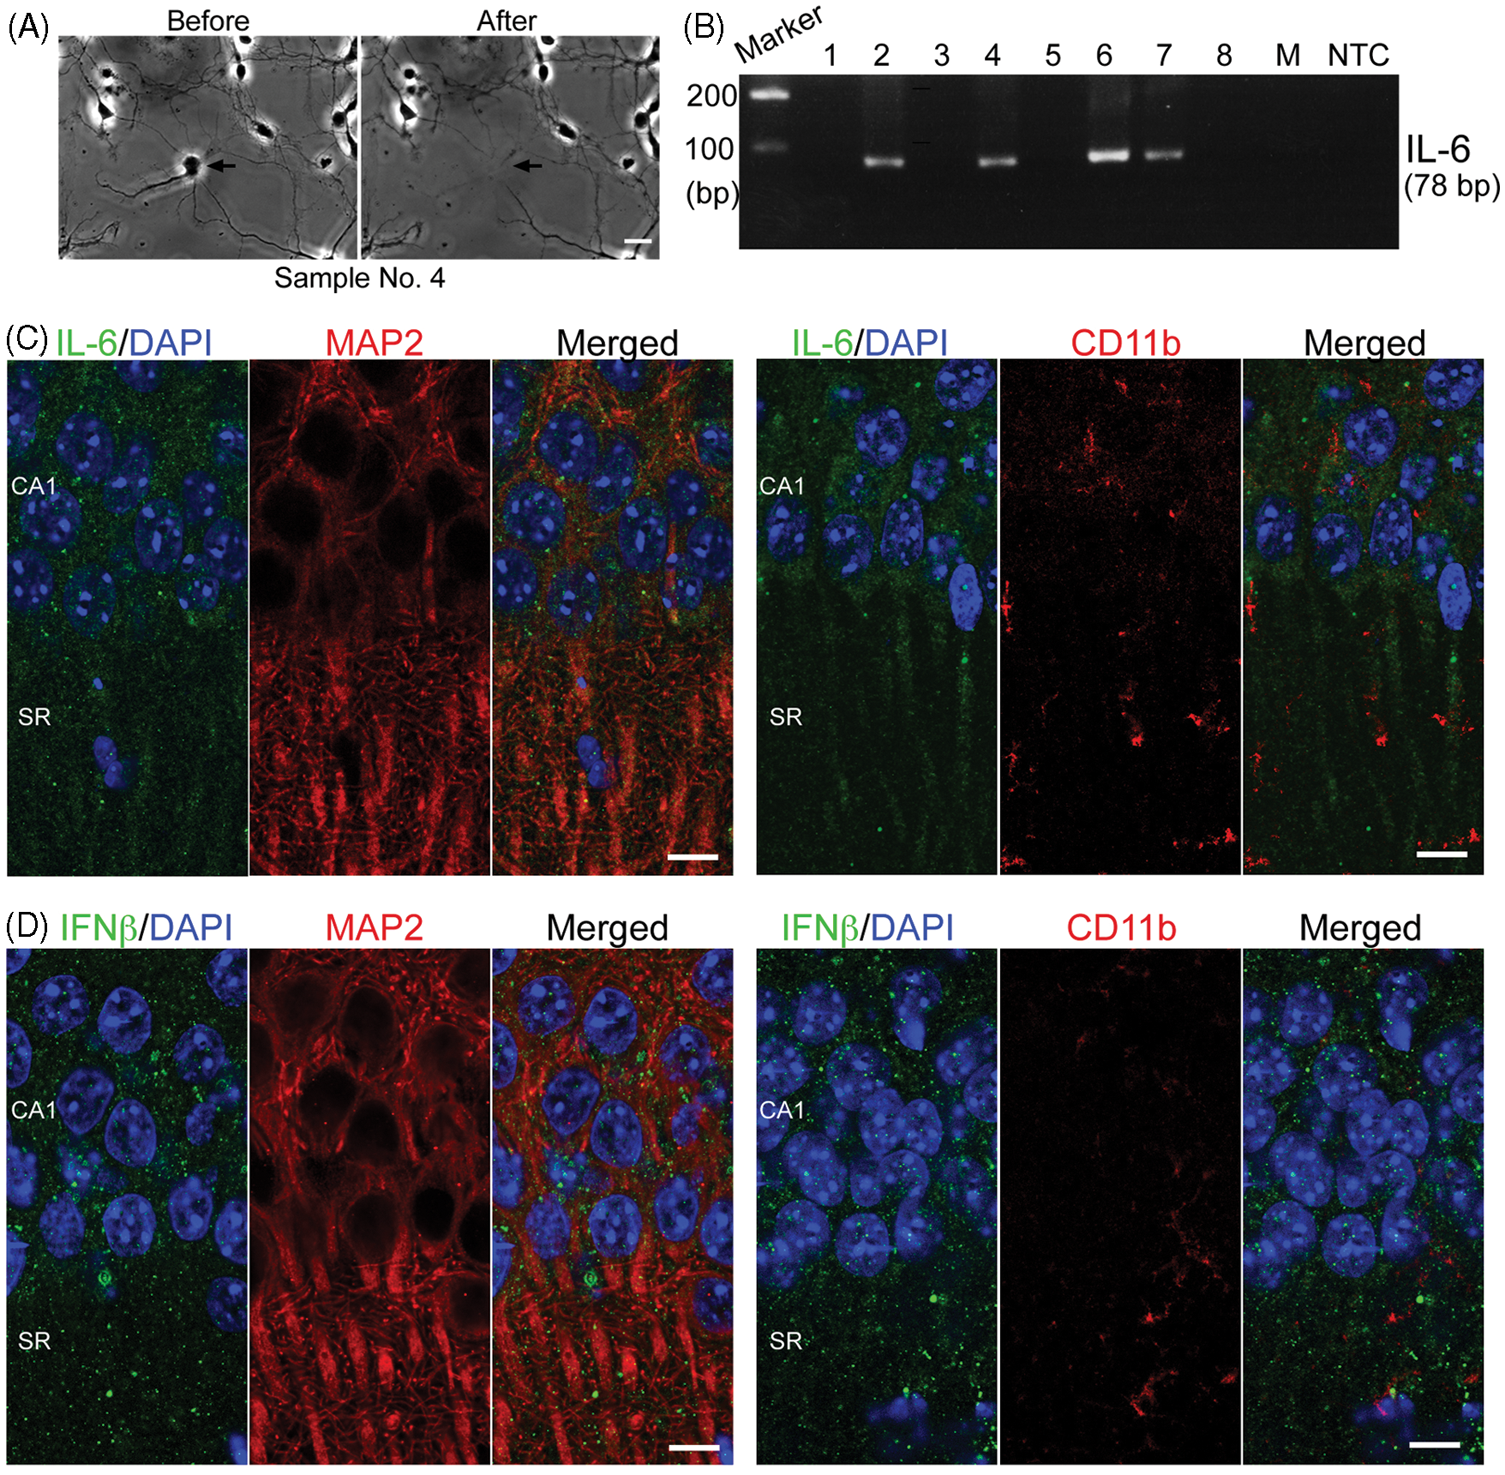
Reduction of Sarm1 dysregulates cytokine expression in brain
Induction of cytokine expression is the critical step of TLR activation to induce innate immunity. Previous studies13–15 and our results (Figure 5) clearly indicate cytokine expression in neurons. Moreover, Sarm1 negatively regulates TLR signaling.
5
Therefore, although Sarm1 was not expressed in microglia, we still wondered whether Sarm1 influences expression of the inflammatory and antiviral cytokines in the brain. Several transgenic mouse lines harboring an artificial miRNA cassette against Sarm1 expression have been generated in our laboratory.
8
Because the miRNA cassette was inserted into the 3′ untranslational region of the GFP transcript, the transgenic mice are easily identified by the fluorescent signals of GFP (Figure 6A). In addition to the GFP signal, the knockdown efficiency of Sarm1 was routinely confirmed using immunoblotting with Sarm1 Ab or quantitative PCR (Figure 6B–D). We examined the levels of a series of cytokines in embryonic brain at E14.5 by quantitative PCR. Among the cytokines examined, we found that the RNA levels of both IL-6 and IFNβ were increased in Sarm1 knockdown transgenic mice (Figure 6C). There was no noticeable difference in levels of the other cytokines, including IL-1β, IL-10, IL-12b, CCL5 and TNF-α, in Sarm1 knockdown transgenic mice and their WT littermates (Figure 6C). In addition, the expression levels of other genes, such as DNA methyltransferase 1 (Dmnt1) and methyl-CpG-binding protein 2 (MeCP2), were not changed by Sarm1 knockdown (Figure 6C), supporting the specific effect of Sarm1 on IL-6 and IFNβ expression in embryonic brains.
Dysregulated cytokine expression in Sarm1 knockdown mice. (A) Gross morphology of Sarm1 knockdown brain. Left panel, brain morphology of a Sarm1 knockdown (Tg) mouse and a wild type (WT) littermate. Right panel, GFP signal labeling the Sarm1 knockdown brain. (B) The Sarm1 protein levels were lower in Sarm1 knockdown brains. Immunoblotting was performed using Sarm1 and VCP Abs. (C), (D) Quantitative RT-PCR was carried out to quantify the mRNA levels of several inflammatory and antiviral cytokines in Sarm1 knockdown (Tg) and WT littermates in (C) E14.5 mouse brains and in (D) adult mouse cerebral cortex. Before collecting the brains, GFP signals were used to distinguish Sarm1 knockdown and WT mice. Some RNA samples were also measured to confirm the efficacy of Sarm1 knockdown at the RNA level. Two unrelated genes, Dmnt1 and MeCP2, were used as negative controls. Data represent means ± SEM. The sample sizes (n) indicating the number of animals are shown in the columns. *P < 0.05; **P < 0.01; ***P < 0.001.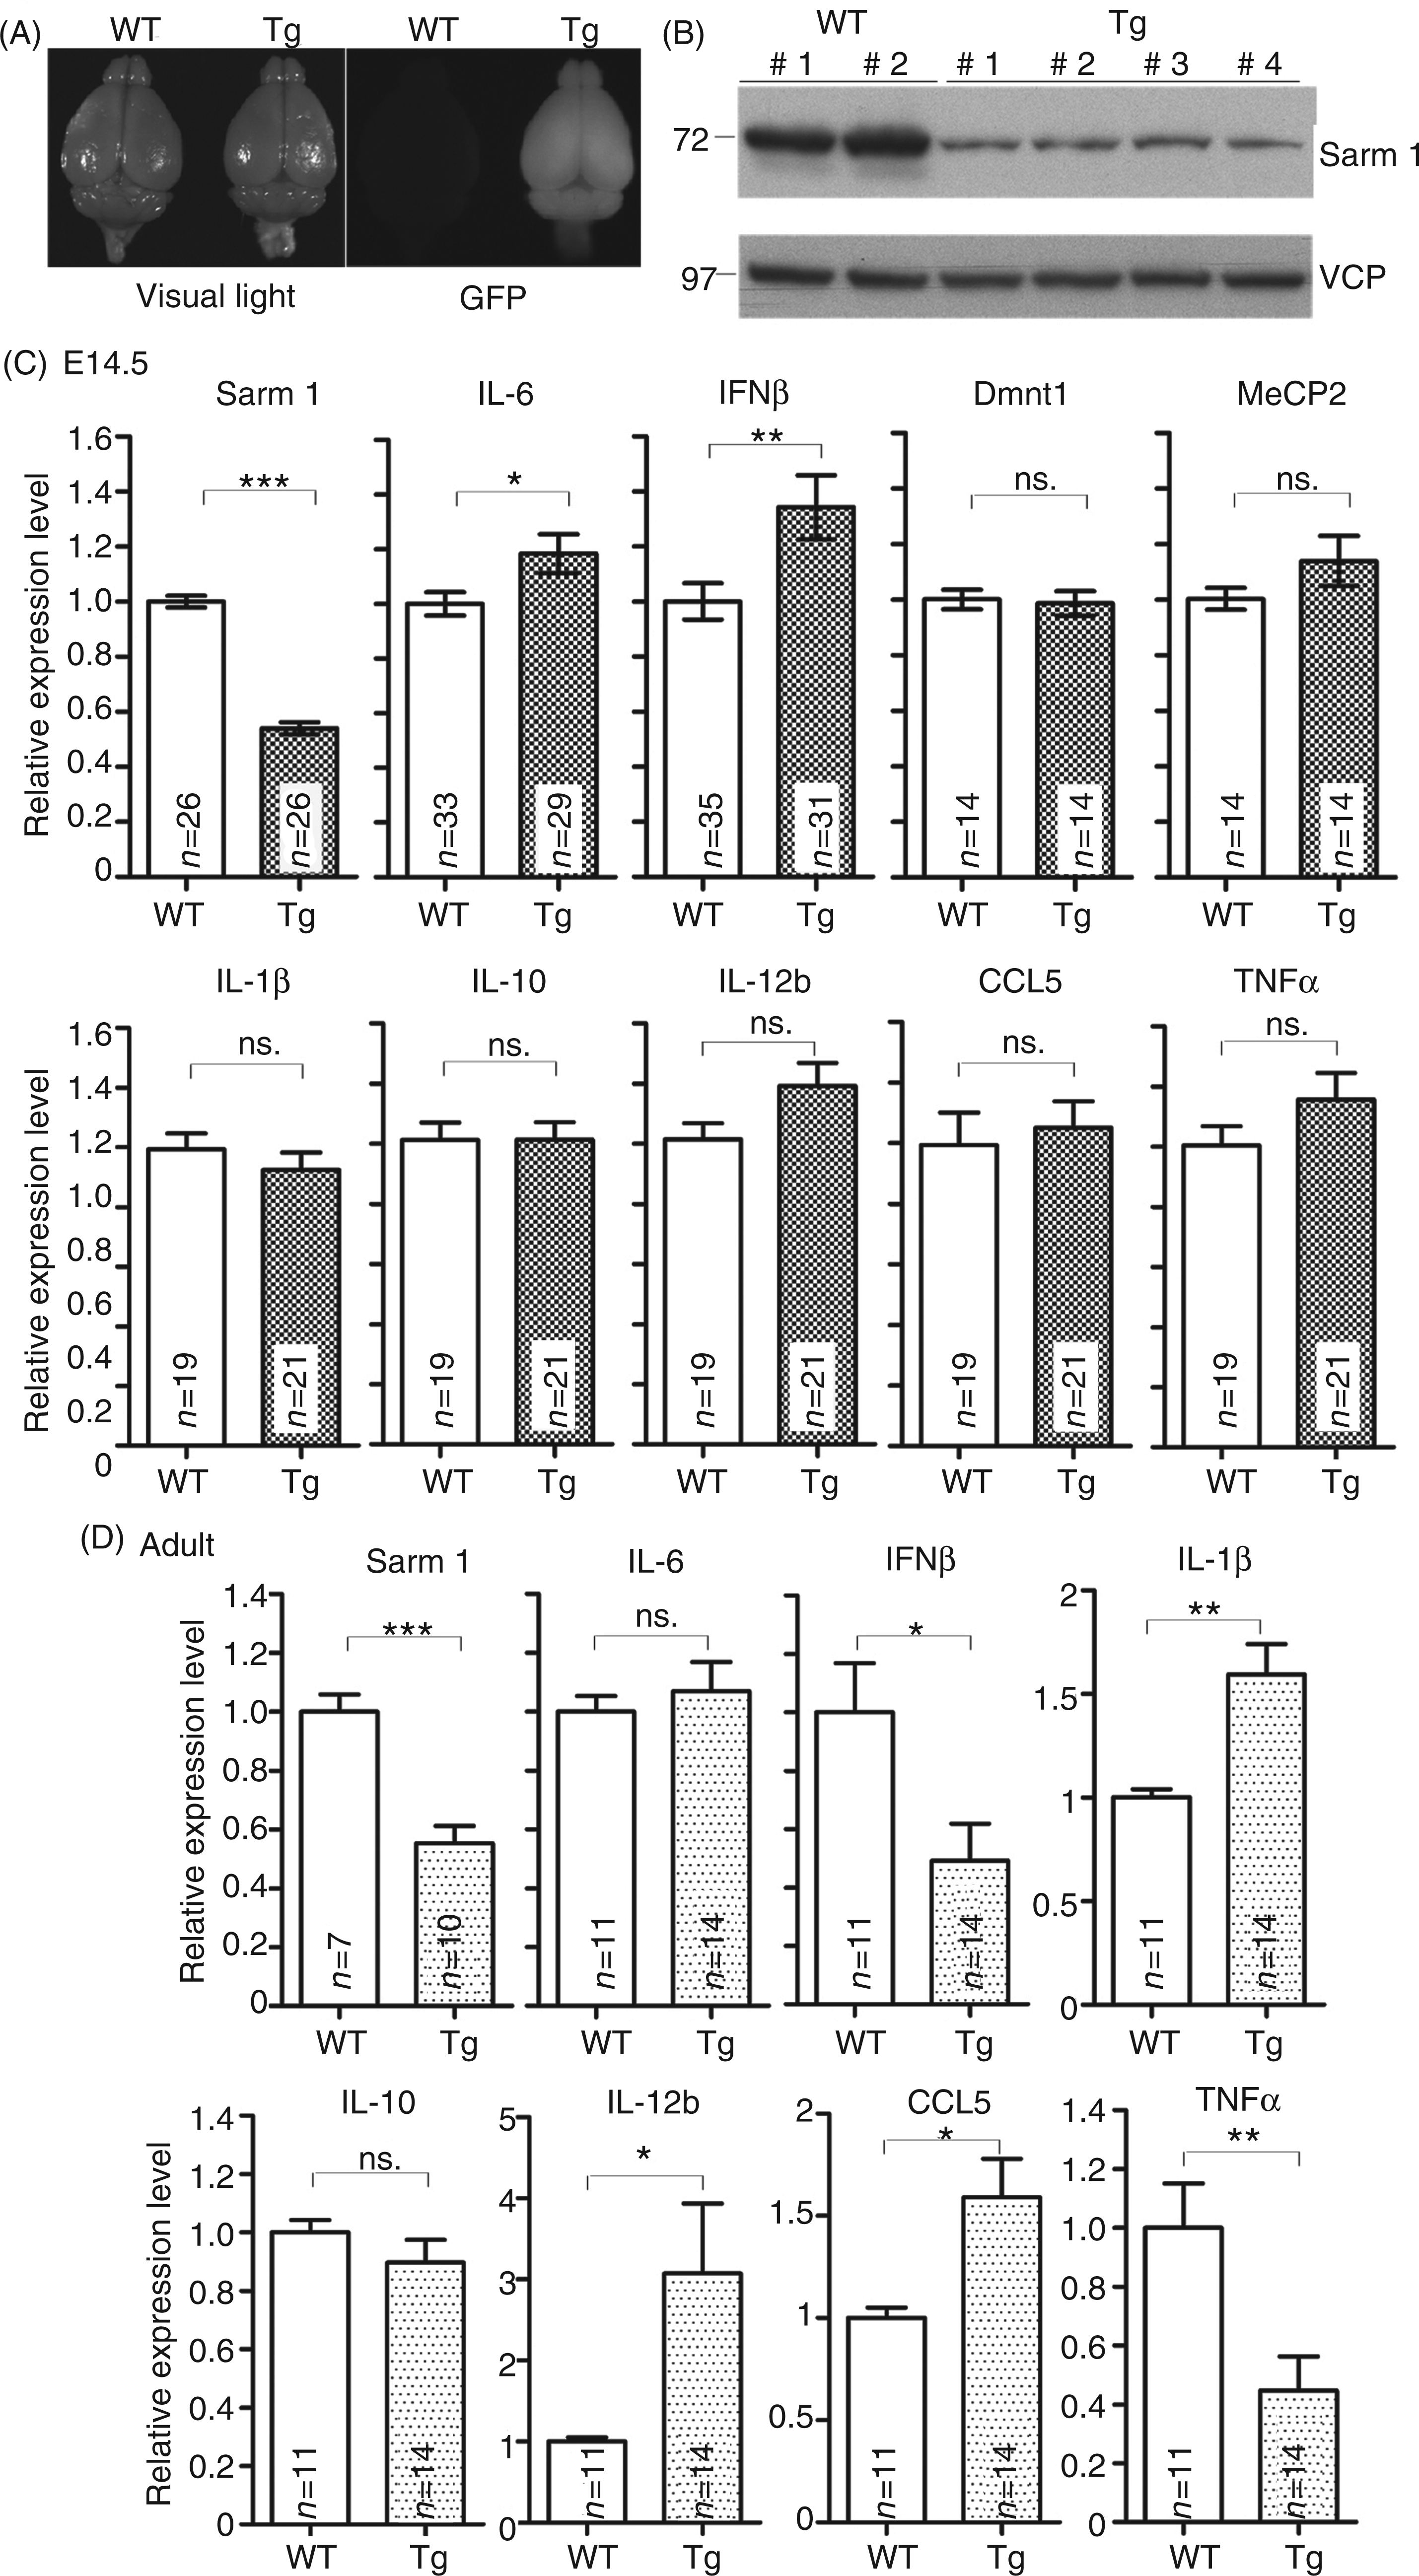
We also investigated whether Sarm1 influences cytokine expression in adult mice. Unexpectedly, the cytokine expression profile regulated by Sarm1 in adult brains was different from that in embryonic brains. The same as in embryonic brains, IL-10 expression was unchanged in the WT and Sarm1 knockdown adult brains; however, there was also no obvious difference in the level of IL-6 in the WT and Sarm1 knockdown adult brains (Figure 6D). IFN-β and TNF-α were down-regulated in Sarm1 knockdown brains (Figure 6D). The result showing TNF-α reduction in Sarm1 knockdown brains is similar to the data collected from Sarm1-/- mice by Szretter et al. 6 In contrast, IL-1β, CCL5 and IL-12B were all significantly up-regulated in Sarm1 knockdown adult brains (Figure 6D). The CCL5 up-regulation in adult brains echoes the results collected by Carty et al. using HEK cells, 5 which showed that Sarm1 attenuated CCL5 expression. Thus, compared with embryonic brains, Sarm1 has a broader effectt on cytokine expression in adult brains.
In conclusion, although it is unclear why Sarm1 knockdown has a different effect on cytokine expression in adult and embryonic brains, our data suggest that Sarm1 expressed in neurons influences expression of inflammatory and antiviral cytokines in the absence of immune challenge.
Discussion
This report examined the distribution of Sarm1 in mouse brain and the role of Sarm1 in the regulation of cytokine expression. Sarm1 was widely expressed in all the brain regions examined, including the cerebral cortex, hippocampus, amygdala, cerebellum and midbrain. Further, the results of double immunostaining clearly showed that Sarm1 is expressed in neurons—both projection neurons and interneurons—in mouse brain. In contrast, although microglial cells are critical players in innate immune responses in the brain, expression of Sarm1 in resting microglial cells was undetectable. This neuron-specific distribution of Sarm1 in mouse brain echoes our previous finding, suggesting that Sarm1 plays a critical role in neuronal morphogenesis. Although only hippocampal neurons were investigated in our previous study, it is likely that Sarm1 plays a general role in controlling the morphogenesis of a variety of neurons.
Using RT-PCR to analyze the primary cultures, a previous study showed Sarm1 expression in all of neurons, astrocytes and microglial cells. 6 However, the detailed methods used to prepare the primary cultures and the purities of the primary cultures were not described in the previous work. It is possible that neuronal contamination contributed to the PCR signals of Sarm1 in the previous study because Sarm1 is highly expressed in neurons. In this study, we did not detect noticeable RNA levels of Sarm1 in microglial BV2 cells compared with Neuro-2A cells. Immunostaining did not reveal significant signals in resting microglial cells in mouse brains either. Although it might still be possible that resting microglial cells in mouse brains express a very low level of Sarm1 proteins that is under the detection threshold of our Sarm1 Ab, our results favor the conclusion that Sarm1 proteins are predominantly expressed in neurons and not in microglial cells.
Although Sarm1 is undetectable in microglia, our data showed that the expression levels of antiviral and inflammatory cytokines are altered in Sarm1-knockdown transgenic mice. Here, using single-cell PCR and double immunostaining, we demonstrated that murine neurons also express IL-6 and IFN-β. In Sarm1 knockdown embryonic brains, IL-6 and IFN-β were up-regulated, indicating that Sarm1 may negatively regulate the innate immune responses of embryonic neurons. Sarm1 has been shown to attenuate the activity of TRIF in the TLR3 and TLR4 pathways in innate immune response. Expression of Sarm1 reduces TRIF-induced NF-κB activation and cytokine production in HEK cells. 5 As TLR3 and NF-κB are also expressed in neurons Sarm1 likely uses the same mechanism to down-regulate cytokine production in embryonic neurons, although direct evidence supporting the involvement of NF-κB downstream of Sarm1 in neurons is still lacking.
It is puzzling that the Sarm1-regulated cytokine profiles are different in adult and embryonic brains. Perhaps, expression of cytokines in neurons is also controlled by developmental stage or neuronal activity. For instance, IL-1β, IL-12b and CCL5 may be up-regulated by signal of neuronal activation. In mature neurons, Sarm1 may antagonize the signaling pathway from neuronal activation to cytokine production. Therefore, removal of negative signal derived from Sarm1 increases the expression of these three cytokines in adult brain. Another explanation is that the cytokine profile at E14.5 is mainly determined by neurons themselves. In the adult, a significant population of astrocytes and microglial cells in the brain and the peripheral immune responses may interact with Sarm1-expressing neurons and thus alter the cytokine expression profiles in brains. This possibility may be applied to both up-regulated cytokines (IL-1β, IL-12 and CCL5) and down-regulated cytokines (IFN-β and TNF-α) in Sarm1 knockdown brain. However, these two possibilities are not mutually exclusive of each other. More investigation needs to be conducted to address the detail regulation.
Interestingly, Sarm1 deficiency was previously reported to result in impairment in microglial activation. 6 However, because our current data indicate that microglial cells do not obviously express Sarm1, the impairment of microglial activation in Sarm1-deficient mice is unlikely to be a cell-autonomous effect. Rather, it is more likely that the neuronal innate immune response influences the activation of the microglia. Actually, a recent study and our data demonstrate the tight contact between microglial cells and neurons. 11 It would not be surprising to find that neurons can also influence microglial activation in mouse brains.
In conclusion, our study reveals the role of TIR-domain-containing adaptor Sarm1 in innate immunity in the brain. We demonstrated that Sarm1 is widely expressed in different types of neurons in mouse brains, but notably not in microglial cells; and also that knockdown of Sarm1 alters the expression levels of antiviral and inflammatory cytokines in brains. As Sarm1 is present in neurons, the regulation of cytokines is expected to occur in neurons, suggesting that Sarm1 regulates the innate immune responses of neurons. Further, as IL-6 is also known to negatively regulate dendrite growth, in addition to the JNK-microtubule pathway, as reported in our previous study, 8 it is likely that IL-6 may also act downstream of Sarm1 in embryonic brains to regulate dendrite growth, although further investigation is need to address this speculation. Because prenatal infection is frequently associated with schizophrenia and autism, and because Sarm1 protein levels are lower in the cortex of patients with autism,16,17 our data also suggest a possible role for Sarm1 in inflammation-related neuropsychiatric disorders.
Footnotes
Funding
This work was supported by the National Science Council (grant numbers NSC 98-2311-B-001-012-MY3, NSC-100-2321-B-001-022, NSC-101-2321-B-001-010).
Conflict of interest
The authors do not have any potential conflicts of interest to declare.
Acknowledgements
We thank Ms Miranda Loney for English language editing of the manuscript.