
Abstract
Hepcidin has been found to be the key regulator of iron metabolism that leads to
hypoferremia during inflammation. Recent work has shown that equine hepcidin is
predominantly expressed in the liver of horses. In this study, hepcidin gene expression
was determined in the liver and bone marrow of six healthy horses after
Introduction
Hepcidin is a 25-amino acid peptide synthesized mainly in mammalian, fish and bird liver in response to iron store and inflammation. 1 – 4 It is also expressed in other tissues, e.g. cerebral cortex, spleen, kidney, heart, bone marrow, muscle and intestinal tissues. 4 – 7 Recently, hepcidin real-time PCR relative-quantification in healthy horses showed that hepcidin transcripts is highly abundant in liver, although lower level expression is present in other tissues. 8
Hepcidin was originally identified as a disulfide-rich peptide with activity against some Gram-positive and Gram-negative bacteria, as well as yeasts.9,10 Further studies demonstrated the role of hepcidin in iron metabolism in mammalian species.1,2,3 Hepcidin binds to the iron exporter ferroportin (Fpn), which is the only known iron exporter in vertebrates. 11 This association induced Fpn internalization and degradation11,12 and inhibition of the iron influx into plasma from the ferroportin-rich tissues. 3 The resulting hypoferremia, considered part of the innate immune system, 9 is a common response to systemic infections or generalized inflammatory disorders, 13 primarily serving as a host defense mechanism limiting iron availability to invading microorganisms.1,13
Many studies have focused on the role of hepcidin in innate immunity and control of iron metabolism mainly during experimental and/or clinical models of acute inflammation. The expression of hepcidin mRNA increased during systemic inflammation induced by LPS in several species.1,2,4,5,7,14 As endotoxins (LPS) play a pivotal role in many pathophysiologic states and diseases in horses, a series of studies has been performed using an inflammation-model with LPS infusion in horses. 15 – 20 Therefore, in the current study we documented the expression of hepcidin mRNA in the equine liver and bone marrow during an experimental model of endotoxemia in horses and, to our knowledge, this is the first report to describe the expression of hepcidin in horses with inflammation experimentally induced by LPS infusion.
Materials and methods
Materials
Escherichia coli serotype O55:B5 LPS, RPMI-1640 tissue culture medium and Trypan blue dye were purchased from Sigma-Aldrich® (St Louis, MO, USA). Lidocaine cloridrate and xylazine hydrochloride were purchased from Cristalia (Sao Paulo, Brazil). RNeasy® Mini Kit and QIAamp® RNA Blood Mini Kit were purchased from Qiagen Inc. (Valencia, CA, USA). RQ1 RNase-Free DNase and ImProm-IITM Reverse Transcription System were purchased from Promega (Madison, WI, USA). Equine hepcidin primers 8 were designed using PrimerQuest® software from Integrated DNA Technologies Inc. (Coralville, IA, USA) and β-actin 8 primers were designed using Primer Express® 2.0 software from Applied Biosystems (Foster City, CA, USA), both were purchased from Integrated DNA Technologies Inc. Interleukin-6 primers 21 were purchased from Sigma® Life Science (St Louis, MO, USA). Power SYBR® Green PCR Master Mix was purchased from Applied Biosystems. Ferro Cromazurol reagent was purchased from Laborlab® (Guarulhos, Brazil). Ficoll-Paque Premium 1.077 was purchased from GE Healthcare (Piscataway, NJ, USA). 2-Mercaptoethanol was purchased from Merck© (Darmstadt, Germany).
Animals
All experiments were carried out according to the Unesp-Univ Estadual Paulista, Institutional Animal Care and Use Committee (108-A/2007). Six adult Quarter horses mares, not pregnant, 6–9 years old and mean body weight (BW) 425 (± 20) kg, were used in this study. Mares were housed in individual stalls and received the same food, water ad libitum and were dewormed with ivermectin. All animals were determined to be healthy on the basis of normal physical examination findings, complete blood count, plasma iron and fibrinogen concentrations, and Coggins test before the onset of this study. Only animals with values within normal limits and with a negative Coggins test were included in the present study.
Induction of endotoxemia
Six mares received an intravenous infusion of 30 ng/kg BW of LPS (E. coli O55:B5)19,22 in 300 ml of 0.9% sterile NaCl over 30 min using an automated infusion pump LF2001 (Lifemed Sao Jose dos Campos, Brazil). All infusions were administered through a 14 G teflon catheter aseptically inserted in the right jugular vein and were started at 08.00 h to avoid the effects of diurnal variation on the measured variables.
Physical examination
A clinician (J.P.O.F.) examined all animals for clinical signs of endotoxemia, such as fever, restlessness, muscle fasciculation, lethargy, yawning, hyperemic mucous membranes, respiratory and heart rates, intestinal motility and behavioral evidence of abdominal pain or discomfort (e.g. pawing, rolling, sweating, looking at flanks) during the study.17,18,20 The physical charts ofall studied horses classified the clinical signs according to a previously standardized clinical score (CS) that included 4 grades: 0 = normal, 1 = mild response, 2 = moderate response, and 3 = severe response.17,18,20 These assessments were performed as follows: at baseline (sampling time: 0 h immediately before LPS infusion), 2, 4, 6, 8, 10, 12, 16, 18, 20, 24, 30, 36, 42, 48, 60, 72, 96, 120, 144, 168, 192, 216 and 240 h PI.
Samples collection
Blood samples were collected after physical examination into vacuum tubes with sodium heparin (iron analysis) (BD Vacutainer®, Franklin Lakes, NJ, USA) and tubes with EDTA [BD Vacutainer®; white blood cell counts (WBC), PVC and plasma fibrinogen concentration]. The WBCs were performed at 0 h before and at 6, 24, 48, 72, 168, and 240 h after LPS infusion. Samples were kept on ice until processing.
Based on prior studies in humans 5 and rats 7 , liver and bone marrow biopsies were performed immediately prior to LPS infusion (0 h, baseline) and at 6 and 18 h after challenge with LPS. Liver biopsies were obtained from the right, 14th intercostal space in a line drawn from the point of the shoulder to the tuber coxae. Before taking the biopsies, a 25 cm 2 area was shaved and disinfected with povidone-iodine 10%. All animals were sedated with 1 mg/kg BW of xylazine hydrocloride and 2 ml local anaesthesia (2% lidocaine). Liver biopsies were taken using a 14 G Tru-cut biopsy needle (Biomedical®, Florence, Italy). Immediately after harvesting, all samples were frozen in liquid nitrogen and stored at −80°C until processing. Bone marrow biopsies were performed immediately after liver biopsies. The sternal region was shaved and disinfected with povidone-iodine 10%, and local anaesthesia was performed as previously described. Bone marrow biopsies were taken using an 11 G × 5 cm bone marrow needle (LangMed®, Rio de Janeiro, Brazil). Needle and stylet were inserted through the skin, periosteum, cortex and advanced into the marrow cavity. The stylet was removed and a syringe with heparin (5000 IU) was attached and bone marrow samples were obtained. Samples were kept on ice until processing.
Blood analyses
Heparinized blood samples were centrifuged and plasma was obtained and stored at −80°C until analysis. Plasma was thawed and iron determination was performed in duplicate using a semi-automated chemistry analyzer SB-190 (Celm®, Barueri, Brazil) with the Ferro Cromazurol reagent. Blood samples with EDTA were processed immediately after blood collection. The PCV was determined by centrifugation using the microhematocrit method and plasma fibrinogen concentration was determined by a heat-precipitation refractometry method. 23 An automated hematology analyzer Hemascreen® 18 (Ebran®, Sao Paulo Brazil) was used to perform WBC.
RNA purification, reverse transcription and q-RT-PCR
Total RNA was isolated from the liver and bone marrow samples using the RNeasy® Mini Kit and QIAamp® RNA Blood Mini Kit, respectively, following the manufacturer’s instructions. The relative purity and quality of the isolated RNA was determined by Nanodrop® 2000 Spectrophotometer (Thermo ScientificTM, Wilmington, DE, USA) and the ratio of A260–A280 nm exceeded 1.8 for all preparations. To ensure the complete removal of traces of genomic DNA, 1 µg of total RNA was incubated with RQ1 RNase-Free DNase. First-strand cDNA synthesis was performed with 500 ng of total RNA per 60 µl of reaction using random hexamers and ImProm-IITM Reverse Transcription System, following the manufacturer’s instructions.
Primer sets used in the qRT-PCR amplifying an 81 bp (base pair) fragment of the equine hepcidin mRNA (GQ_253624) were an 81 bp fragment of the equine IL-6 mRNA (ECU_64794) and an 86 bp fragment of the Equus caballus β-actin mRNA (AF_035774.1) as a reference gene. Relative quantification of hepcidin and of IL-6 mRNA was performed using the comparative Ct method with a 7300 Real-Time PCR Systems (Applied Biosystems) and Power SYBR® Green PCR Master Mix. Each quantitative RT-PCR (qRT-PCR) reaction was set in triplicate in a total of 20 µl each, which contained 0.3 mm of each forward and reverse primer, 2 µl of template cDNA, 10 µl q-PCR master mix and 6.8 µl nuclease-free water. In addition, a ‘no template’ control was included in duplicate on each plate to show that amplicon contamination was absent. The PCR conditions were set as follows: initial denaturation at 95°C for 10 min and 40 cycles at 95°C for 15 s and 60°C for 60 s, followed by a melting curve. Amplification of specific transcripts was confirmed by melting curve profiles generated at the end of each run. Expression of basal equine hepcidin and IL-6 gene was normalized with E. caballus β-actin mRNA. In each plate, a standard curve was made using serial 10-fold dilution of both cDNAs used as template in the q-PCR reactions. The quantities of the target gene in liver and bone marrow samples were calculated relative to the calibrator sample (time: 0 h).
Isolation of PBMCs
Peripheral blood from four Quarter horse mares determined to be healthy by the methods described previously, was used in the in vitro study. Peripheral blood samples (100 ml) were collected from each mare via jugular venipuncture using heparinized vacutainer tubes (BD Vacutainer). The PBMCs were isolated from whole blood using Ficoll-Paque 1.077 density centrifugation and the technique modified as previously described. 24 Cell viability, as determined by 0.2% Trypan blue exclusion, was >98% in all experiments. Mononuclear cells were suspended in RPMI-1640 medium at a final concentration of 4 × 10⁶ cells/ml.
Challenge of monocyte cultures with LPS
The mononuclear cell suspension (4 × 10⁶ cells/ml) was added to each 40 mm well of a sterile, 24-well polystyrene plate and incubated for 2 h at 37°C in a 5% CO2 atmosphere. After incubation, non-adherent cells were gently removed by washing the plates three times with 37°C RPMI-1640 medium. After adherence, monocyte cultures were supplemented with 1 ml of the complete tissue culture medium (CTCM; RPMI-1640 medium containing 2 mM L-glutamine, 10% heat-inactivated bovine serum, 20 mM HEPES and 40 µg/ml gentamicin) and incubated for up to 18 h at 37°C, in a 5% CO2 atmosphere with 1 µg/ml of the same LPS used in the in vivo study. All those reagents were certified for the presence of LPS. Cells incubated in CTCM without LPS were also evaluated at the same sampling times and were used as controls. Then, supernatants from the monocyte cultures were removed and cells were harvested at 0 h (no LPS stimuli, baseline control) and at 2, 4, 6 and 18 h after LPS challenge, with 300 µl of lyses buffer (Qiagen RLT buffer + 3 µl of the 2-Mercaptoethanol) for direct lysis of cells and posterior RNA extraction.
RNA purification, reverse transcription and q-RT-PCR were performed as described above in order to measure the relative quantification of hepcidin and IL-6 mRNA in LPS-stimulated equine monocytes.
Statistical analysis
Statistical analysis was performed using repeated measures of ANOVA and the Tukey post-test for all parameters. The statistical analysis was performed with SAS software 9.2 (SAS Institute, Cary, NC) to determine the statistical significance between the means of multiple time-points measured and the mean of baseline values. Baseline values refer to the values before endotoxin infusion, with each animal serving as its own control in this respect. A P-value of <0.05 was considered to be statistically significant. Results are presented as the geometric mean ± S.E.M. (standard error of the mean), unless otherwise specified. Changes in gene expression <two-fold when compared to time-matched controls were regarded as being biologically insignificant.
Results
Clinical data
In response to the endotoxin infusion, all horses were depressed, showed muscle
fasciculations, intestinal hypomotility and had evidence of mild-to-moderate abdominal
pain, such as pawing, sweating and looking at flanks. Except for one horse, all the other
horses became anorectic within 1 h after endotoxin infusion had been stopped. Horses had a
significant increase in clinical score from 1 to 6 h (P < 0.01; Figure 1A). Normal feces were observed
in all horses during this study. Mean clinical score (A), rectal temperature (B),
heart rate (C) and respiratory rate (D) of the horses given intravenous infusion of
30 ng/kg LPS (n = 6; mean ± S.E.M.). The LPS was administered after
baseline sampling. *P < 0.05, **P < 0.01),
***P < 0.001. When not visible, S.E.M. bars are smaller than
the symbol.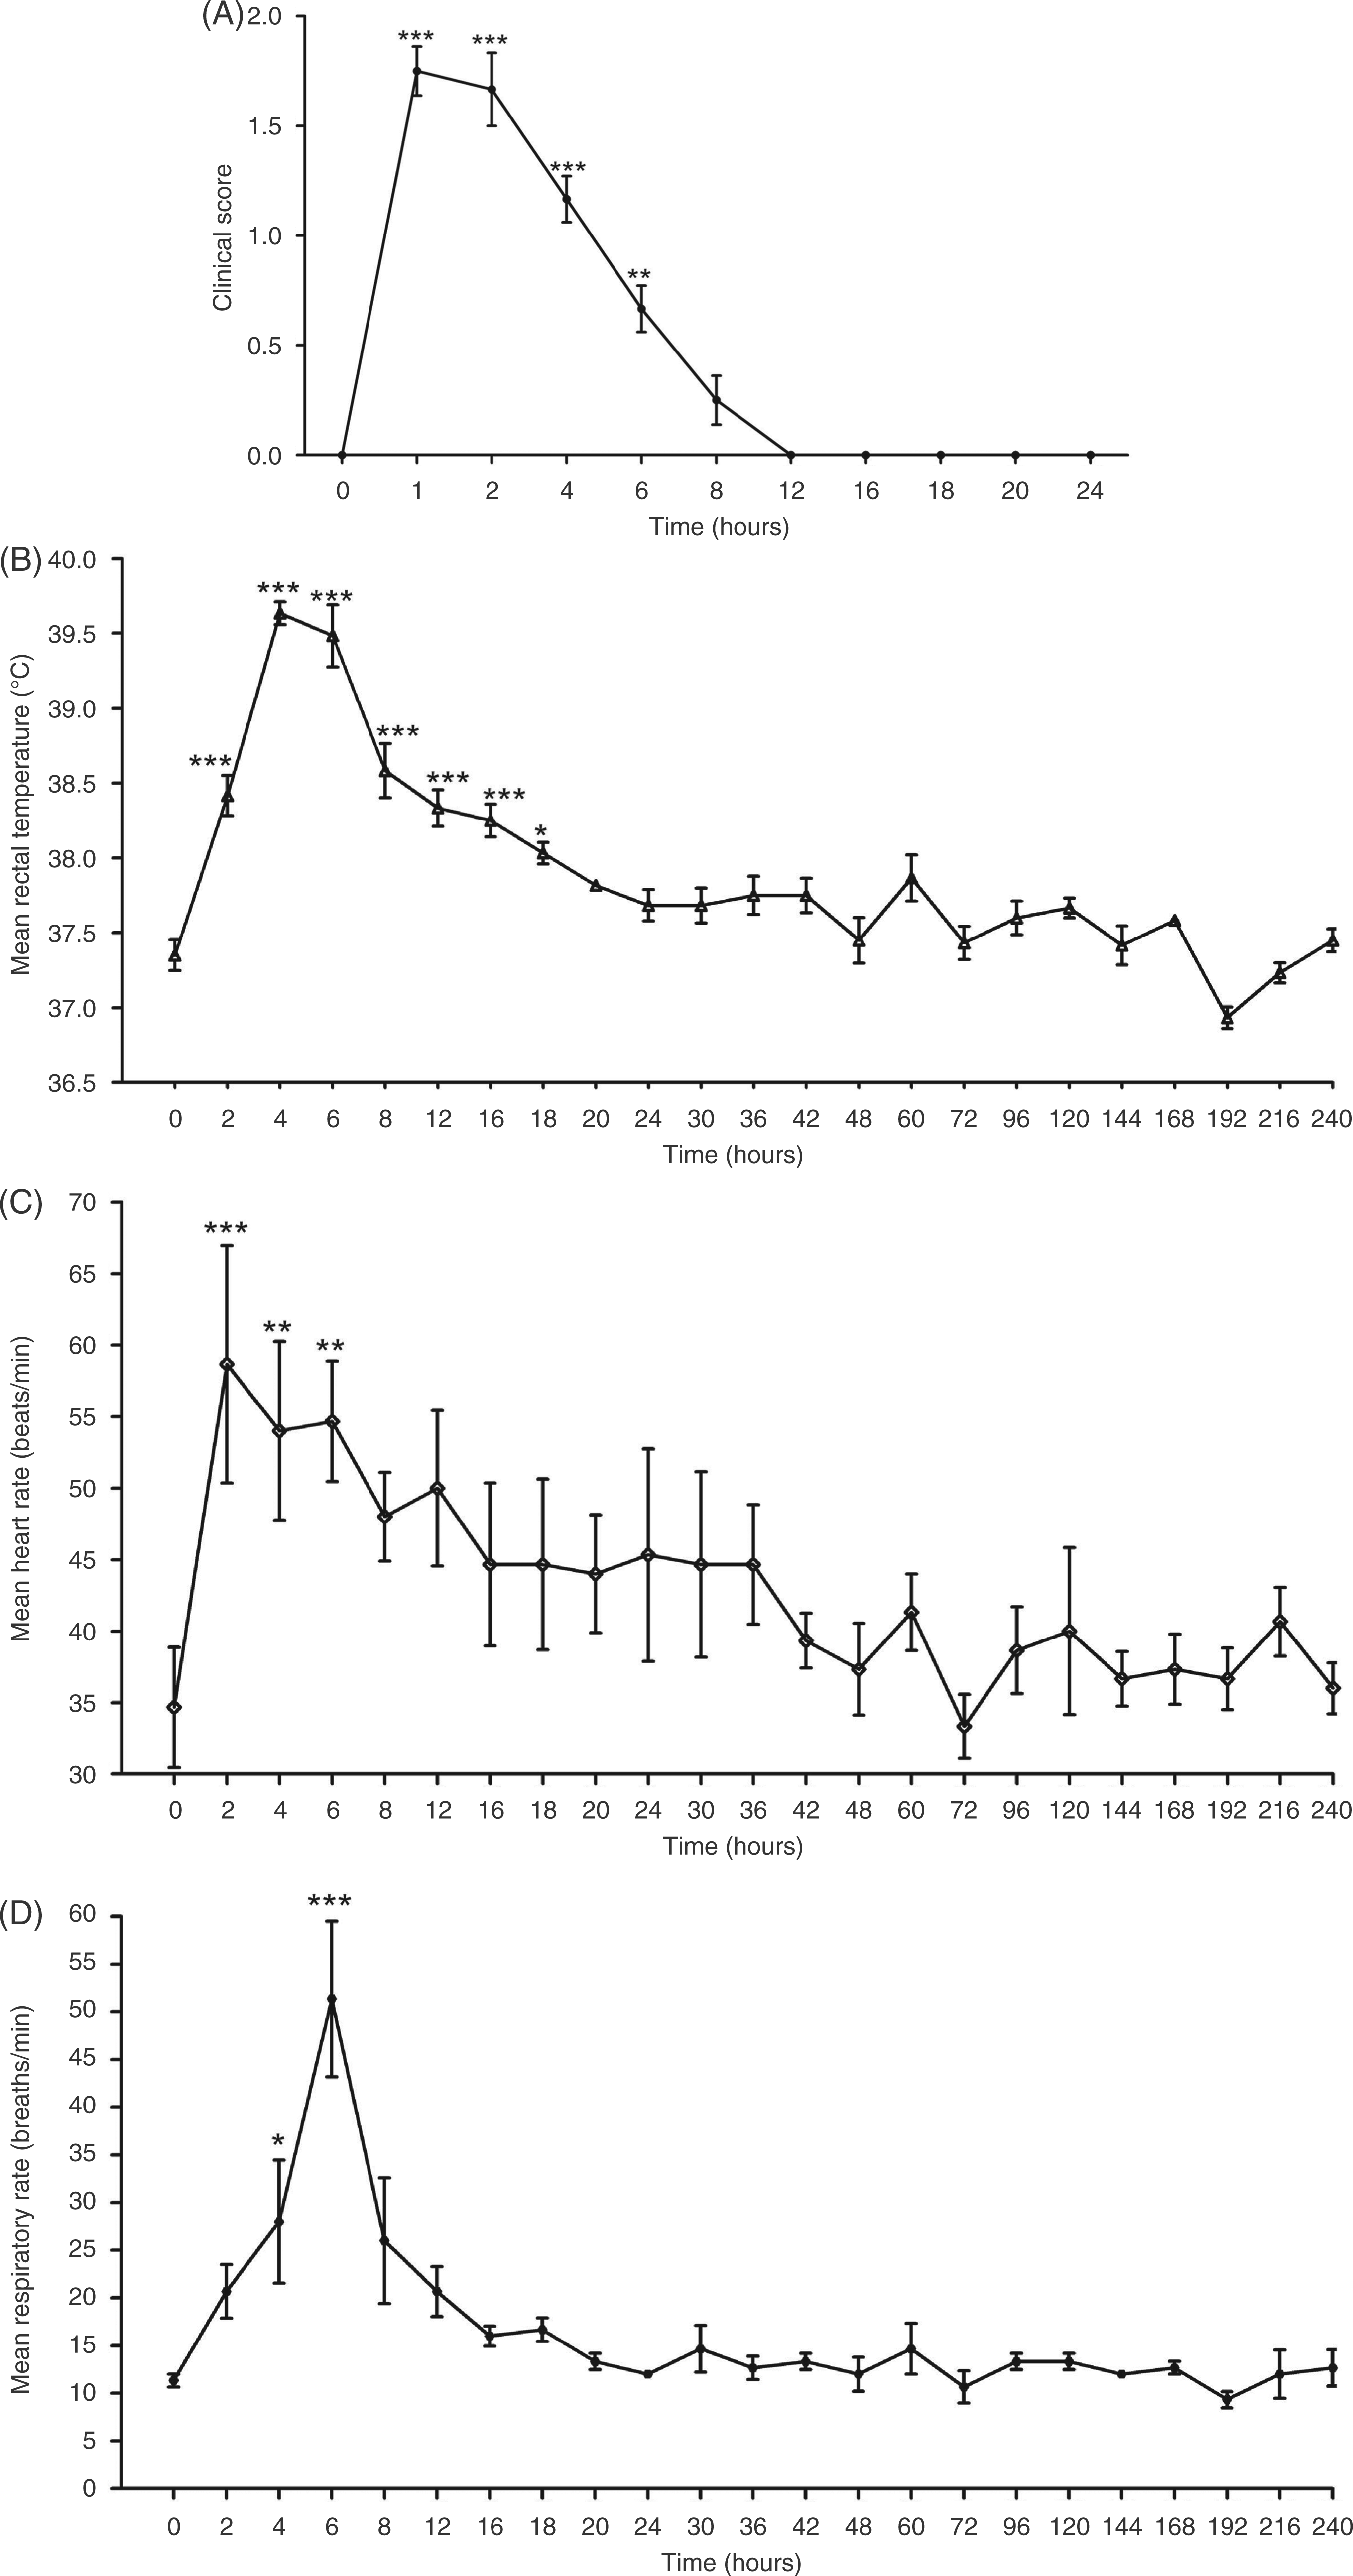
Compared with baseline values, rectal temperature was statistically higher from 2 to 18 h PI (P < 0.05) and febrile peak was observed from 4 to 6 h after the end of LPS infusion (P < 0.001) (Figure 1B). Heart and respiratory rates (Figure 1C, D) increased significantly from 2 (P < 0.001) to 6 h AI (P < 0.01) and from 4 (P < 0.05) to 6 h PI (P < 0.001), respectively. At 12 h PI all horses recovered completely from the protocol and did not require further supportive care.
Time-course analysis of hematological variables in horses injected with LPS
Mean WBC was significantly higher than control time at 24 (P < 0.001)
and at 48 (P < 0.05) h after the end of LPS infusion (13.3 and 11.9 x
103 cells/µl, respectively), although these mean values were within the
normal range for this species (Figure
2A).
25
Neutrophil count increased at 6 h (P < 0.05); however, neutrophilia
was only observed at 24 h (9.1 × 10³ cells/µl, p < 0.001) (Figure 2A); lymphocyte count was
significantly lower than baseline at 6 h PI (1.7 × 10³ cells/µl p < 0.05)
(Figure 2A), near the lower
limit of the normal range.
25
At all time points measured, monocyte, eosinophil and basophil values
were not significantly different than control values. At all time points measured, mean
PCV was not significantly different from control values and was within the normal range in
horses.
25
Fibrinogen concentration did not change significantly during this experiment. Mean
white blood cells counts (WBC), neutrophil and lymphocyte counts (A) and plasma iron
concentration (B) of the horses given of 30 ng/kg LPS IV (n = 6;
mean ± S.E.M.). The LPS was administered after baseline sampling.
*P < 0.05, **P < 0.01,
***P < 0.001. When not visible, S.E.M. bars are smaller than
the symbol.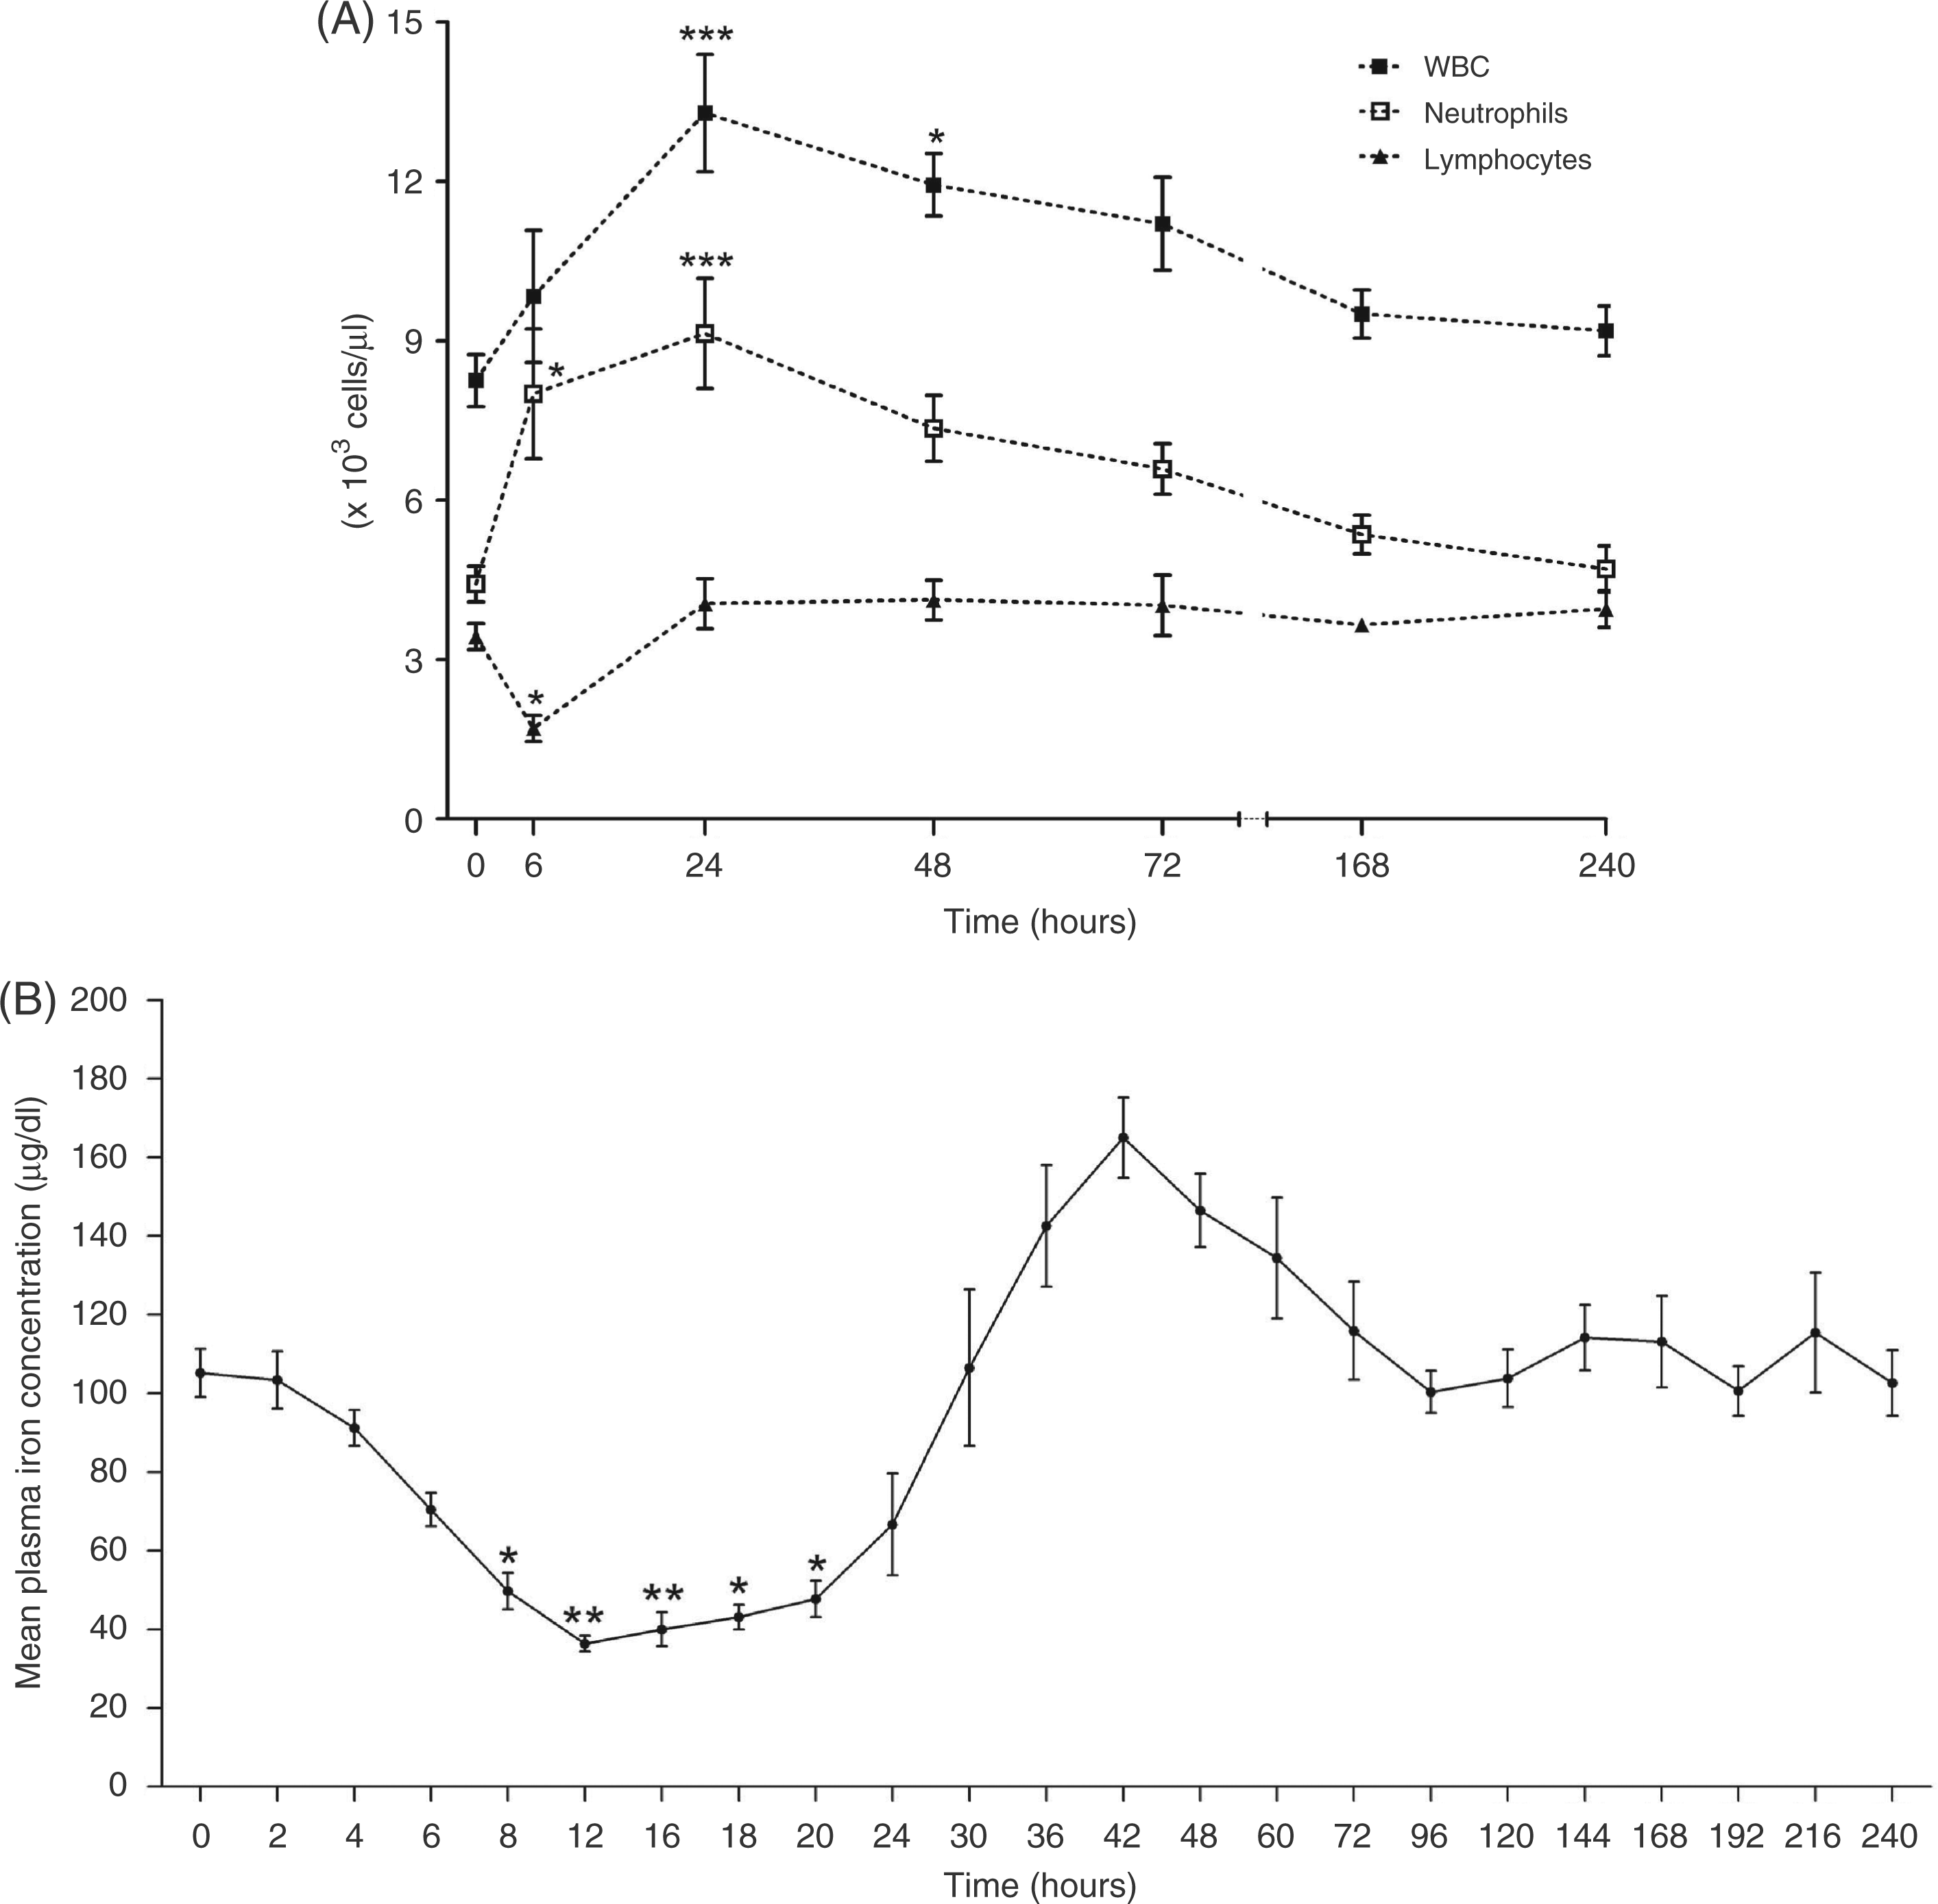
Plasma iron concentration was significantly decreased from the pre-infusion LPS level from 8 to 20 h PI (P < 0.05) (Figure 2B). The lowest plasma iron concentration was observed at 12 h AI (34.6% initial value; P < 0.01).
Hepcidin mRNA expression induced by LPS
The main goal of this study was to investigate the effects of LPS on the expression of
hepatic hepcidin mRNA expression. Six h after the end of LPS infusion, hepcidin mRNA
expression increased 7.8 times (P < 0.001) (Figure 3A). At 18 h after LPS infusion, the hepcidin
mRNA expression decreased to a level lower than the baseline, although this difference was
not statistically significant (P > 0.05). As well as hepcidin, the
expression of IL-6 had a similar kinetic effect in equine liver (Figure 3B). However real-time RT-PCR analysis showed
no significant differences (P > 0.05) in the expression of hepcidin
(Figure 3A) and IL-6 (Figure 3B) mRNA in the bone marrow
between the control values and measurements at 6 and 18 h PI. Relative
hepcidin (A) and Il-6 (B) gene expression over time following intravenous infusion
of 30 ng/kg LPS (n = 6; mean ± S.E.M.). LPS was administered after
baseline sampling. Data were calculated relative to the housekeeping gene
Equus caballus β-actin mRNA and normalized to baseline and to a
calibrator, which was arbitrarily assigned a value of 1.
***P < 0.001. When not visible, S.E.M. bars are smaller than the
symbol.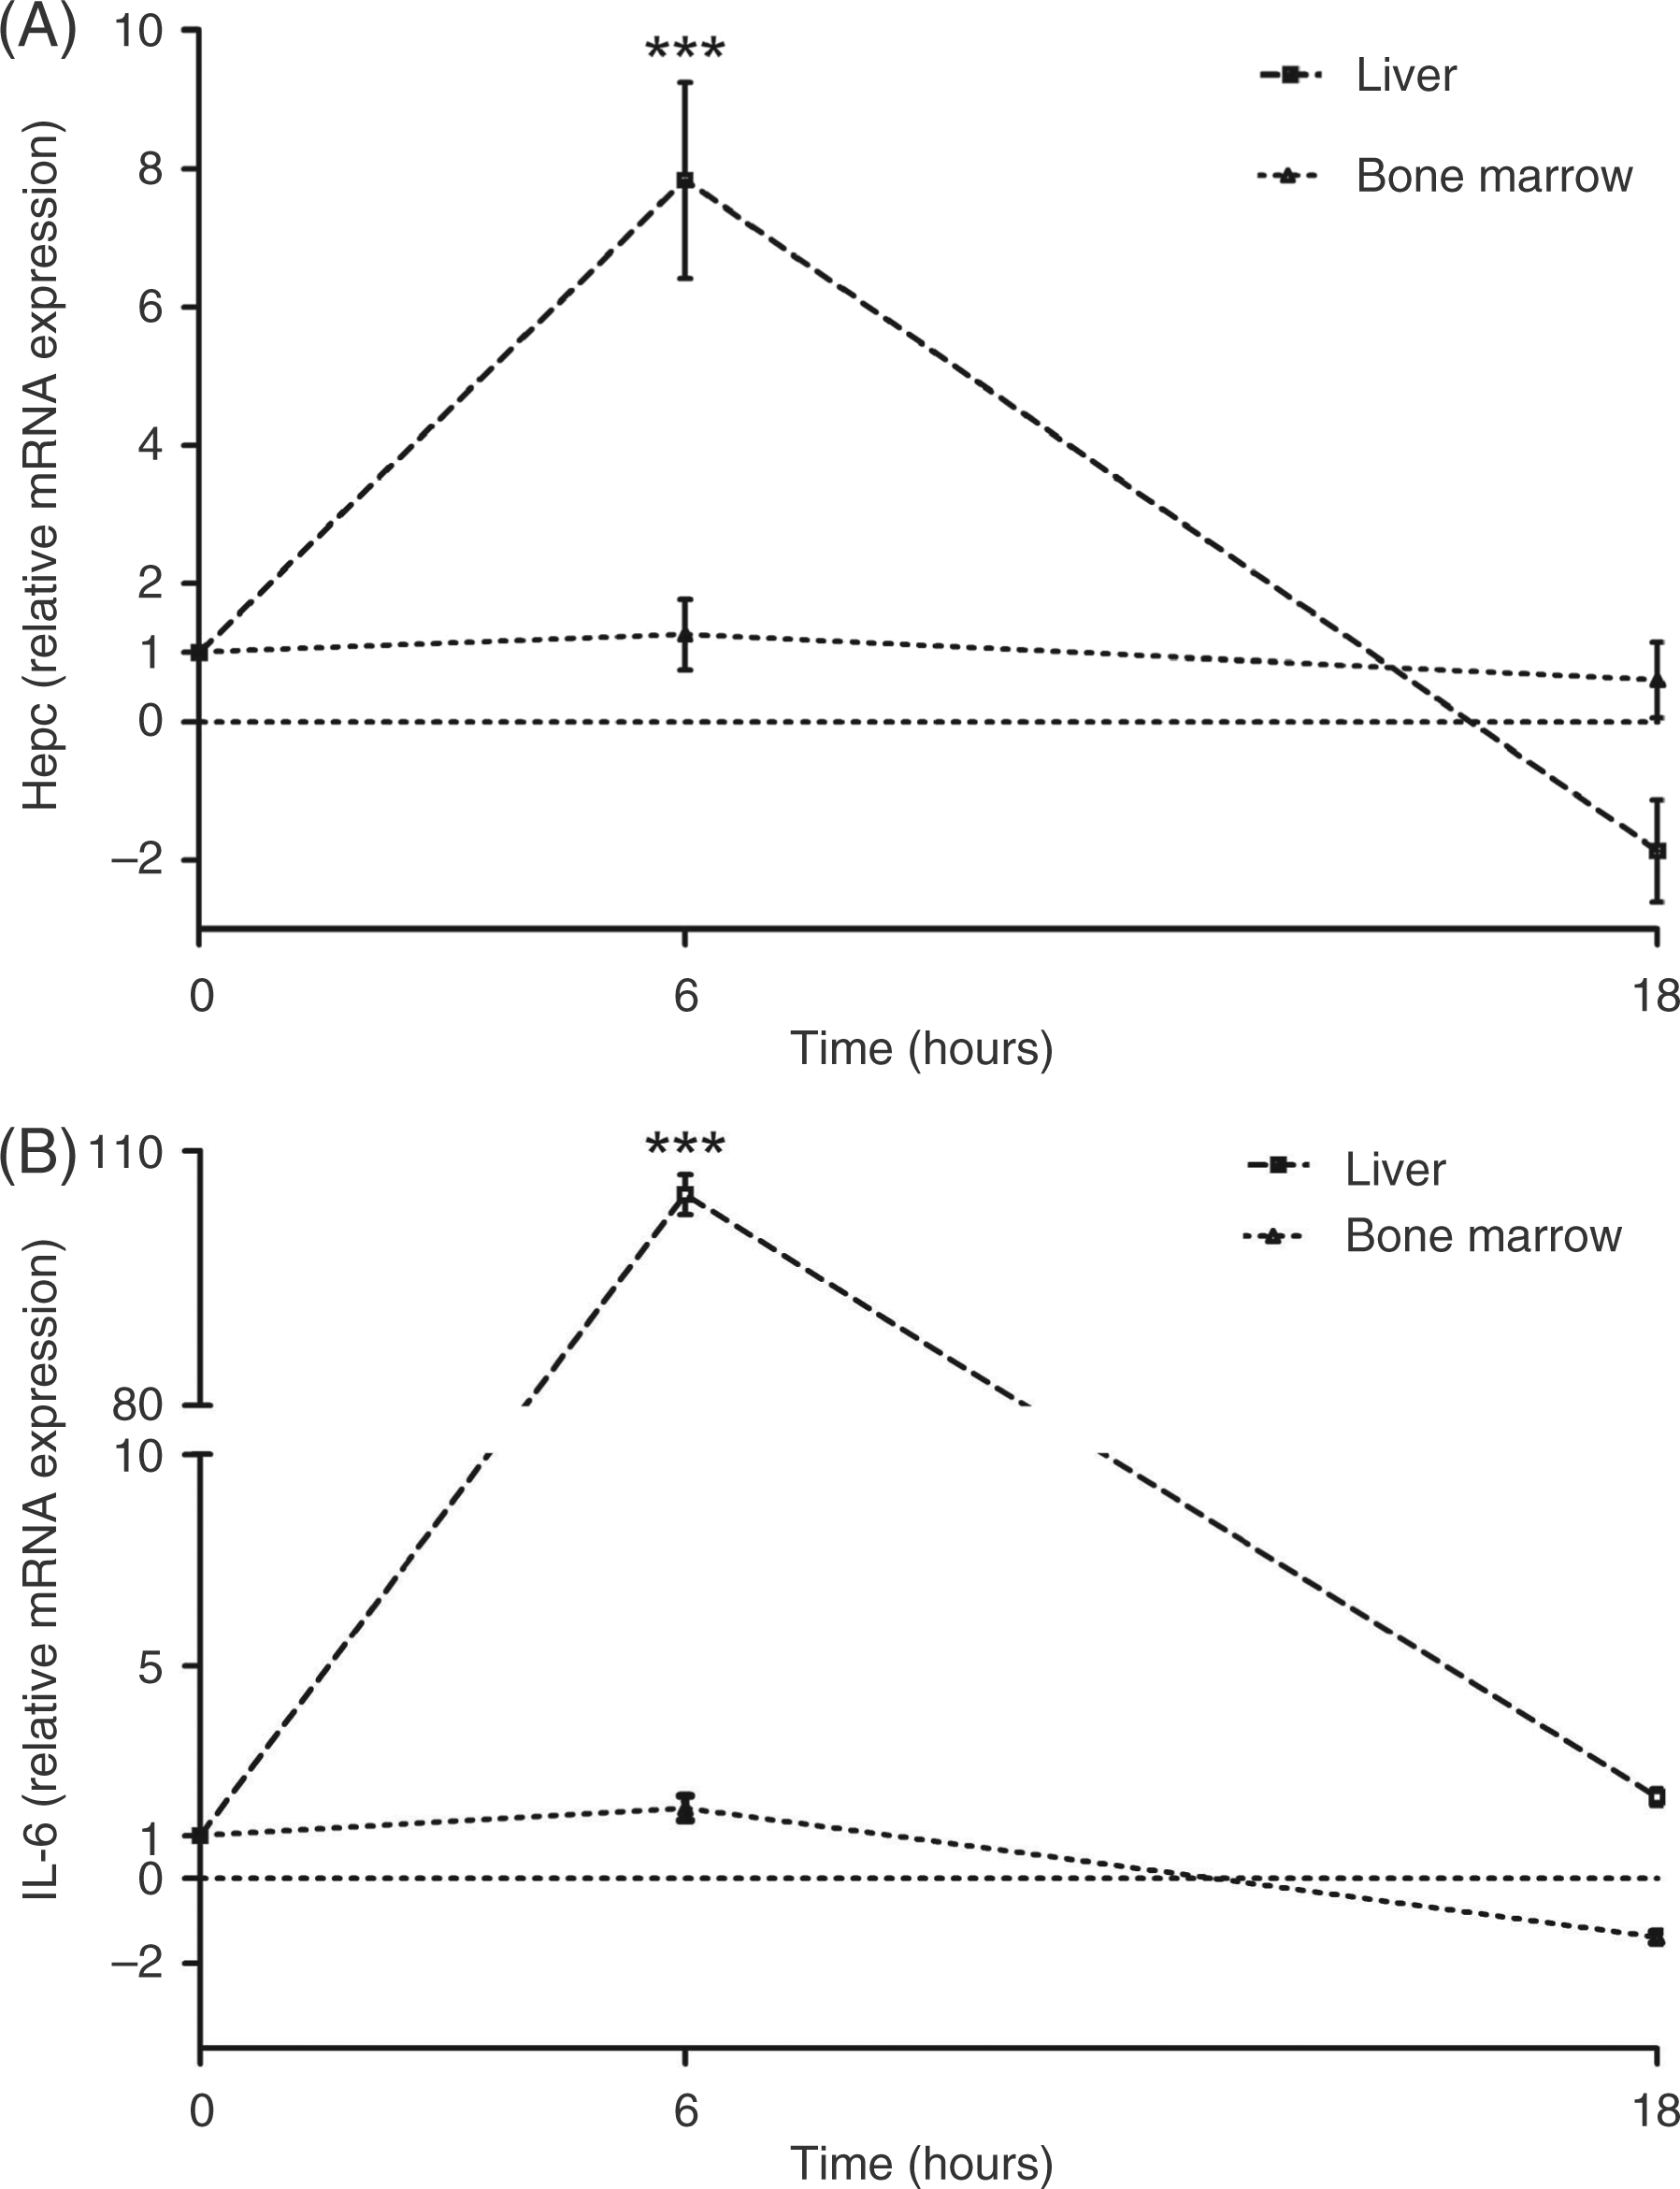
We also evaluated hepcidin and IL-6 mRNA expression in LPS-stimulated equine monocytes.
We observed that hepcidin (P < 0.001) (Figure 4A) and IL-6 (P < 0.001)
(Figure 4B) gene expression was
significantly induced after 2 h of LPS stimulus, and thereafter declined and returned to
baseline levels. Relative hepcidin (A) and Il-6 (B) gene expression
LPS-stimulated equine monocytes (n = 4) incubated with LPS
(1 µg/ml) and without LPS for 2–18 h. Values (mean ± S.E.M) are expressed as fold
increase over non-stimulated control (0 h, baseline). Data were calculated relative
to the housekeeping gene Equus caballus β-actin mRNA and normalized
to baseline and to a calibrator, which was arbitrarily assigned a value of 1.
***P < 0.001. When not visible, S.E.M. bars are smaller than
the symbol.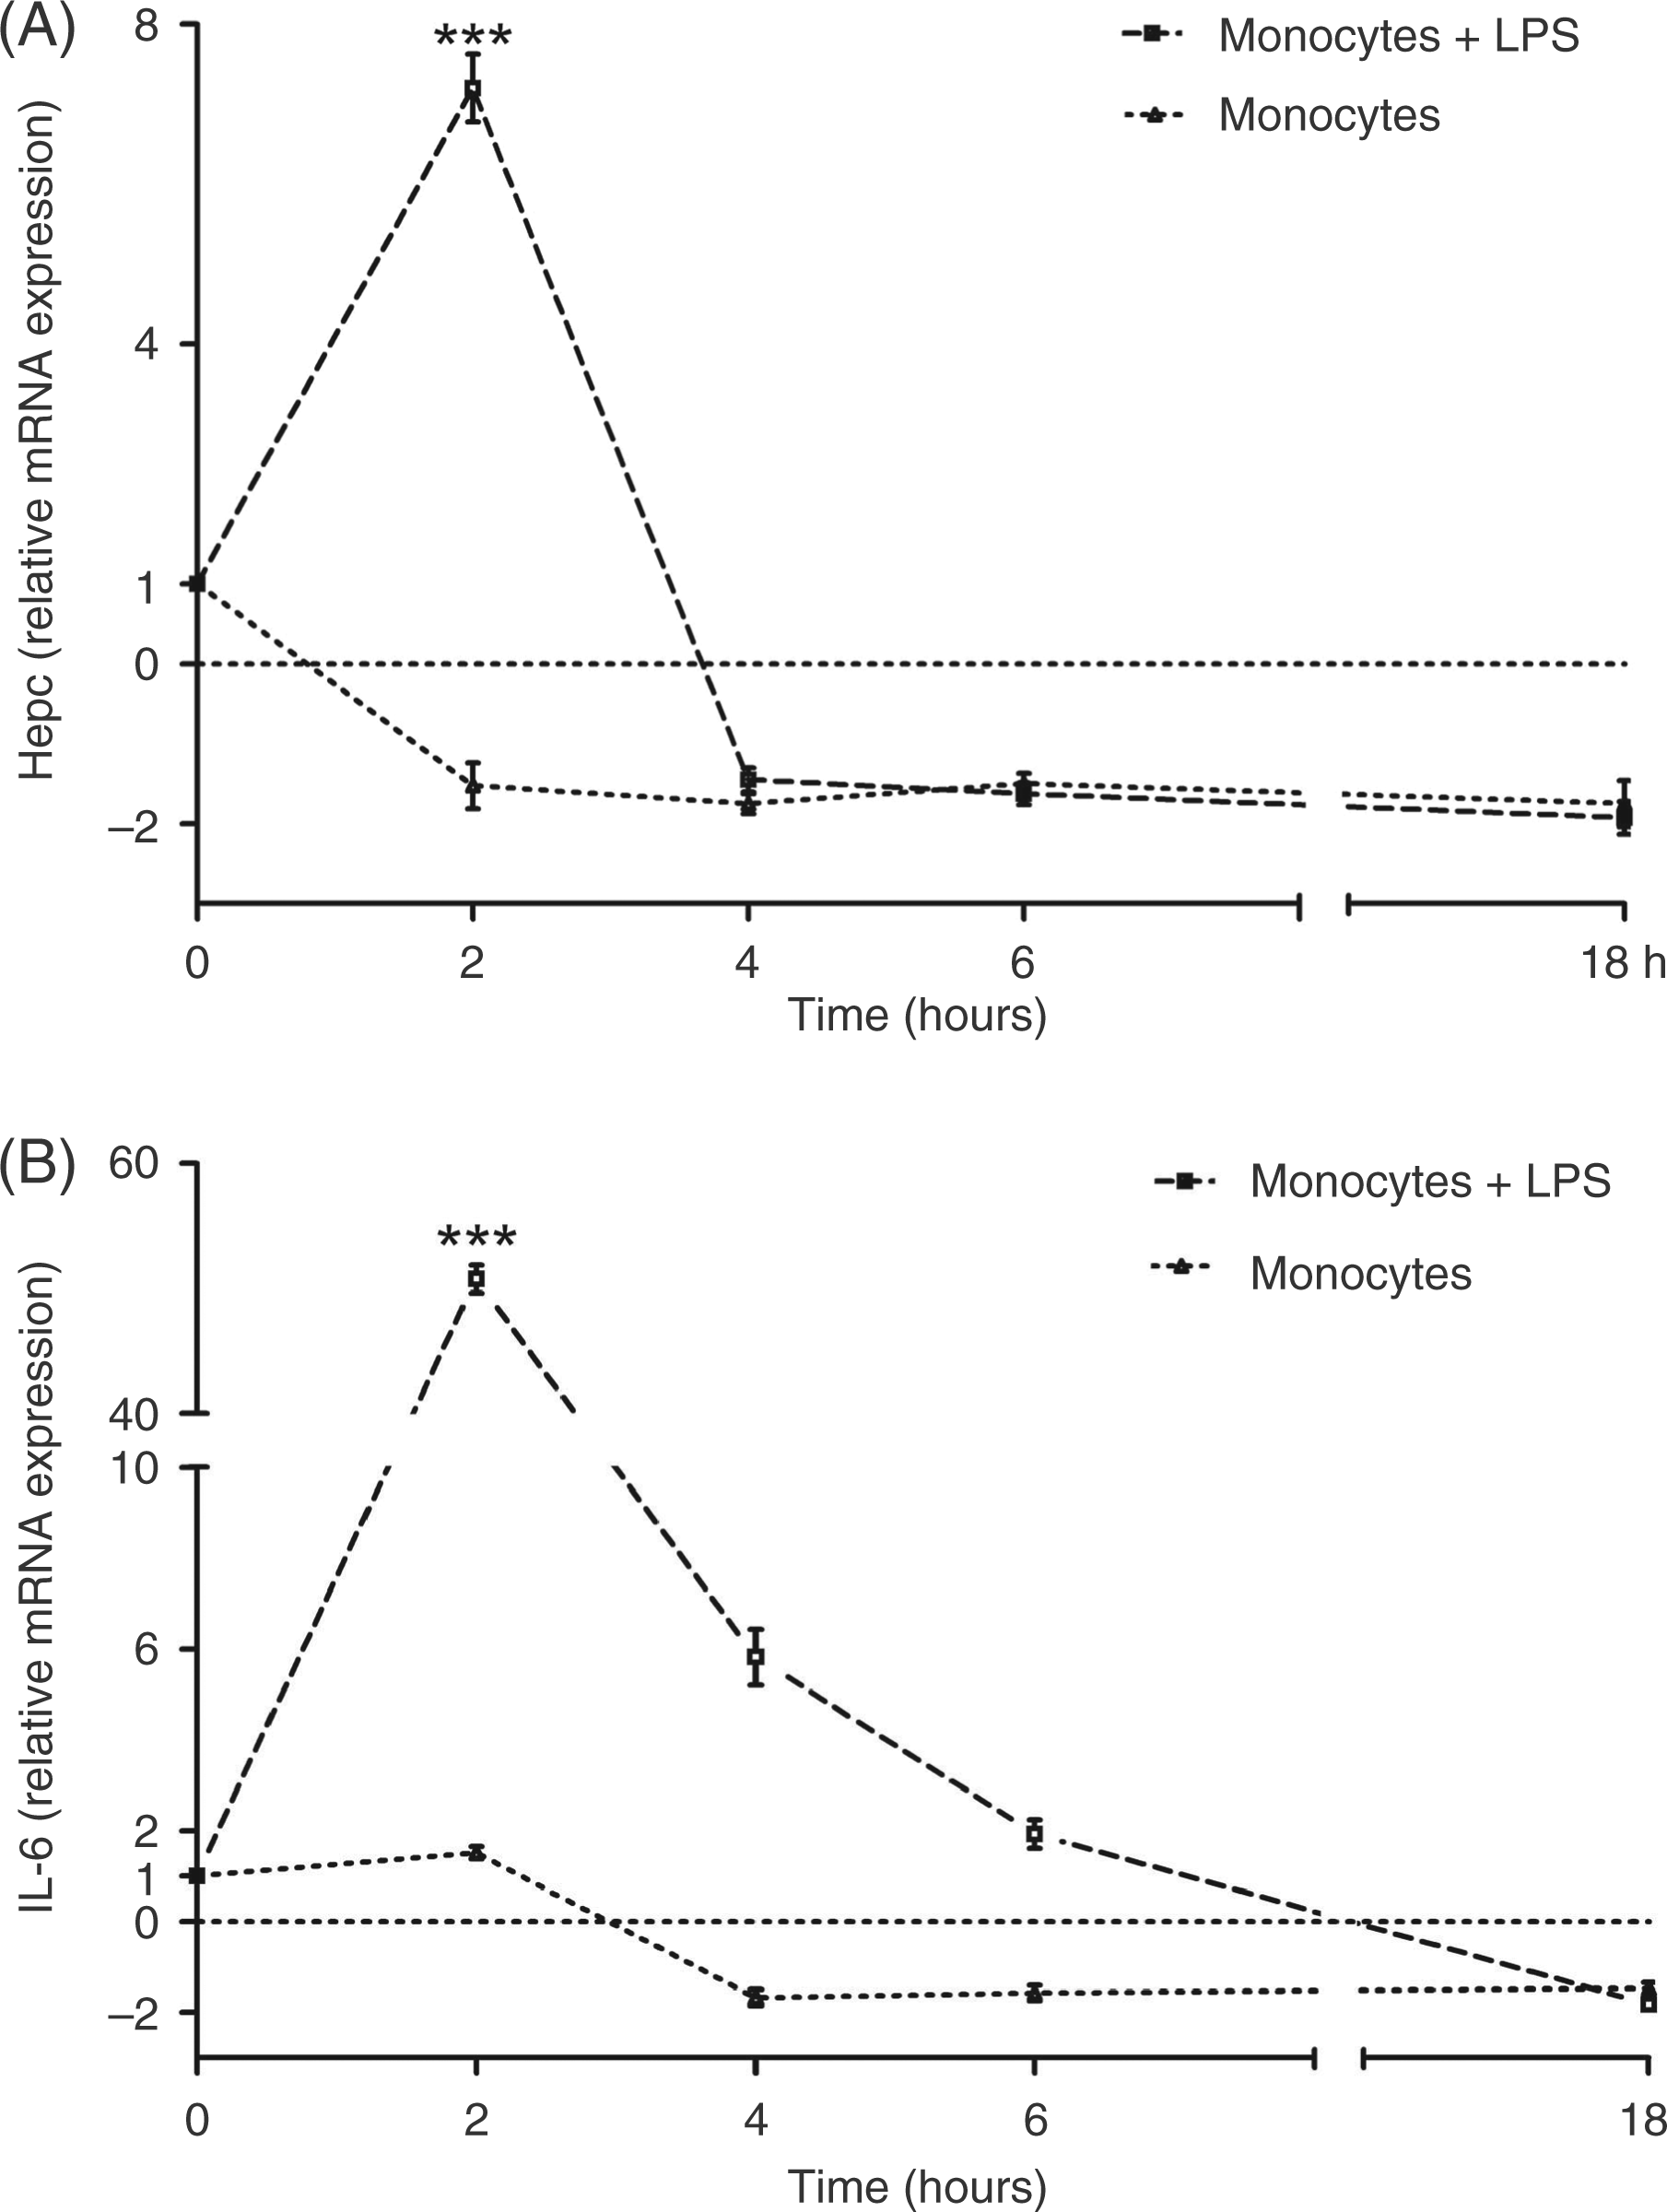
Hepcidin and IL-6 expression in monocyte cultures incubated for 2, 4, 6 and 18 h in CTCM without LPS was biologically insignificant (<two-fold).
Discussion
We previously showed that hepcidin mRNA is highly expressed in liver of the healthy horses. 8 To verify the role of hepcidin in equine iron metabolism, we investigated hepcidin mRNA expression in horses with experimental systemic inflammation induced by LPS infusion. Endotoxin concentrations were not measured in this study; however, it has been previously shown that endotoxemia develops in horses injected with a similar dose of LPS.16,17 The LPS-model of inflammation used here promoted a reliable and consistent inflammatory response, as all horses developed signs of endotoxemia, as indicated by tachycardia, tachypnea, muscle fasciculation, abdominal pain, depression and the cessation of intestinal sounds. These results were similar to previous reports that described clinical findings in horses receiving different concentrations of LPS infusion.17,18,20,22,26 Fever of up to 39.5°C observed in all horses at 4 h after LPS induction has been considered as a characteristic response of horses to LPS challenge16,18,20,27 and provides evidence of systemic inflammation. 28 This increase in body temperature was previously described in response to LPS and is induced by cytokines, mainly TNF-α, IL-1 and IL-6.16,17,29
Herein, WBC counts were evaluated 6 h after LPS infusion, and a significant increase of neutrophils, significant decrease of lymphocytes and a significant increase of WBC relative to baseline values were observed. At 24 h after LPS infusion, marked leukocytosis and neutrophilia were observed. After 48 h, WBC count, neutrophil and lymphocyte count were within the normal range in all horses. 25 These findings are consistent with those of previous studies,17,18,22 which observed leukocytosis and neutrophilia at 6 h after LPS infusion. Neutropenia has been described prior to 6 h in other studies, but WBC counts were not performed prior to 6 h PI in our study. The lymphopenia observed in this study was also observed in horses and in other species during endotoxemia 29 – 31 and is probably caused by a decrease in lymphoid cell production by bone marrow or as a result of migration of activated lymphocytes to the lymphatic tissue. 20
The concentrations of fibrinogen and iron have been used to diagnose and monitor inflammatory disease in horses; 28 both were considered acute-phase reactants. 30 , The concentration of plasma fibrinogen increased significantly 12 h after intravenous, 27 and 24 h after intra-peritoneal, infusion of LPS in horses. 30 Peritoneal fibrinogen also increased significantly after intra-peritoneal infusion of LPS in horses, 20 indicating an increased inflammatory response to LPS; however, in the current study, no significant increase in plasma fibrinogen concentration was seen at any of the time- points measured. On the other hand, the hypoferremia peak (12 h PI) was a sensitive indicator of acute inflammation compared with the fibrinogen concentration in horses with endotoxemia induced by LPS. A previous, retrospective study comparing serum iron and plasma fibrinogen in horses with naturally acquired inflammation demonstrated that hypoferremia was a better indicator of acute, sub-acute and chronic systemic inflammation than fibrinogen concentration and that iron concentration may be preferable for detecting natural acute inflammation in horses. 28 Hypoferremia has also been observed in other inflammation models using an injection of Freund’s complete adjuvant or turpentine oil in horses. 32 – 34 Horses submitted to experimental inflammation in a model using Streptococcus zooepidemicus showed a marked drop in iron concentration that remained low until the day 13 post-infection. 35 In the present study, iron levels returned to similar baseline values at 30 h after the end of LPS infusion; at this time all clinical and laboratory findings were already within the normal range. These findings agree with those previously described suggesting that iron would not return to normal levels until the inflammatory process was resolved. 28 The rapid return of serum iron to pre-infusion concentrations in our study demonstrates the efficiency and safety of the inflammation model adopted here which caused an acute systemic inflammation without prolonged inflammatory effects.
Persistent hypoferremia has been observed during inflammatory processes and is a cause of anemia of chronic disease in mammalian species.1,14 In the present study, hypoferremia was rapid and transitory and did not cause anemia of inflammation in horses. In one previous report, no changes were observed in the PCV values of horses given LPS (30 ng/kg BW of LPS, IV) when compared with controls during the 8 h measured after LPS infusion. 16 These findings were similar to those reported herein, but are not in agreement with a study in horses where the mean PCV value increased significantly 1 h after LPS infusion (200 ng/kg BW diluted in 1 l of 0.9% NaCl administered over 30 min) and remained elevated throughout the experiment period (6 h), 18 or other studies of equine endotoxemia that verified that PCV increased above baseline values during endotoxemia in horses.15,36
Cytokines are an integral component of the adaptive and innate immune responses. Three of the most intensively studied cytokines, IL-1, IL-6 and TNF-α share common actions in the host defense against invading pathogens. An in vitro study has shown that TNF-α plays a significant role in determining lymphocyte hepcidin expression. 12 However, in vivo studies in mice and human volunteers indicate that IL-6 itself is necessary for the induction of hepcidin during inflammation 13 and that IL-6-hepcidin axis is responsible for hypoferremia during human endotoxemia 6 and during repeated psychologic stress exposures in rats. 37 Although plasmatic cytokine concentrations were not measured in this study, it is known that TNF-α induces IL-6 release in horses given LPS 38 and that the peak in serum TNF-α activity has been observed about 1–1.5 h after IV LPS infusion, 16 – 18 while the peak in serum IL-6 activity was observed 3–4 h after endotoxin was administered.16,26,38 Considering that gene expression of TNF-α and IL-6 was also up-regulated in blood cells following administration of LPS in horses, 19 and considering the increased IL-6 liver expression in the horses used in our experiment, thereby confirming that LPS infusion stimulated cells to produce IL-6, it is possible that both cytokines may be involved in the increase in equine hepcidin expression in this study.
In addition, IL-6 release was dramatically induced within 3 h after LPS injection and urinary hepcidin peaked within 6 h, followed by a significant decrease in serum iron in humans. 5 Therefore, the increase of the hepatic hepcidin mRNA expression observed in horses 6 h after LPS infusion may have been stimulated by IL-6, as describe in other species.5,7,13,37 In rats, the marked increase (9.5-fold) in the expression of liver hepcidin mRNA occurred 4 h after LPS injection, while the hypoferremia peak was observed 2 h later. 7 The decrease in hepcidin mRNA to levels lower than in controls at 24 h after LPS administration in the horses is similar to what has previously been reported in rats. 7 The expression of hepcidin mRNA increased significantly in the bone marrow of swine challenged with Salmonella enterica from 8 to 24 h after challenge. 6 However, bone marrow hepcidin relative expression performed at 6 and 18 h PI was not influenced by LPS infusion in horses. The in vitro study confirmed that LPS-stimulated monocytes had a rapid and significant increase in hepcidin expression at 2 h LPS incubation and thereafter these values returned to basal levels. These results are similar to those previously obtained with human LPS-stimulated monocytes. 39 These data indicate that although monocytes produce IL-6 and hepcidin after LPS exposure, the bone marrow examination was performed too late to evaluate hepcidin expression in this experimental protocol.
In summary, to our knowledge, this report is the first to describe the effects of LPS infusion on the expression of hepcidin mRNA in horses. We conclude that LPS infusion up-regulated hepatic hepcidin mRNA expression causing rapid hypoferremia. This suggests that hepcidin plays a key role in iron metabolism and the innate immune system of horses. In addition, plasma iron concentration was a sensitive indicator of clinically apparent endotoxemia in the horses. Studies have shown that LPS infusion up-regulates gene expression of IL-6 in horses 19 and that hepcidin mRNA is induced by IL-6 in humans and rats.5,7,14 Therefore, we speculate that similar to those species, hepcidin could act as a type II acute-phase protein in horses. Further studies are required to fully understand the effects of endotoxins on the expression of hepcidin and to confirm the role of cytokines in the up-regulation of hepcidin expression in horses.
Footnotes
Acknowledgements
This study was supported by grants from Fundação de Amparo à Pesquisa do Estado de São Paulo - FAPESP (07/07344-6, 07/05008-9). The last author has a research grant from Conselho Nacional de Desenvolvimento Científico e Tecnológico CNPq. The authors acknowledges Dr. Ana Paula Bordon Graciani for helping with monocyte culture procedure.
Conflict of interest
The authors have no financial conflict of interest.