
Abstract
The Trapeziometacarpal Arthrosis Symptoms and Disability questionnaire is a recently developed disease-specific instrument designed to measure patient-reported symptoms. Our aim was to establish a minimal clinically important difference for this questionnaire. This prospective study included 95 patients undergoing operative (n = 39) or non-operative (n = 56) treatments for primary trapeziometacarpal osteoarthritis. Patients completed a battery of tests including the Trapeziometacarpal Arthrosis Symptoms and Disability questionnaire at the initial clinic visit and follow-up visits. Two anchor-based methods were used to arrive at the minimal clinically important difference. Twenty-four scores met criteria for minimal clinically important change, with a median overall score rounding to 15 points. This finding is an important step in facilitating the application of this disease-specific instrument in practice.
Level of evidence
III
Keywords
Introduction
Although the diagnosis of trapeziometacarpal osteoarthritis (TM OA) is often confirmed radiographically, it is recognized that the severity of TM OA on imaging does not correlate well with the severity of symptoms reported by patients (Armstrong et al., 1994; Haara et al., 2004; Hwang and Ring, 2011; Wilkens et al., 2019). The subjectivity of symptoms caused by TM OA warrants the use of patient-reported and disease-specific tools to measure outcomes. Although patient-reported outcome tools such as the Trapeziometacarpal Arthrosis Symptoms and Disability questionnaire (TASD), Nelson Score and Thumb Disability Examination have been developed and validated to specifically address symptoms caused by TM OA (Becker et al., 2016; Citron et al., 2007; Noback et al., 2017), they have yet to be widely applied.
The goal of our study was to determine the minimal clinically important difference (MCID) for the recently developed TASD. A clinically important difference is defined as a change that represents a meaningful and worthwhile outcome of a particular intervention, with the MCID representing the minimum threshold value of this change (Copay et al., 2007). A variety of methods for establishing the MCID have been described and can broadly be divided into anchor- and distribution-based methods (Copay et al., 2007; de Vet et al., 2006; Wells et al., 2001). Anchor-based methods use patient rating scales (i.e. ‘anchor questions’) and are thought to establish more clinically meaningful measurements than distribution-based methods, which rely on statistical variability in patient responses to outcome measures (Hays et al., 2005; Revicki et al., 2008). Establishing the MCID is crucial for research and practical purposes, as statistically significant outcomes may not in themselves be clinically important. We used an anchor-based approach to define the MCID of the TASD in a prospective cohort of patients diagnosed with primary TM OA, who underwent a variety of operative or non-operative treatments.
Methods
Patients
Prospective data were collected from patients with TM OA between 2016 and 2019 at a single tertiary referral centre. Patients were managed with either operative or non-operative treatments. Operative treatment consisted of trapeziectomy and ligament reconstruction with flexor carpi radialis tendon interposition or intra-articular autologous fat transfer. Non-operative treatments included splinting, anti-inflammatory medication, intra-articular corticosteroid injection or intra-articular platelet-rich plasma injection. Eligible patients required a primary diagnosis of TM OA and a minimum of one baseline and at least one set of follow-up data. Patients treated non-operatively for bilateral TM OA were included. We excluded patients with concurrent inflammatory arthritis, post-traumatic arthritis or previous thumb-joint arthroplasty procedures.
Study design
All questionnaires were administered and completed in the surgeon’s office. Informed consent and a baseline battery of questionnaires including the abbreviated version of the Disabilities of the Arm, Shoulder, and Hand questionnaire (QuickDASH) and TASD were completed during the initial visit. The QuickDASH consists of 11 items and is scored from 0 to 100. The TASD consists of 12 items distributed into subscales for symptoms and disability (Figure 1). It is also scored from 0 to 100, with a higher score representing a higher level of symptoms and disability (Becker et al., 2016). Patients in the operative group then completed the same battery of questionnaires at follow-up appointments 6 weeks, 3 months and 6 months postoperatively, whereas patients in the non-operative group completed the questionnaires at 3- and 6-month follow-up time points. At follow-up, operatively treated patients also responded to an anchor question (Figure 2; ‘Overall, considering the results of your surgery, would you consider your thumb is …’), which was similar to that used in other studies (Copay et al., 2007; Jaeschke et al., 1989; Juniper et al., 1994; Sorensen et al., 2013), generating a score on a 15-point global scale (−7 = ‘a very great deal worse’ to 0 = ‘no change’ to +7 = ‘a very great deal better’). The global rating scale was part of a larger questionnaire that was used in a separate study of the outcomes of trapeziectomy and ligament reconstruction and tendon interposition (LRTI). This questionnaire was designed to evaluate surgical outcomes and therefore was not administered to the non-operatively treated patients.
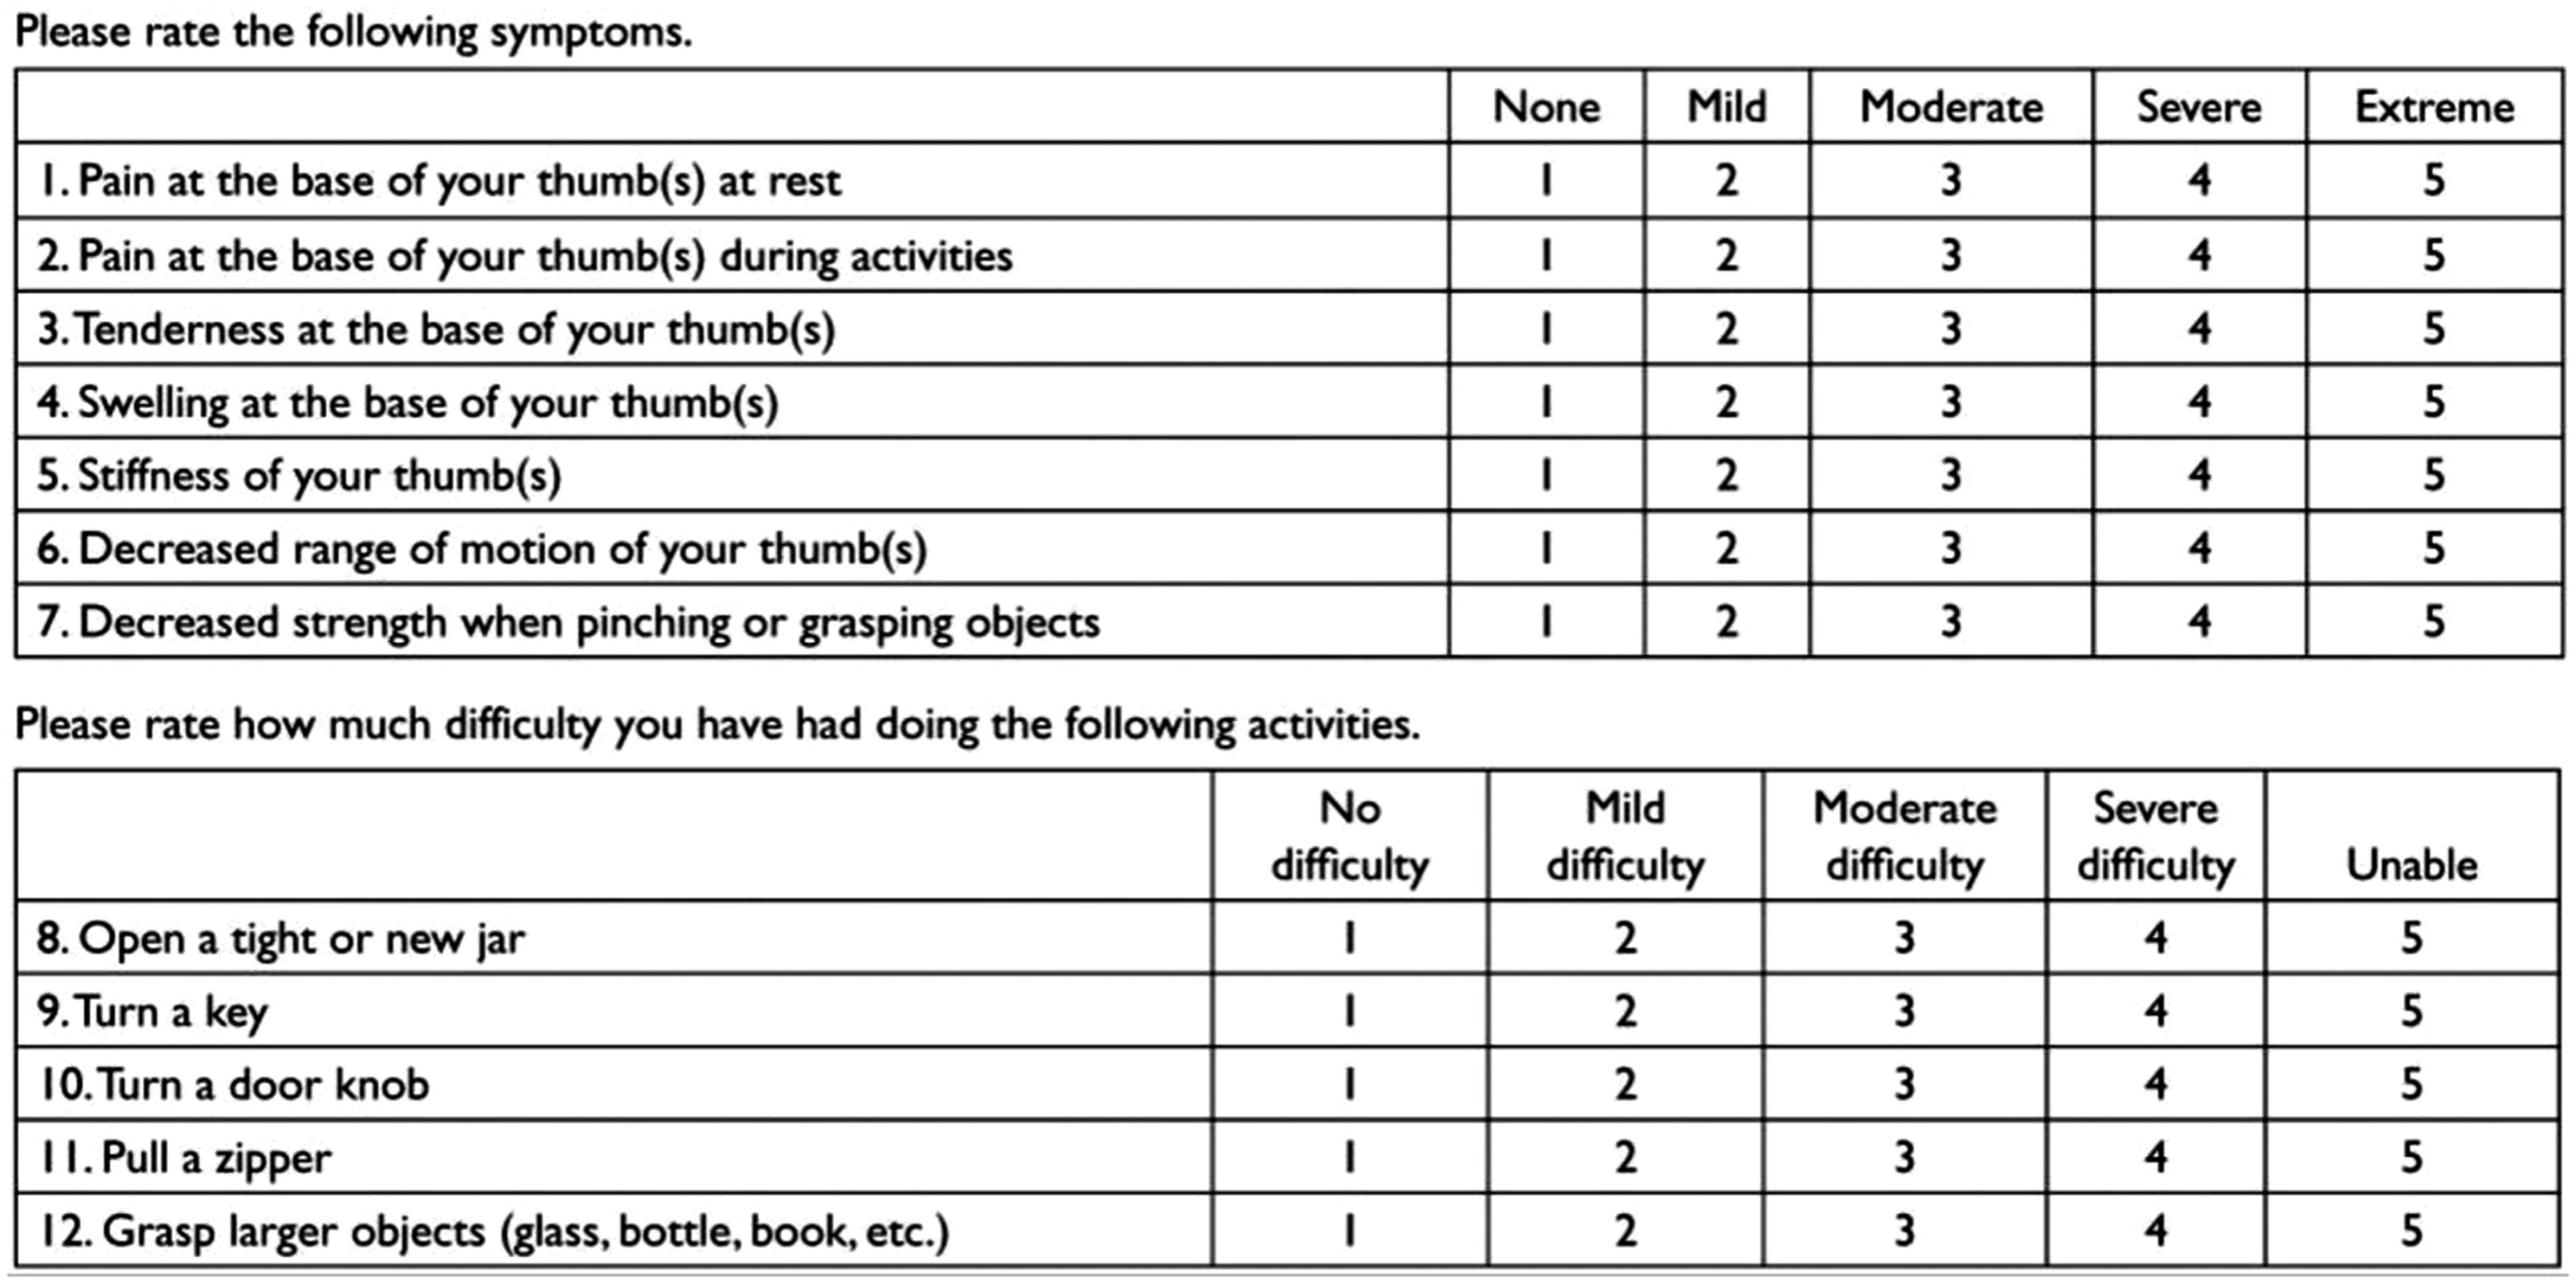
Trapeziometacarpal Arthrosis Symptoms and Disability (TASD) questionnaire.From Becker SJ, Teunis T, Ring D, Vranceanu AM. The trapeziometacarpal arthrosis symptoms and disability questionnaire: development and preliminary validation. Hand (NY). 2016, 11: 197–205.
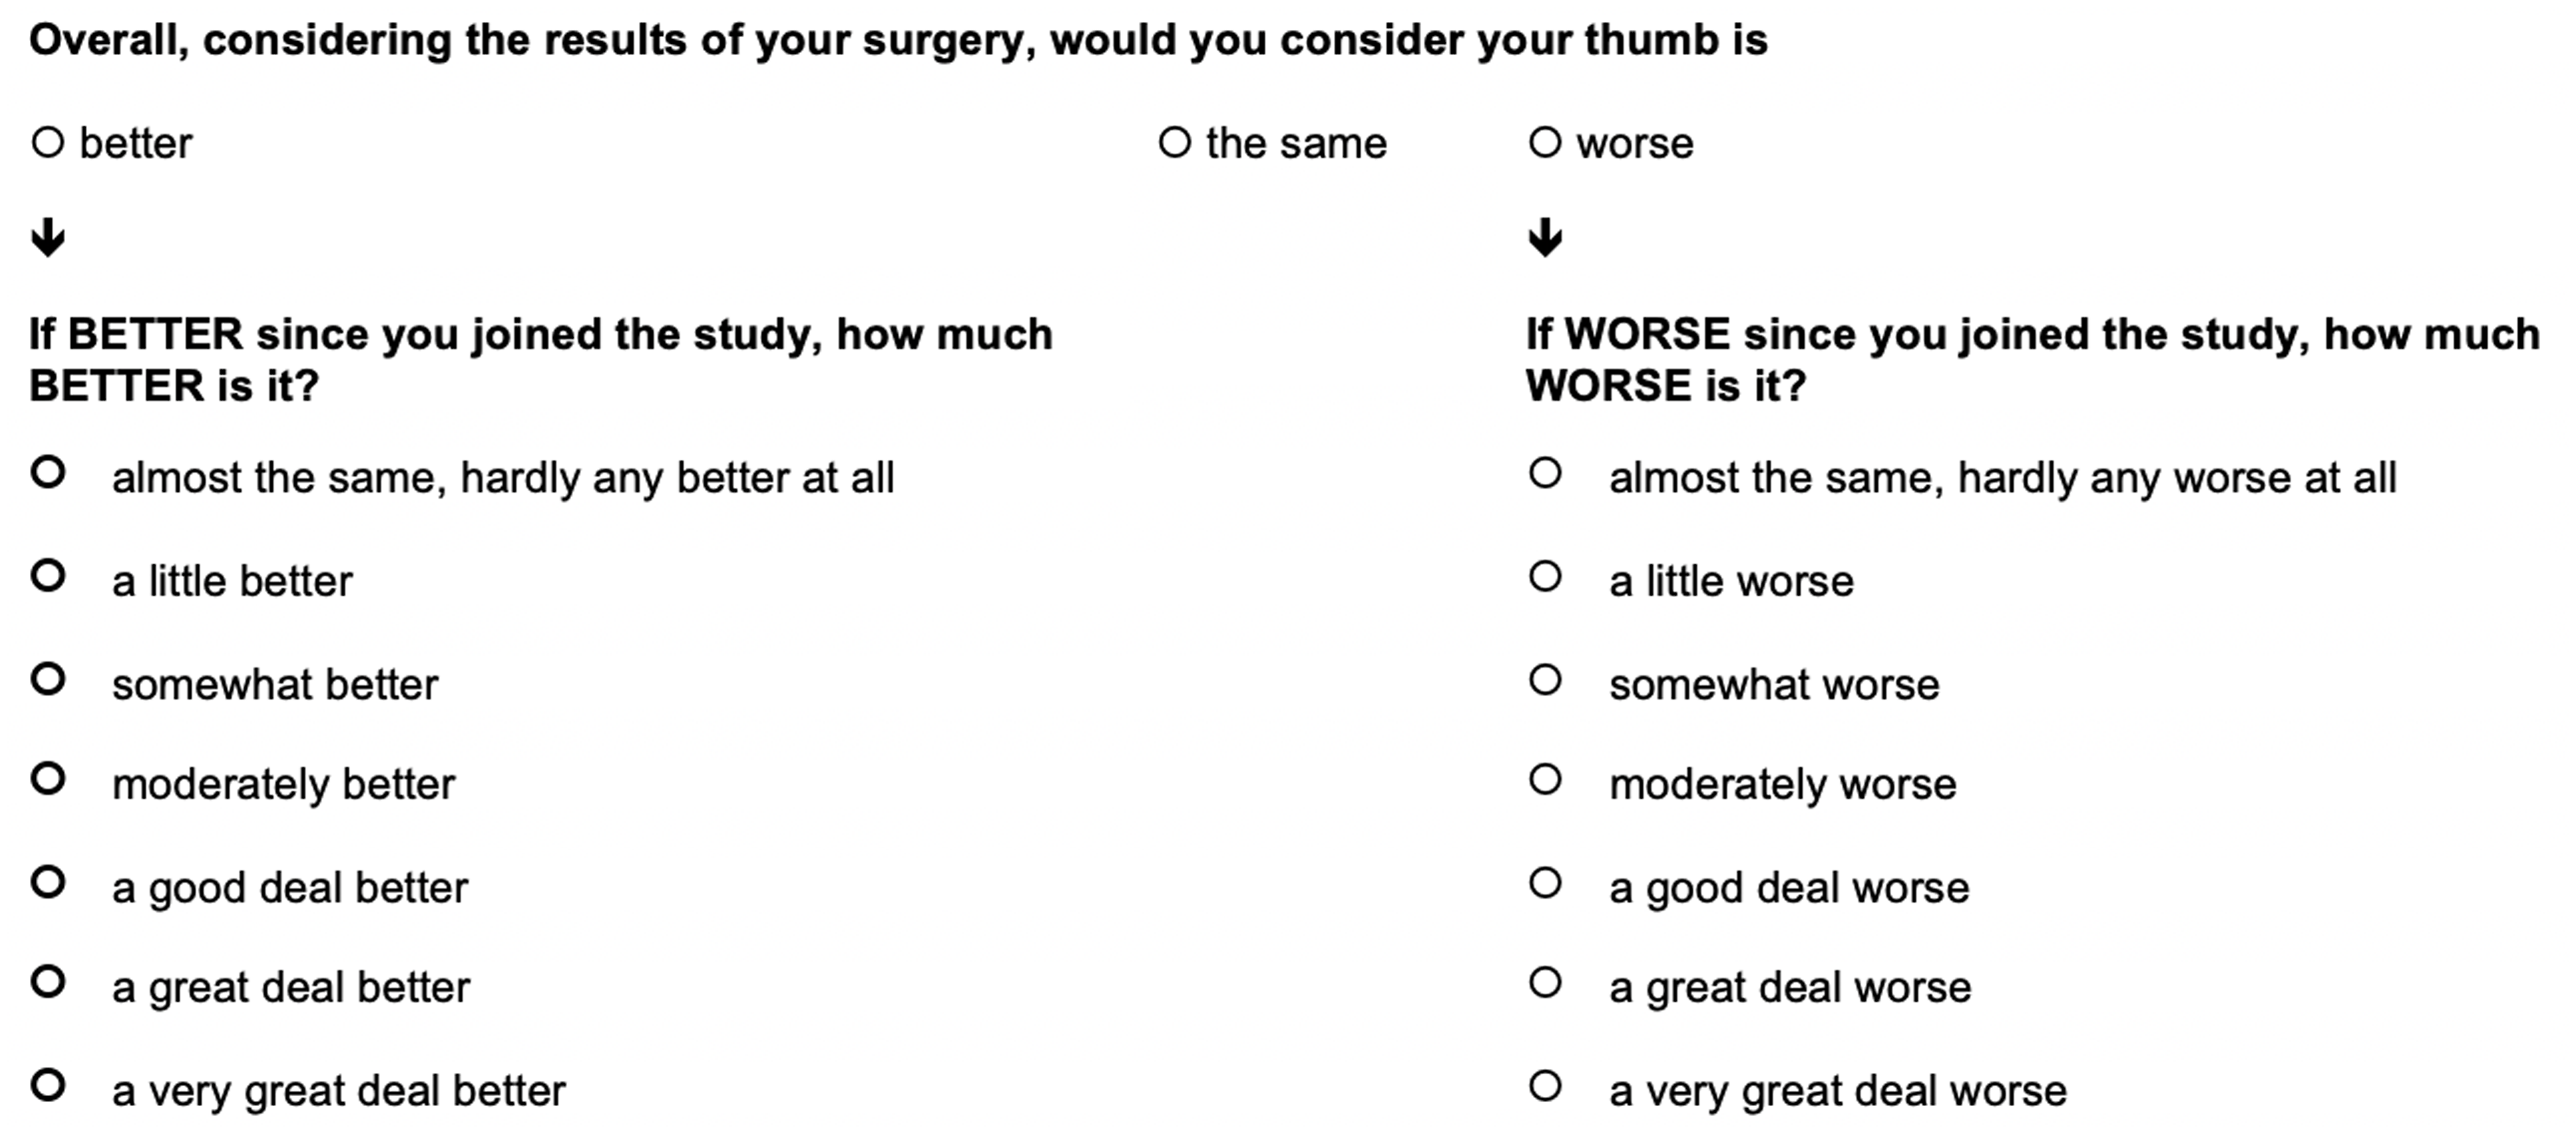
Global rating scale question administered at baseline and follow-up visits to the operative treatment group.
Statistical analyses
Baseline demographic variables for patients treated operatively or non-operatively were compared using two-tailed independent-samples t-tests. An a of 0.05 was the criterion for statistical significance. We reported 95% confidence intervals for MCID estimates.
Initial analysis involved tests of internal validity. TASD and QuickDASH scores were correlated at each time point. In operatively treated patients, we correlated ratings on the anchor question at each postoperative time point (6 weeks, 3 months and 6 months) with the change in score from baseline at the corresponding time point for the TASD (DTASD) and QuickDASH (DQuickDASH). In non-operatively treated patients, we correlated DQuickDASH at each follow-up time point (3 months, 6 months), with the corresponding DTASD at those time points. We reported Pearson correlation coefficients (r), where r less than 0.3 was considered to indicate no association, r between 0.3 and 0.5 was considered weakly positive, r between 0.5 and 0.7 was considered moderately positive and r greater than 0.7 was considered strongly positive.
Two approaches were then used to arrive at a MCID estimate for the TASD. First, in the operatively treated group, the MCID was established based on the DTASD in patients who reported an improvement of +3 (‘somewhat better’) or +4 (‘moderately better’) on the anchor question at the same time point. Thus, patients were categorized based on their answers to the anchor question as follows: no improvement/deterioration (–7 to +2), minimal improvement (+3 to +4) or major improvement (+5 to +7). Although the anchor question was not administered to non-operatively treated patients, the QuickDASH was completed by both the operative and non-operative cohorts. Therefore, the second approach involved establishing an MCID based on the interval DTASD in patients who demonstrated a minimal clinically important improvement on the QuickDASH at the same time point. Previous studies have established an MCID for the QuickDASH using anchor- and distribution-based methods (Franchignoni et al., 2014; Polson et al., 2010; Sorensen et al., 2013). We selected a score improvement of 15 to 20 points as the lower and upper borders of the MCID on the QuickDASH based on these. Thus, patients were categorized based on change in QuickDASH score as follows: no improvement/deterioration (increased score or decrease of <15 points), minimal improvement (decrease of 15 to 20 points) or major improvement (decrease of >20 points). We used all scores meeting criteria for minimal improvement to establish the overall MCID. We did not include the 6-week data in our calculation as we considered this to be too early to assess clinical improvement after trapeziectomy and LRTI (Vermeulen et al., 2014). Appropriate parametric or non-parametric measures of central tendency were reported based on the graphical distribution of data points.
Results
One hundred and twenty-one patients were enrolled in the study and completed baseline questionnaires (Figure 3). Follow-up data were obtained from 95 patients (39 operative, 56 non-operative) at the 3-month time point, and 80 patients (35 operative, 45 non-operative) at the 6-month time point. Four operatively treated patients did not complete the global rating scale question and four patients in the non-operative group eventually underwent operative treatment. Operatively treated patients were significantly younger and more likely to have undergone previous surgery for the treated thumb (p-values <0.05; Table 1). There were no differences in baseline Eaton grade between the operatively and non-operatively treated groups.
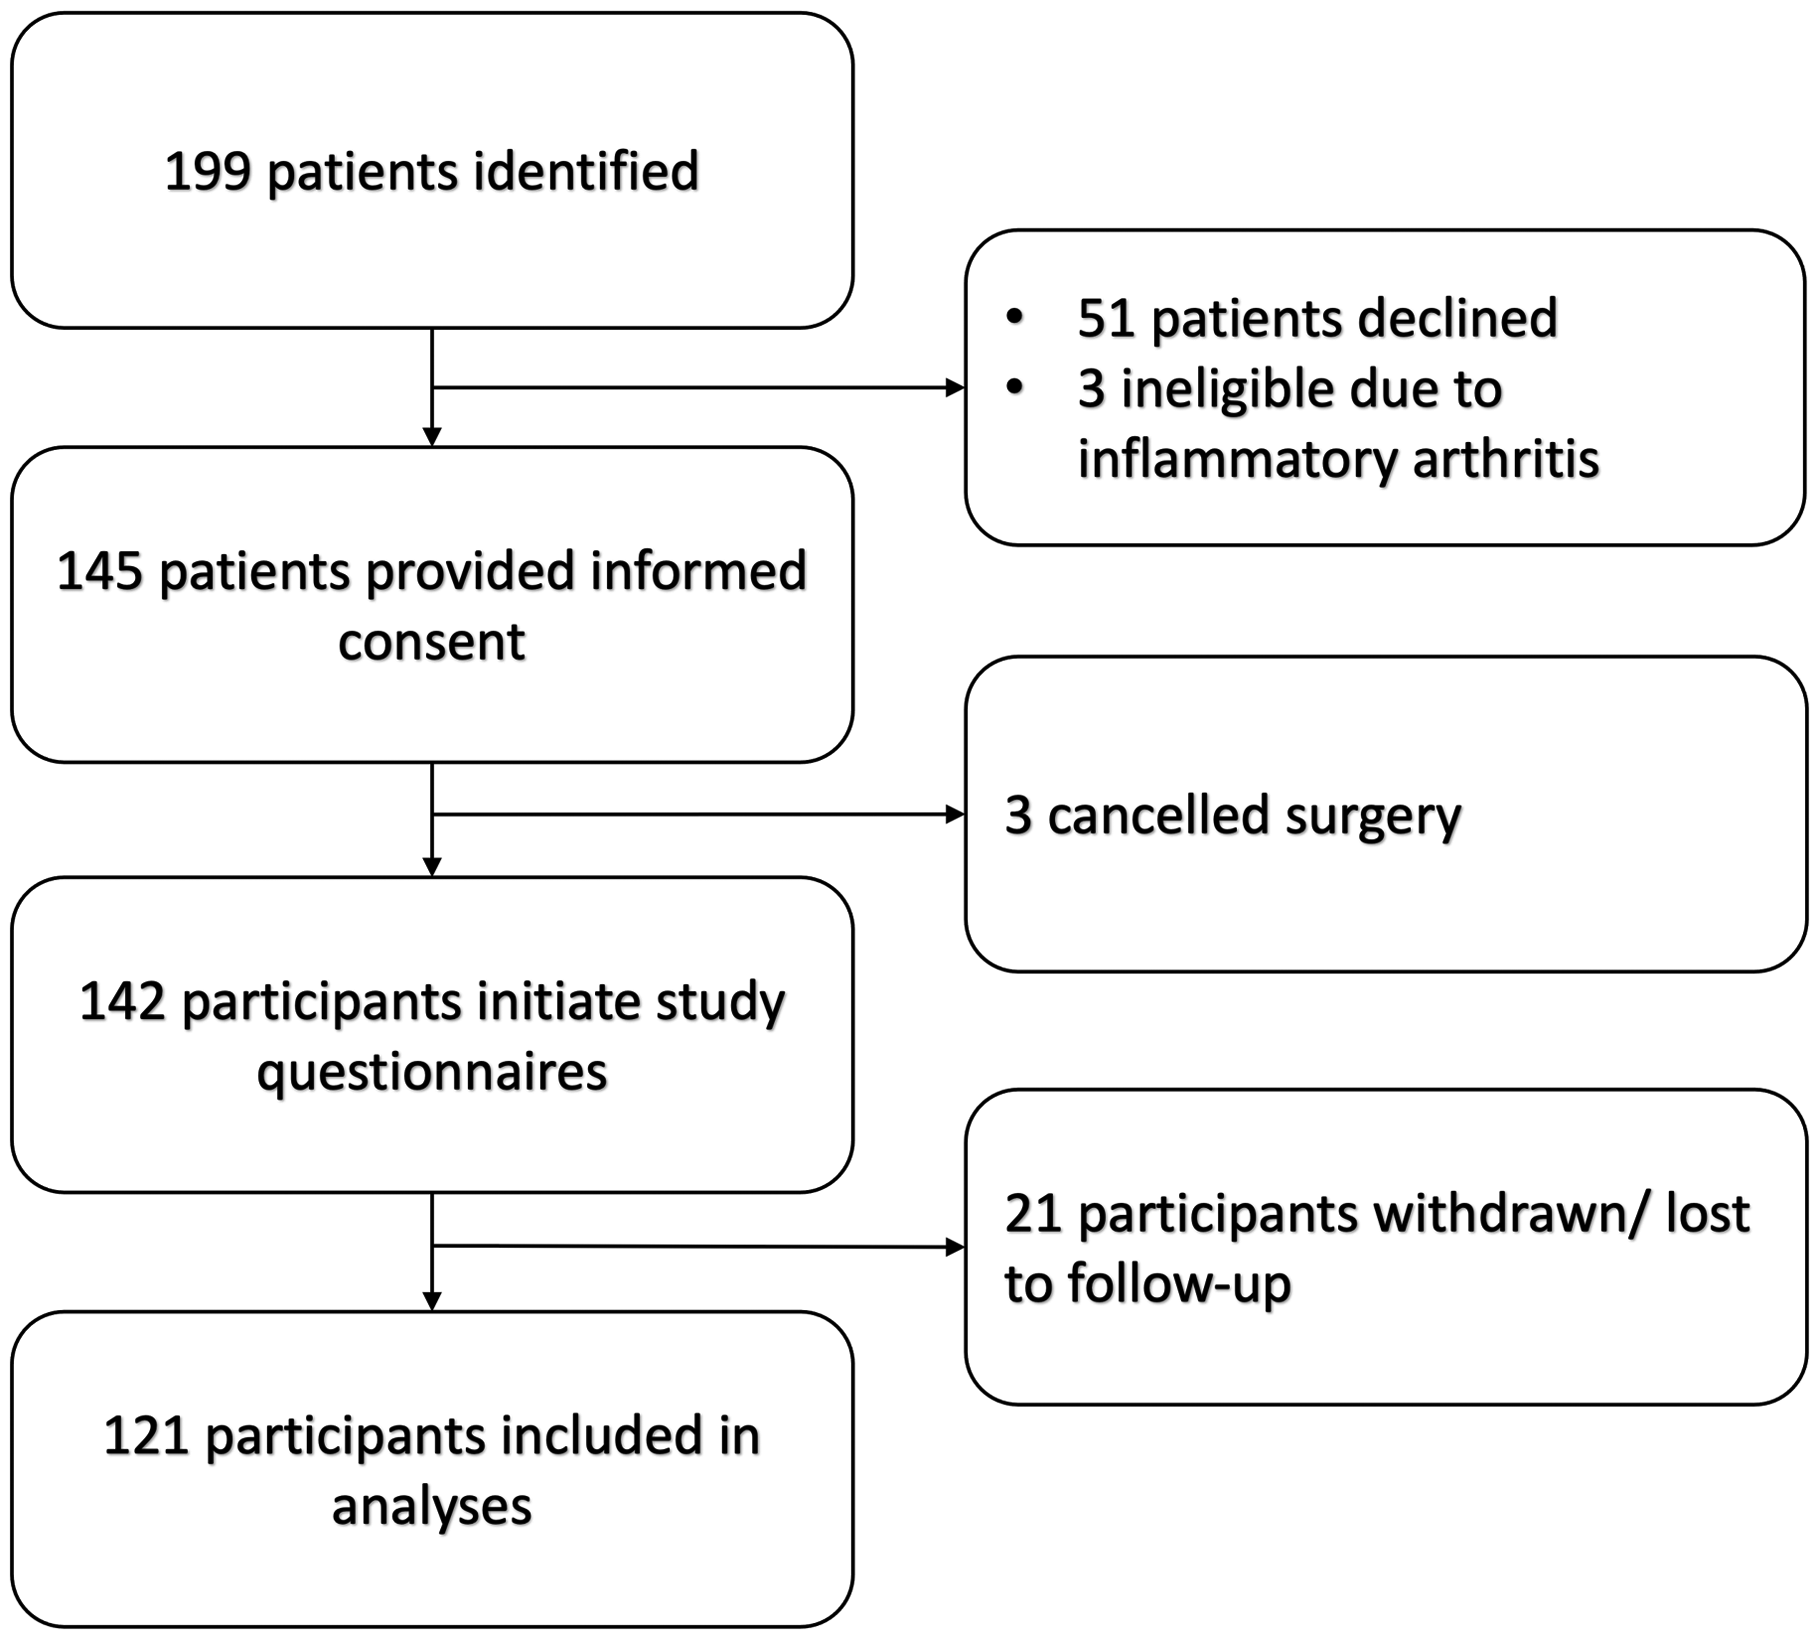
Flow diagram of patient enrolment.
Comparison of baseline characteristics between operatively and non-operatively treated patients with trapeziometacarpal arthritis.
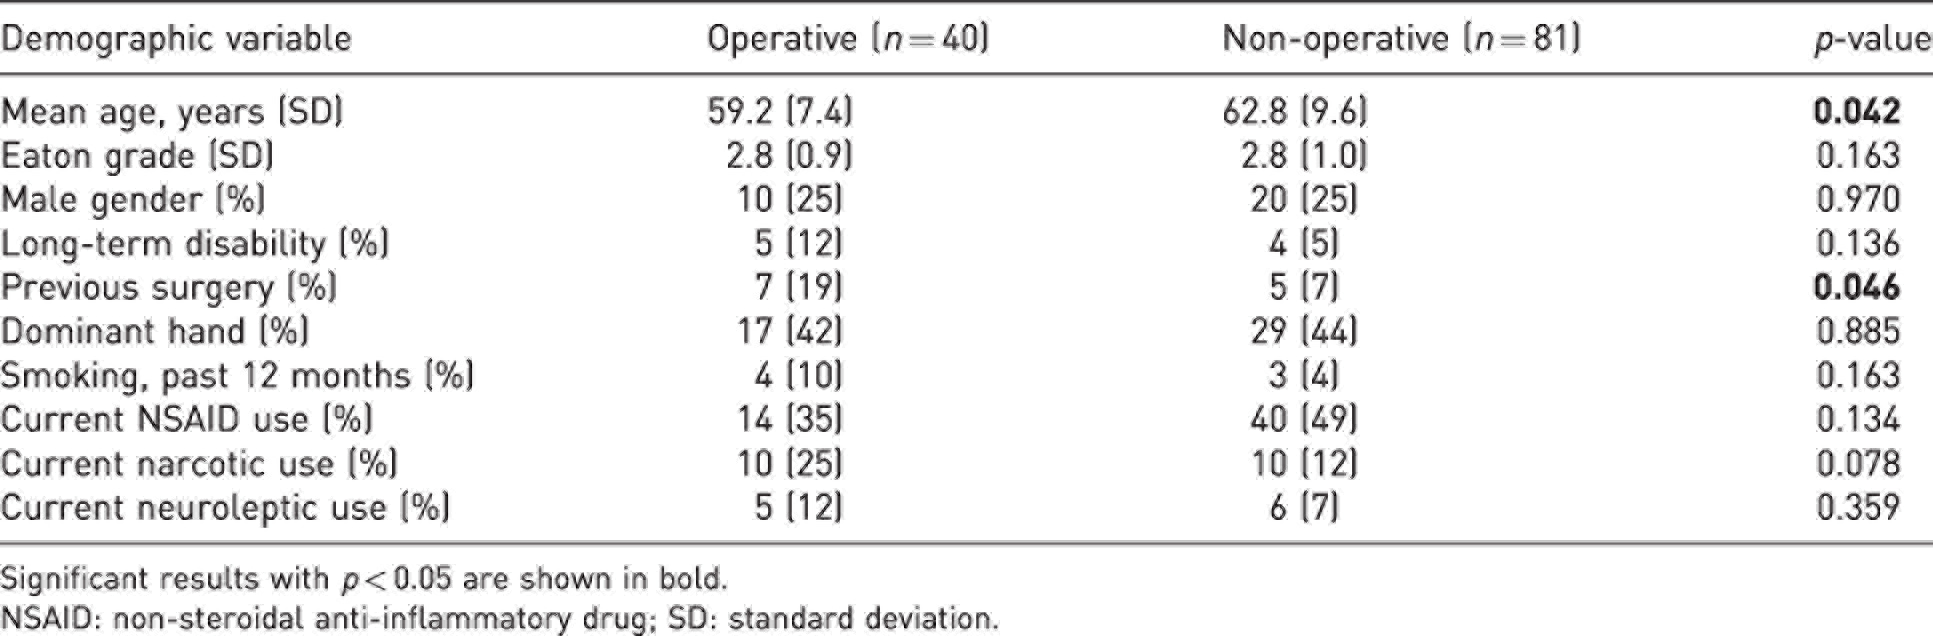
Significant results with p < 0.05 are shown in bold.
NSAID: non-steroidal anti-inflammatory drug; SD: standard deviation.
Tests of internal validity
Internal validity of the TASD was analysed at each time point. In operatively treated patients, the relationship between DTASD and the anchor score became stronger over time (Figure 4). DQuickDASH showed no relationship with the anchor question at 6 weeks and 3 months, but showed a weak correlation at 6 months (Figure 5). In the pooled sample of operatively and non-operatively treated patients, the TASD and QuickDASH correlated strongly at all time points (p-values <0.05; Figure 6).
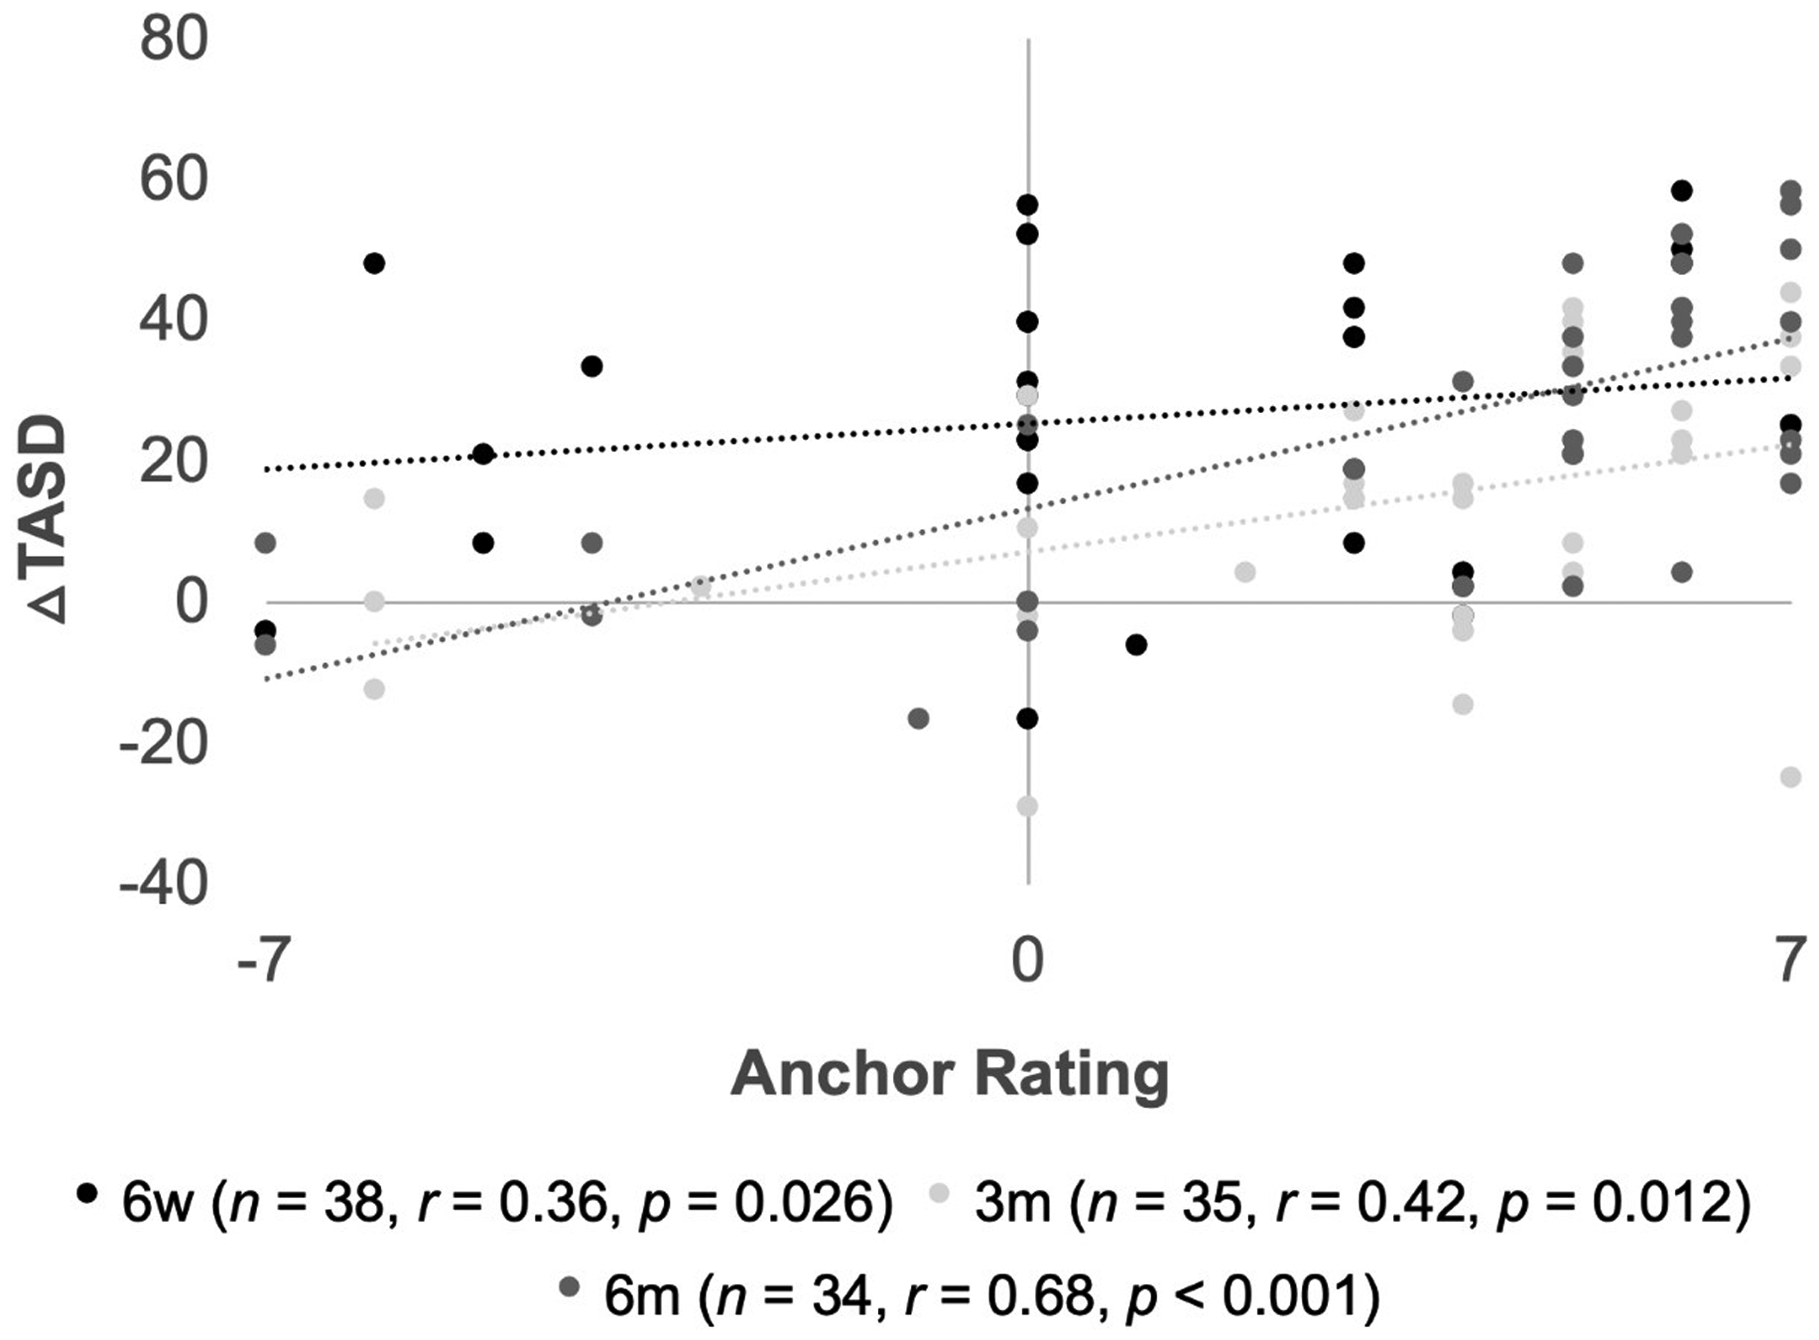
Scatterplot illustrating relationships between anchor question rating (–7 to +7) and change in TASD score (△TASD) from baseline at three time-points: 6-week (6w), 3-month (3m) and 6-month (6m) follow-up. Number of patients (n), Pearson correlation coefficient (r), and p-value (p) at each time-point are shown in the legend.
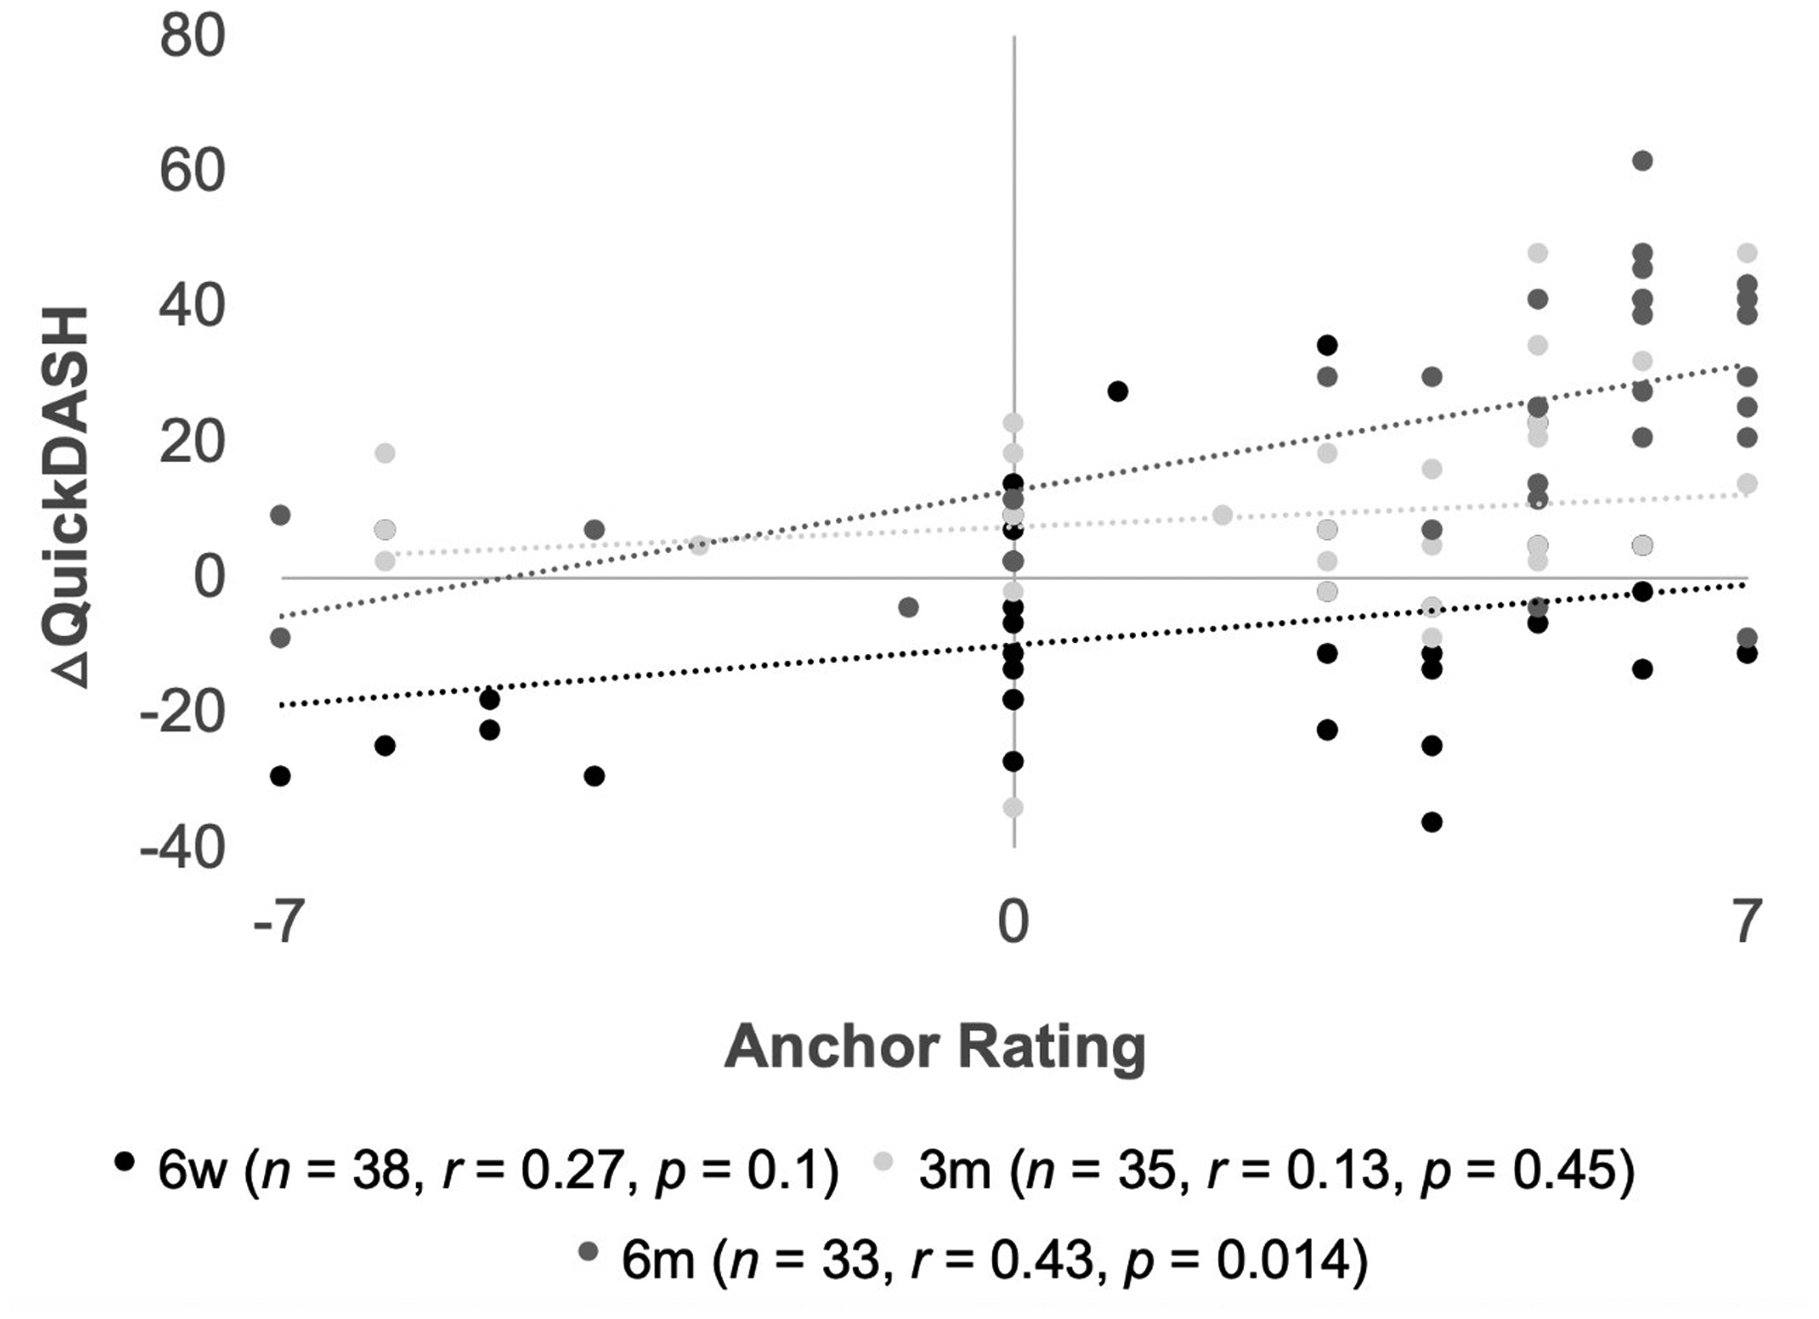
Scatterplot illustrating relationships between anchor question rating (–7 to +7) and change in QuickDASH score (△QuickDASH) from baseline at three time-points: 6-week (6w), 3-month (3m) and 6-month (6m) follow-up. Number of patients (n), Pearson correlation coefficient (r), and p-value (p) at each time-point are shown in the legend.
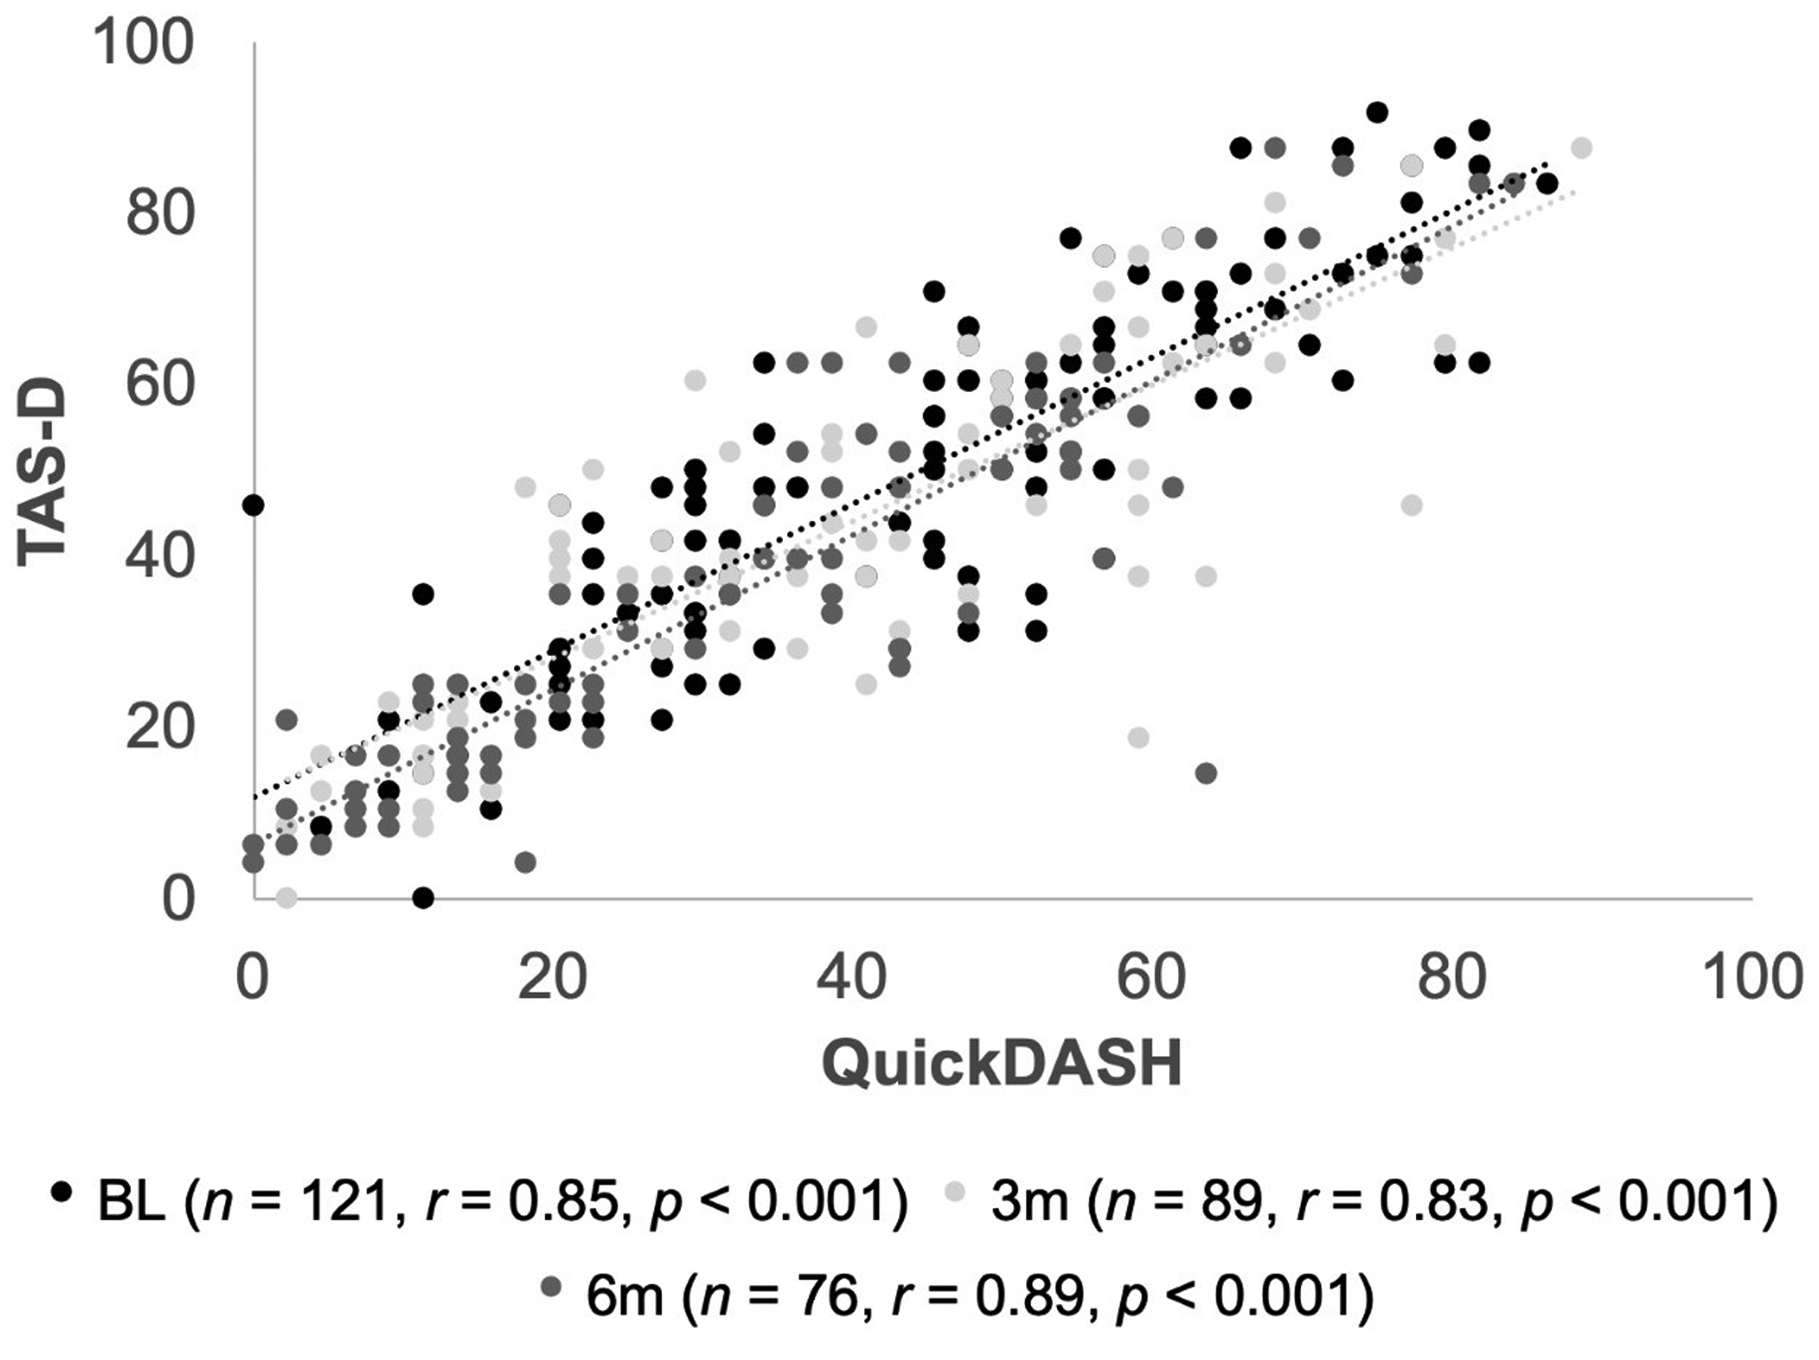
Scatterplot illustrating relationships between scores on the TASD (0 to 100) and QuickDASH (0 to 100) at three time-points: baseline (BL), 3-month (3m) and 6-month (6m) follow-up. Number of patients (n), Pearson correlation coefficient (r), and p-value (p) at each time-point are shown in the legend.
MCID
Two methods were used to arrive at the MCID. Owing to the low number of scores meeting the criteria for minimal improvement the scores were not normally distributed so median values are reported. There were minimal discrepancies between the median and mean values, except in the minimally improved operative group at 3-month follow-up, where a single outlier resulted in a negatively skewed mean.
Using the global rating scale anchor method, 13 patients in the operatively treated group met criteria for minimal improvement (Table 2). At 3-month follow-up 10 of 35 patients met the criteria for minimal improvement with a median decrease of 14.6 points on the TASD and 15 met the criteria for major improvement, while at 6-month follow-up only three of 34 patients met criteria for minimal improvement with a median decrease of 18.8 points as 23 showed major improvement. Of the patients who were minimally improved at 3 months, two remained minimally improved at 6 months, while five reached the criteria for major improvement and three were lost to follow-up.
Change in Trapeziometacarpal Arthrosis Symptoms and Disability questionnaire score in relation to anchor score for operatively treated patients at 3- and 6-month postoperative follow-up.
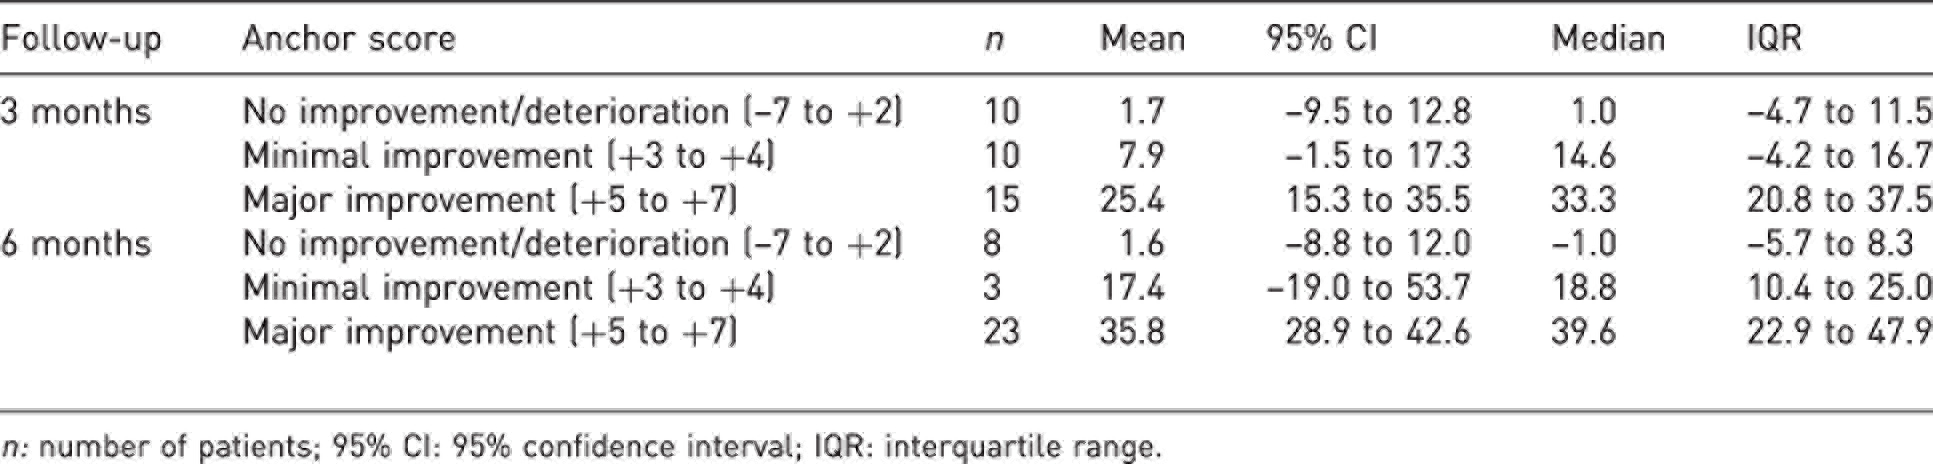
n: number of patients; 95% CI: 95% confidence interval; IQR: interquartile range.
Using the QuickDASH anchor method, 11 patients in the pooled group of patients met the criteria for minimal improvement, with median decreases of 14.6 points and 15.6 points at 3- and 6-month follow-up, respectively (Table 3). In the operative group, four of 39 patients met the criteria for minimal improvement and nine met the criteria for major improvement at 3-month follow-up, while none met the criteria for minimal improvement and 22 of 35 patients met the criteria for major improvement at 6-month follow-up. In the non-operative group, only five of 56 patients met the criteria for minimal improvement and ten met the criteria for major improvement at 3-month follow-up, with another two of 45 patients meeting the criteria for minimal improvement and six meeting the criteria for major improvement at 6-month follow-up. None of the patients who met the criteria for minimal improvement at 3 months remained minimally improved at 6 months.
Change in Trapeziometacarpal Arthrosis Symptoms and Disability questionnaire score in relation to change in QuickDASH score for all patients after 3 or 6 months of follow-up.
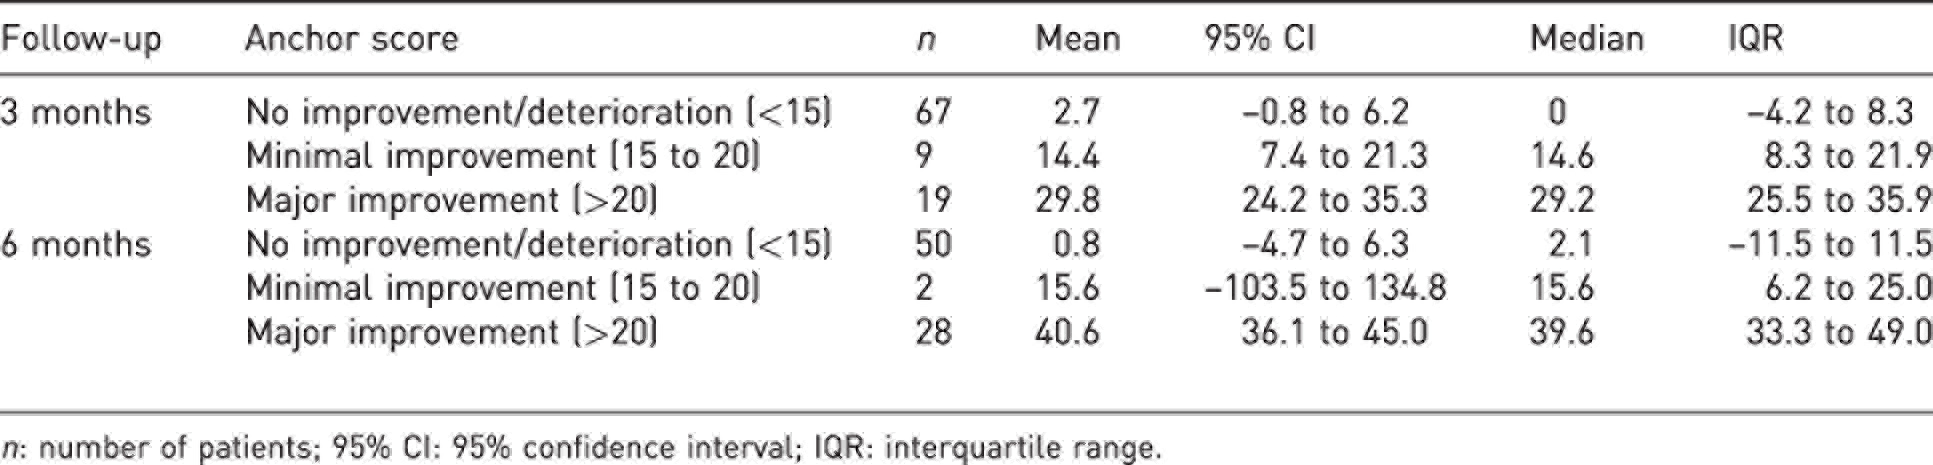
n: number of patients; 95% CI: 95% confidence interval; IQR: interquartile range.
Using two approaches at two different time points we obtained 24 scores meeting the criteria for minimal clinically important change. The median score was 14.6 (95% CI: 6.2 to 16.7), with the closest whole number value being 15.
Discussion
This prospective study used convergent methods to establish a MCID of 15 points on the TASD. Previous studies have largely used upper extremity outcome measures that were not developed to measure symptoms and disability specific to TM OA, such as the DASH, QuickDASH, the Michigan Hand Questionnaire and the Patient-Rated Wrist (Hand) Evaluation (Angst et al., 2005; Marks et al., 2013; Shauver and Chung, 2013). MCIDs for instruments specific to TM OA, such as the TASD, have not been investigated.
The use of a MCID directly addresses the limitations inherent to statistically significant results by shifting the focus to quantitative thresholds that reflect meaningful change for patients and physicians. We used two different anchor methods in our study. The first was based on a subjective global rating scale of improvement over time. The anchor question had a 15-point response scale generating a rating between –7 and +7. There has been debate regarding the definition of ‘minimal change’ using this scale, but we chose to use a conservative threshold in which the responses ‘hardly any better at all (+1)’ and ‘a little better (+2)’ were not considered to reflect minimally important change, but the responses ‘somewhat better (+3)’ and ‘moderately better (+4)’ were (Sorensen et al., 2013). Including ratings of +1 or +2 would have lowered the MCID and thus increased the likelihood of capturing results that were not clinically meaningful. Furthermore, retrospective global ratings are susceptible to recall bias and small changes may not be reliably estimated by patients (Crosby et al., 2003). Finally, we obtained similar results using a second anchor-based approach, suggesting that we selected an appropriate range of minimally improved ratings.
Our second method used a previously established MCID range on the QuickDASH as an anchor. Although this is not a traditional anchor-based method, it has several advantages. First, we were able to apply a single anchor to a sample of patients who received heterogenous treatments. Capturing clinically important change in the non-operative group with a global rating would have almost certainly required a new questionnaire with wording tailored to non-operative treatments and may not have generated equivalent ratings. Second, the QuickDASH poses questions about the patient’s current levels of pain and disability and, therefore, serves as an anchor that is free of recall bias. Finally, the MCID of the QuickDASH has been extensively investigated, and although there is no single agreed-upon value, our score range of 15–20 points is relatively conservative and should capture clinically important outcomes.
Several other findings in our study warrant discussion. Consistent with its initial validation study, TASD scores correlated strongly with QuickDASH scores at all timepoints. In operatively treated patients, DTASD scores correlated more strongly with the anchor rating than DQuickDASH scores. It is appealing to attribute this to the specificity of the TASD for TM OA, supporting its usefulness as a measurement tool for this condition. Previous MCID studies have used shorter follow-up periods (e.g. 2–6 weeks) after non-operative interventions (Franchignoni et al., 2014; Sorensen et al., 2013). One problem with using longer intervals between test administrations is the effect of recall bias (Knox and King, 2009; Norman et al., 1997). However, we found that both DTASD and DQuickDASH correlated poorly with the anchor rating at the earliest follow-up of 6 weeks and became stronger at 3 and 6 months. Probable reasons for this discrepancy include a lack of meaningful improvement or superimposed postoperative pain and disability 6 weeks after surgery, but these trends also suggest that longer time intervals are appropriate for establishing the MCID.
Our study had several limitations. Our findings were underpowered owing to the small number of patients meeting the criteria for minimal improvement. Although our sample size was comparable with other MCID studies (Sorensen et al., 2013), this lack of power was influenced by our selection of narrow and conservative ranges of minimally important scores on our anchors. We must also acknowledge the limitations inherent to each of the anchor-based methods. Subjective global rating scales are susceptible to the effects of recall bias and the pitfalls of asking patients to make judgements about their own health status (Crosby et al., 2003; Terwee et al., 2010). A second prospective anchor based on the QuickDASH would theoretically mitigate these issues, but raises the concern that any biases inherent to the QuickDASH would be reflected in the MCID that we obtained for the TASD. Moreover, we could not control for other life circumstances unrelated to TM OA that might have influenced QuickDASH scores. All the commonly used anchor-based methods in MCID studies have notable limitations (Copay et al., 2007), but using two convergent methods to arrive at a similar result should strengthen the validity of MCID measurements. Finally, recent studies have highlighted the relevance of mood and coping strategies in predicting the severity of disability experienced in TM OA (Lozano-Calderon et al., 2008; Makarawung et al., 2013). Attention to psychosocial factors is probably important for optimizing treatment decisions (Wilkens et al., 2017, 2019), but these factors are not currently assessed by patient-reported outcome instruments for TM OA, including the TASD or the Thumb Disability Examination and Nelson Score.
As the use of patient-reported outcome measures becomes more common, disease-specific instruments are needed. In our study, we established a MCID for the TASD that should help guide its use and interpretation. Nevertheless, caution must be exercised in generalizing a MCID from a single study and further research with larger sample sizes is needed to corroborate our findings.
Footnotes
Declaration of conflicting interests
The authors declare no potential conflicts of interest with respect to the research, authorship, and/or publication of this article.
Funding
The authors received no financial support for the research, authorship, and/or publication of this article.
Ethical approval
Ethical approval for this study was obtained from the University Health Network Research Ethics Board.