
Abstract
The three-dimensional carpal alignment was measured in the neutral wrist position in 121 asymptomatic volunteers using computer-based cone-beam CT analysis. Normal values and the reliability of the automated analysis are reported. An analysis software based on segmentation of CT images and mathematical modelling was used to determine several axis variants based on different landmarks and to calculate the intercarpal angles automatically. Twenty wrists were imaged twice to determine intra-observer reliability. Mean values using the preferred axis variants were: scapholunate angle 57° (SD 9°), radiolunate angle 2° (SD 10°), lunocapitate angle –14° (SD 9°). Using alternate axis variants notably changed the angles produced. The intra-observer reliability of the analysis was excellent (mean intraclass correlation coefficient 0.97, SD 0.03). Computer-based CT analysis enables highly reproducible and automated assessment of carpal alignment. This study provides a reference database for measurement techniques and normal carpal angle values in three-dimensional imaging.
Introduction
Knowledge of normal carpal alignment and standardized methods of analysis are essential for studies of the carpus. Carpal alignment is determined by measuring distances and angles between carpal bones on plain radiographs (Gilula and Weeks, 1978). The angles are based on axes traced on the lateral radiograph (Linscheid et al., 1972). The manual measurement of carpal angles on plain radiographs can be unreliable and difficult to reproduce (Garcia-Elias et al., 1989; Larsen et al., 1991b) and the normal ranges are wide and variable (Sarrafian et al., 1977). Errors in radiographic projections and wrist positioning often affect the measurements (Capo et al., 2009; Koh et al., 2013; Yang et al., 1997).
Computerized tomography (CT) provides detailed three-dimensional (3-D) information about bone structures. Large scanners often require the upper extremity to be placed in a position that is different from that of the standard neutral radiograph on which the normal values are based (Lee et al., 2018; Tan et al., 2014). In the neutral position, the values for angles measured on tomographic images correspond to the values in plain radiographs (Lee et al., 2018). Cone-beam CT is a newer imaging technology that can be used for skeletal examination of extremities with a relatively low radiation dose and high spatial resolution (Koivisto et al., 2018). The smaller scanner allows acquisition of wrist images with the upper extremity in the neutral position. Recent studies have shown the value of cone beam CT in the assessment of wrist injuries and other conditions (Gibney et al., 2019; Neubauer et al., 2016; Pallaver and Honigmann, 2019). CT images have been used to determine the sizes, relative positions and kinematics of the carpal bones (Moojen et al., 2003; Patterson et al., 1995; Wolfe et al., 2000). There are however no definitions or a reference database for the values of carpal angles measured with 3-D CT.
The purpose of this study was to measure intercarpal angles in wrist cone-beam CT images using automated 3-D image analysis software based on the segmentation of CT images and mathematical modelling that was developed for this study, and to report its reliability and the normal ranges of carpal angles in asymptomatic volunteers. Several variants of carpal bone axes were explored using landmarks analogous to the landmarks used for the definition of axes on lateral radiographs.
Methods
Participants
Participants were recruited via social media and with an advert on the Helsinki University campus. All participants submitted written consent before imaging. One wrist per volunteer was imaged. The inclusion criteria included: age of the participant 18–60 years; no history of wrist or forearm trauma; no history of recurrent wrist pain and no known malformations or deformities in the imaged wrist. For participants with both wrists fulfilling the inclusion criteria, the imaged side was randomized. One hundred and twenty-one wrists were examined. The mean age of the participants was 38 years (SD 10.4: range 20–60); 69 were men and 52 women; the left/right-handed ratio was 107/14; 61 right and 60 left wrists were imaged; the dominant/non-dominant side ratio was 63/58.
Cone-beam computed tomography imaging
The images were acquired using a cone-beam CT device (Planmed Verity, Planmed Oy, Helsinki, Finland). The imaging parameters were: 90 kV, 5 mA, 0.4 mm resolution (voxel size), 400 projections, 20 ms pulse length. In cone-beam CT scanning, the projection images are acquired over an angle of 210°, with a scan time of 18 s and reconstruction time of 30–120 s. The image field was approximately 13 × 16 cm and a minimum of 6 cm of the distal radius was included in this field. The wrists were imaged in the standard neutral position (Hardy et al., 1987; Mann et al., 1992) with the participant’s shoulder abducted 90°, the elbow flexed 90° and the forearm in neutral rotation with the palm resting on the tray. The axis of the middle metacarpal and the radius was aligned using the scanner’s targeting laser and in the scout image. Twenty wrists were imaged twice to determine intra-observer reliability.
Analysis
The pseudonymized wrist cone-beam CT scans were exported in Digital Imaging and Communications in Medicine (DICOM) format and analysed in co-operation with Disior Ltd (Helsinki, Finland) using image analysis software that was developed for this project. The bones to be measured were first identified by placing marker points manually on the 3-D rendered bone surface, after which a mathematical model was registered automatically and applied to the wrist in the cone-beam CT scan. Patient specific bone shape was obtained by using deformable shape models (Sotiras et al., 2013; Suojärvi et al., 2021b).
A geometric axis was defined for each carpal bone by reformatting 0.5 mm slices along the bone’s length, mathematically determining the geometric centre point for each slice and projecting a line through the points (Figure 1). These geometric axes were named Sgeom for the scaphoid, Lgeom for the lunate, etc. Additional axes were defined using the following: the anterior and dorsal tangents for the scaphoid and capitate (Santerior, Sdorsal and Canterior, Cdorsal, respectively); a line perpendicular to the line joining the distal-most points of the distal horns of the lunate (Ltips) and a refinement thereof using the centres of the distal plateaux of the horns as the landmarks so as to eliminate errors from osteophytes or other small disturbances in the contour (Lplateaux); and a similar perpendicular axis for the distal points of the capitate (Ctips). Additionally, axes were defined based on the centres of the distal and proximal articular surfaces of the lunate (Ldist, Lprox) and capitate (Cdist, Cprox), respectively, by plotting a number of lines perpendicular to the central portion of the articular surface and calculating their mean axis.
Axis variants and landmarks. (a) Capitate. Red: geometric axis, Cgeom. Yellow: a tangent connecting the two anterior-most points of the anterior convexities, Canterior. Blue: a tangent connecting the two dorsal-most points of the dorsal convexities, Cdorsal. Orange: an axis perpendicular to the line connecting the two distal-most points of the capitate Ctipsr. Green: an axis perpendicular to the centre of the distal articular surface, Cdist. Grey: an axis perpendicular to the proximal articular surface, Cprox. (b) Scaphoid. Red: geometric axis, Sgeom. Yellow: a tangent connecting the two anterior-most points of the anterior convexities, Santerior. Blue: a tangent connecting the two dorsal-most points of the dorsal convexities, Sdorsal. (c) Lunate. Red: geometric axis, Lgeom. Orange: a line perpendicular to the line connecting the distal-most points of the lunate horns, Ltips. Light blue: a line perpendicular to the line connecting the middle points of the lunate horn contours Lplateaux. Green: an axis perpendicular to the centre of the distal articular surface, Ldist. Grey: an axis perpendicular to the proximal articular surface, Lprox. (d) Middle metacarpal. Red: geometric axis, MCgeom. Blue: dorsal tangential axis, MCdorsal. Grey: an axis perpendicular to the proximal articular surface, MCprox. (e) Lateral CT scan of the wrist.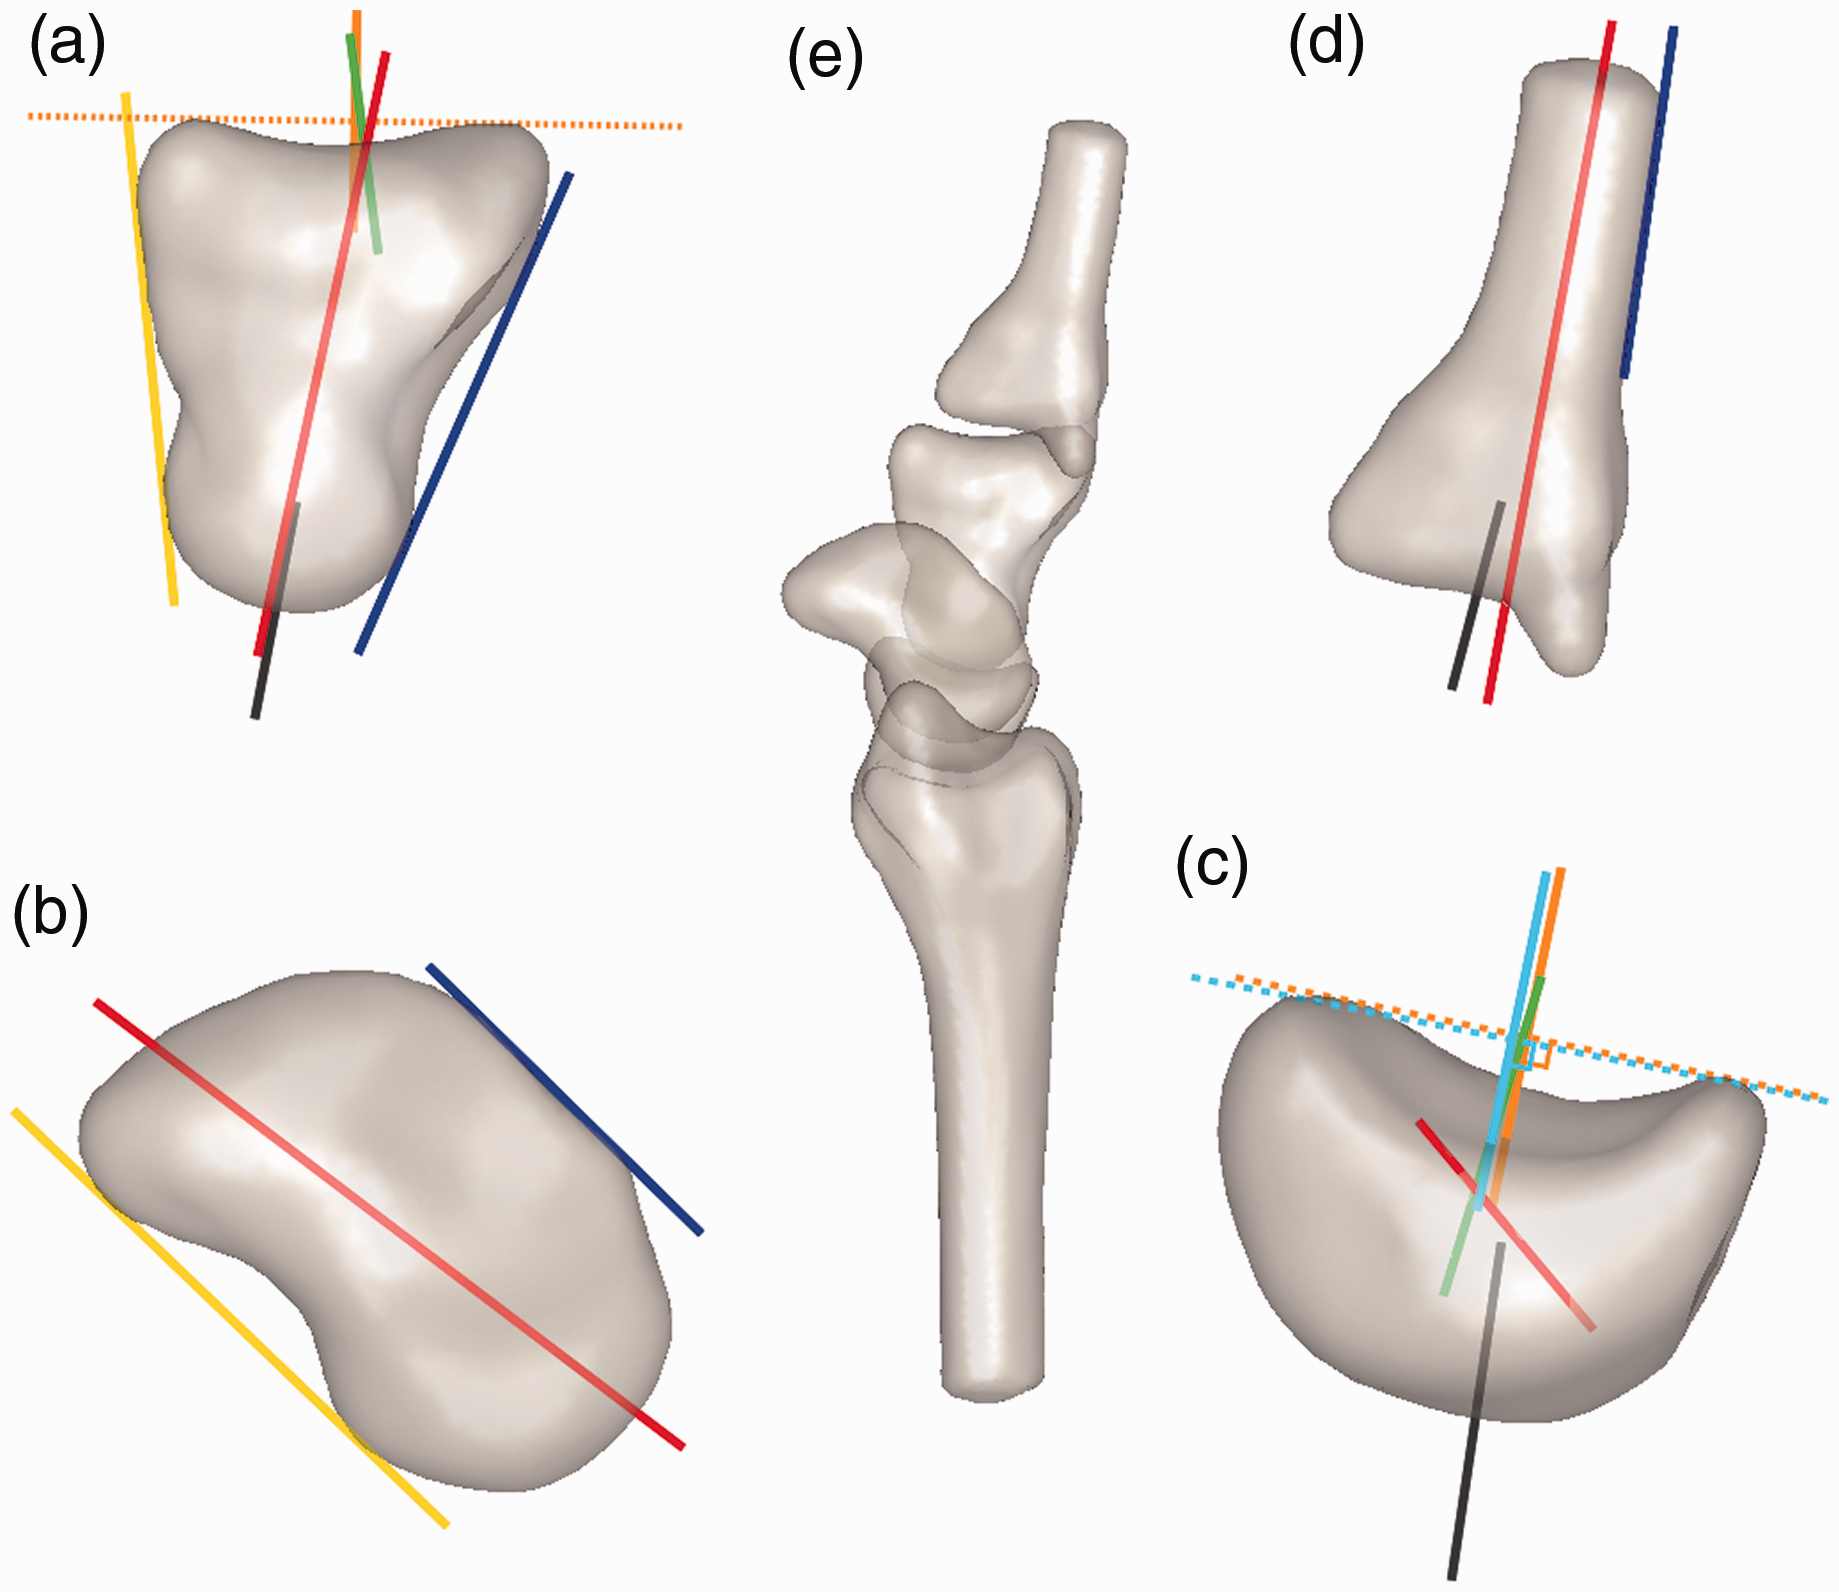
A geometric axis for the middle metacarpal was defined by plotting a geometric axis for a 10 mm segment and sliding the segment along the bone from proximal to distal. The segment along which there was the least variance in the axis produced was selected individually for each wrist. A dorsal tangential axis (MCdorsal) based on the proximal and distal dorsal limits of the axis segment, and an axis perpendicular to the proximal articular surface (MCprox) were also defined. The geometric axis of the radius was defined using a segment between 28.8 mm and 53.3 mm from the distal articular surface, as reported earlier (Suojärvi et al., 2021b).
A sagittal plane was defined in the analysis software using the scaphopisocapitate relationship (Yang et al., 1997) corresponding to a true lateral radiograph. The plane was automatically acquired by the software for each wrist by placing the most anterior point of the pisiform in the middle 3% of the distance between the most anterior points of the scaphoid and the capitate. The plane was selected to acquire angle values comparable with normal values based on lateral radiographs reported previously. The axes were projected on to this plane and measured against the axis of the radius and each other using the automated software. The software measured the angles to an accuracy of 0.1°. The values are presented to the nearest whole number as this is clinically more appropriate. An angle opening anterior to the axis of the radius was defined as positive and one opening dorsally as negative.
Statistical analysis
Normal distribution of the angle measurement results was confirmed with the Kolmogorov–Smirnov test. The Spearman rank test was used to check for correlation between the alternate axes of each bone. The relationship between alternate axes was further examined with a linear regression model in order to define equations for approximating one axis based on another in a particular bone. Linear regression was also used to assess the relationship between the capitate (Cgeom) axis and the middle metacarpal (MCdorsal) axis to investigate the validity of the practice of using the angle between the radius and the middle metacarpal as a substitute for the radiocapitate angle (Larsen et al., 1991b; Nakamura et al., 1989). Intraclass correlation coefficient (ICC) values were calculated from the angle values in the 20 wrists that were imaged twice. Association of age with the measured values was checked with the Kurskal–Wallis H-test and Student’s t-test was used to analyse the effect of sex, handedness and the imaged side.
As the imaged wrists were not fixed in a device, the results showed a range of wrist flexion–extension, defined as the angle between the radius and the dorsal margin of the middle metacarpal in the sagittal plane (Koh et al., 2013), and a range of radial or ulnar deviation, defined as the angle between the radius and the middle metacarpal in the coronal plane. The images were placed in three groups for extension/flexion and three groups for radial/ulnar deviation. One-way analysis of variance (ANOVA) tests were used to examine differences between the respective groups. Wrists with over 10° of flexion or extension (represented by the RMCdorsal angle; n = 23) or 10° deviation in either direction (represented by the RMCgeom angle projected on to the coronal plane; n = 9) were excluded as probable outliers, with groups that were too small for reliable statistical assessment.
A p-value of <0.05 was considered significant; 95% confidence intervals were used.
Results
Normal values (preferred axes).
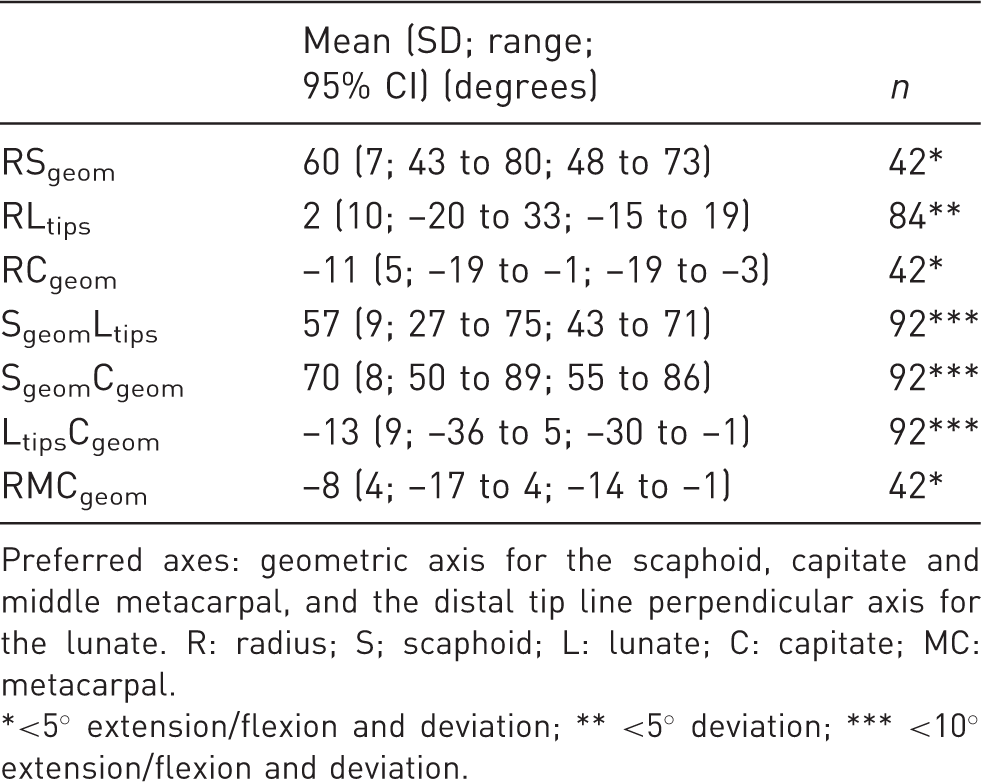
Preferred axes: geometric axis for the scaphoid, capitate and middle metacarpal, and the distal tip line perpendicular axis for the lunate. R: radius; S; scaphoid; L: lunate; C: capitate; MC: metacarpal.
<5° extension/flexion and deviation; ** <5° deviation; *** <10° extension/flexion and deviation.
Extension/flexion and radial/ulnar deviation distributions.
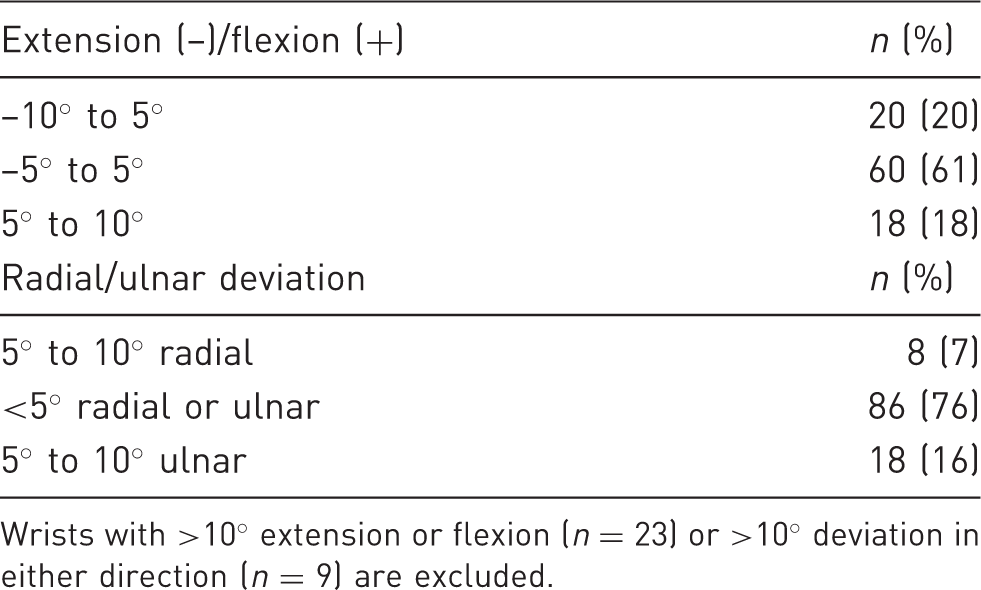
Wrists with >10° extension or flexion (n = 23) or >10° deviation in either direction (n = 9) are excluded.
The ANOVA for flexion/extension showed a statistically significant difference between the groups for the radioscaphoid (RS) and radiocapitate (RC) angles with p-values between <0.001 and 0.01 depending on the axis variants used. Lunocaptitate (LC) angles presented mixed results, with some axis combinations showing significant differences but most did not. No difference was shown in the radiolunate (RL) and scapholunate (SL) angles, except RLgeom (p = 0.02) and SL-angles based on Lprox (p-values between 0.01 and 0.03). The ANOVA for radial/ulnar deviation showed a statistically significant difference for RS and RC angles (p-values between <0.001 and 0.04) and the RLtips (p = 0.01) and RLplateus (p = 0.01) angles. No significant difference was seen for the rest of the angles except SL angles based on Lgeom (p-values between 0.01 and 0.05). The groups with 5°–10° in both extension/flexion and radial/ulnar deviation were too small to reliably assess the combined effect of different malpositions on the angles. A significant difference in the ANOVA was interpreted to show that the wrist malposition affects a particular angle by enough to exclude the non-optimally positioned wrists from the normal values for that angle. Normal values are therefore reported for each angle, depending on the axis variants used using either the wrists with <5° extension/flexion and radial/ulnar deviation (n = 42), <5° radial/ulnar deviation (n = 86), or <5° extension/flexion (n = 60). The angles with no significant difference are reported for the wrists with <10° extension/flexion and radial/ulnar deviation (n = 92). The full population (n = 121) is included for comparison in the supplementary material.
The ICC values attained were very high across all axes, signifying minimal variation in the repeated measurements. An ICC value of 1 represents perfect agreement between measurements and 0 represents no agreement. Values above 0.9 qualify as excellent agreement (Koo and Li, 2016). The mean ICC value for RS, RL, RC and RMC angle variants was 0.97 (SD 0.03). The range of ICC values was 0.89–0.999. The only angle not reaching an excellent ICC value was RCprox (0.89; 95% CI: 0.75 to 0.96). Repeat measurements by the analysis software produced a mean error of 1° (SD 1°).
Spearman correlations.
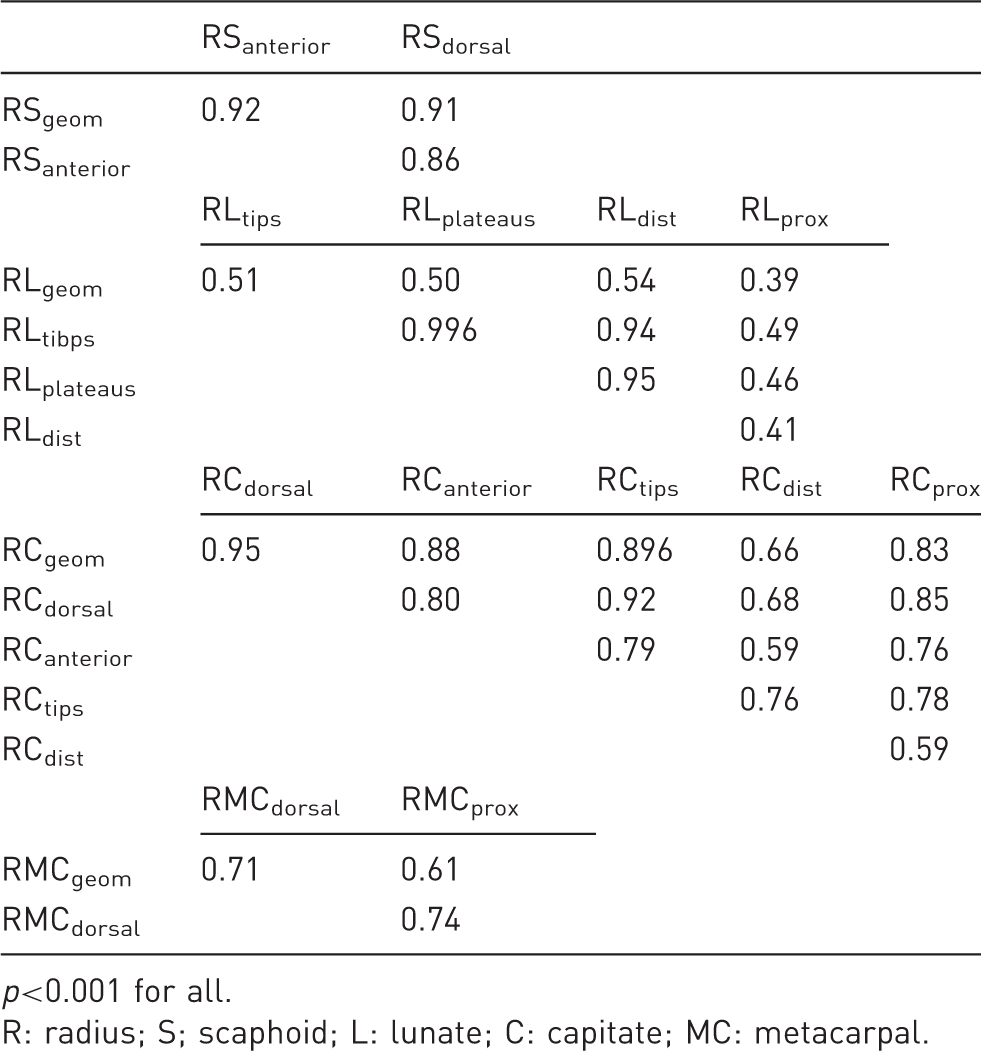
p<0.001 for all.
R: radius; S; scaphoid; L: lunate; C: capitate; MC: metacarpal.
Regression analysis of the relationship of RCgeom and RMCdorsal found a weak correlation of 0.3 and an R2 of 0.08 (p = 0.03) in the wrists with <5° extension/flexion.
No association with age with the measured values was seen. No significant differences for sex, hand dominance or the imaged side were seen, except for all RS angles (p = 0.02), the RLprox (p = 0.03) and the RCtips angle (p = 0.02), which showed slightly smaller values on the left side.
Discussion
Previously reported normal values compared with the results from this study.
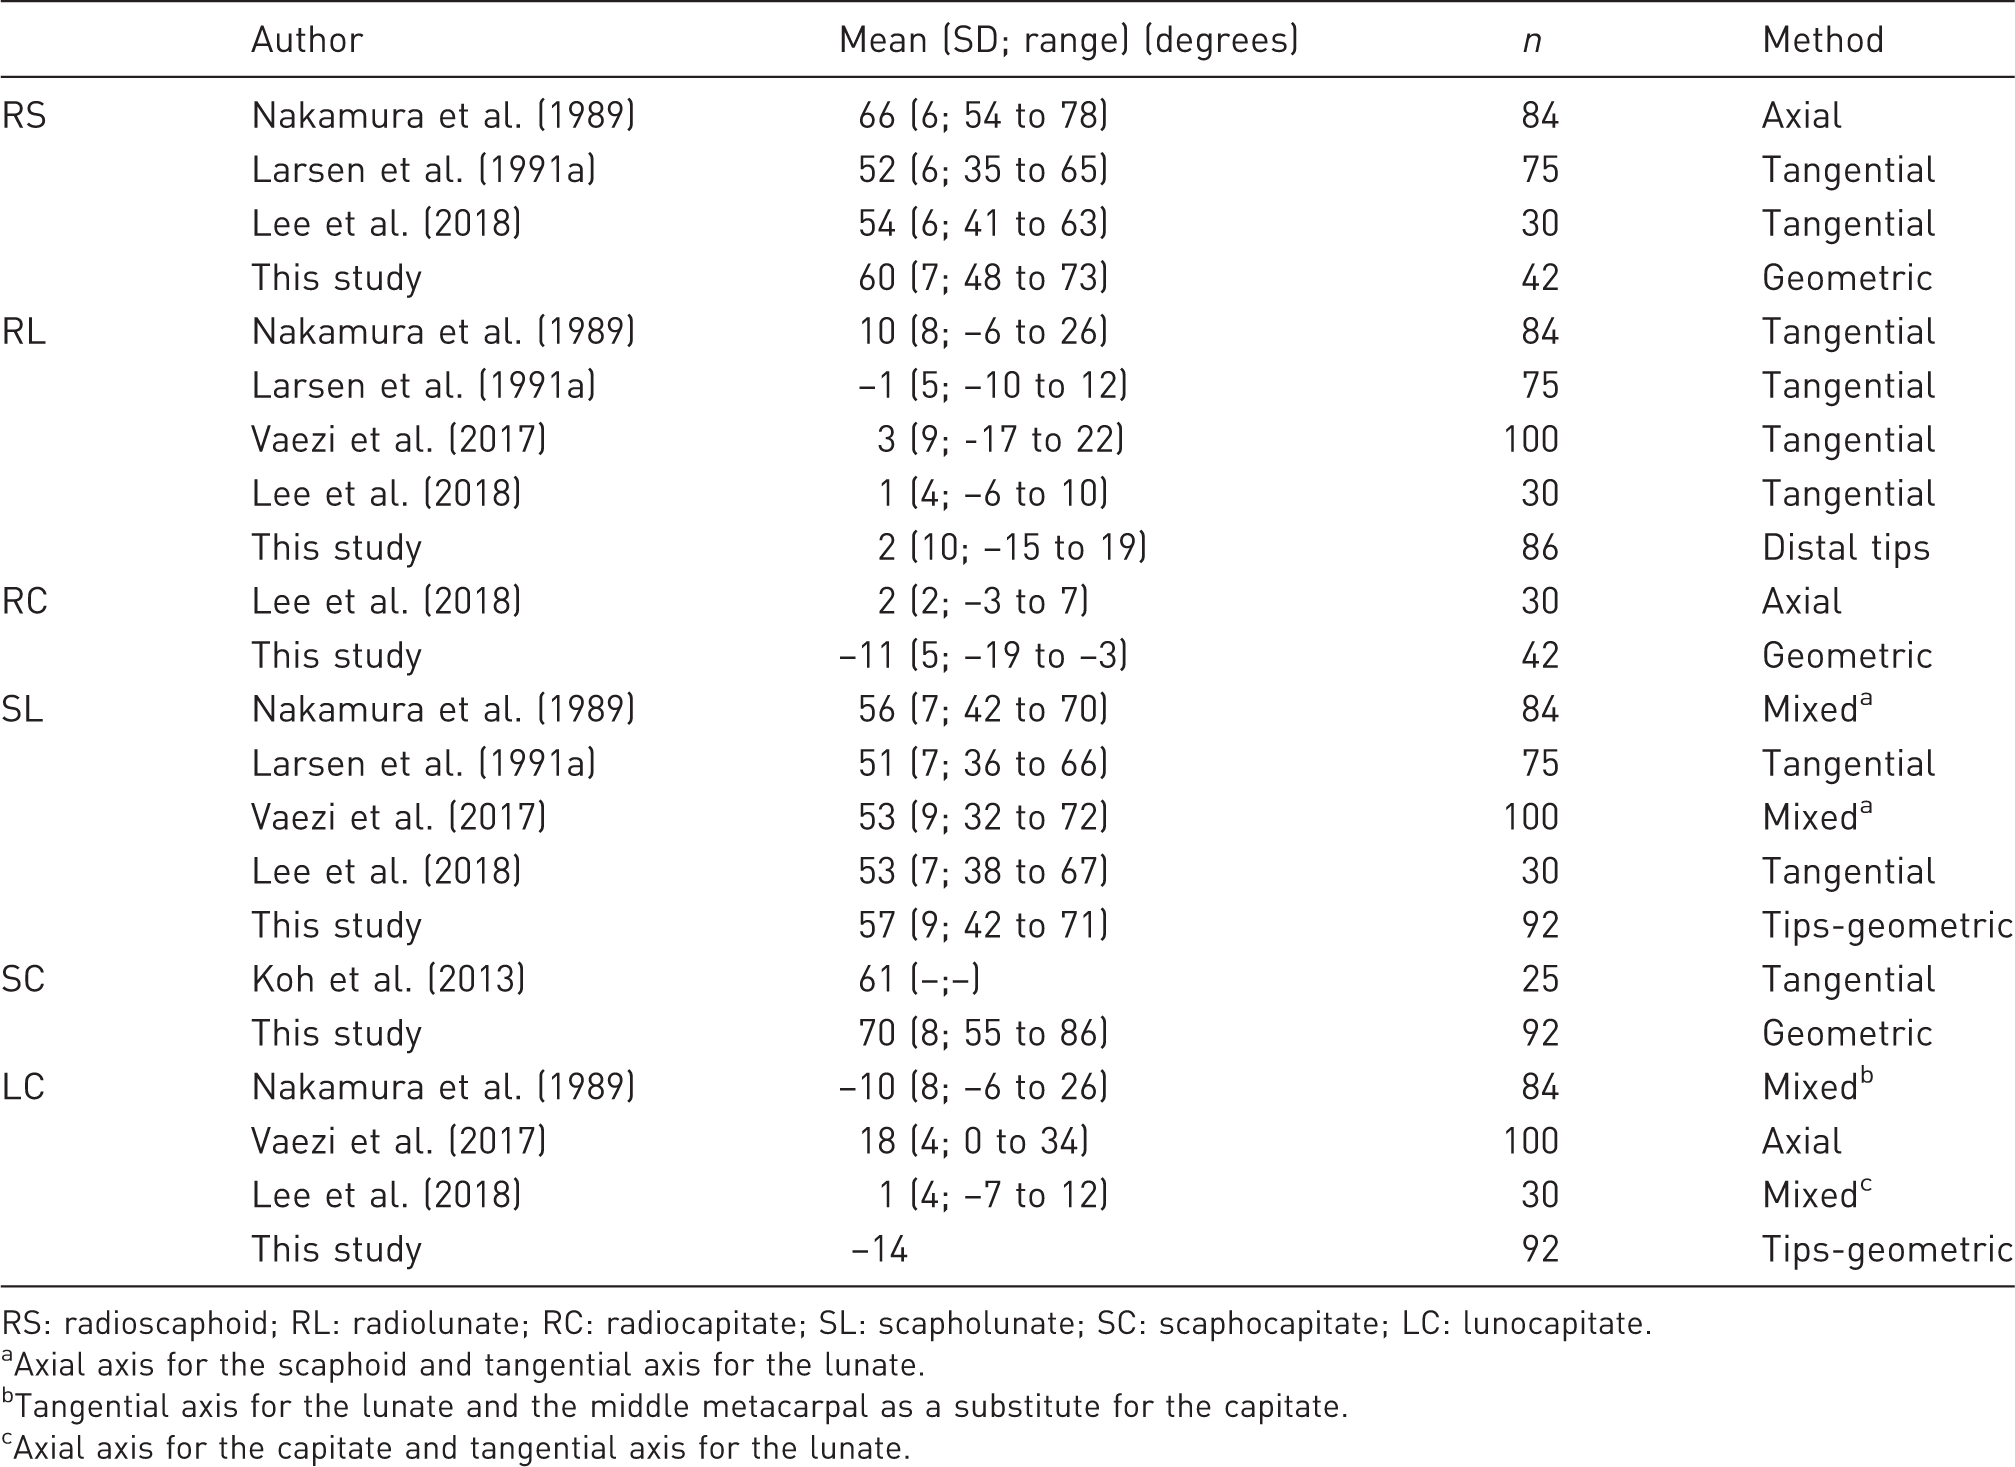
RS: radioscaphoid; RL: radiolunate; RC: radiocapitate; SL: scapholunate; SC: scaphocapitate; LC: lunocapitate.
Axial axis for the scaphoid and tangential axis for the lunate.
Tangential axis for the lunate and the middle metacarpal as a substitute for the capitate.
Axial axis for the capitate and tangential axis for the lunate.
The very high ICC values (ICC mean 0.97) signalled a near perfect agreement between repeat measurements. Recently high inter- and intra-observer agreement (ICC values 0.86–0.99) was documented in measurements of carpal angles made manually both on 3-D CT images and plain radiographs by experienced clinicians following printed instructions (Lee et al., 2018), which represents an optimal scenario for manual measurements. However, in reality, physicians making clinical radiographic measurements may often show higher individual variability (Suojärvi et al., 2021a). Carpal alignment measurements in radiographs are difficult to reproduce even for experienced viewers (Garcia-Elias et al., 1989; Larsen et al., 1991b; Nakamura et al., 1989). Earlier studies speculate that the wide ranges in normal values may be a result of either anatomical variance or measurement inaccuracy or both (Larsen et al., 1991b). The reliability of computer-based analysis is at least similar to and has the potential to minimize the inter- and intra-observer variation in human interpretation. The very high reproducibility of the computer-based 3-D analysis in our study indicates that asymptomatic wrists present with a wide range of carpal angles primarily owing to anatomical variation.
Traditionally the carpal axes have been defined in the lateral radiograph using either the axial (Linscheid et al., 1972) or tangential method (Garcia-Elias et al., 1989), with the latter being more consistently reproducible (Larsen et al., 1991b). In this study we explored several landmarks for the definitions of axes. The geometric axis was chosen as the preferred axis for the normal values as it most accurately represents the 3-D shape of the bone. However, the shape of the lunate produces a geometric axis that is angled significantly more anteriorly than the axes on the lateral radiograph (Figure 1(c)), resulting in angles with normal values quite removed from the traditional lunate angles. Therefore, the lunate axis perpendicular to a line that joining the distal horns, analogous to the classic lunate tangential axis (Sarrafian et al., 1977), was chosen instead. To define wrist extension/flexion we elected to use the dorsal tangential axis for the middle metacarpal as it is in line with established clinical practice. The disadvantage of a tangential axis is that its use is limited to only one projection. Therefore, the geometric axis was used to assess deviation of the middle metacarpal in the coronal plane.
The difference in carpal angle values caused by selecting alternate axes has not been investigated before. Various axis methods have been used to investigate normal populations (Larsen et al., 1991a; Lee et al., 2018; Nakamura et al., 1989; Vaezi et al., 2017). Most of the differences in the angle values produced by different axis variants seen in this study are small and clinically of little consequence, and are also within the margin of error of lateral radiographic assessment. However, the use the middle metacarpal dorsal tangential axis as a substitute for the harder-to-see axis of the capitate (Larsen et al., 1991b; Nakamura et al., 1989), without adjusting the angle values, is contradicted by our study; this is because the correlation between their axes is low near the neutral position, most likely owing to the high anatomical variability in the shape of the capitate. As suggested by Larsen et al. (1991b), it is important to accurately define and report the measurement methods used in studies to ensure correct interpretation.
Alternate carpal bone axes may provide an opportunity to assess carpal alignment in situations where the usual axes are difficult to distinguish, for example, in the presence of severe degenerative changes or postoperatively after a partial wrist fusion. Using the regression equations (Table S5, available online) it is possible to approximate one axis based on another with a clinically acceptable margin of error. Further studies are needed to validate this concept.
The relatively large sample size in this study allowed an indirect assessment of anatomical variability: landmarks with high anatomical variability may lead to masking of the effect of wrist positioning on carpal angles. In our study, the RS and RC angles were readily affected by wrist extension/flexion and radial/ulnar deviation, which is in line with previous radiographic studies (Koh et al., 2013; Larsen et al., 1990). The effect of wrist extension/flexion and radial/ulnar deviation was thus large enough to overcome anatomical variance for these angles. Radial/ulnar deviation seems to affect the RL angle, but only two of the angle variants showed a significant difference in our population. Intercarpal angles were mostly unaffected by malpositioning. As the wrists were imaged in only one position, the effects of extension/flexion and radial/ulnar deviation seen in this study remain inconclusive. Further studies are needed to confirm the effects of wrist position on carpal angles in 3-D imaging.
No clinically relevant association with age, sex, handedness or side was seen in our study. The effects of age, gender and race on carpal indices has been studied and the use of population specific normal databases has been suggested, but the differences caused by different demographics are mostly seen in sizes and lengths of bones and less in angles and ratios (Jafari et al., 2012; Mohammed Ali, 2009; Vaezi et al., 2017). Thus, we believe our database of carpal angles in Finns is representative of the general population.
Our study has limitations. First, the wrists were imaged in the neutral position without a stabilizing device. The participants were instructed to rest their palm on the tray, which resulted in participants leaving a variable space under the distal palmar crease. The ranges of flexion/extension and radial/ulnar deviation were 44° and 27°, respectively. The optimal imaging position (<5° extension/flexion and radial/ulnar deviation) was achieved only in 42 wrists (35%). This demonstrates the difficulty of obtaining exactly positioned images even in a controlled setting when not using a positioning device. This study was not designed to properly assess the effect of wrist positioning on carpal alignment as individual wrists were imaged in only one position. Although statistically significant differences were noted, it is likely that anatomical variance confounds the effects on carpal angles caused by wrist position. Second, this study included only cone-beam CT images of asymptomatic wrists.
Computer-based CT analysis enables highly reproducible and automated assessment of carpal alignment in asymptomatic wrists. In clinical settings, it may be used as a diagnostic aid in carpal injuries and wrist pain, reducing the physician’s time and work demands and minimizing the inter- and intra-observer variation. Further studies are underway to assess carpal alignment in wrist instabilities and degeneration.
Footnotes
Acknowledgements
The authors thank Disior Ltd for developing the software to perform the computer-based analysis and especially Pia Laine for helping with the figures of this article. The authors also thank Timo Pessi for help with the statistical analysis.
Declaration of conflicting interests
The authors declared the following potential conflicts of interest with respect to the research, authorship, and/or publication of this article: E.W. owns stock in Disior Ltd, Helsinki, Finland. The other authors have no conflicts of interest to declare.
Funding
The authors disclosed receipt of the following financial support for the research, authorship, and/or publication of this article: this work was supported by the University of Helsinki and Helsinki University Hospital.
Ethical approval
The ethics committee of Helsinki University Central Hospital (HUS/147/2019) and institutional review board (HUS/913/2019) approved the study.
Informed consent
All volunteers provided written informed consent for their participation.
Supplemental material
Supplemental material for this article is available online.