
Abstract
Data of a prospective longitudinal cohort study including 233 Dupuytren’s patients was used to determine: (1) whether the Unité Rhumatologique des Affections de la Main scale and Michigan Hand outcomes Questionnaire can detect change in hand function due to Dupuytren’s disease progression and to compare their abilities; (2) the concurrent validity, reliability, responsiveness and interpretability of the Dutch Unité Rhumatologique des Affections de la Main. The Unité Rhumatologique des Affections de la Main and Michigan Hand outcomes Questionnaire had comparable measurement properties, and were both able to distinguish participants with disease progression from those without progression (resp. U = 1252.5, p = 0.008, and U = 1086.0, p < 0.001), but only at a group level. Individual cases of progression could not be detected using these outcome measures, as indicated by the fact that the smallest detectable change was larger than the minimal important change, and area under the receiver operating curve (AUC) values of 0.75 for Michigan Hand outcomes Questionnaire and 0.67 for Unité Rhumatologique des Affections de la Main.
Introduction
There are many patient-reported outcome measures (PROMs) used for patients with Dupuytren’s disease (Ball et al., 2013). The Disability of Shoulder, Arm and Hand (DASH) questionnaire is the one most frequently used, followed by the Michigan Hand Questionnaire (MHQ) (Ball et al., 2013). These PROMs are region-specific, evaluating functional consequences due to hand and arm problems in general. Thus, whether the DASH and MHQ are specific enough to be used for patients with Dupuytren’s disease is unclear. Therefore, a new disease-specific PROM was developed especially for use in this patient group, called the Unité Rhumatologique des Affections de la Main (URAM) scale (Beaudreuil et al., 2011). Despite possible objections, all these PROMs have been tested in Dupuytren’s populations (Beaudreuil et al., 2011; Forget et al., 2014; Schoneveld et al., 2009; van de Ven-Stevens et al., 2015). The DASH was found to be unsuitable for application in this population since it lacked validity, discriminative ability and interpretability (Forget et al., 2014; Rodrigues et al., 2017). The MHQ, which was tested in a Dutch Dupuytren’s population that had undergone percutaneous needle fasciotomy, had adequate construct validity and test–retest reliability (Schoneveld et al., 2009). The URAM was found to have adequate internal consistency, test–retest reliability and responsiveness, but this was determined by the developers themselves (Beaudreuil et al., 2011). The applicability of this PROM has been questioned by Rodrigues et al. (2015). Their main criticism was that the URAM fails to assess many activities in which their British population of Dupuytren’s patients report functional problems, such as putting on gloves or problems with finger hooking, and therefore, the URAM lacks content validity. Conversely, they used the URAM in a recent study and concluded that it was responsive to detect improvement after treatment and that it had acceptable interpretability (Rodrigues et al., 2017).
Although the MHQ and URAM have been tested in a Dupuytren’s population undergoing treatment (Beaudreuil et al., 2011; Schoneveld et al., 2009), it is not known if these PROMs can detect changes in hand function due to natural disease progression. Change due to spontaneous disease progression is possibly more subtle compared with change after treatment. Hence, the aim of this study was to determine whether the URAM and MHQ are able to detect change due to natural disease progression and to compare their abilities. A secondary aim of this study was to determine the concurrent validity, reliability, responsiveness and interpretability of the Dutch language version of the URAM.
Patients and methods
Participants
Data for 233 adults with Dupuytren’s disease, who were included in a cohort study on disease course (Lanting et al., 2016), were used in the current study. Exclusion criteria were upper extremity problems that are likely to influence the outcome, and more missing values than allowed by the questionnaire instructions. All participants gave written informed consent in accordance with the Helsinki Declaration. The institutional ethics committee approved this study.
Outcome measures and instruments
Clinically important disease progression was defined as change in total passive extension deficit (TPED) >15° in one finger, since previous research has shown that the TPED has a maximum measurement error of 15° per finger (Broekstra et al., 2015). TPED was measured using a finger goniometer, except for the thumb. The thumb was not measured, as contractures that are present in the first web space are not registered in the TPED measure of the thumb.
The instruments used to measure self-reported hand function were the URAM (Beaudreuil et al., 2011) and MHQ (Chung et al., 1999). The URAM covers one domain (i.e. functional outcome) containing nine items, which can be awarded 0 to 5 points. The overall score is calculated by summation of the nine responses, which can range between 0 and 45 points and where zero points indicate no disability. The original French URAM was translated to Dutch (see Appendix S1 available online), according to the linguistic validation guidelines of mapi (Acquadro et al., 2012). In case of bilateral disease, the URAM was filled out for the most severely affected, untreated hand.
The MHQ is a questionnaire developed to measure hand function and related outcomes of patients with various hand conditions. It contains 57 items that cover six different domains: overall hand function, activities of daily living (ADL), work-related activities, pain, aesthetics and satisfaction with hand function. Except for the domains of work and pain, each domain is answered for both hands separately. Each item can be awarded 1 to 5 points. Subscores per domain are calculated by reversing the scores on negatively stated items (e.g. How often were you unable to work?), and then normalized to generate a score between 0 and 100. Higher overall scores represent a better outcome. It is also possible to calculate an overall score for each hand separately. In our analyses, we used the overall score for the most severely affected untreated hand in instances of bilateral disease.
Study design and procedures
The measurements took place in the context of a prospective cohort study with repeated measures on natural disease course of Dupuytren’s disease (Lanting et al., 2016). During all measurements TPED was measured and the Dutch language version of the MHQ was completed. When the URAM became available, this PROM was used temporarily parallel to the MHQ. Later on, the URAM was used instead of the MHQ (Figure 1). Since for both PROMs two measurements (T1/T1a and T2) were available with an interval of 6 to 24 months, disease progression could be determined. For the URAM, there was an extra measurement (T1b) 2 to 4 weeks after the first measurement, to determine the test–retest reliability. A subsample of 53 participants took part in this additional measurement. This number is large enough to obtain an agreement of at least 80% with a maximum confidence interval (CI) of 0.20 with 0.90 probability assurance (Zou, 2012).
Study design.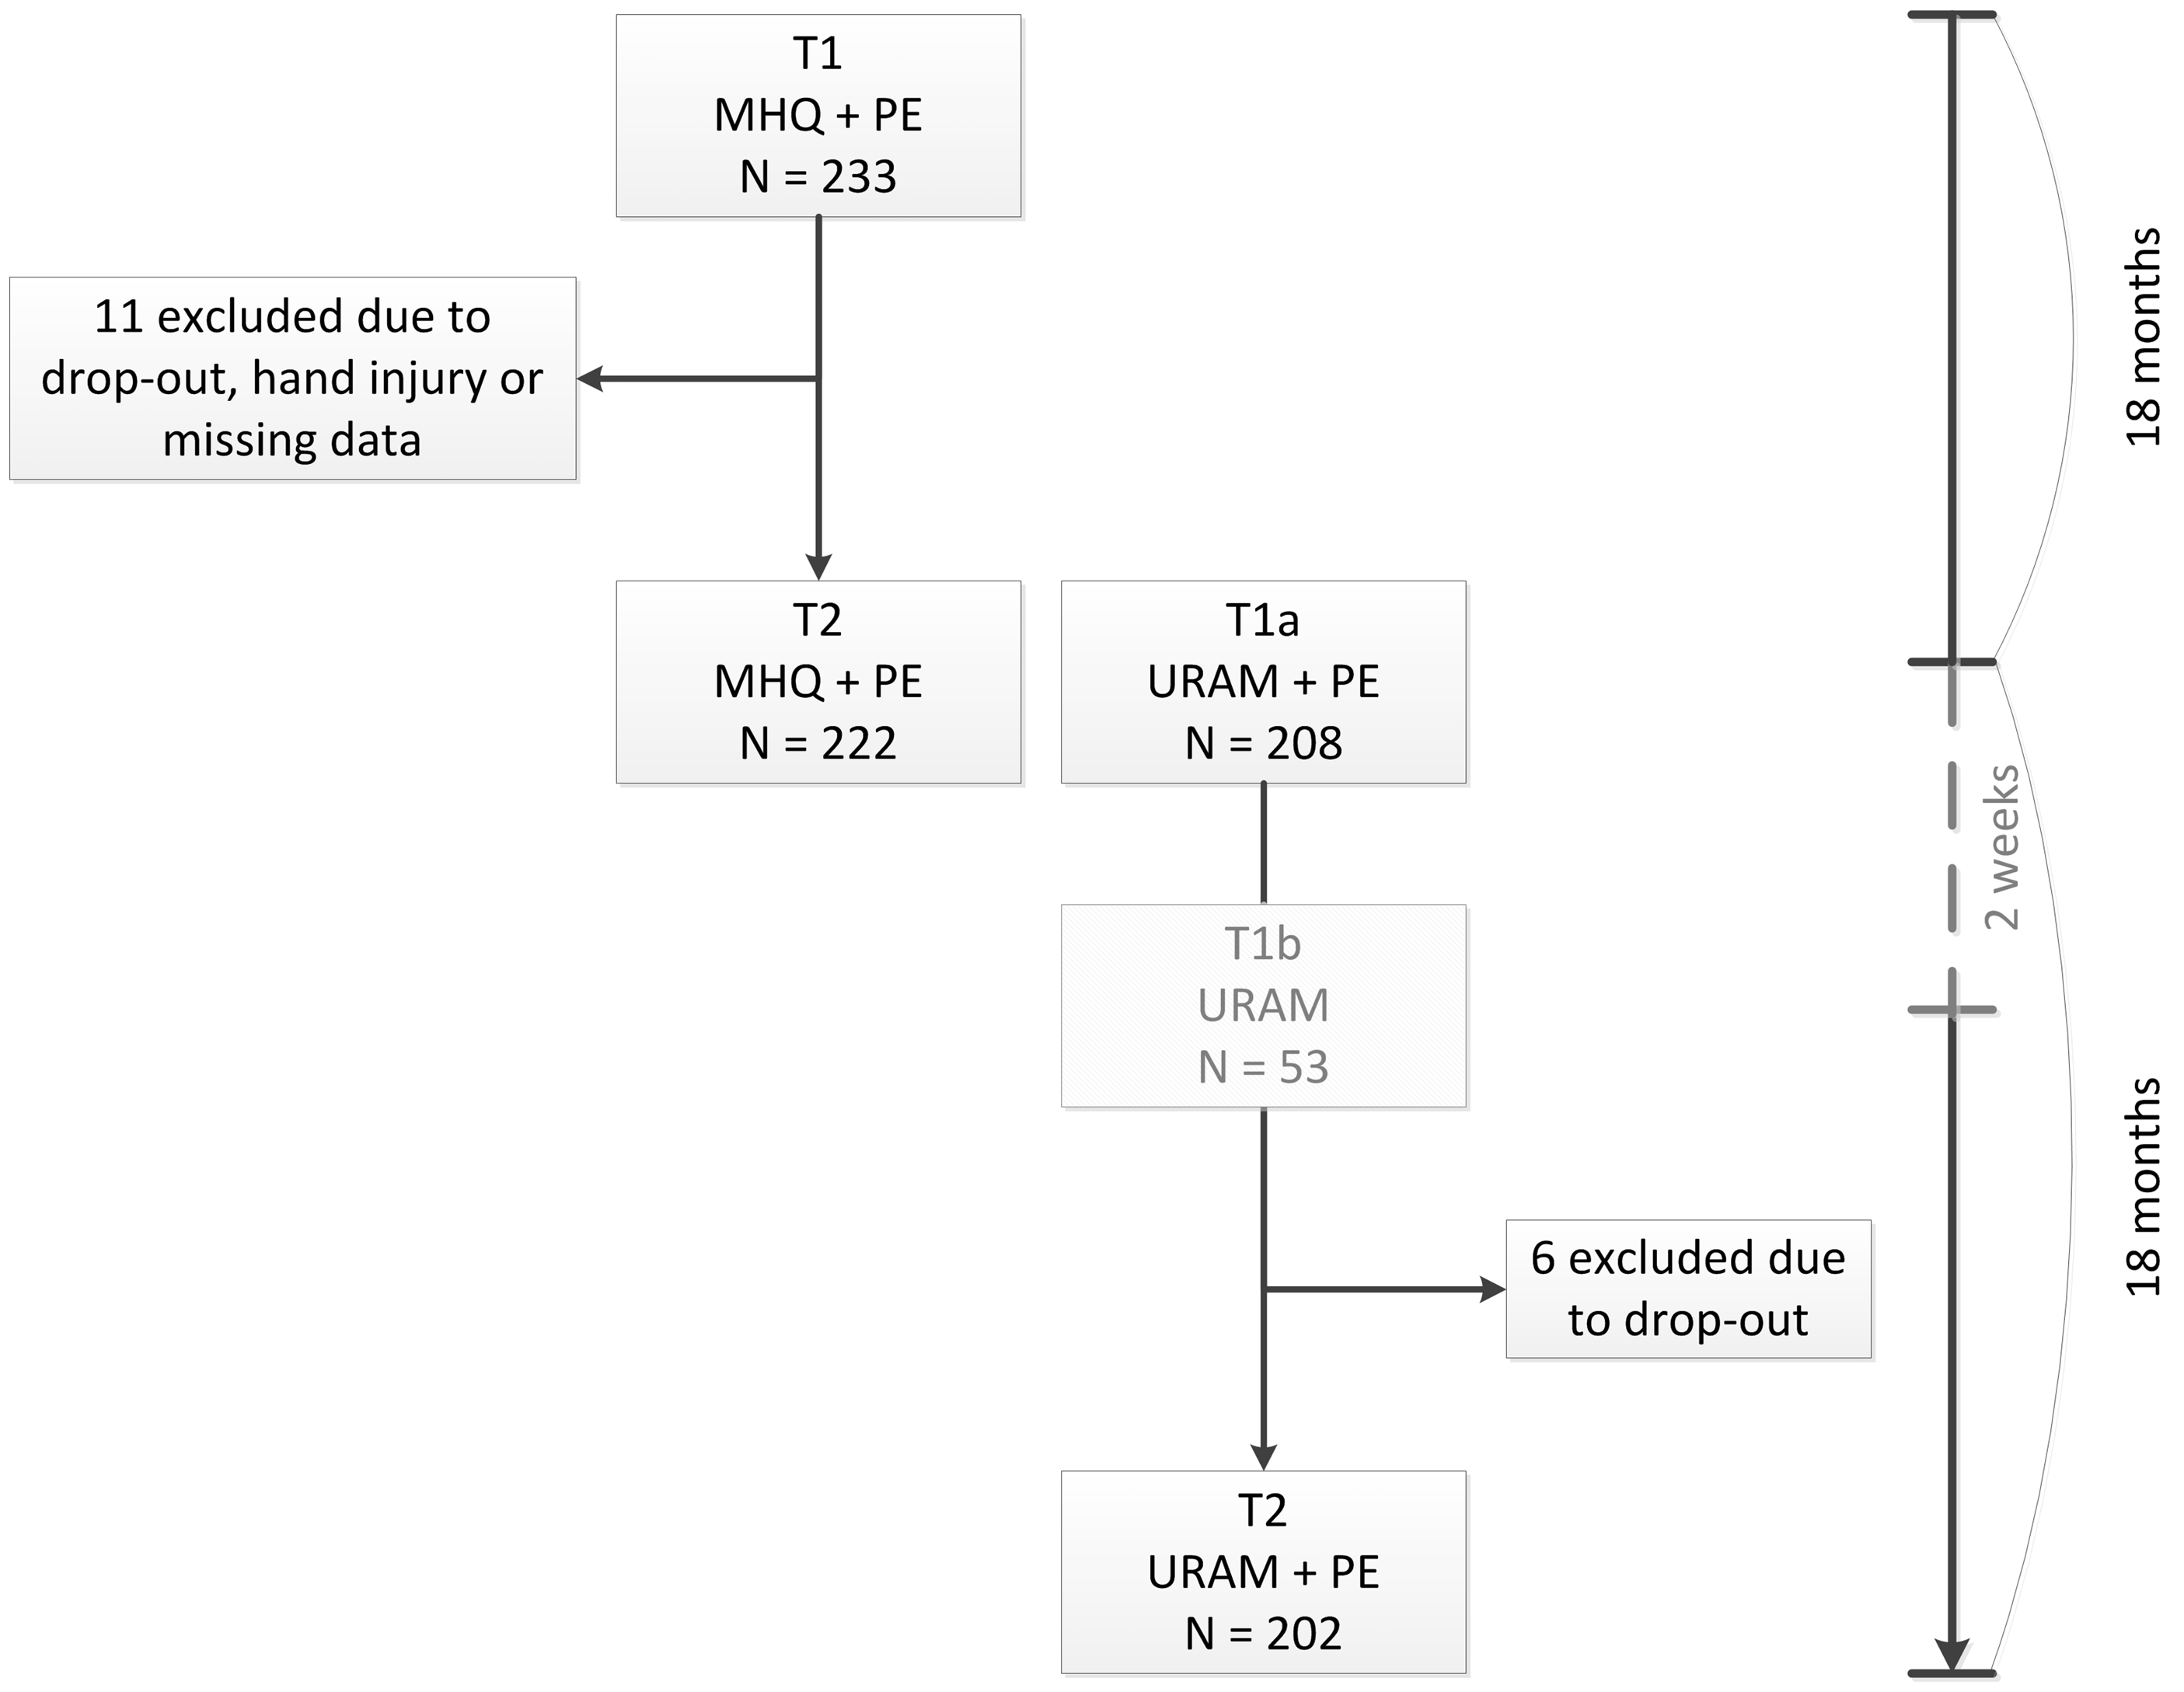
Statistical analyses
Concurrent validity
Concurrent validity indicates the extent to which the scores of an instrument are related to the scores of another instrument measuring a similar construct. This was assessed for the URAM by calculating Spearman’s correlation coefficient between the scores of the URAM at time point T1a and MHQ at time moment T2 (see Figure 1). After Fisher’s z-transformation (Fisher, 1915), 95% CIs were determined.
Internal consistency, reliability and measurement error
The internal consistency is a measure that indicates how well the items of the instrument that measure the same construct are interrelated. The URAM covers one domain, so the internal consistency was calculated for all items using Cronbach’s alpha. The internal consistency for the MHQ was calculated for each domain separately. For the pain domain, the internal consistency was calculated after excluding those who answered ‘Never’ on question 1 (i.e. How often did you have pain in your hand(s)/wrist(s)?). Cronbach’s alpha was calculated at both measurement time (T1a and T2), including 95% CIs based on F-tests. A Cronbach’s alpha between 0.70 and 0.95 was considered good (Terwee et al., 2007).
As a measure of test–retest reliability, the intra-class correlation (ICC) for agreement was used. This indicates whether the questionnaire provides the same results when it has been filled out twice in absence of a real change. A one-way random-effects model, with a random effect for participant

A 95% CI on de ICCagreement was determined with the beta-approach (Demetrashvili et al., 2016). An estimated value of 0.70 or higher was considered good (Terwee et al., 2007).
The standard error of measurement (SEM) is a measure to indicate the absolute measurement error in the scale. It was determined by calculating

Responsiveness
The responsiveness indicates how well the instrument is able to detect a change over time. To determine this, participants who progressed were separated from those who did not progress, according to the definition as stated earlier. The URAM and MHQ change scores (T2–T1) of the two groups were tested for differences using a Mann–Whitney U test to determine whether the PROMs were able to detect progression at a group level. To evaluate their ability to detect progression at an individual level, the area under the receiver operating curve (AUC) was determined. Furthermore, boundary (ceiling or floor) effects were determined as the percentage of participants having extension deficits in the fingers, but who report the best possible score. Large boundary effects indicate that the instrument is not responsive in this particular population. Due to the fact that lower URAM scores represent better outcomes, the best possible score is the minimal score (floor effects) for the URAM, while it is a maximal score (ceiling effects) for the MHQ.
Interpretability
“Interpretability is the degree to which one can assign qualitative meaning to an instrument’s quantitative scores or change in scores” (Mokkink et al., 2010). Therefore, the minimal important change (MIC) was calculated, which is the smallest change score that can be considered as relevant. It was derived from the reveiver operating curve (ROC) at the score having the largest sensitivity and specificity. From the ROC analysis, the corresponding change score was derived.
For all hypothesis tests a significance level of 5% was applied.
Results
In the first 2 years of the study the MHQ was used, and 233 participants filled out the MHQ at T1 (Figure 1). Eleven participants were excluded, so the analyses on responsiveness and interpretability of the MHQ were done using data of 222 participants, because for these analyses a change over time should be determined. Then the URAM was introduced. So, T2 of the MHQ and T1a of the URAM occurred simultaneously, and 199 patients filled out both PROMs at this visit. The URAM data of 208 participants was available at T1a. Fifty-three participants took part in the additional URAM measurement (T1b). Thereafter, six participants withdrew from participation, so at T2, 202 participants filled out the URAM. So, analyses on the responsiveness and interpretability were done using data of 202 participants. A total of 193 participants filled out both PROMs on both measurements.
Characteristics of the participants, presented for those who showed clinically important progression and those who did not show clinically important progression, for each questionnaire separately.
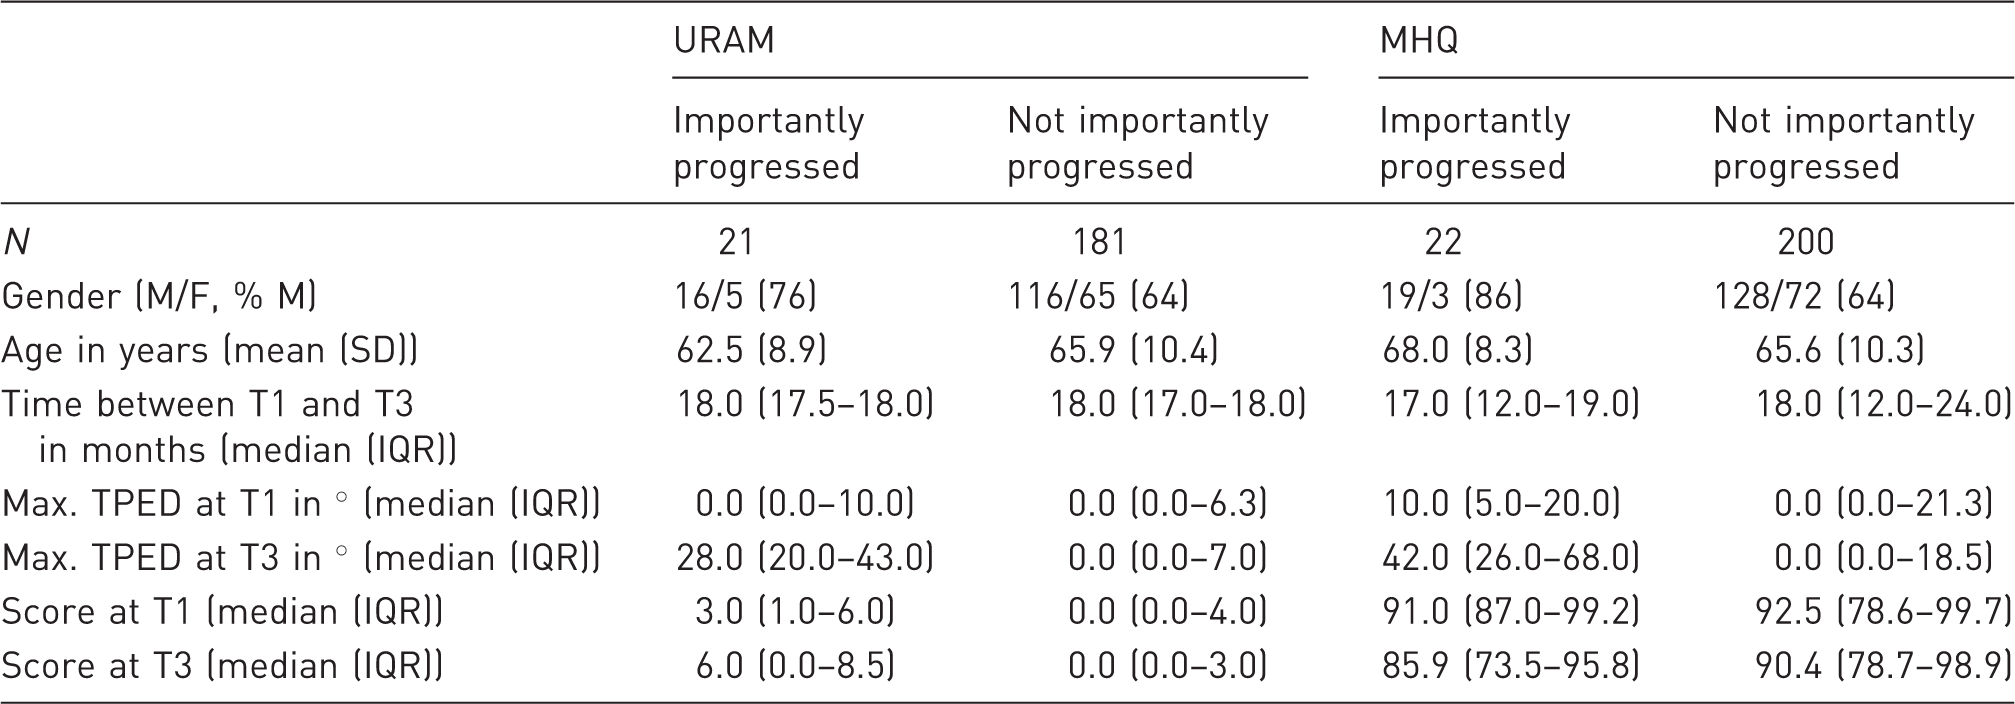
URAM: Unité Rhumatologique des Affections de la Main; MHQ: Michigan Hand Questionnaire; N: number of participants; M/F: male/female; SD: standard deviation; IQR: interquartile range; TPED: total passive extension deficit.
URAM
Concurrent validity
The URAM and MHQ scores showed a strong correlation (ρ = −0.65 [–0.72; –0.56], p < 0.001). This correlation is negative, since for the URAM a lower score represents better function, while for the MHQ a higher score represents better function.
Internal consistency, reliability and measurement error
Measurement properties of the URAM and MHQ, and number of participants included in each analysis.
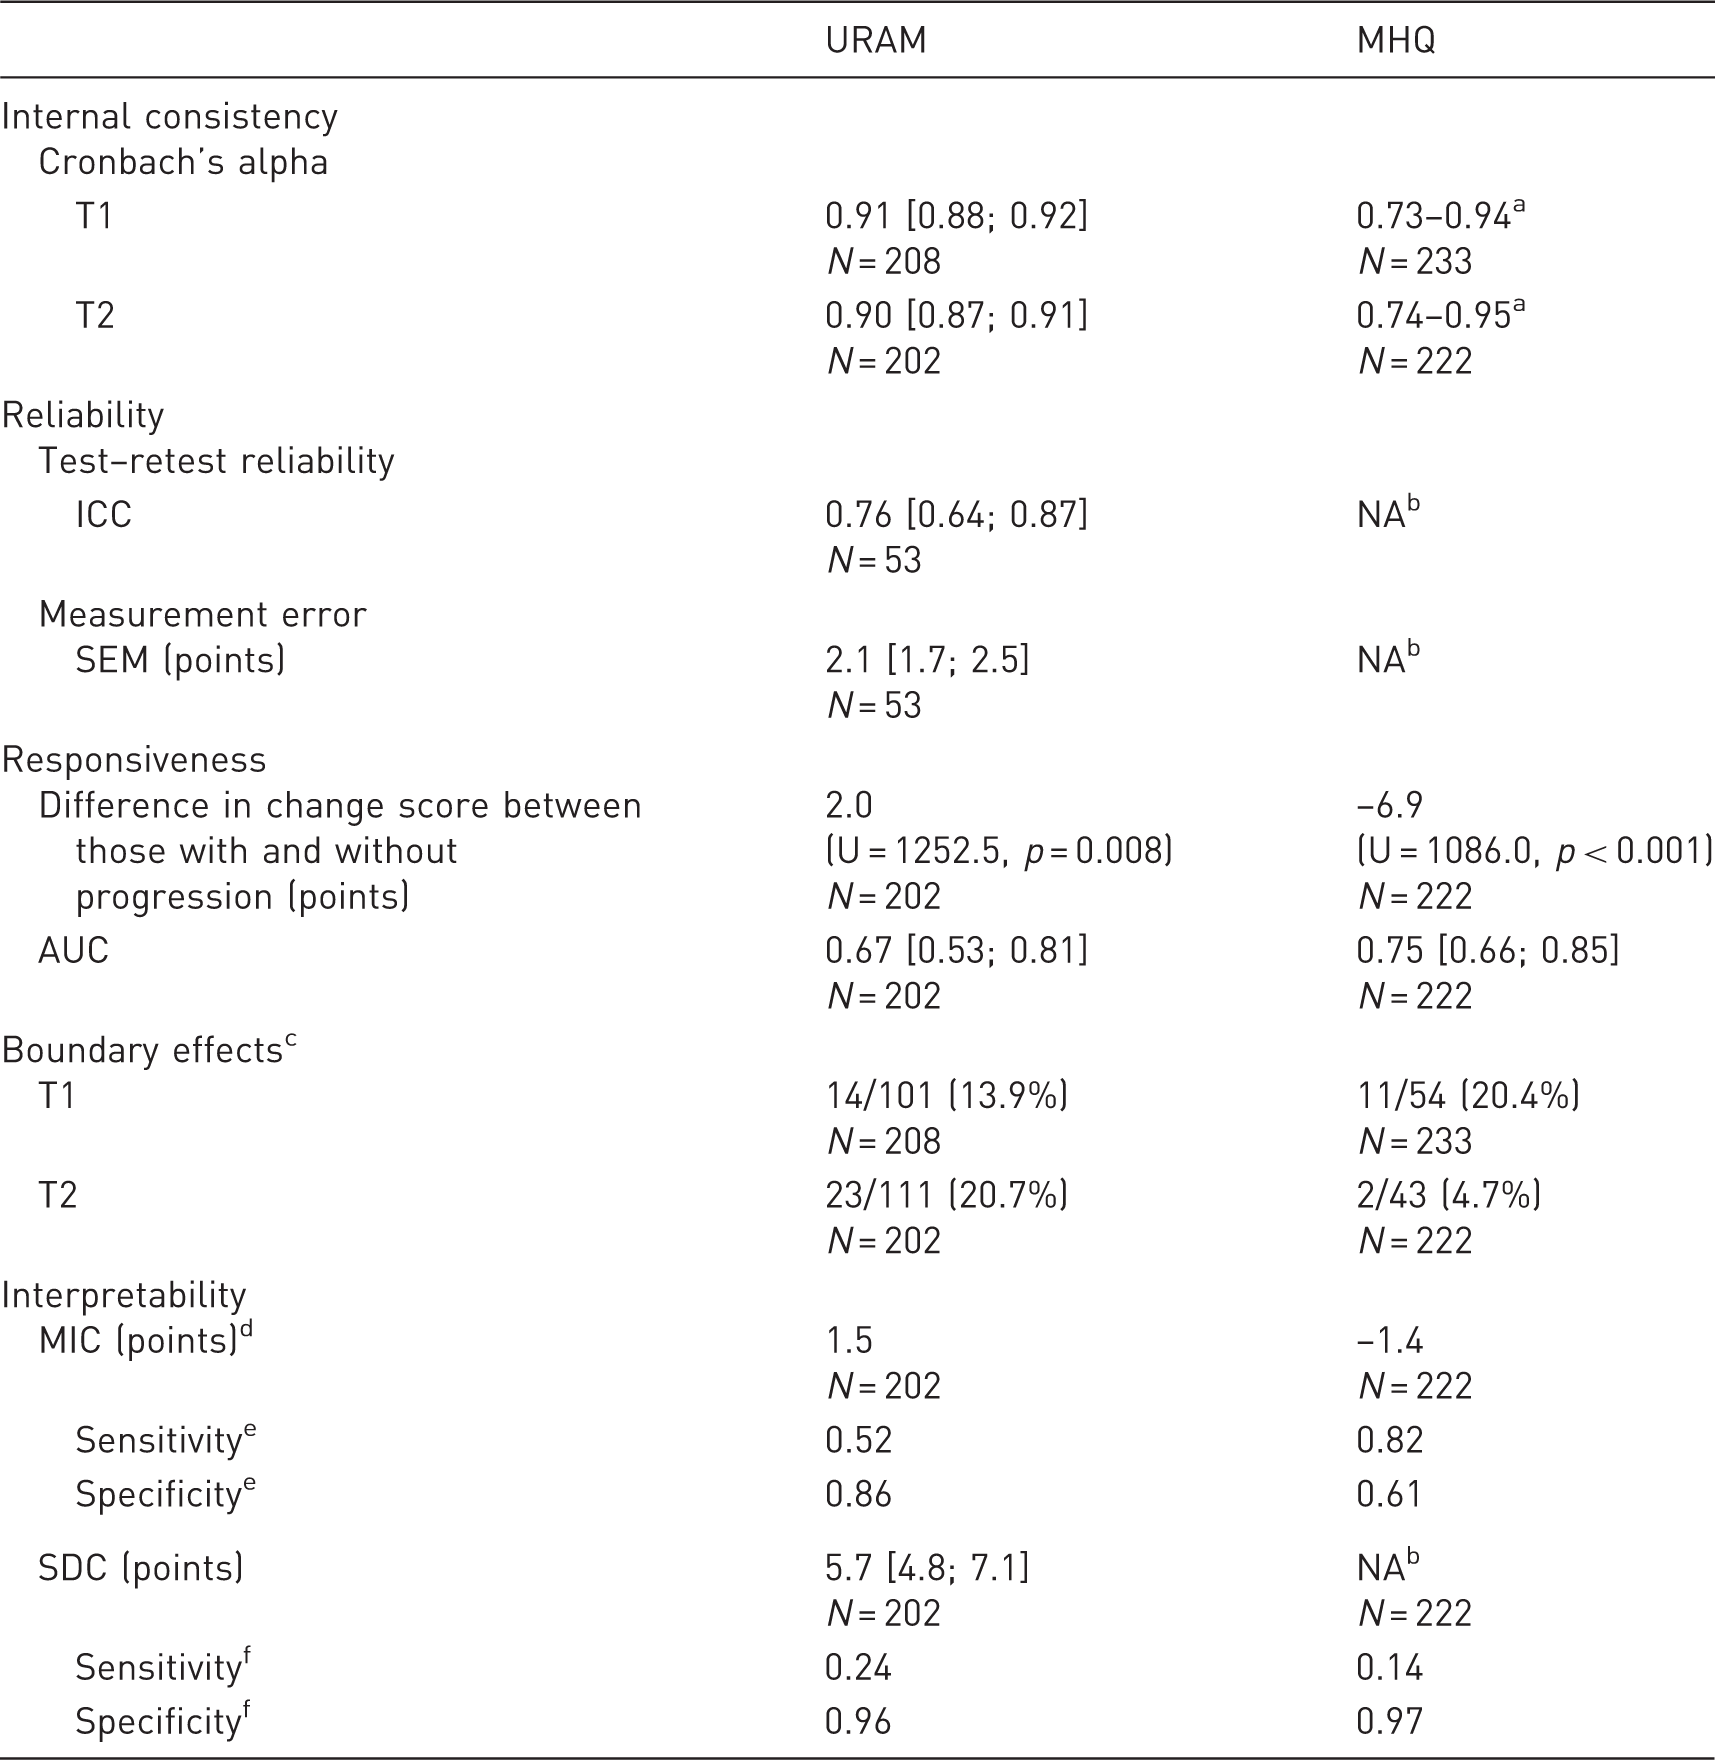
URAM: Unité Rhumatologique des Affections de la Main; MHQ: Michigan Hand Questionnaire; ICC: intra-class correlation; SEM: standard error of measurement; AUC: area under the receiver operating curve; MIC: minimal important change; SDC: smallest detectable change.
As the internal consistency for the MHQ was determined for each domain separately, a range is presented here. For full results, see Table 3.
This was not determined in the current study.
Boundary effects were determined as the number of participants having contractures, among those reporting the best possible score.
MIC for MHQ is negative, as a decrease in score indicates a decrease in function.
Sensitivity and specificity when MIC is used as cut-off.
Sensitivity and specificity when SDC is used as cut-off.
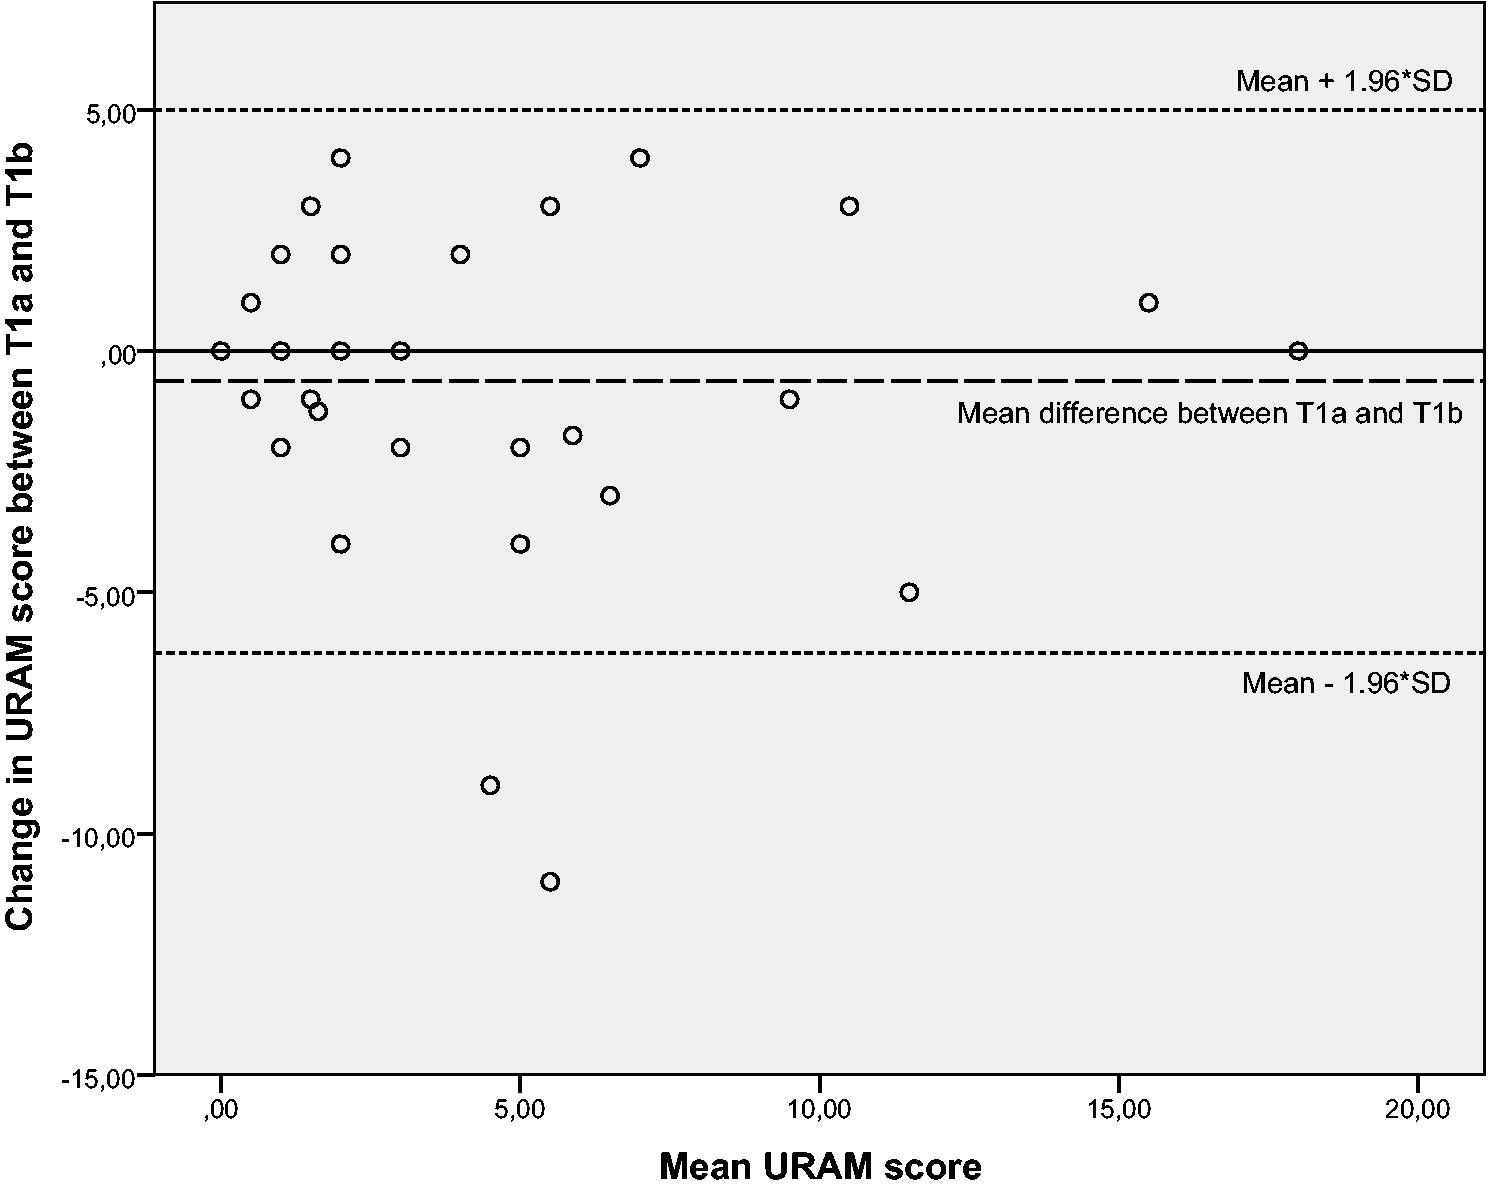
Bland–Altman plot of the mean URAM score and change score between T1a and T1b. The dashed line represents the mean difference, and the dotted lines represent the upper and lower prediction limits of agreement.
Responsiveness
The median change score in the group that showed clinically important progression was larger than the change score in the group that showed no clinically important progression (Table 1). This indicates that the URAM is able to discriminate between the groups without and with disease progression. At an individual level, the URAM has difficulty making this distinction, as indicated by an AUC of 0.67 [0.53; 0.81]. At T1, the maximum TPED in 14 participants over 10 fingers ranged between 4° and 35°, although they reported no functional problems defined by an URAM score of 0 (floor effects, see Table 2). At T2, the maximum TPED in 23 participants ranged between 6° and 66°, while they reported no functional problems in the URAM (floor effects, see Table 2). None of the participants reported the worst possible score of 45, neither at T1 nor at T2.
Interpretability
We determined the optimal cut-off point (MIC) for disease progression, which is presented in Table 2. The SDC was larger than the MIC. When using the SDC as cut-off, the sensitivity decreased, but the specificity increased.
MHQ
Internal consistency, reliability and measurement error
Internal consistency (Cronbach’s alpha) presented for each domain of the MHQ, separately for the left and right hand at T1 and T2.
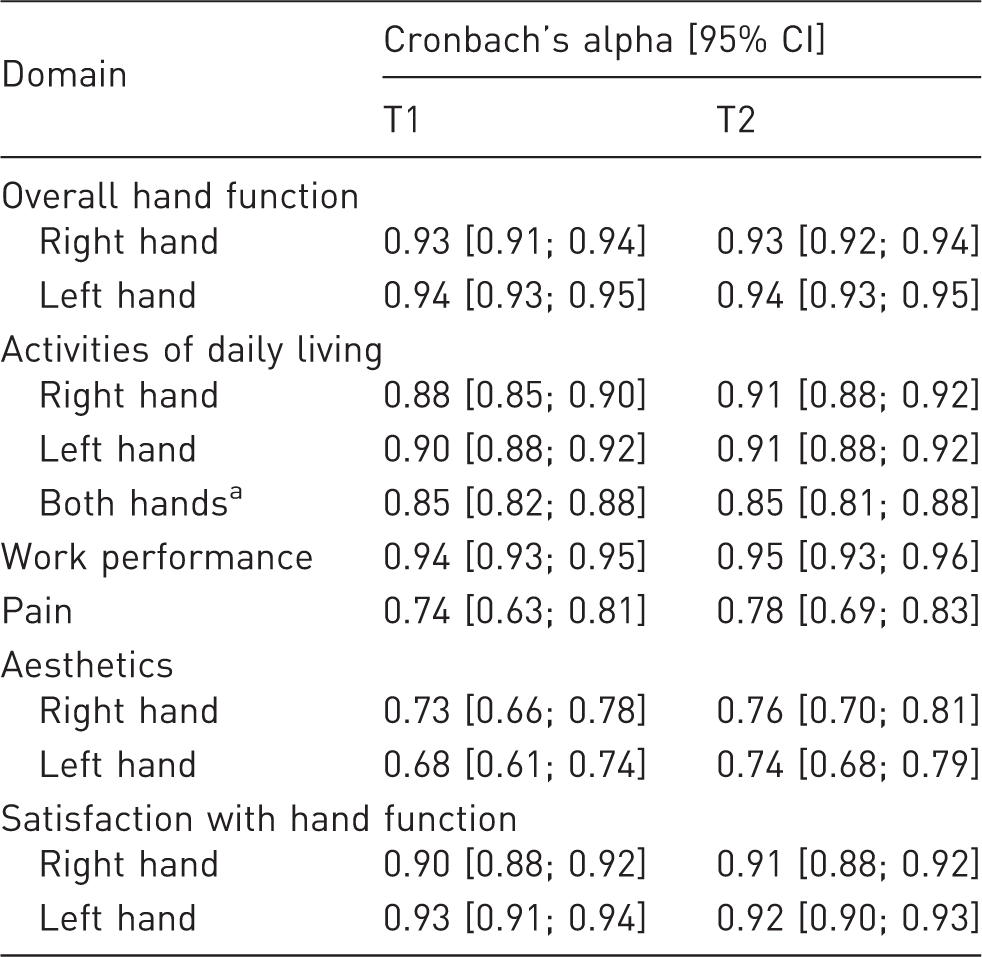
This is a separate part of the questionnaire, in addition to the ADL part for the right and left hand. ADL: activities of daily living.
Responsiveness
The change score in the group that showed clinically important progression was lower than the change score in the group that showed no clinically important progression (Table 2). This indicates that the MHQ can discriminate between those with and without disease progression at a group level. The AUC was adequate, namely 0.75 [0.66; 0.85] (see Table 2). At T1, the maximum TPED in 11 participants over 10 fingers ranged between 5° and 25°, although they reported no functional problems defined by an MHQ score of 100 (ceiling effects, see Table 2). At T2, the maximum TPED in two participants was 25° and 52°, while they reported no functional problems in the MHQ (ceiling effects, see Table 2). None of the participants had the worst possible score of 0, neither at T1 nor at T2.
Interpretability
The MIC for progression is presented in Table 2. The SEM and SDC for the MHQ were already determined by others (Schoneveld et al., 2009). The MIC was smaller than the SDC. When the SDC was used as cut-off, the sensitivity decreased, while the specificity increased.
Discussion
This study shows that the URAM and MHQ are able to detect Dupuytren’s disease progression at a group level but not on an individual level. This can be concluded from the results on responsiveness. The AUC of the URAM was 0.67, and the SDC was larger than the MIC. The results on responsiveness of the MHQ are not fully consistent as the AUC was considered adequate (Terwee et al., 2007), but the MIC that was found in this study was much smaller than the SDC reported by Schoneveld et al. (2009). This suggests that both PROMs cannot detect progression at an individual level. However, at group level, the change scores of the group that showed clinically important progression differed significantly from the group that did not show clinically important progression, in both PROMs.
Responsiveness of the URAM is impaired by scale boundary effects, as 14% (T1a) and 21% (T2) of the participants who had extension deficit still reported the minimal score. The MHQ suffered less from boundary effects (20% (T1) and 5% (T2). The URAM and MHQ were only used parallel during one moment in time, which explains the large differences in boundary effects between the two PROMs. Furthermore, the smaller scale boundary effects of the MHQ might be a logical consequence of the length of this questionnaire (57 vs. 9 items in URAM). So, with the MHQ it is less likely to get the maximal score. However, the length of the MHQ can also be considered as a drawback. Many participants complained about the length of this questionnaire and the difficulty of some double-negative items. Some refused to fill out the MHQ repeatedly, while others were not able to fill it out independently. A brief version of the MHQ is also available (in English) (Waljee et al., 2011) and might solve this problem. It will be interesting to evaluate its ability to detect disease progression compared with the URAM. Additionally, reverse-worded items in the MHQ were frequently filled out incorrectly (e.g. if a participant responds to have no functional restraints in the positive items and responds to have maximal restraints in the negative items).
We further demonstrated that the internal consistency of the URAM was good, and it was higher in the current study than reported by the developers (Beaudreuil et al., 2011). This might be caused by the difference in populations, as the majority of the participants in our study did not have any functional complaints, as indicated by a median score of zero. In the study of Beaudreuil et al. (2011) the included participants were patients undergoing treatment, and higher URAM scores were reported.
The test–retest reliability of the URAM was 0.76 [0.64; 0.87], which is lower than previously reported values of 0.97 [0.94; 0.98] (Beaudreuil et al., 2011) but still considered good (Terwee et al., 2007). The test–retest reliability of the MHQ was not determined in the current study, but Schoneveld et al. determined that it is 0.89 (Schoneveld et al., 2009).
This study has some limitations. First of all, we used the maximal TPED as the cut-off variable to determine progression. We chose this instead of the sum of TPEDs in one hand, because we assumed that one finger with a large TPED will result in equally large functional restraints compared with two or more fingers with a large TPED. The two variables were highly correlated (r = 0.96, p < 0.001), so it is likely that the results would be similar when the sum of TPEDs was used as the cut-off. We repeated the analyses using the sum of TPEDs as the cut-off, and similar results were found.
Second, by choosing change in maximal TPED of 15° as the cut-off value for the definition of progression, participants with a change in TPED ≤ 15° in all fingers would end up in the same group as the participants without any contractures at both measurements. It is likely that the participants with contractures would report different PROM scores than those without.
Third, it is known that TPED measurements are only weakly correlated to the PROM scores that patients report (Budd et al., 2011; Degreef et al., 2009; Jerosch-Herold et al., 2011). However, the reference variable to discriminate those with and without progression remains an arbitrary choice, with each having advantages and limitations. As TPED has a known measurement error, derived from the same population, we chose for TPED to determine progression.
Lastly, the time between T1 and T2 was short (15–25 months). It is likely that the number of patients who showed clinically important progression will become larger when the time between T1 and T2 is longer. However, the median number of months between T1 and T2 was equal for those with clinically important progression compared with those without clinically important progression, and it was even smaller for those with progression (MHQ). So, it seems that the time between T1 and T2 was long enough for disease progression to occur.
The results of this study show that both the URAM and MHQ have comparable measurement properties. Based on this, both PROMs can be used in a Dupuytren’s population, although the length (and consequently, the low acceptance) of the MHQ makes it less suitable for longitudinal studies. We further demonstrated that both PROMs are suitable to measure change in hand function due to natural disease progression in patients with Dupuytren’s disease, but only at a group level. This means that these PROMs cannot be used to detect progression in a single person.
Footnotes
Declaration of conflicting interests
The authors declared no potential conflicts of interest with respect to the research, authorship, and/or publication of this article.
Funding
The authors disclosed receipt of the following financial support for the research, authorship, and/or publication of this article: This study was financially supported by the C. & W. de Boer foundation.
Ethical approval
The ethics committee of the University Medical Center Groningen approved this study.
Details of informed consent
All the participants gave written informed consent for participating in this study.
References
Supplementary Material
Please find the following supplemental material available below.
For Open Access articles published under a Creative Commons License, all supplemental material carries the same license as the article it is associated with.
For non-Open Access articles published, all supplemental material carries a non-exclusive license, and permission requests for re-use of supplemental material or any part of supplemental material shall be sent directly to the copyright owner as specified in the copyright notice associated with the article.