
Abstract
Composites of Ti6Al4V reinforced with 1, 3, and 5 wt. % of three distinct refractory nitrides: h-BN, TiN, and AlN nanoparticles, were fabricated using spark plasma sintering (SPS). The sintered composites were characterized and investigated comparatively in terms of their microstructure, phase composition, densification, mechanical, and wear characteristics, achieved through the use of field-emission gun scanning electron microscopy, X-ray diffraction, Archimedes’ method, nanoindentation technique, and ball-on-disk wear tests. The unreinforced alloy presented a two-phase microstructure comprising α and β phases. Reinforcement with refractory nitrides resulted in significant microstructural alterations and the development of nitride-rich secondary phases. The composites’ relative densities declined with increasing reinforcement content, falling from 98.4 to 97.4% for h-BN, 98.62 to 97.63% for TiN, and 98.64 to 95.14% for AlN. Compared to the unreinforced alloy, the nanoindentation results established that the sintered composites exhibit a continuous appreciation in hardness and elastic modulus with the highest values (70.782 ± 0.794 GPa and 356.76 ± 4.05 GPa, respectively) shown by Ti6A4V-5 wt. % h-BN. In addition, the unreinforced alloy exhibits a higher specific wear rate at each applied load than the composites, which is attributed to the improved hardness features of the refractory nitride-reinforced Ti6Al4V-based composites.
Introduction
Extensive research has focused on high-performance, lightweight materials due to the persistent demand for strong, lightweight, fuel-efficient, and cost-effective options in the automotive and aerospace sectors. 1 These industries have shown a particular interest in titanium and related alloys owing to their high specific strength, low specific gravity, and extensive mechanical and corrosion-resistant characteristics. 2 The Ti6Al4V alloy, which constitutes over 50% of all titanium production, is renowned as the cornerstone of titanium alloys and aerospace manufacturing due to its exceptional mechanical properties in operational environments. However, due to its insufficient hardness, low elastic modulus, and subpar tribological properties both at room and at higher temperatures, the full utilization of Ti6Al4V alloy for structural components has been restricted.2,3
Several techniques have been previously formulated to address the difficulties mentioned above. Included are solid film lubrication techniques, coatings, surface treatments, ion implantation, and oxygen.1–3 Recent research has indicated that refractory nitrides serve as ideal reinforcements for metal and alloy matrices due to their exceptional properties. Refractory nitrides constitute a crucial category of ceramics with substantial technological significance, extensively utilized in high-temperature, structural, chemical, and semiconductor applications. This category of nitrides encompasses the nitrides of silicon, boron, titanium, aluminum, niobium, tantalum, zirconium, and hafnium.4,5 Because of their beneficial attributes, such as elevated melting point, significant hardness, substantial thermal conductivity, commendable high-temperature stability, remarkable chemical stability, and exceptional wear resistance, hexagonal boron nitride (h-BN), titanium nitride (TiN), and aluminium nitride (AlN) have gathered significant attention and, as a result, been the focus of wide investigation.6–9
A good number of research works has been undertaken on various uses of refractory nitride as reinforcement materials, evidencing enhancements in the resultant properties of the developed composites.6–11 Karabacak and colleagues 12 employed high-energy ball milling and vacuum-hot pressing techniques to fabricate matrix nanocomposites of aluminium alloy (Al2024) with varying concentrations of h-BN (0, 2, 3, 4, and 5 wt.%). The subsequent step involves the assessment of the mechanical and wear characteristics of the synthesised nanocomposites. The h-BN particles within the nanocomposites demonstrated uniform dispersion up to a concentration of 4 wt.%, after which agglomeration occurred at the grain boundaries as a result of excessive reinforcement. The nanocomposite with 4 wt.% h-BN demonstrated the highest hardness at 126 HB and a tensile strength of 299.72 MPa. The decrease in wear volume loss was significant when the h-BN concentration was increased to 4 wt.%. In another work, Falodun and co-workers 13 employed the stir casting method to synthesize and evaluate the mechanical characteristics of an Al-Mg-Si-based composite with TiN reinforcement at varied levels, from 1 to 4 wt. %. It was observed that TiN particles caused grain refinement and dispersed evenly throughout the aluminium matrix composite. In a few spots, TiN nanoparticle was noticed to clump together, along with some particles that were firmly bonded to the aluminium matrix. The resulting ultimate tensile strength and microhardness of the aluminum matrix composite were found to have been enhanced by the nanoparticle TiN reinforcements. Moreover, Falcon-Franco and colleagues 14 fabricated magnesium alloy (Mg-AZ91E) composites reinforced with AlN nanoparticles by a self-infiltration pressure-less method and evaluated the mechanical and wear properties of the composites. The outcome revealed that the composite's elastic modulus and hardness demonstrated a favorable strengthening trend, surpassing that of the matrix alloy. The reinforced magnesium AZ91E/AlN demonstrated significant wear resistance under low loads, with the primary wear mechanisms being abrasive-oxidative.
Even though Ti6Al4V has many appealing properties, a major obstacle often arises during the manufacturing process of the alloy due to its strong attraction for nitrogen and oxygen, which compromises its important attributes. Hence, processing of Ti6Al4V alloy under carefully regulated, elevated temperature and atmospheres under vacuum is necessary.1,2 As mentioned by Matizamhuka, 15 conventional powder metallurgy sintering methods face significant challenges due to high melting points, extended dwell times at sintering temperatures, difficulties in controlling grain growth rates, large powder surface areas, and adverse chemical affinities with atmospheric gases (hydrogen, nitrogen, and oxygen) at elevated temperatures. A more effective powder metallurgy technique is highly sought after for these reasons.
Zhang et al. 16 provided a comprehensive report of spark plasma sintering, which is an innovative pressure-assisted pulsed electric current sintering (PECS) method that employs ON/OFF direct current (DC) pulse energy. Spark discharge and Joule heating hotspots are uniformly distributed across the complete sample when “ON/OFF” DC pulse voltage and current are introduced in a repetitive manner to the powders. SPS offers a significant advantage over conventional sintering methods by enabling the rapid sintering of materials that typically present difficulties in achieving full density. Similarly, Garbiec et al. 3 noted that the SPS application facilitates the synthesis of diverse powders at reduced temperatures, specifically between 100 and 300°C, within a shorter time frame when compared to alternative powder metallurgical techniques. The benefits of SPS compared to traditional hot-pressing technology encompass swift densification and limited grain growth, achieved in a shorter duration for different powders, such as metallic, ceramic, polymeric, and composite types. The authors further reported that studies worldwide have characterised spark plasma sintered Ti6Al4V and its composites, typically at temperatures ranging from 700 to 1500°C and compaction pressures from pressureless to 80 MPa. A duration of 2.5 to 20 min was utilized, along with a heating rate varying from 100°C/min to 300°C/min.
Conventional testing methods are often utilized to assess the mechanical properties of materials; however, these methods typically require bulk, standardised samples with specific characteristics, including irregular shapes and geometries or small dimensions. Nanoindentation is a reliable technique for assessing the mechanical behaviour of various materials when a non-destructive method is required. 17 In the nanoindentation process, continuous variations of the load applied and depth of penetration are recorded as a firm indenter infiltrates the specimen's surface. The data on load-penetration depth are commonly assessed to ascertain various mechanical properties, particularly elastic modulus and hardness. 18 The nanoindentation technique facilitates the in-situ evaluation of material properties through the application of ultra-low indentation loads and nanoscale penetration depths, thereby preserving the integrity of the material and its microstructure. The technique's testing speed, simplicity, flexibility, and versatility enable its effective application in measuring nano/micro-mechanical properties across various fields, including thin films, semiconductors, metals, ceramics, and composites.17,18
Furthermore, frictional wear in machinery causes enormous financial losses. About 80% of mechanical components failure results from wear and tear. Damage to mechanical systems and parts accounts for 4% of national output in industrially developed countries. Consequently, the reduction of frictional effect and wear in mechanical sliding components is essential for sustaining the long-term durability of mechanical systems, which ultimately results in increased efficiency and reliability, and in turn saving energy. 19 This initiative aligns with the Sustainable Development Goals (SDGs): 9 (Industry, Innovation, and Infrastructure), which seeks to enhance infrastructure and retrofit industries for sustainability, emphasizing improved resource-use efficiency and the adoption of clean technologies; and 7 (Affordable and Clean Energy), that seeks to ensure access to energy that is affordable, reliable, sustainable, and modern for everyone. Enhancing energy efficiency leads to a decrease in energy consumption and fosters sustainable energy practices. 20
The primary objective of this investigation is to develop strategies for addressing the challenges associated with Ti6Al4V to expand its structural applications in high-demand automotive and aerospace sectors, contributing to the objectives of SDGs 7 and 9. Currently, there is limited scholarly data accessible in the public domain regarding the spark plasma sintering, nanoindentation, and wear characteristics of h-BN-reinforced, TiN-reinforced, and AlN-reinforced Ti6Al4V-based composites, which this study seeks to elucidate. This study, therefore, presents the development of Ti6Al4V-based composites reinforced with varied weight percentages (1, 3, and 5 wt. %) of three distinct refractory nitride materials: h-BN, TiN, and AlN nanoparticles, utilizing the SPS technique. The developed composites were characterized and analyzed comparatively in terms of their microstructure, phase composition, densification, mechanical, and wear characteristics.
Materials and methods
Feedstock and spark plasma sintering operation
The feedstock used in this work essentially consists of micron-sized Ti6Al4V alloy as the matrix material (commercially pure, > 99%, obtained from a German company called TLS Technik) and nano-sized refractory nitrides (h-BN, TiN, and AlN) of purity >99% as the reinforcement materials obtained from a Chinese company named Hongwu International Group Ltd Three categories of Ti6Al4V-based powders with comparable weight compositions, along with a control sample were prepared, each with its corresponding identification code as follows: Ti6Al4V-1h-BN (TBN1), Ti6Al4V-3h-BN (TBN3), and Ti6Al4V-5h-BN (TBN5); Ti6AI4V-1TiN (TTN1), Ti6AI4V-3TiN (TTN3), and Ti6AI4V-5TiN (TTN5); Ti6AI4V-1AlN (TAN1), Ti6AI4V-3AlN (TAN3), and Ti6AI4V-5AlN (TAN5); and Ti6Al4V alloy (TC). The powders were measured with an electronic balance (Model EX10202, Canada) and mixed for 10 h at 110 rpm in a turbula mixer (Willy A. Bachofen CH-4132 Type T2F, Switzerland). During the mixing process, a few steel balls (8 mm in diameter) were incorporated into the powders at a weight ratio of 5 to 2 (balls to powder) to improve the distribution of reinforcement inside the Ti6Al4V alloy matrix.
Afterward, the admixed powders were transferred into an already prepared 30mm-diameter and 10mm-height cylindrical graphite die-punch assemblage and positioned properly in the sintering chamber prior to sintering. The powders underwent consolidation through an automated SPS machine (model FCT Systeme GmbH, Germany) within a vacuum environment of approximately 4 Pa, utilizing fixed optimized SPS parameters: a temperature of 1000 °C, a pressure of 30 MPa, a heating rate of 100 °C/min, and a dwell time of 10 min, as determined by a previous Taguchi design and optimisation experiment carried out by the authors. 21
During the sintering process, the pressure and pulsed direct current were applied and conveyed to the powders, respectively, through the top and bottom punches, uniting the consolidation and densifying operations to a sole operation. The temperature of the samples that were being sintered was frequently checked with the aid of an infrared pyrometer that was positioned a couple of millimetres above the sample surface. Later, the sintering process was completed and ended by dropping the pressure of the sintering chamber and cooling the system. Finally, ten samples were sintered using this process and then sandblasted to take out any graphite remains that had glued to the samples before they were taken for metallographic preparation and examination. Figure 1 is a basic diagram illustrating the process of the composites fabrication.
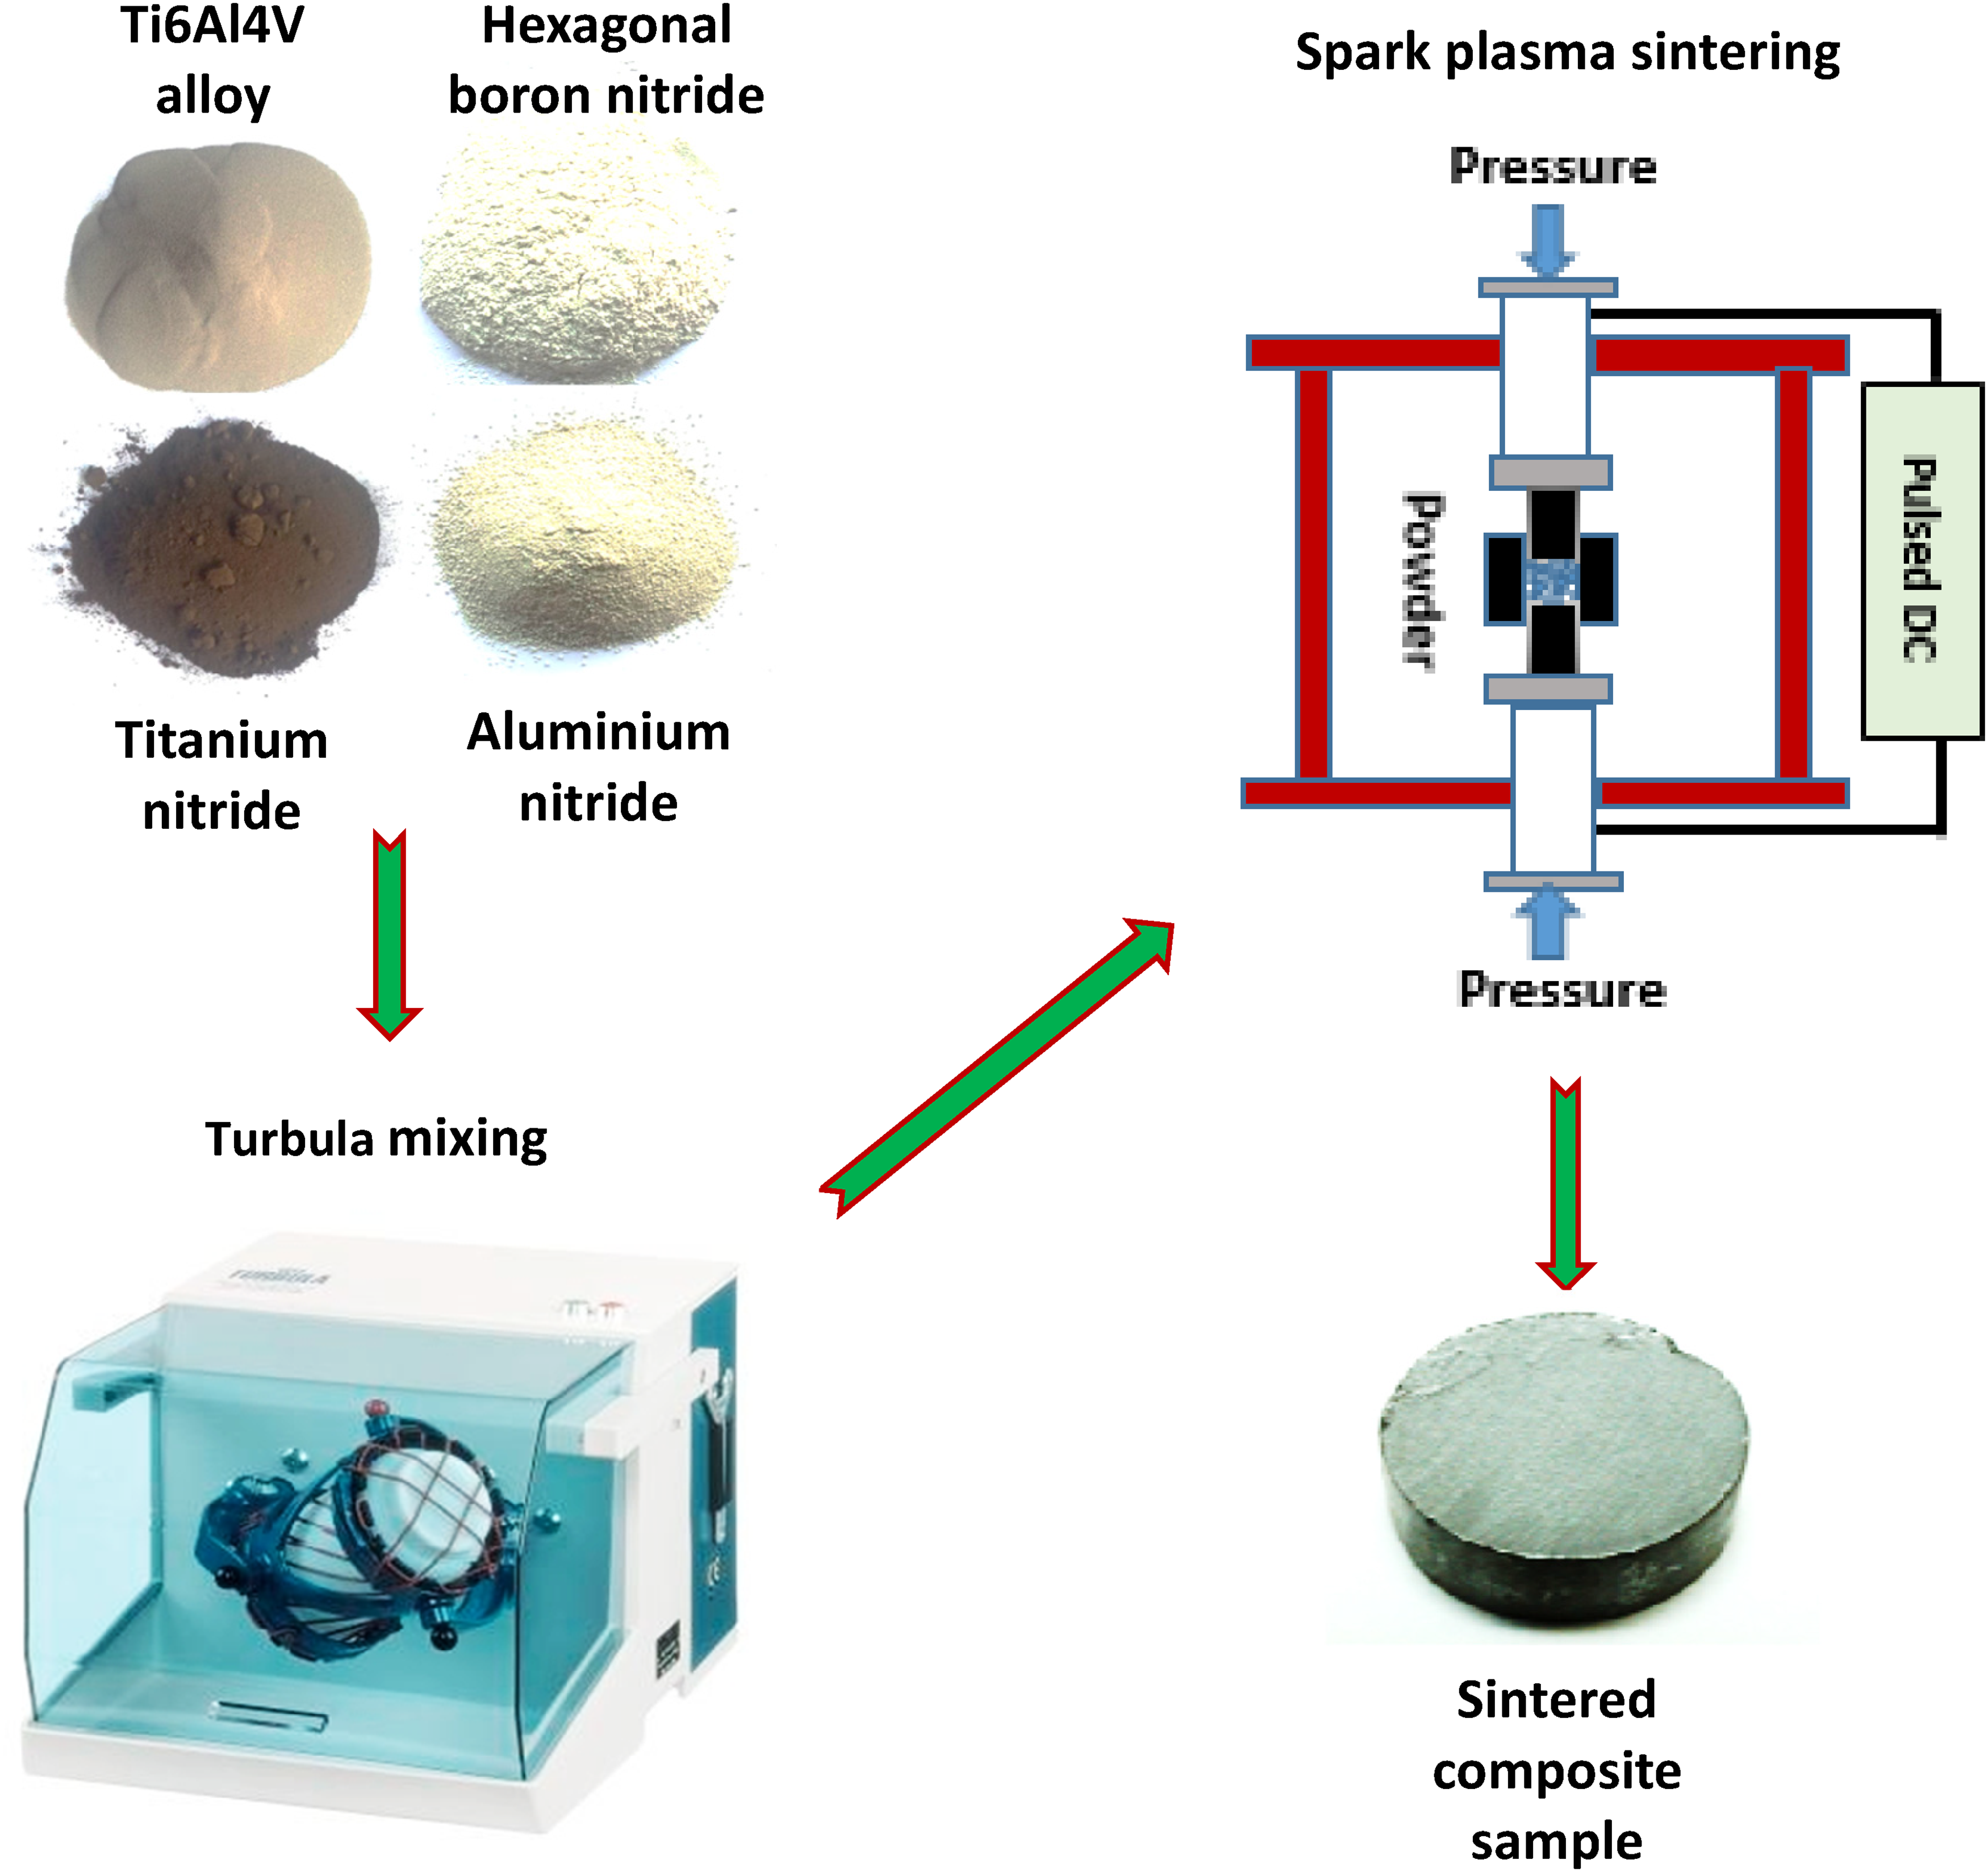
Illustration of the composites fabrication process.
The spark plasma-sintered samples were wire-cut into cuboid pieces of measuring 10 mm by 10 mm by 5 mm, which were then hot mounted in epoxy resin. Abrasive sheets of European (P-Grade) silicon carbide, having grit sizes spanning from P120 to P2400, were employed for grinding. DiaMaxx (6, 3, and 1 microns) was used to polish the samples until they were as shiny as a mirror, followed by etching with Kroll's reagent.
Subsequently, the microstructure of the spark plasma-sintered samples was examined under a field emission gun scanning electron microscope (FEGSEM: Zeiss 540 Ultra) at high magnifications (Mag = 2.00 K x and 50.00 K x) with an energy dispersive spectroscope (EDS). The phases present were identified through X-ray diffraction techniques utilizing the XRD Bruker D8 Advance. The XRD apparatus was equipped with 1.54060 Å wavelength Cu Kα radiation, running at 40 kV and 40 mA. Between 10° and 90°, the diffraction angle (2θ) was measured using a scan step time of 30 s and a step size of 0.02°.
Densification, mechanical, and wear tests
The sintered materials’ densities were determined according to the method of Archimedes outlined in ASTM B962. The experimental density was calculated as the average of six consecutive measurements, whereas the theoretical density was determined using the rule of mixtures. Following this, the relative density of each sample was determined by taking the experimental density to theoretical density ratio and multiplying the outcome by 100%. Porosity was then calculated by subtracting the relative density from 100%. 21
The assessment of nanohardness and the corresponding modulus of elasticity of the samples was conducted as outlined in ISO 14577 standards, by means of an Anton Paar Nanoindenter (NHT) equipped with a Berkovich indenter. The test was conducted with a constant applied load of 200 mN, incorporating a penetration, holding, and retracting of 20 s long. Indentation measurements were accomplished at an average of eight distinct points chosen on the surface of each sample. The study of nanoindentation process was executed utilizing the Oliver-Pharr concept, wherein the hardness, H (measured in MPa), and the elastic modulus, E (measured in GPa) of the samples were determined via equations (1) and (2).22,23


The total work done by the indenter during indentation (Wtot) is the total sum of the elastic work (Wel) and plastic work (Wpl), which are calculated from the area under the nanoindentation load-displacement curve. The elastic work (Wel), plastic work (Wpl), and total indentation work (Wtot) derived from the nanoindentation test results were evaluated to determine the elastic recovery index (Wel/Wtot) and the plasticity index (Wpl/Wtot); which are two important complementary parameters that help to provide valuable insights into the mechanical behaviour of the spark plasma-sintered Ti6Al4V alloy and Ti6Al4V-based composites under load of indentation. The elastic recovery index quantifies the deformation percentage that can be restored following the removal of the load of indentation. On the contrary, the plasticity index indicates the percentage of deformation that remains permanent after the load of indentation is removed.22,23
Lastly, Anton Paar Tritec SA supplied the TRB3 ball-on-disk tribometer featuring a rotating wear module, was used to measure the friction and wear of the surfaces of the sintered samples moving relatively at ambient temperature as outlined in ASTM G99 standards. The pictorial view of the setup for the wear process is presented in Figure 2(a) while Figure 2(b) depicts a typical ball-on-disk configuration where Fn represents the normal force exerted on the ball, r denotes the diameter of the ball, R signifies the wear track radius, and s indicates the rotational speed of the disk. A Ø10 mm steel ball was employed as the counter body for the roller to apply pressure on the samples. Three standard loads of 5N, 10N, and 15N were applied at a rotational speed of 150 rev/min. The tribometer software facilitates the calculation of wear by multiplying the profile area by the circumference value of the wear track, thereby determining the total disk-wear volume. The instrument directly recorded the frictional force and coefficient of friction (COF), which were subsequently plotted on a graph. The disc wear was assessed by measuring the area of the wear track profile, from which the wear rate of the disc was calculated using the software. The disc volume loss (Vdisk), under the assumption of negligible ball wear, is represented by equation (3). The disc wear rate (Wdisk), typically represented in mm3/Nm, is defined by equation (4). This value is derived from the wear volume (Vdisk), which is calculated using the tribometer software. The average coefficient of friction (COF) values for each sample, along with COF patterns and specific wear rates, were documented throughout the testing process. The test was performed on three separate occasions to enhance correctness, and the mean of the results were noted as the specific wear rate for each sample. Finally, the worn surfaces were subjected to SEM examination and EDS mapping to gather the essential data regarding the ensuing wear characteristics.
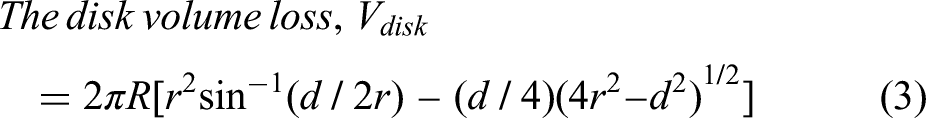

(a) Pictorial view of the wear setup, and (b) typical ball-on-disk configuration.
Microstructure and phase characteristics
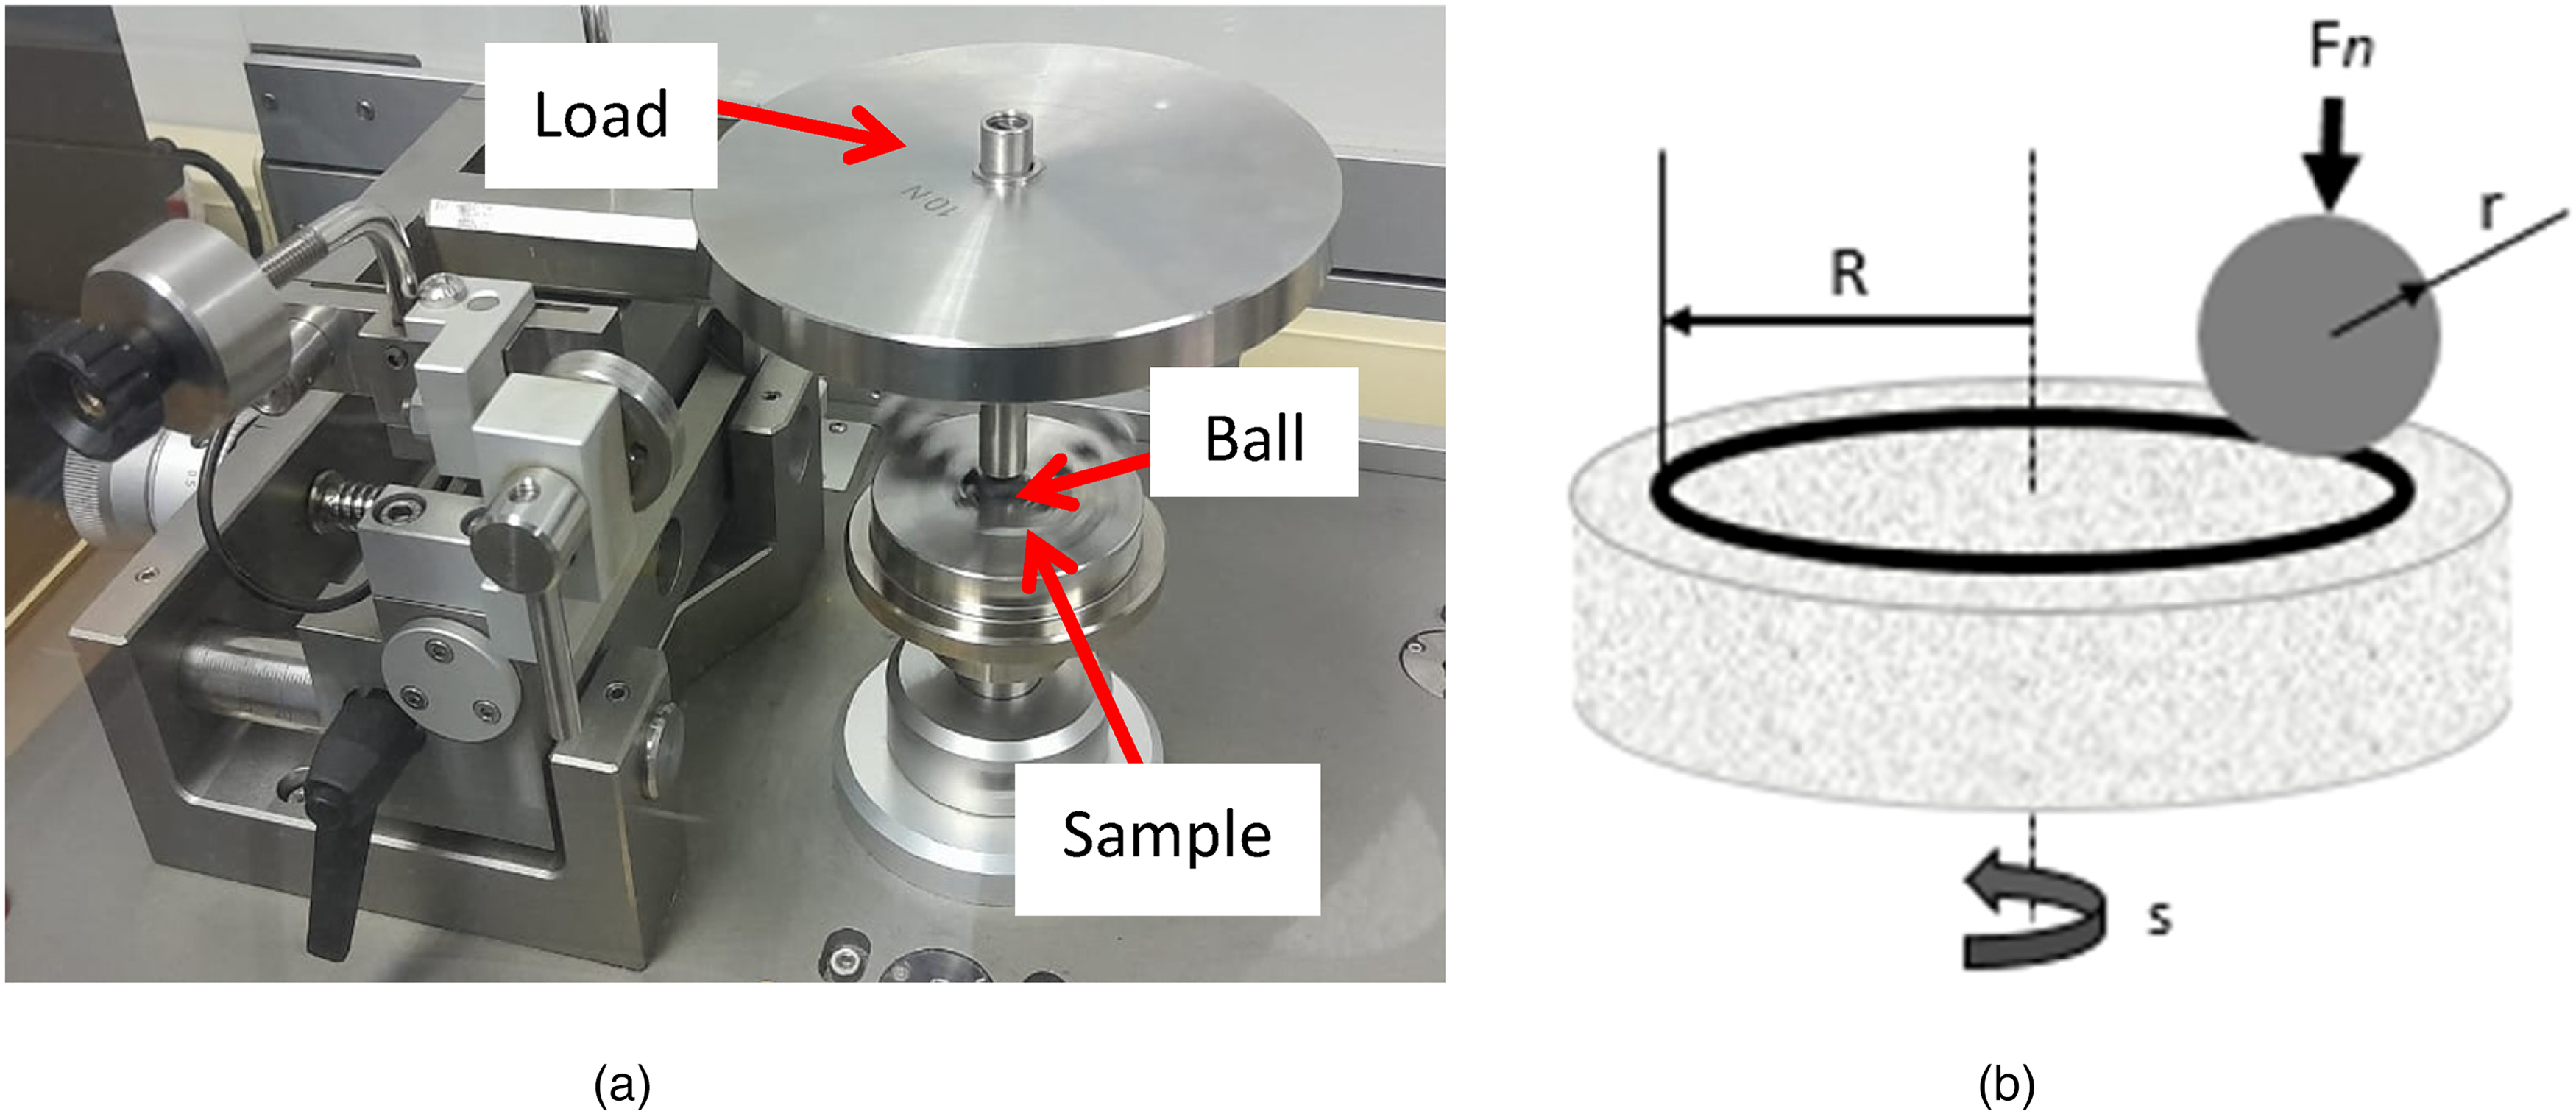
The characterization of powders and sintered materials through high-resolution microscope images and X-ray diffraction is essential for apprehending the preliminary structures, phase evolution, sintering process reactions, and the scientific mechanism that influence the properties of the materials.24,25 Figure 3(a)–(d) present FEGSEM images of the Ti6Al4V alloy, h-BN, TiN, and AlN powders utilized in this study. Figure 3(a) illustrates spherical Ti6Al4V alloy particles measuring 53 µm average particle size (Mag = x 500), whereas Figure 3(b)–(d) display platy-hexagonal h-BN, spherical TiN, and clumpy wurtzite-like AlN particles, respectively measuring 94, 96, and 84 nm average particle sizes (Mag = x 100,000). The corresponding patterns derived from the XRD characterisation of the powders are presented in Figure 4(a)–(d). The XRD pattern for Ti6Al4V titanium alloy powder, as shown in Figure 4(a), clearly indicates the presence of relatively low-intensity pattern of typical α-Ti phase peaks at diffraction angles of 2θ = 35.09°, 38.42°, 40.17°, 53.0°, 62.95°, 70.66°, 76.22°, and 77.37°, corresponding to the (100), (002), (101), (102), (110), (103), (112), and (201) planes, respectively. Figure 4(b) presents relatively high-intensity peaks corresponding to the crystalline hexagonal BN phase at 2θ values of 26.63°, 41.51°, 43.75°, 50.0°, 54.85°, 75.73°, and 81.93°, which align with the (002), (100), (101), (102), (004), (110), and (105) planes. This data characterizes hexagonal BN peaks typically 100 nm APS, achieved through isothermal annealing. 26 The crystalline TiN phase is observed in Figure 4(c) at 2θ = 36.66°, 42.6°, 61.81°, 74.07°, and 77.96°, corresponding to the (111), (200), (220), (311), and (222) planes. The TiN enhanced atomic scattering and probable preferential orientation may have increased TiN peak intensities slightly relative to the Ti6Al4V alloy. Similar peak intensities reflect comparable phase content, which helps evaluate microstructural evolution during spark plasma sintering (SPS) and maintain composite phase detectability. Figure 4(d) displays distinct, relatively high-intensity peaks of the crystalline AlN phase, secondary to the hexagonal BN phase in intensity, appearing at 2θ = 33.22°, 36.04°, 37.92°, 49.82°, 59.35°, 66.05°, 69.73°, 71.44°, 72.63°, 76.45°, and 81.1°, aligning with the (100), (002), (101), (102), (110), (103), (200), (112), (201), (004), and (202) planes.
FEGSEM micrographs of as-received powders: (a) Ti6Al4V alloy (mag = x 500) (b) h-BN (c) TiN, and (d) AlN (mag = x 100,000).
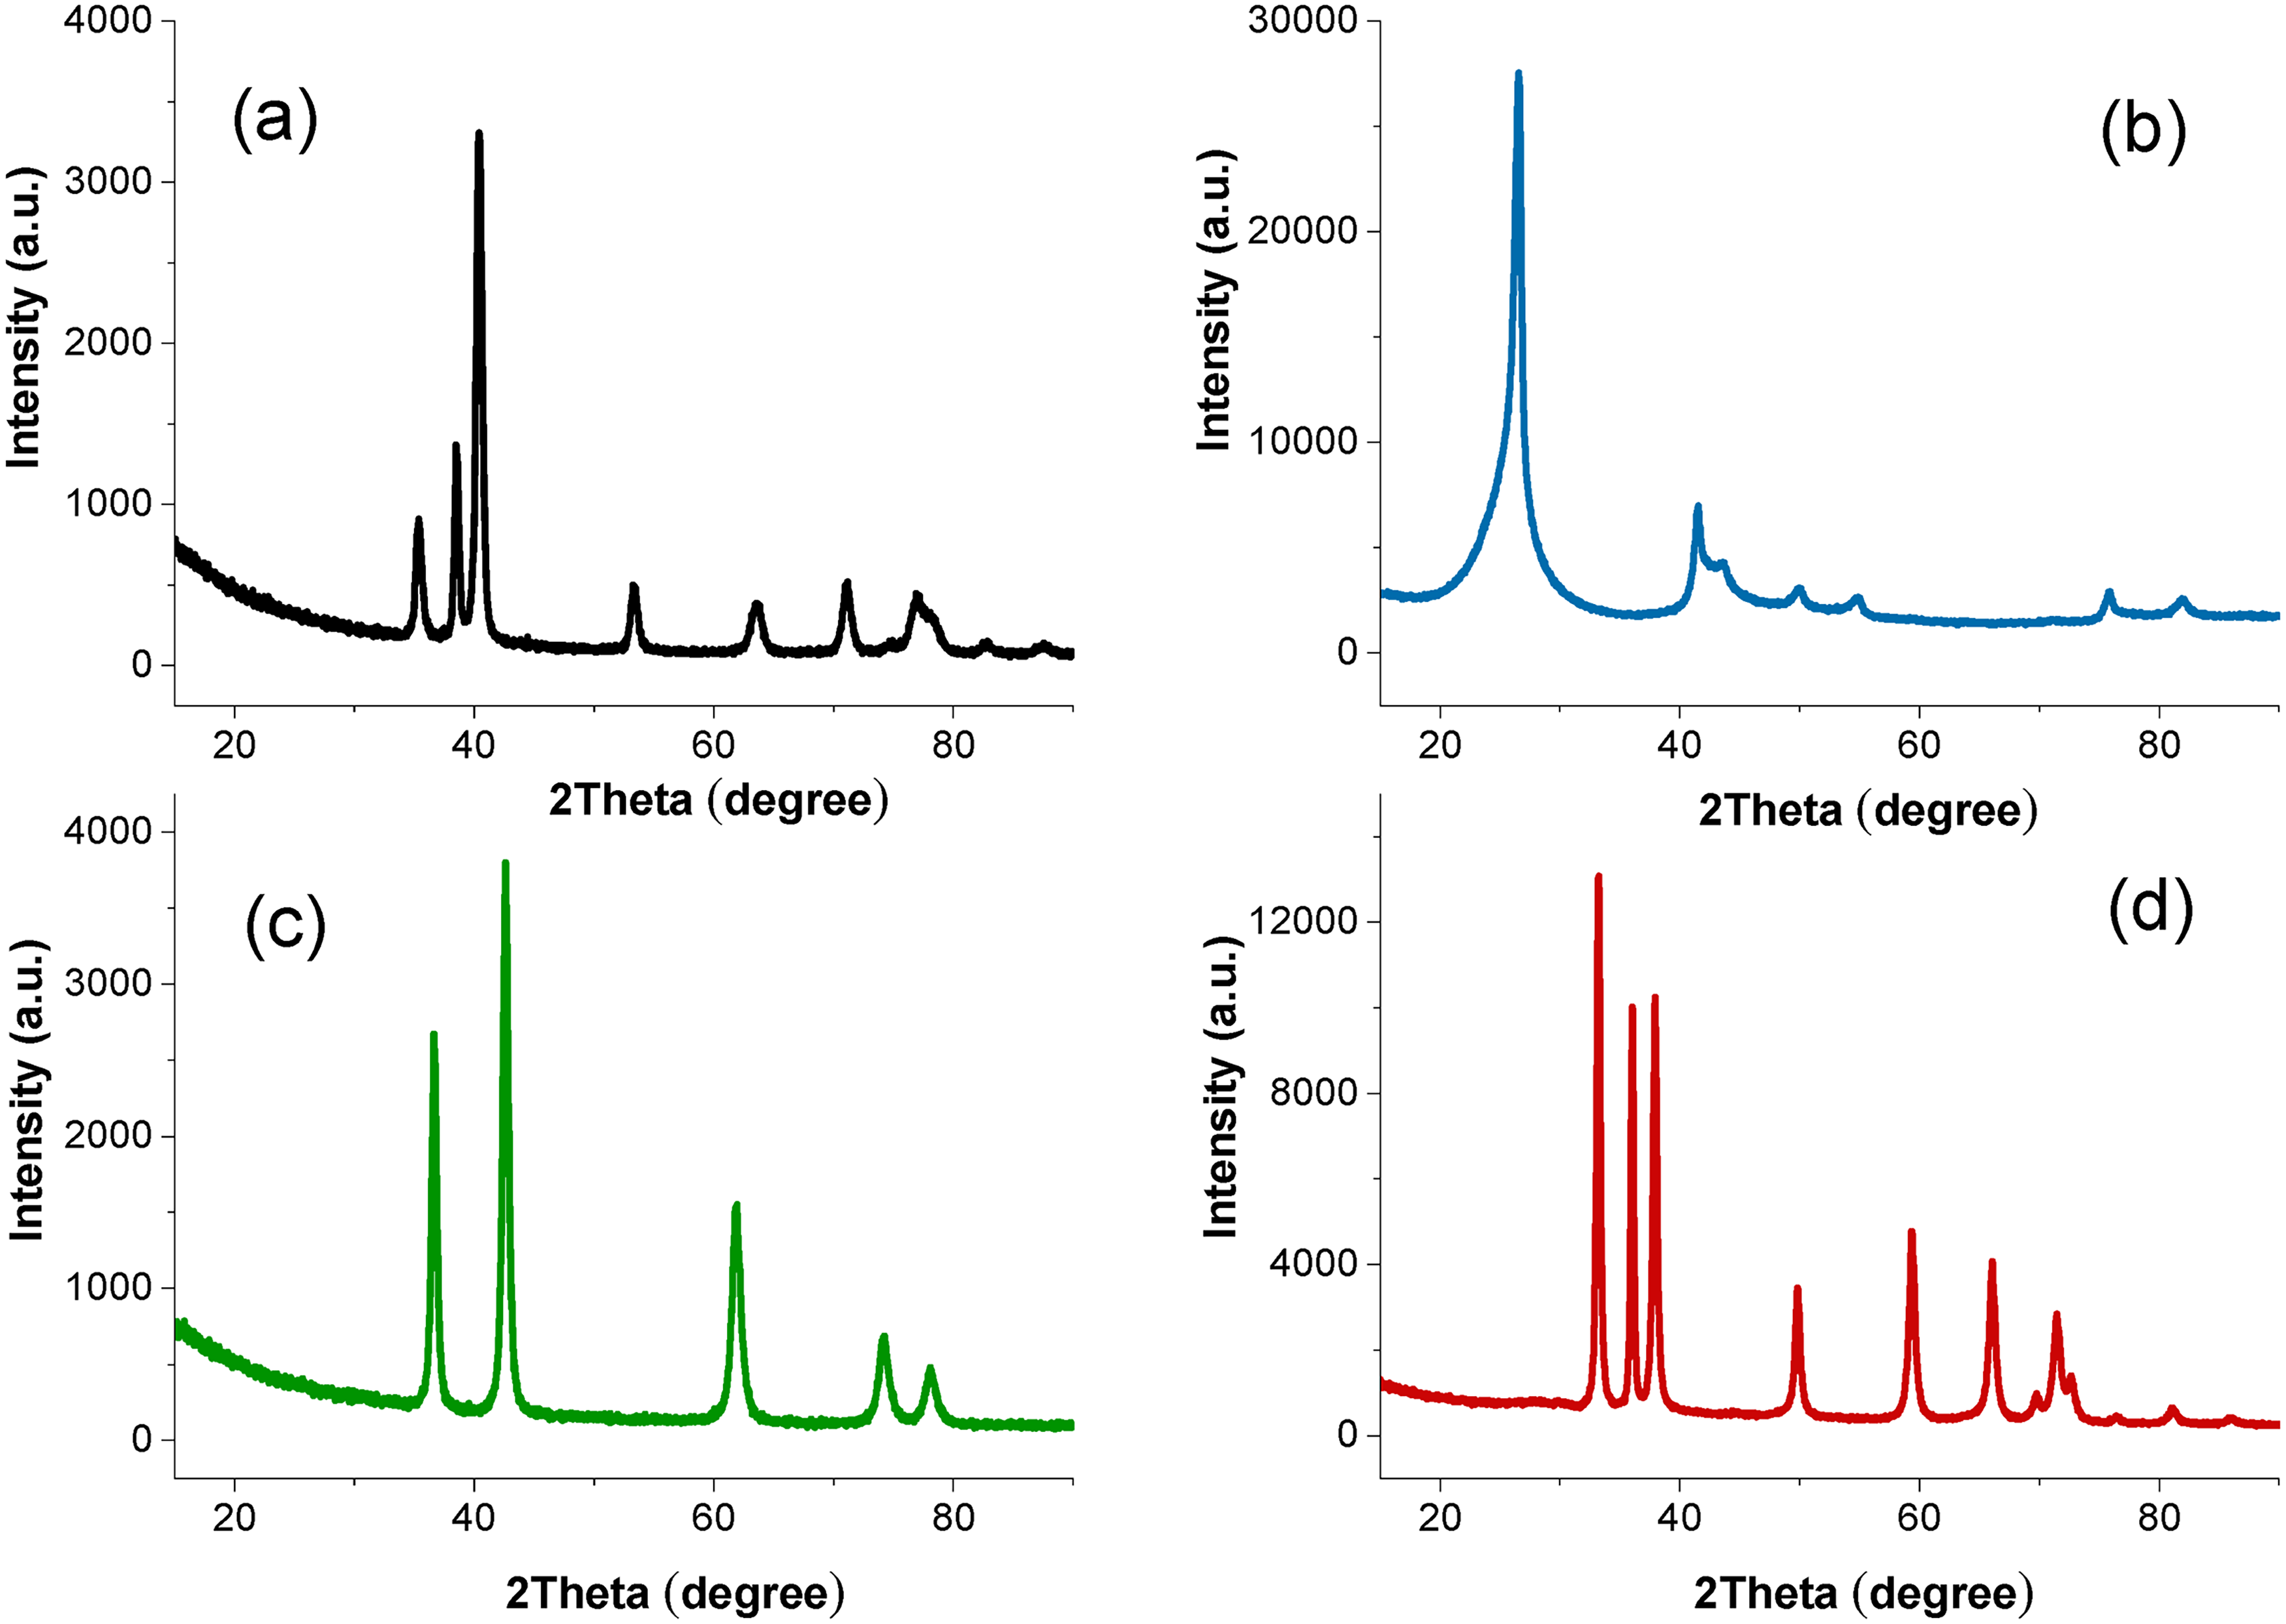
XRD patterns of as-received powders: (a) Ti6Al4V (b) h-BN (c) TiN and (d) AlN.
Figure 5 illustrates the morphologies and peak intensities of TC, TBN1, TBN3, TBN5, TTN1, TTN3, TTN5, TAN1, TAN3 and TAN5, as depicted through FEGSEM and standard EDS analyses. The sintering parameters for each sample during processing were kept at a temperature of 1000°C, pressure of 30 MPa, heating rate of 100°C/min, and dwelling duration of 10 min, as per the Taguchi optimization experiment conducted by Abe et al. 21 The morphology of the Ti6Al4V alloy in Figure 5(ai) clearly shows two distinct phases (α+β) with varying orientations of α lamellar colonies. 27 As depicted in Figure 5(ai), the Ti6Al4V alloy unveils two distinctive phases, namely α and β. These phases are distinguished by their different orientations, which include small lamellar (ultrafine α lamellae) and substantial bimodal structures (α lamellae + fine equiaxed grains), characterized by a substantial amount of primary α phases. The resultant EDS illustrates the elemental peaks corresponding to the likely quantities, as evidenced by the EDS spectra in Figure 5(aii).
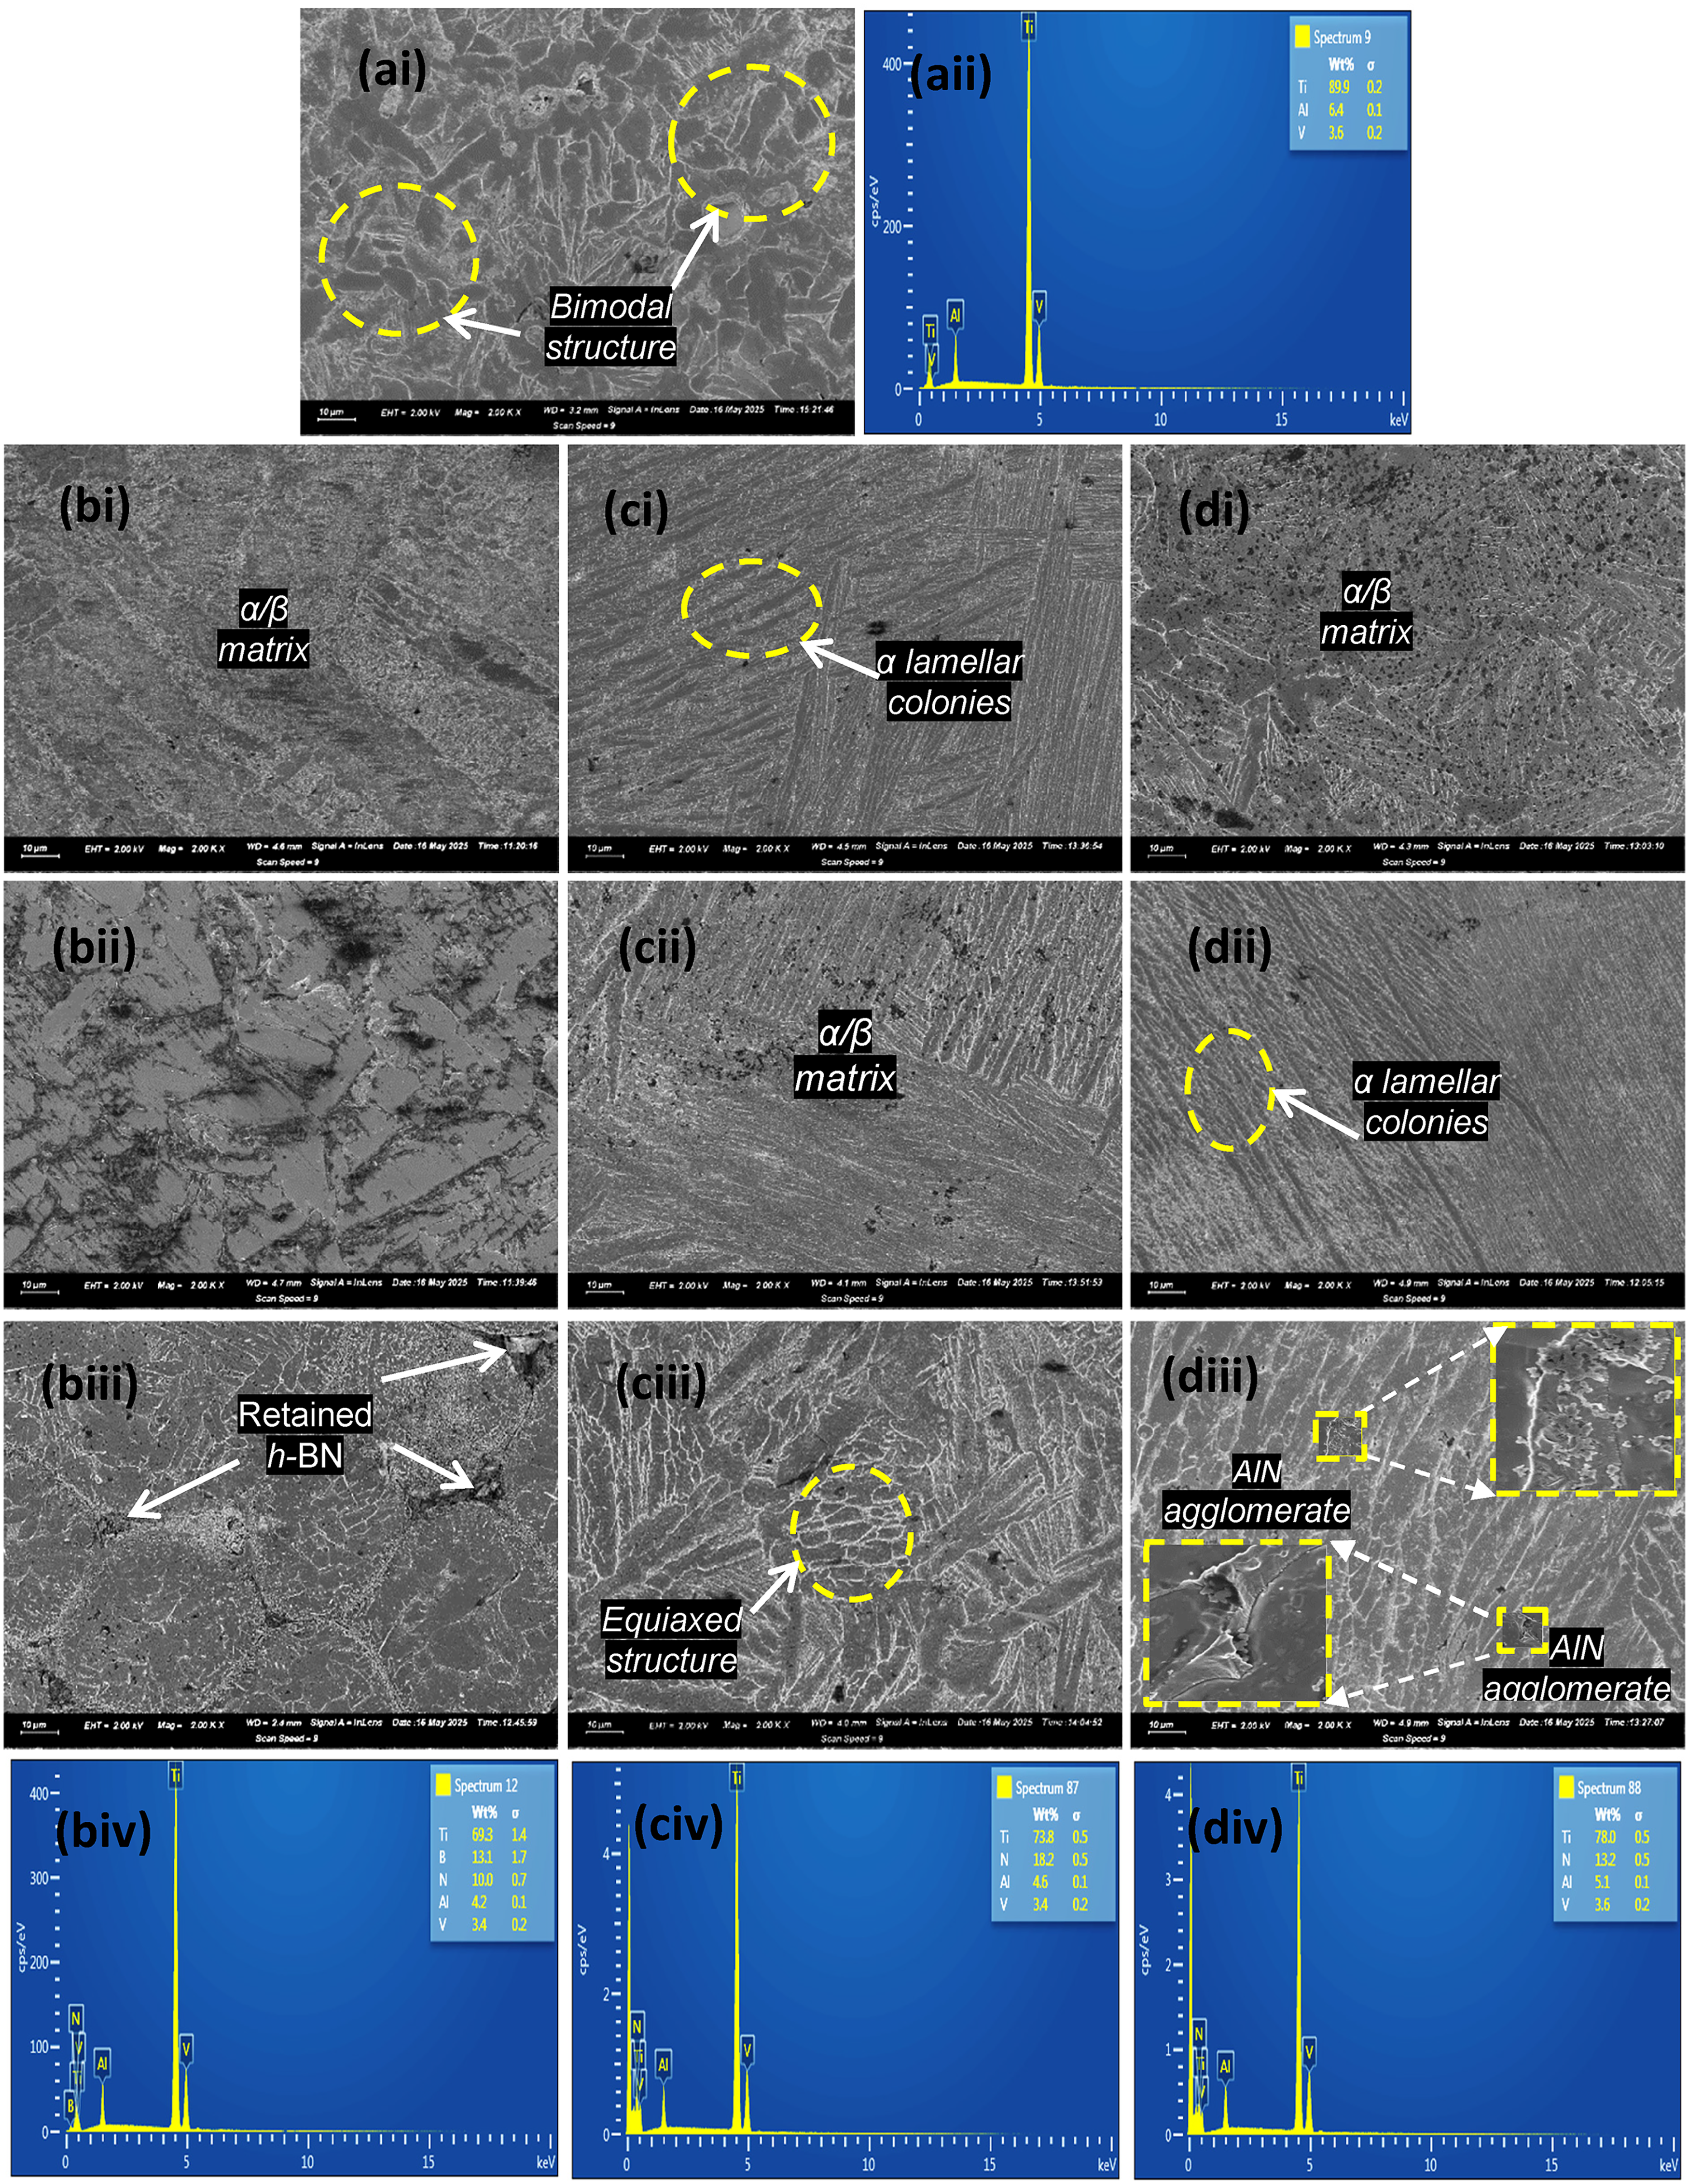
FEGSEM/EDS micrographs revealing the morphologies and peaks of TC (ai-aii), TBN1, TBN3 and TBN5 (bi-biv), TTN1, TTN3 and TTN5 (ci-civ) and TAN1, TAN3 and TAN5 (di-div), respectively.
Figure 5(b)–(d) exemplify notable morphological changes occurring within the α/β alloy matrix, contrasting with the microstructure of TC depicted in Figure 5(ai). The observed changes in the microstructure of the reinforced composites result primarily from the individual contributions of h-BN, TiN, and AlN nanoparticles, as well as the increasing reinforcement levels from 1 to 5 wt. %. 28 The EDS spectra in Figure 5(biv) reveal the elemental peaks of boron and nitrogen as a coherent validation of the presence of h-BN constituent part in the α/β matrix. Likewise, there are clear indications from the elemental peaks recorded in the EDS spectra in Figure 5(civ) and (div) that probable quantities of the nitrides in form of Ti, Al and N elemental compositions are contained in the TMCs with TiN and AlN reinforcements. The EDS spectra presented in Figure 5(biv) indicate the elemental peaks of boron and nitrogen, thereby confirming the presence of h-BN within the α/β matrix. Additionally, the elemental peaks observed in the EDS spectra presented in Figure 5(civ) and (div) suggest the presence of nitrides, specifically Ti, Al, and N, within the TMCs that incorporate TiN and AlN reinforcements. The EDS micrographs presented in Figure 5 represent those obtained for TBN5, TTN5 and TAN5, serving as representatives for other sintered TMCs. This is primarily due to the comparatively low levels of reinforcements and specific selected regions of the spectra during the experiment, which rendered it rather difficult to ascertain the precise elemental compositions with ease.
Figure 5(bi) to (biii) illustrate the dispersion of h-BN nanoparticles and their influence on the microstructure of the alloy matrix. The incorporation of h-BN reinforcement in the composites is reflected in the microstructural changes observed, characterized by an increasing content of h-BN embedded within the alloy matrix, increasing from 1 wt. % in Figure 5(bi) to 3 wt. % in Figure 5(bii). Figure 5(biii) indicates that clustering of the particles, identified as retained h-BN, occurs at the grain boundary regions with the introduction of additional h-BN content (up to 5 wt. %). The retained particles are observed as distinct phases from the matrix, uniformly dispersed and well-bonded. Such particles directly enhance the strength, load-bearing capacity, hardness, and wear resistance of the composites.29,30
The addition of TiN particles catalyzes an evolution of microstructure, shifting from predominantly lamellar and bimodal patterns within the α/β matrix to an arrangement characterized by elongated, needle-like grains, which are categorized as an acicular structure as depicted in Figure 5(ci). The refinement of this structure is notably enhanced with increased TiN additions from 1 to 3 wt. %, as depicted in Figure 5(cii) and (ciii), respectively. 27 Increased TiN concentration from 3 to 5 wt. % produced an amalgamation of equiaxed structures with elongated grains, as revealed in Figure 5(ciii). Figure 5(di)–(diii) illustrate FEGSEM micrographs that reveal the microstructural attributes of the AlN-reinforced composites. Figure 5(di) shows how the initial bimodal pattern of the α/β alloy matrix undergoes a partial transformation into ultrafine α lamellae, leading to a lamellar morphology characterized by fine equiaxed grains interspersed within the α/β matrix. The microstructural evolution of elongated needle-like grains is clearly illustrated in Figure 5(dii), showcasing a heightened concentration of AlN. The manifestation of this phenomenon intensifies with the increase in AlN addition from 3 to 5 wt. %, as depicted in Figure 5(diii).
Furthermore, it is recognizable that the AlN particles demonstrate a consistent distribution within TAN1 and TAN3, which is beneficial for improving material properties. 30 A cluster of coarsened AlN particles is evident in TAN5, as depicted in the enlarged sections (Mag = 50,000 x) of Figure 5(diii). This phenomenon can be largely ascribed to the propensity of particulate reinforcement to cluster, especially at higher concentrations. 31 This distribution persists consistently throughout the α/β alloy matrix. Remarkably, a comparatively higher degree of grain refinement is observed in 5 wt. % particulate reinforcement across various refractory nitrides additions. This phenomenon tends to increase the hardness of the reinforced composites through mechanisms such as decreased grain boundaries, impeded dislocation movement, and improved grain bonding. 32 The absence of notable flaws or porosities, as evidenced by the FEGSEM images, substantiates SPS processing technique mitigating undue surface reactions. 4 This facilitates the attainment of finely refined grains, the synthesis of extremely dense materials, and the establishment of robust matrix-reinforcement interfacial bonds. 33 The findings demonstrate that the SPS technique proficiently consolidates Ti6Al4V matrix composites that are reinforced with h-BN, TiN, and AlN at 1, 3, and 5 wt. % concentrations, respectively.
Figure 6 presents a comparison of the XRD images among TC, TBN1, TBN5, TTN1, TTN5, TAN1 and TAN5. Plot (a) in Figure 6 demonstrates a clear identification of both α-Ti and β-Ti phases within TC. 27 A significant reduction in the XRD peak intensities of the reinforcements is observed when transitioning from plot (b) to plot (g) after dispersion in the Ti6Al4V alloy matrix through mixing and SPS. This results from a combination of the dilution effect of the reinforcement phase within the matrix, refinement and particulate reinforcement's dispersion, potential interfacial reactions, and geometric reorganisation that causes a loss of preferred orientation. The factors collectively diminish the XRD signals of the reinforcement phase in these composites. 34 Additionally, plots (b) and (c) in Figure 6 exhibit unique XRD patterns that emphasize the characteristic hard BN phase at 2θ ∼ 44.3° and the TiB phase at 2θ ∼ 44.8°. The peaks are considered essential for interpreting the enhanced structural properties (hardness and strength) of h-BN-reinforced TMCs relative to TiN- and AlN-reinforced counterparts. 25
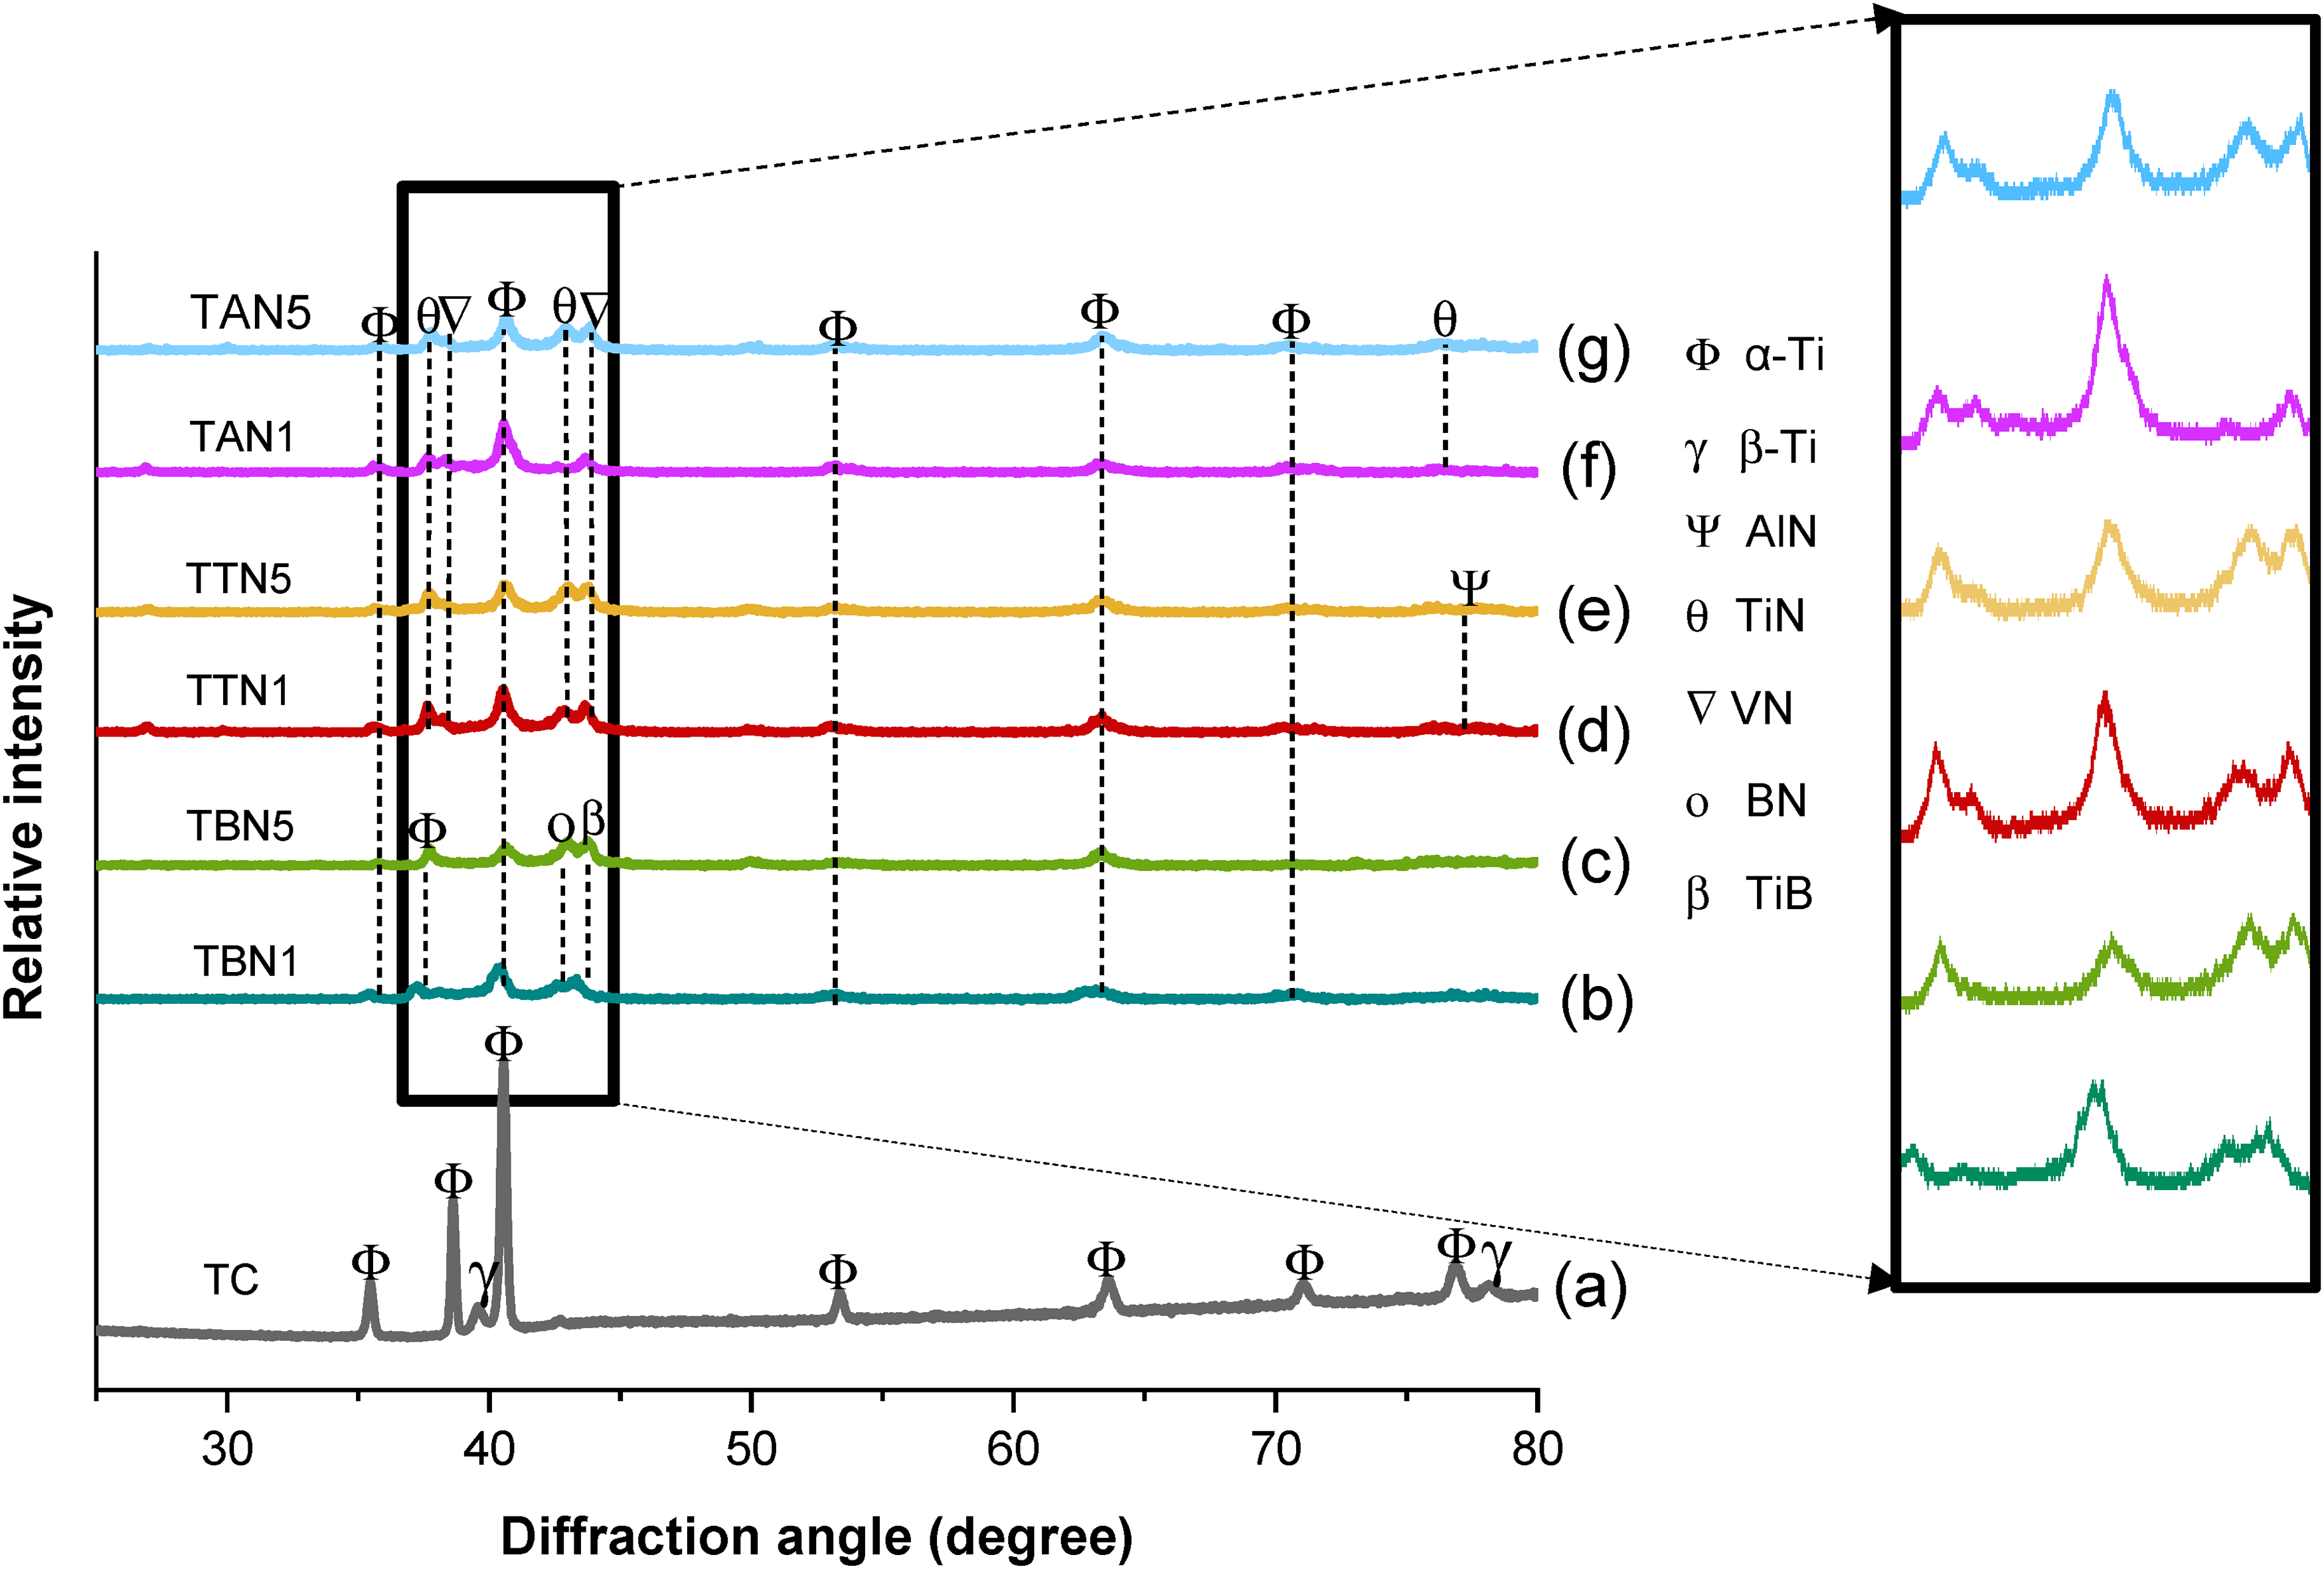
XRD plots of: (a) TC (b) TBN1 (c) TBN5 (d) TTN1 (e) TTN5 (f) TAN1, and (g) TAN5.
On the other hand, plots (d), (e), (f) and (g) on Figure 6 demonstrate nearly matching XRD peak positions and intensities for the α-Ti phase (2θ = 35.09°, 40.17°, 53.0°, 62.95°, and 70.66°), VN phase (2θ = 37.28° and 43.38°), and TiN phase (2θ = 42.48°) in both TiN-reinforced and AlN-reinforced composites. Notably, the AlN phase appears at 2θ = 76.63° in plots (d) and (e), while an additional TiN phase is observed at 2θ = 78.08° in plots (f) and (g). This indicates that the TiN-reinforced and AlN-reinforced TMCs exhibit significant comparisons in their phase constituents and physical and chemical features. 13 The phase analysis indicates that not any of the XRD patterns presented in Figure 6 confirm the presence of detrimental intermetallic peaks. This suggests the absence of disadvantageous interfacial reactions amid the refractory nitride reinforcements and the Ti6Al4V matrix all through the SPS action.29,30
Information about the experimental results of the density test is presented in Table 1, and Figure 7 displays the graph comparing the developed composites’ effective density and porosity values. According to Table 1, TC has a density of 4.42 g/cm3. In contrast, the measured density of TBN1, TBN3 and TBN5 significantly decreases as the concentration of h-BN increases from 1 to 3 wt. % and 3 to 5 wt. %, respectively. This is essentially a consequence of low h-BN density, which is 2.3 g/cm3. When the AlN content increases from 1 to 3 wt. % and 3 to 5 wt. %, respectively, the measured densities of TAN1, TAN3 and TAN5 also noticeably decrease, from 4.34 to 4.29 g/cm3 and 4.29 to 4.13 g/cm3, which is also thought to be related to the comparatively low density of AlN (3.26 g/cm3).
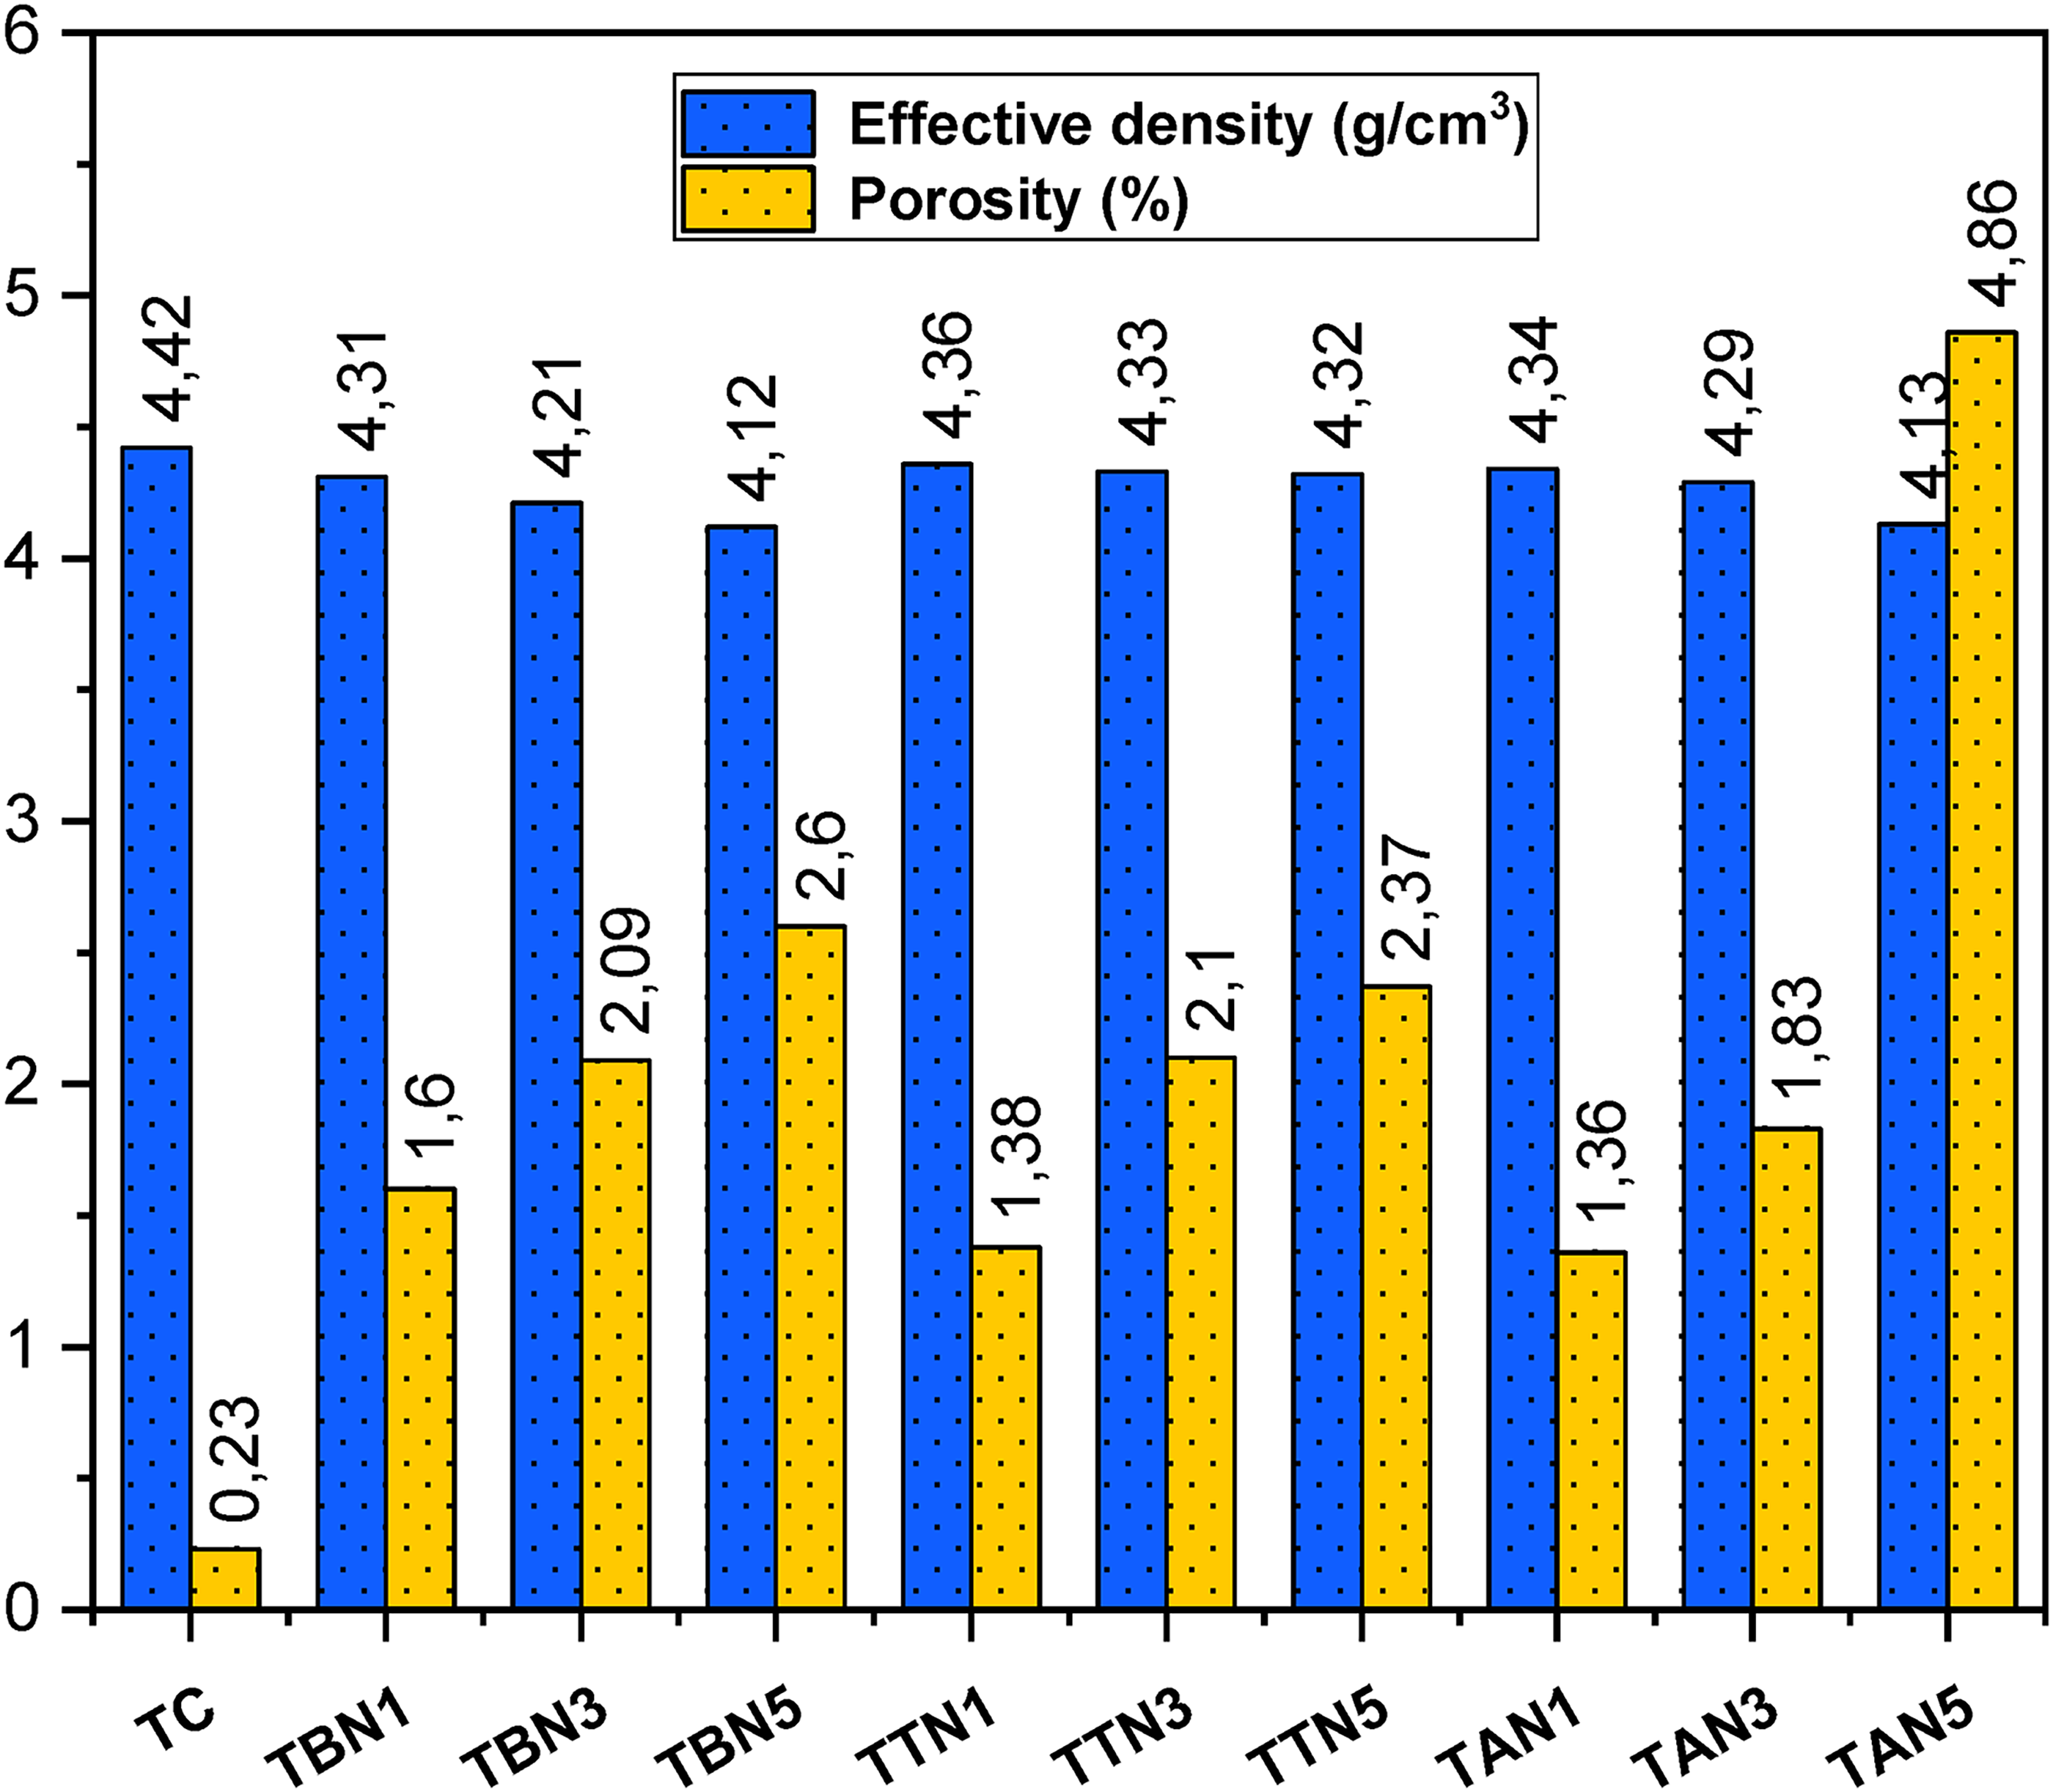
Comparison between the effective density and porosity values of the sintered materials.
Overview of the density and mechanical characteristics of the spark plasma-sintered samples in this study.
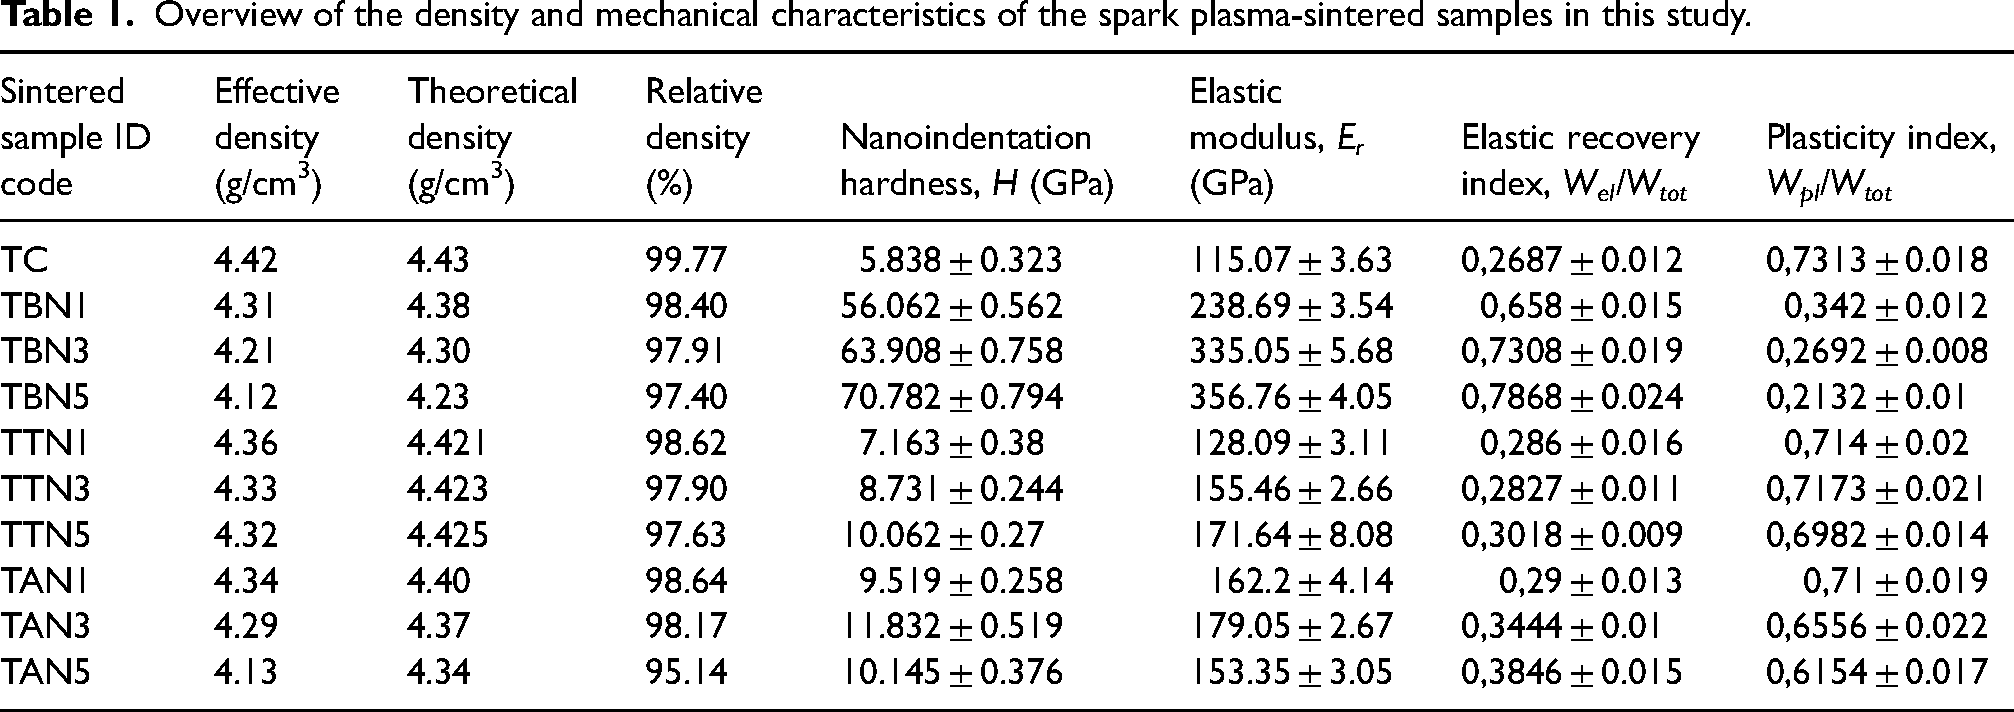
On the other hand, TTN1, TTN3 and TTN5 only shows a small drop in density measured from 4.36 to 4.33 g/cm3 and 4.33 to 4.32 g/cm3 with increasing TiN content from 1 to 3 wt. % and 3 to 5 wt. %, respectively. This majorly arises mainly because TiN has a relatively high density (4.52 g/cm3) when compared to h-BN and AlN. 26 It is noteworthy that TC exhibits almost perfect theoretical densification (99.77%), implying that the method of SPS promotes efficient alloy consolidation via sufficient diffusional mass transport which caused the particles to strongly fuse together as illustrated in the FEGSEM image in Figure 7(ai). 33
With the introduction of varied contents of h-BN, TiN and AlN reinforcements (1, 3 and 5 wt. %., respectively) to the alloy matrix, the developed TMCs exhibits a gradual reduction in comparative densities from 98.40% to 97.40% for TBN1, TBN3 and TBN5, 98.62% to 97.63% for TTN1, TTN3 and TTN5, and 98.64% to 95.14% for TAN1, TAN3 and TAN5 as shown in Table 1. The presence of porosities, which are known to be one of the main factors contributing to poor densification in sintered materials, is most likely the cause of the depreciation in densification observed. 33 This is further displayed in Figure 6, where the TMCs exhibit a progressive rise in porosity levels from 1.6% to 2.6% TBN1, TBN3 and TBN5, 1.38% to 2.37% for TTN1, TTN3 and TTN5, and 1.36% to 4.86% for TAN1, TAN3 and TAN5. Remarkably, the densification characteristics of the TMCs are apparently affected by the types and proportions of the reinforcement materials. 4
The hardness and elastic modulus of TC, TBN1, TBN3, TBN5, TTN1, TTN3, TTN5, TAN1, TAN3, and TAN5 in this investigation were ascertained by means of the nanoindentation technique. Figure 8 compares the penetration depth-time and nanoindentation load-displacement curves based on Oliver and Pharr's examination of the materials subjected to a 200 mN indentation load.17,23 Meanwhile, Figure 9 illustrates the comparison made between the tested samples’ modulus of elasticity and nanoindentation hardness values.
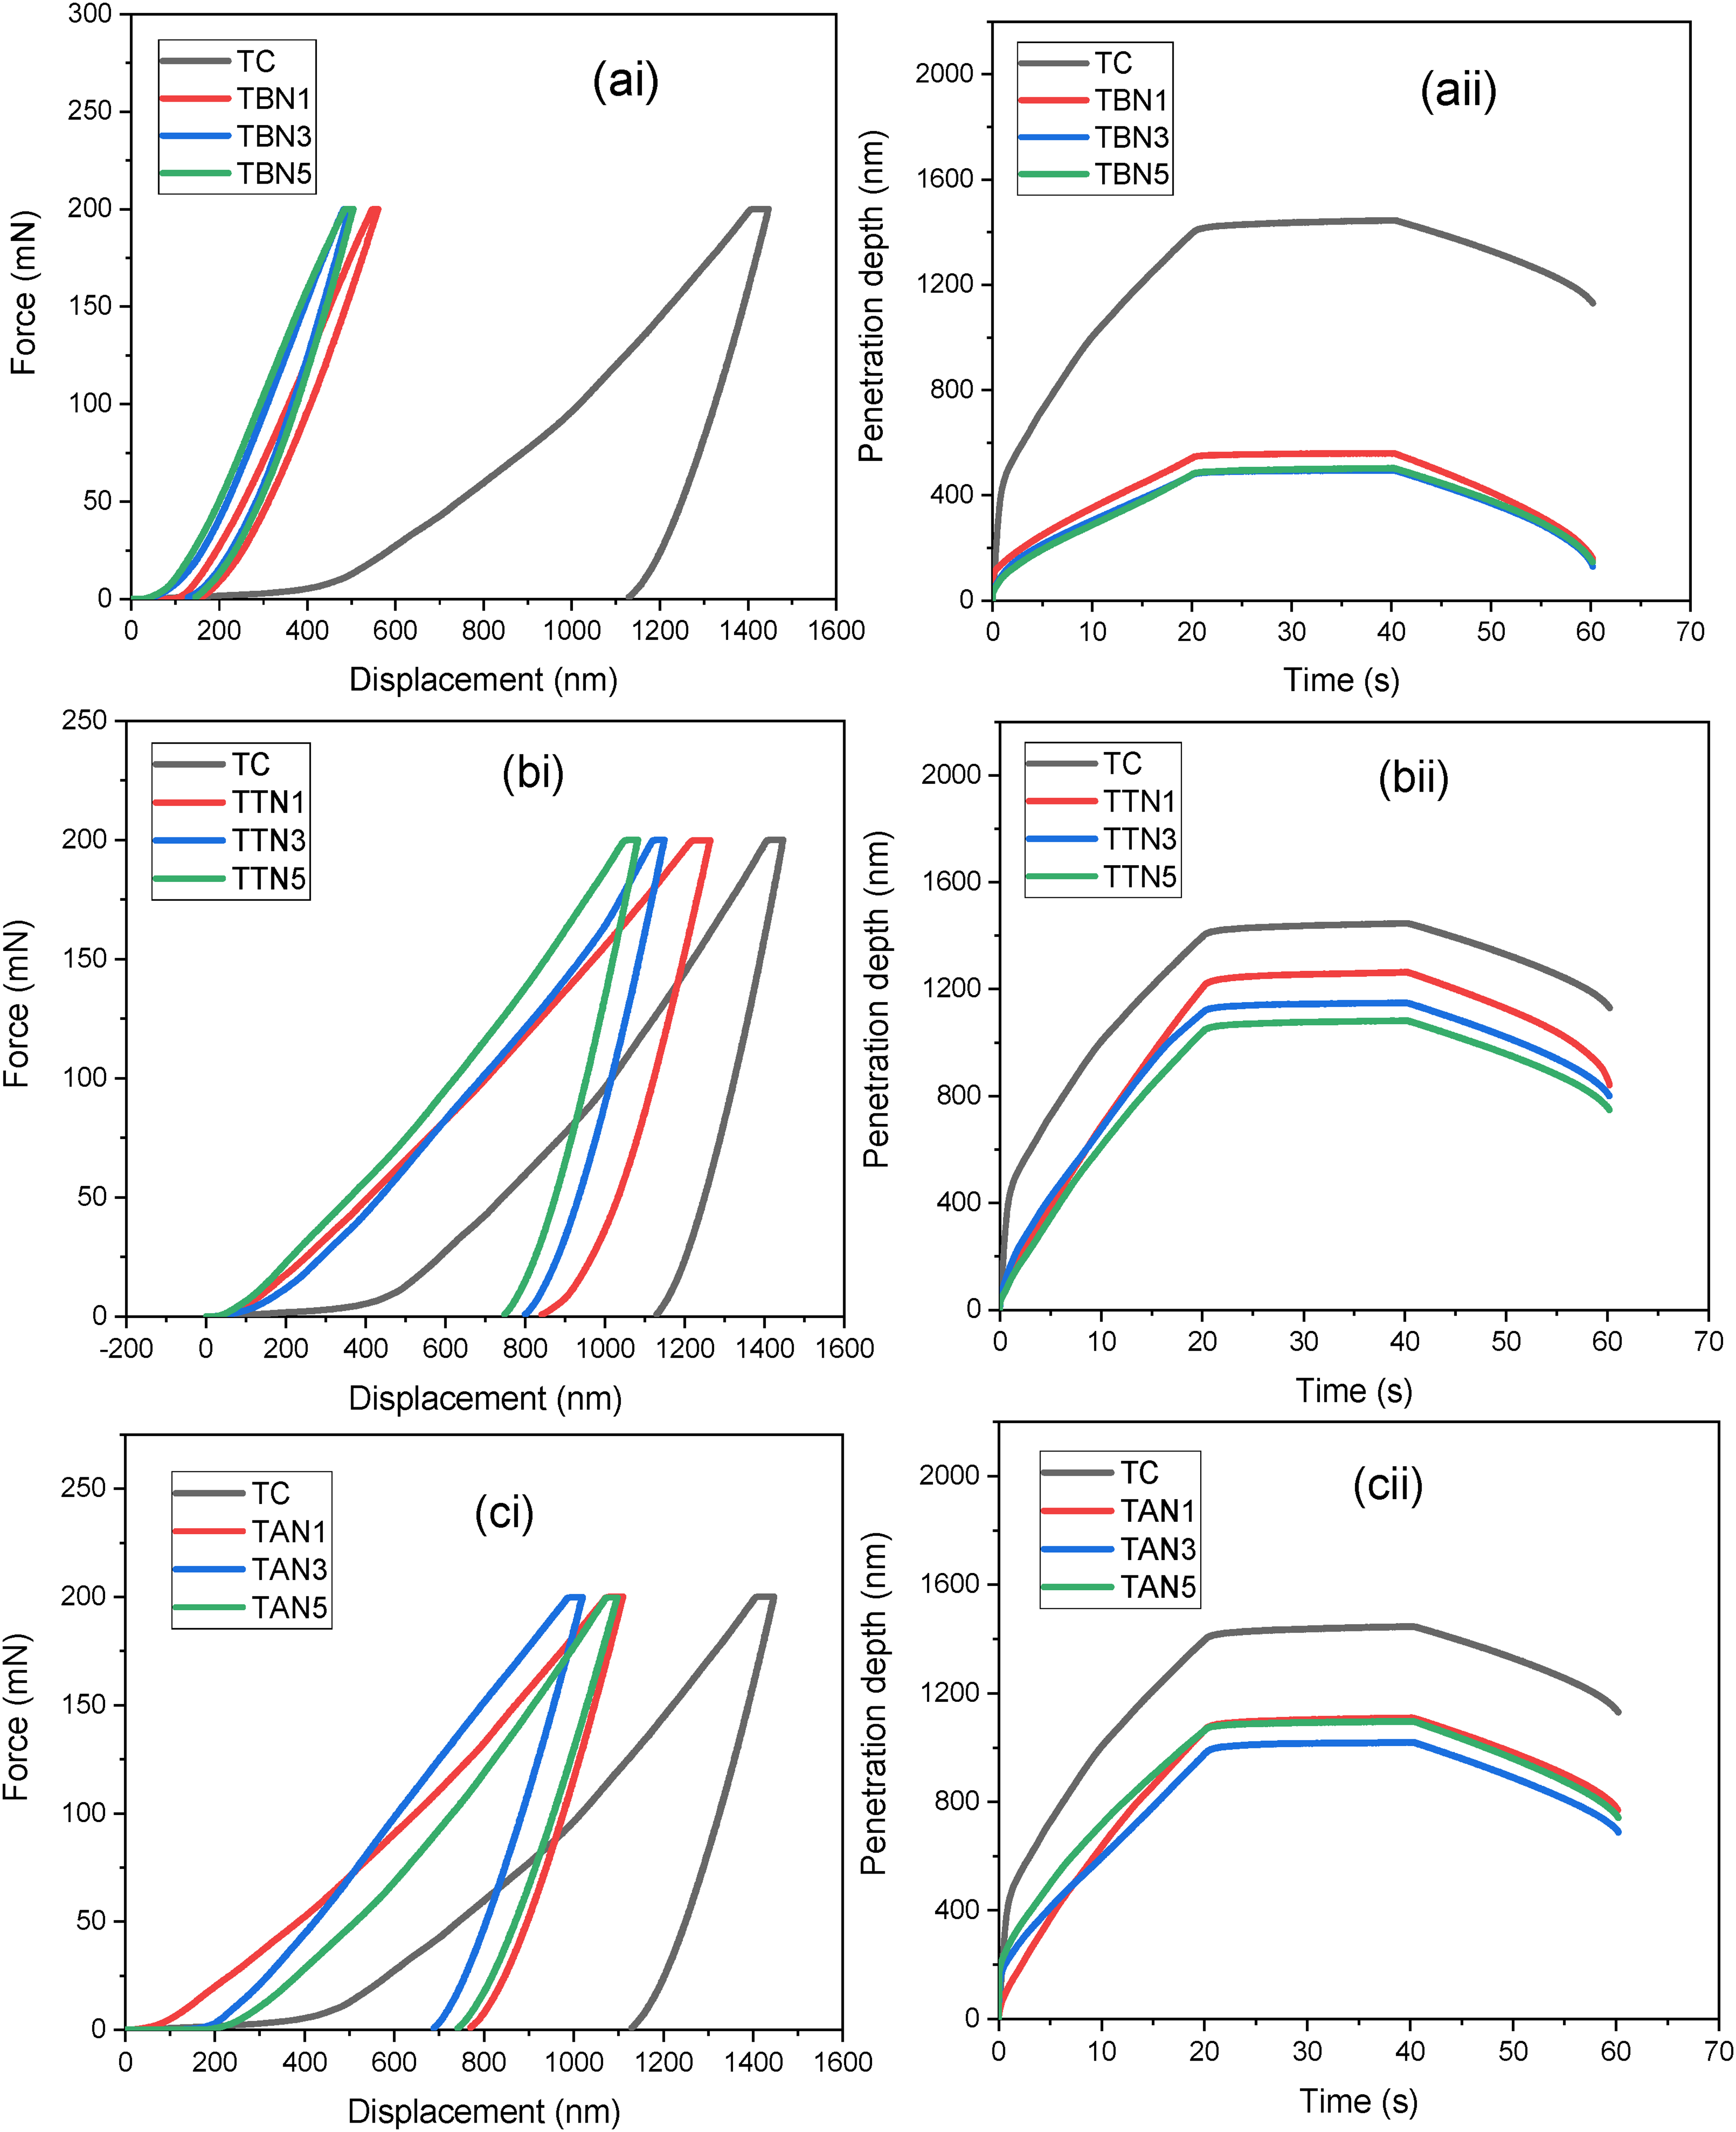
Comparison between load-displacement and penetration depth-time graphs at 200 mN load for: (a) h-BN-reinforced, (b) TiN-reinforced and (c) AlN-reinforced composites.
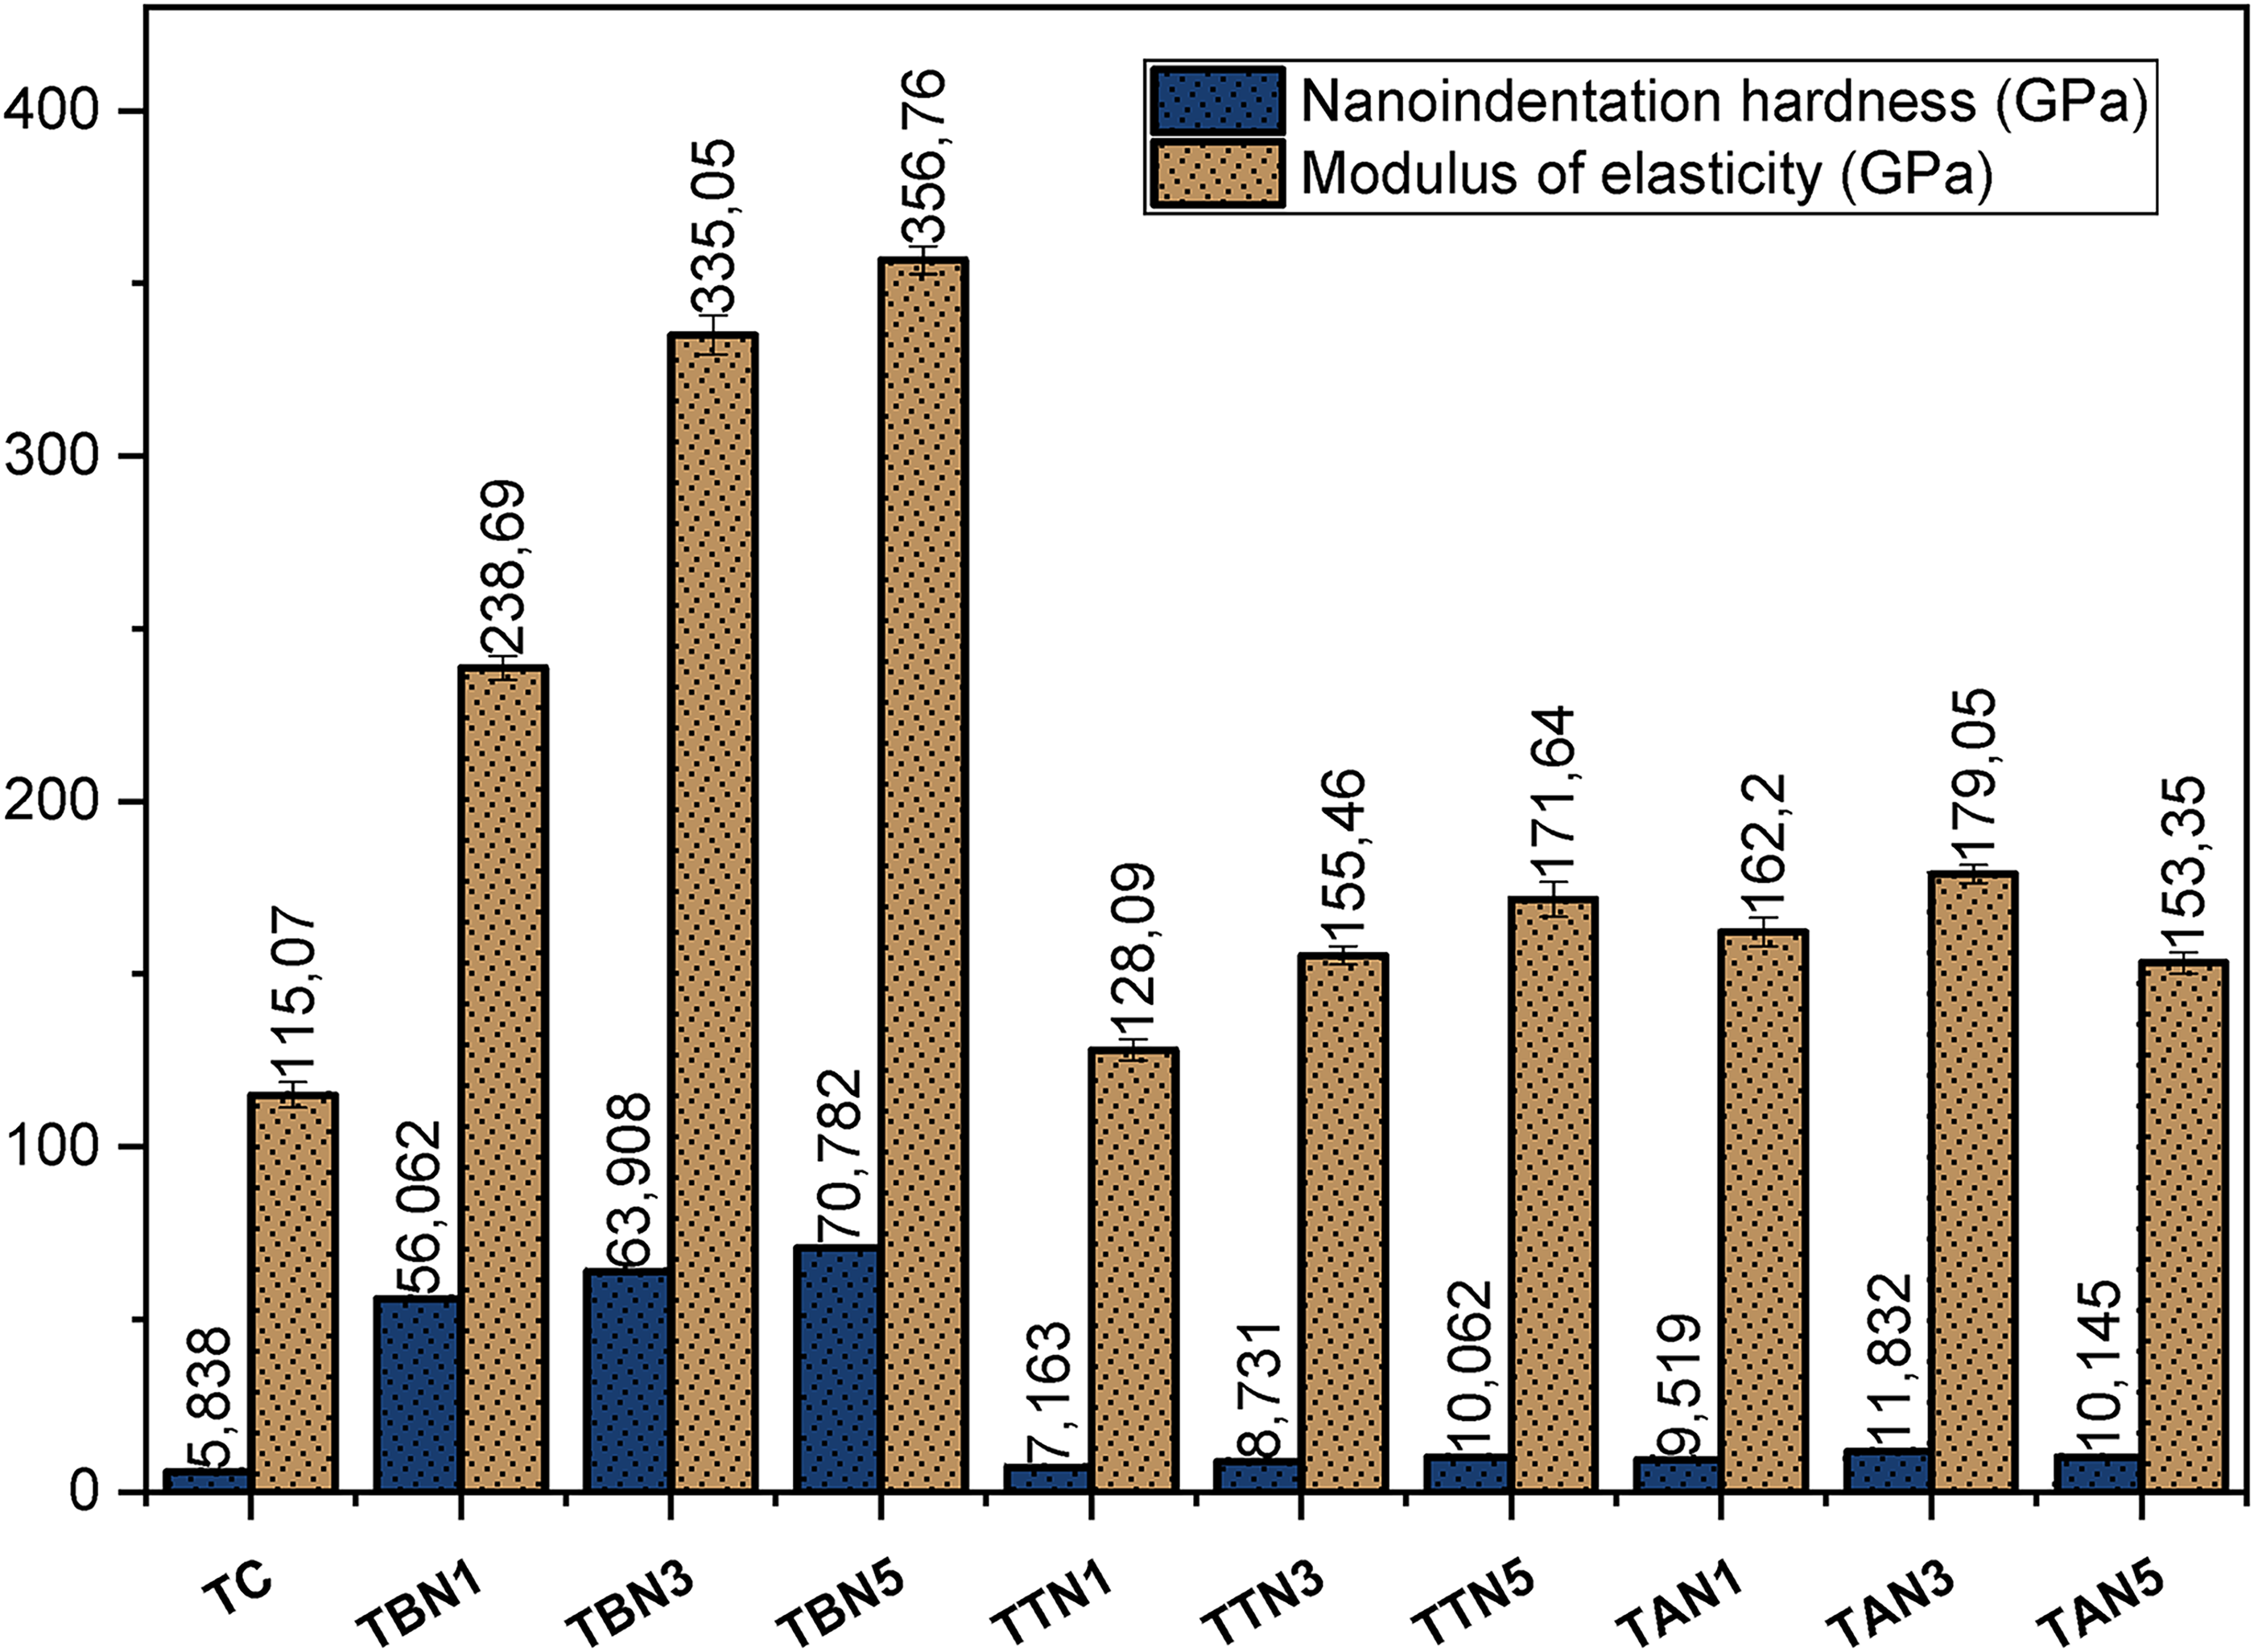
Comparison between nanoindentation hardness and modulus of elasticity values of the sintered materials.
Similar smooth loading and unloading patterns free of pop-in effects can be seen for all investigated samples from the nanoindentation load-displacement graphs in Figure 8(ai), (bi), and (ci); the load-displacement curves exhibit an elastic-plastic deformation behavior. 32 The ductility of the titanium alloy results in a wide region between the loading-unloading curves of the matrix, indicating a high displacement. This observation suggests that the alloy resists plastic deformation marginally. 35 As illustrated in Figure 8(aii) for TBN1, TBN3, and TBN5; Figure 7(bii) for TTN1, TTN3, and TTN5; and Figure 8(cii) for TAN1, TAN3, and TAN5, TC exhibits the maximum penetration depth. This suggests that, in comparison to the reinforced TMCs, the indenter's point penetrates the unreinforced alloy matrix more easily. It is acknowledged in the literature that a correlation exists between the material's hardness and penetration depth observed.22,36 Consequently, the alloy matrix exhibits the lowest nanoindentation resistance and elastic modulus values, measuring 5.838 ± 0.323 GPa and 115.07 ± 3.63 GPa, respectively (see Figure 8).
Furthermore, Figure 8(ai), (bi), and (ci) illustrate that the segments between the loading-unloading curves of the reinforced TMCs are comparatively narrow and exhibit a notable shift to the left. This observation suggests that the reinforcements commendably mitigate displacements resulting from the composites’ load sharing. 37 During this period, as illustrated in Figure 8(aii), (bii), and (cii), there is a notable reduction in the penetration depths of the composites over time. This phenomenon applies universally to all reinforcements, though the extent may differ. In contrast to the maximum penetration depth of 1446.2 nm recorded for TC, TBN1, TBN3, and TBN5 exhibit the most significant decline in their maximum penetration depth profiles, ranging between 494.2 and 560.2 nm and this is followed by TAN1, TAN3, and TAN5 with maximum penetration depth profiles ranging between 1095.1 and 1109.3 nm. TTN1, TTN3, and TTN5 show the lowest resistance to the indentation load and the least maximum penetration depth profile, ranging between 1143.4 and 1263.4 nm aside from TC (1446.2 nm). Notably, the level of resistance demonstrated by the reinforced TMCs against indentation load increases as the refractory nitride reinforcement concentration increases, except for TAN5, which displays a relatively lower resistance to the indentation load with a maximum penetration depth of 1095.1 nm compared to TAN3 with the maximum penetration depth of 1020 nm. This can be attributed to poor densification exhibited by TAN5 mainly due to the inclusion of significant amount of porosities (4.86%) since the reinforcement in particulate form tends to agglomerate at higher concentration.
Moreover, the loading and unloading curves of the TMCs exhibit a steeper slope, which can be rationalized by the significant drop in the original plastic deformation characteristics of the Ti6Al4V alloy due to reinforcement. The slope of the unloading segment of the curve reflects the stiffness of the materials, which shows a strong correlation with its elastic modulus. 37 The load transfer process from the Ti6Al4V alloy matrix to the tougher reinforcement particles is believed to be the main factor contributing to the observed improvements in nanomechanical properties including hardness, stiffness, and elastic modulus.32,38
Specifically, Figure 9 reveals a continuous enhancement in nanoindentation hardness values of TBN1, TBN3, TBN5, TTN1, TTN3, TTN5, TAN1, TAN3, and TAN5 from 8.731 ± 0.244 to 70.782 ± 0.794 GPa and modulus of elasticity values from 128.09 ± 3.11 to 356.76 ± 4.05 GPa in contrast to TC (5.838 ± 0.323 GPa and 115.07 ± 3.63 GPa, respectively). To sum up, it can be said that the value of the nanoindentation resistance of TBN5 (70.782 ± 0.794 GPa) is better than TC by 1112%, about 11% superior to TBN3 (63.908 ± 0.758 GPa), and exceeds TBN1 (56.062 ± 0.562 GPa) by approximately 26% pertaining to h-BN-reinforced TMCs as portrayed in Figure 8. Besides, the nanoindentation hardness value of TTN5 (10.062 ± 0.27 GPa) is better than TC by approximately 72%, about 15% above TTN3 (8.731 ± 0.244 GPa) and exceeds TTN1 (7.163 ± 0.38 GPa) by 41% with respect to TiN-reinforced TMCs as portrayed in Figure 8. Meanwhile, the nanoindentation hardness value of TAN3 (11.832 ± 0.519 GPa) is better than TC by 103%, about 17% superior to TAN5 (10.145 ± 0.376 GPa) and exceeds TAN1 (9.519 ± 0.258 GPa) by approximately 24% with respect to AlN-reinforced TMCs as shown in Figure 8. Zhang, Li & Zhang 39 mentioned that a material's strength and hardness are directly correlated. This suggests that a material with more hardness is likely to have greater strength. Given that the sintered composites in this study exhibit more hardness than the typical Ti6Al4V alloy, it is anticipated that the composites will also have enhanced strength. 40
Likewise, the modulus of elasticity of TBN5 (356.76 ± 4.05 GPa) is better than TC by 210%, approximately 7% more than TBN3 (335.05 ± 5.68 GPa) and exceeds TBN1 (238.69 ± 3.54 GPa) by 50% with respect to h-BN-reinforced composites. The modulus of elasticity of TTN5 (171.64 ± 8.08 GPa) is approximately 49% better than TC, about 10% above TTN3 (155.46 ± 2.66 GPa) and 34% greater than TTN1 (128.09 ± 3.11 GPa) with respect to TiN-reinforced composites. Also, the modulus of elasticity TAN3 (179.05 ± 2.67 GPa) is better than TC by 56%, approximately 17% more than TAN5 (153.35 ± 3.05 GPa) and exceeds TAN1 (162.2 ± 4.14 GPa) by roughly 10% with respect to AlN-reinforced composites. As a result, the nanoindentation hardness and modulus of elasticity exhibited a similar pattern of improvement, indicating that these two nanomechanical entities are in mutual proportion for the analyzed samples. This is consistent with the trend of results reported by Alaneme et al. 22 and Madeira et al., 35 who worked on similar materials using nanoindentation techniques. Furthermore, it is noteworthy that the results of the nanoindentation test indicate that the various reinforcement additions, along with the efficacy of the SPS process, have produced a significant advancement in the Ti6Al4V alloy matrix's nanomechanical properties (modulus of elasticity and hardness). This improvement is primarily ascribed to the transferring of load from the softer matrix to the reinforcing particles, which are tougher and strong particle-matrix bonding.22,41
Additional analysis of the mechanical characteristics (elastic and plastic deformation) of TC, TBN1, TBN3, TBN5, TTN1, TTN3, TTN5, TAN1, TAN3, and TAN5 under indentation load was considered from the nanoindentation test results by assessing the elastic recovery index and the plasticity index. Figure 10 shows the elastic recovery and plasticity indices of the sintered materials. It is observed that TBN1, TBN3, and TBN5, exhibit the highest set of elastic recovery indices, followed by TAN1, TAN5, and TAN3 and TTN1, TTN3, and TTN5, in that order, while the lowest elastic recovery index is exhibited by TC. It is noteworthy that the elastic recovery index demonstrates significant improvement primarily with an increase in reinforcement content within the composite materials. On the other hand, the plasticity index results obtained demonstrated exactly the opposite to the elastic recovery index, that is, TBN1, TBN3, and TBN5, exhibit the lowest set of plasticity indices, followed by the TAN1, TAN5, and TAN3, and TTN1, TTN3, and TTN5, respectively, while the highest plasticity index is exhibited by TC. Besides, the plasticity index declines mostly with increasing reinforcement contents for the reinforced composites. According to Alaneme et al. 22 and Okoro et al., 32 the elastic recovery index and plasticity index quantify the ratio of recoverable deformation and permanent deformation, respectively, following the indentation load removal. The data, therefore, indicate that TC with the highest plasticity index value undergoes the most substantial permanent deformation. On the contrary, the composites with elevated elasticity recovery index values demonstrate superior elastic recovery following the indentation load removal. This further supports the idea that the presence of hard nitride reinforcements boosted the plastic deformation resistance shown by the composites. As a result, the nanoindentation hardness, elastic modulus, and elastic recovery index values of both the sintered materials understudied in this work are directly proportional, comparable to the trend of results documented by Okoro et al. 32 and Hynowska et al. 41 who investigated similar materials using nanoindentation techniques.
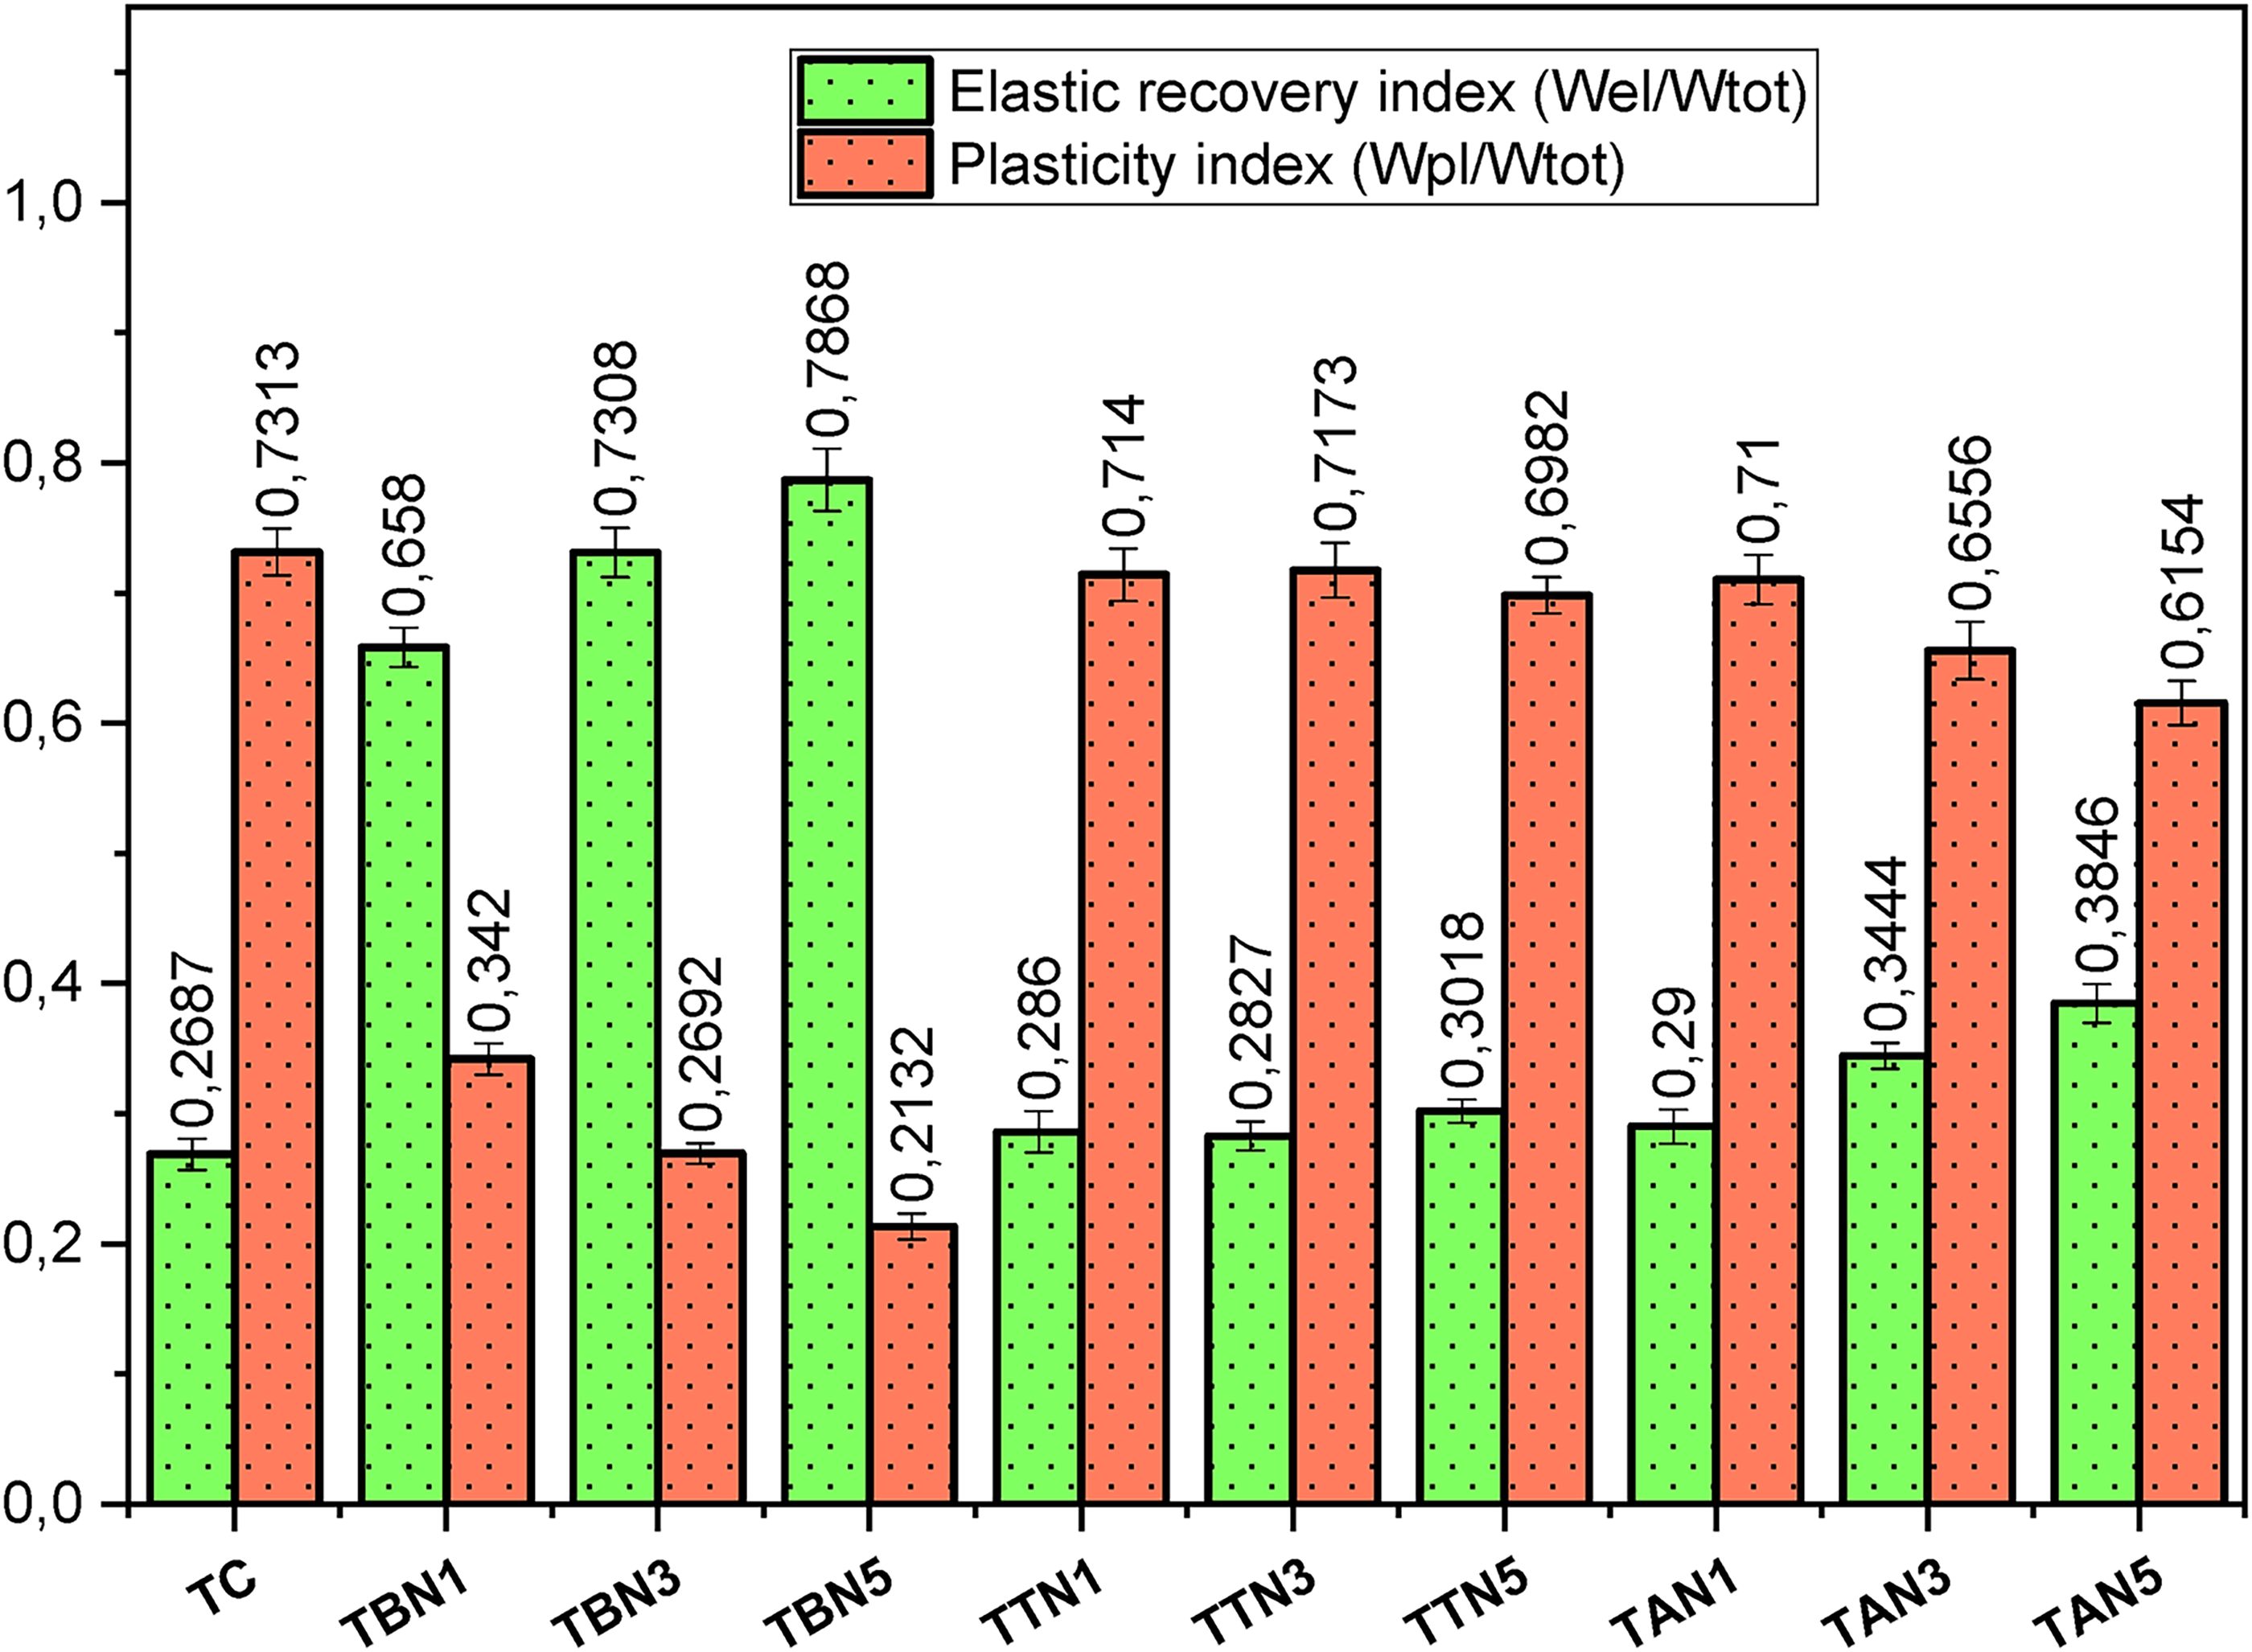
Comparison between elastic recovery and plasticity indices of the sintered materials.
The effects of different reinforcements comprising 1, 3, and 5 wt. % each of h-BN, TiN, and AlN nanoparticle on the hardness performance of the developed Ti6Al4V matrix composites have been evaluated in the previous section. According to Alizadeh and Taheri-Nassaj, 42 the wear properties of materials are believed to be significantly influenced by their hardness. Therefore, the specific wear rates and instabilities in the COF of TC, TBN1, TBN3, TBN5, TTN1, TTN3, TTN5, TAN1, TAN3, and TAN5 are examined in this section.
The comparison between the specific wear rates of the reinforced composites under 5N, 10N, and 15N applied loads, and the unreinforced alloy is represented in Figure 11. The findings indicate that TC exhibits greater specific wear rates at applied loads of 5N (3.391 ± 0.141 × 10⁻⁴ mm3/Nm), 10N (7.272 ± 0.32 × 10⁻⁴ mm3/Nm), and 15N (8.25 ± 0.304 × 10⁻⁴ mm3/Nm) compared to the composites, which are explained by their superior hardness profiles as covered in the previous section. This corroborates the report by Rohatgi et al., 43 which says, under identical frictional conditions, soft materials often experience greater wear than their harder counterparts.
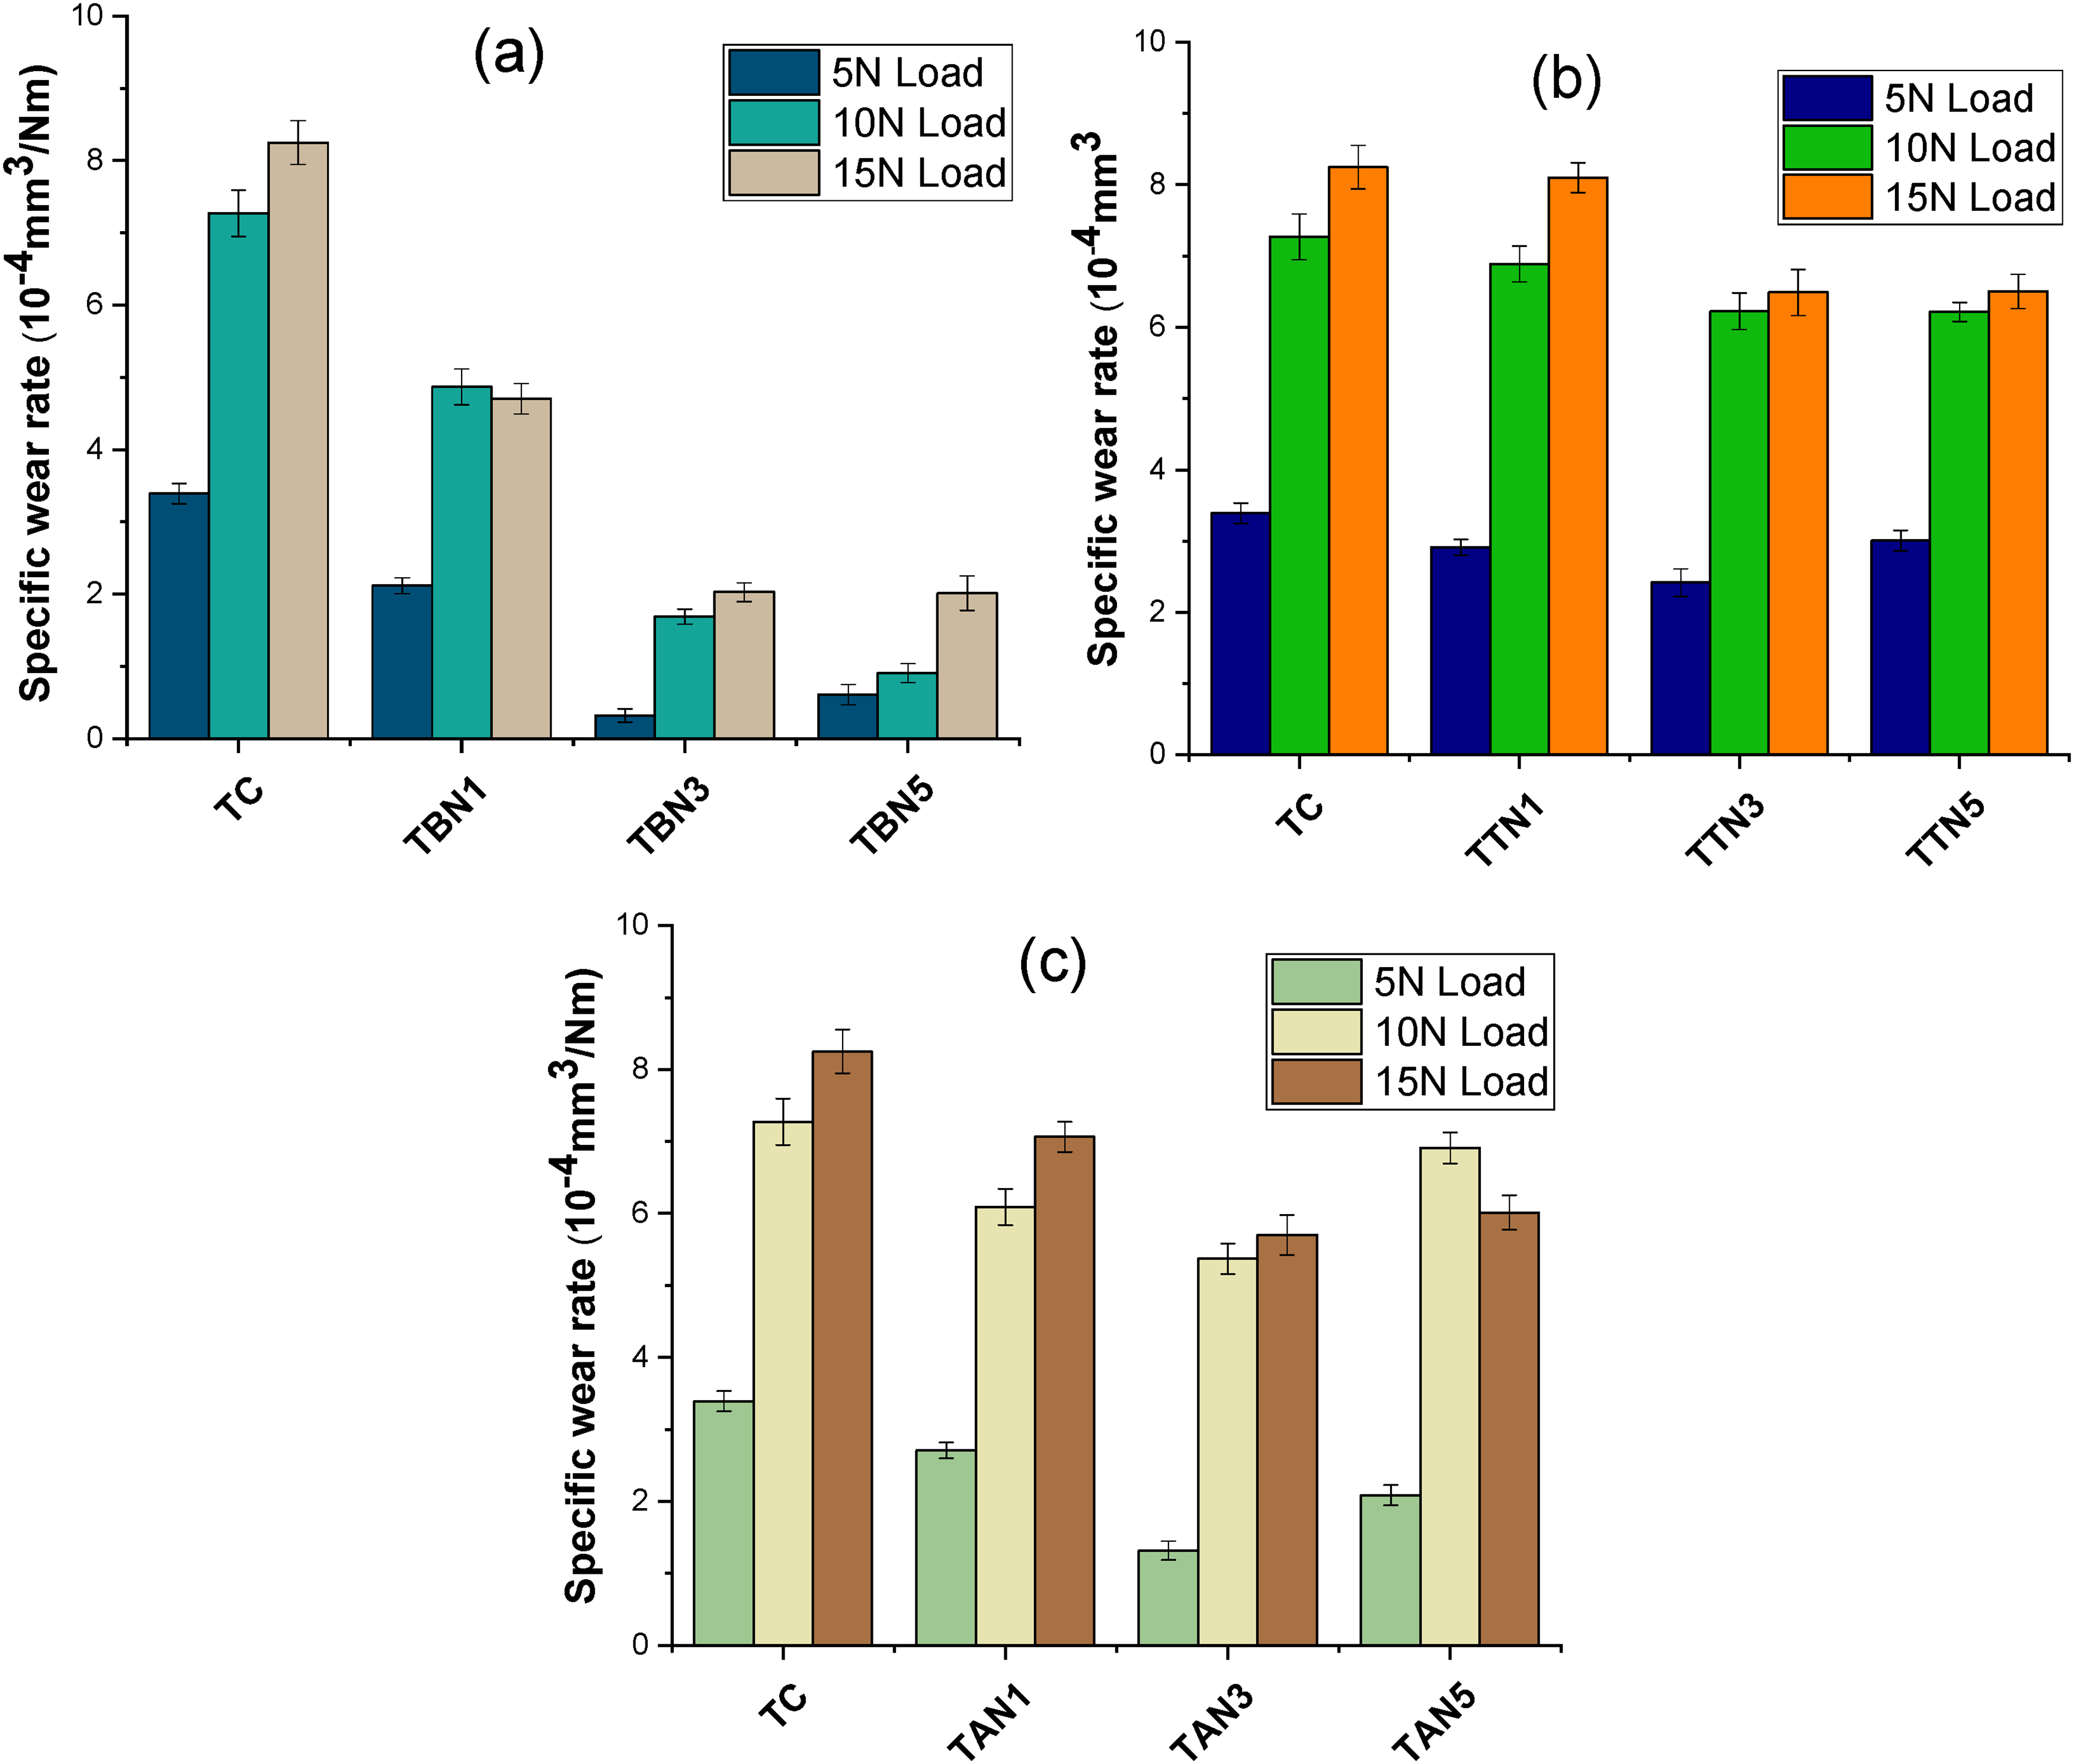
Graphs of the specific wear rates at applied loads of 5N, 10N and 15N for: (a) TC, TBN1, TBN3, and TBN5, (b) TC, TTN1, TTN3, and TTN5, and (c) TC, TAN1, TAN3, and TAN5.
The wear rates of the composites exhibit a predominantly linear increase with the load, ranging from 5N to 15N, as illustrated in Figure 11. A significant variation is noted in TTN5 and TAN5, wherein the specific wear rates decrease from 10N (5.976 ± 0.134 × 10⁻⁴ mm3/Nm) to 15N (5.408 ± 0.24 × 10⁻⁴ mm3/Nm) for TTN5 and from 10N (6.9076 ± 0.215 × 10⁻⁴ mm3/Nm) to 15N (6.0128 ± 0.304 × 10⁻⁴ mm3/Nm) for TAN5. These discoveries are consistent with the research conducted by Rabinowicz, 44 which confirmed that even tiny variations in friction could result in significant variations in the degree of material wear. The results indicate that TC has experienced significant plastic deformation in the contact region due to the combined effects of shear and compression stresses, leading to considerable wear. The worn material's surface inclines to be rough, which exposes the layers protecting the surface to severe damage. 45
Abkari et al.
46
give a possible explanation behind the significantly less wear observed with the composites, which is mainly due to the introduction of harder reinforcement phases encompassing 1, 3, and 5 wt. % of h-BN, TiN, and AlN nanoparticles. These constituent phases also reduce the ductile nature of TC in the contact region. Furthermore, the wear rate shows a direct proportionality to the applied stress while demonstrating an inverse proportionality to the hardness, consistent with the established linear Archard's wear law represented by equation (5).
42

Figure 12 exemplifies the changes in the COF throughout the friction process, highlighting the fluctuations of COF among the TC and each category of reinforcement, including h-BN-reinforced, TiN-reinforced, and AlN-reinforced composites (applied load of 10N). Meanwhile, Figure 12 compares the average COF for TC and the reinforced composites under applied loads of 5N, 10N, and 15N. The observable fluctuations in COF values during the running-in phase differ in magnitude across the samples being compared, as shown in Figure 12. TC demonstrates the greatest COF during the running-in phase and maintains this level after achieving a steady state, approximately at 50 s. The lowest COF was observed in the h-BN-reinforced composites during the running-in period. Simultaneously, a decrease was noted in the fluctuation patterns of TBN1 and TBN3, whereas TBN5 exhibited consistent behaviour throughout the steady-state period. The TiN-reinforced composites exhibit an average COF during the running-in period compared to other materials. Fluctuations in COF demonstrate consistency during the steady-state period, followed by a progressive increase until the conclusion of the wear test. The fluctuation patterns of the AlN-reinforced composites are similar to those of TC for the running-in and steady-state periods, though TAN3 exhibits a reduced magnitude while TAN5 even shows a lesser magnitude.28,36
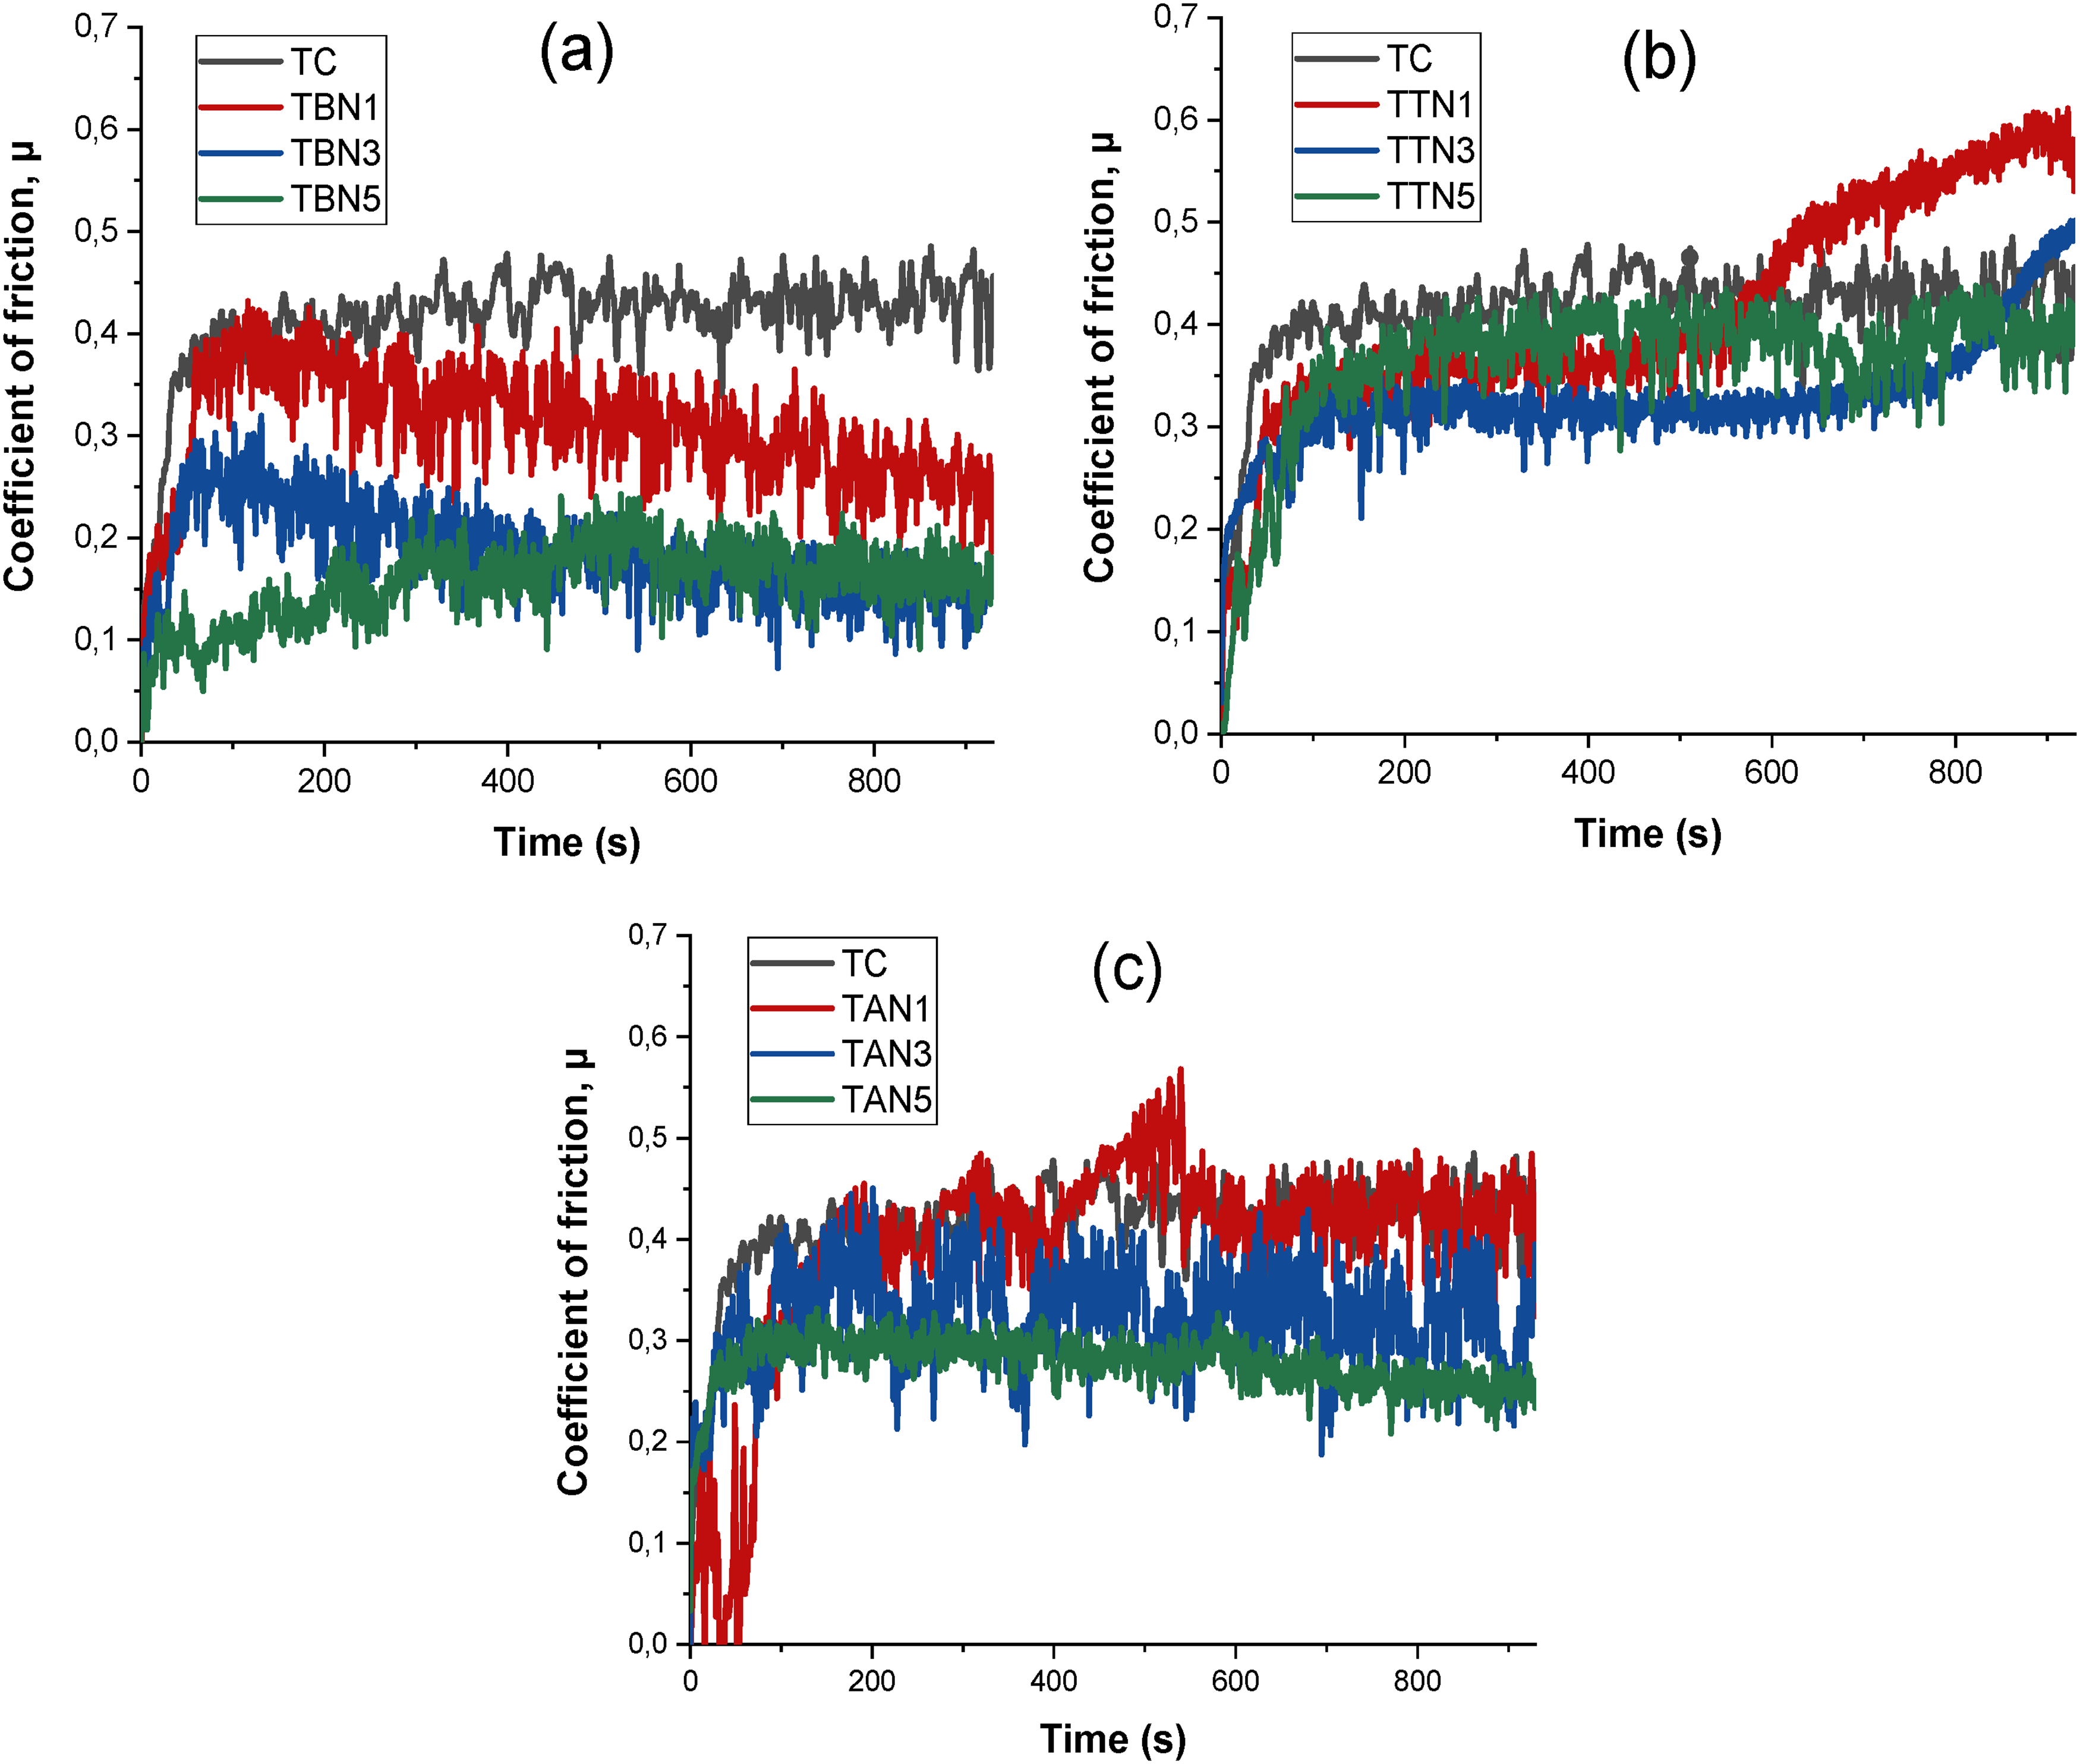
Fluctuations of the COF under 10N applied load: (a) TC, TBN1, TBN3, and TBN5, (b) TC, TTN1, TTN3, and TTN5, and (c) TC, TAN1, TAN3, and TAN5.
In Figure 13, it can be noticed that the average coefficient of friction (COF) for the reinforced composites is generally lower than that of TC at the onset of the frictional process, even as the applied normal load increases. Figure 12 further reveals that the average COF for TC varies from 0.28 ± 0.017 to 0.5 ± 0.02. In contrast, the average COF for TBN1, TBN3, and TBN5 ranges from 0.08 ± 0.011 to 0.32 ± 0.013; for TTN1, TTN3, and TTN5, it spans from 0.25 ± 0.012 to 0.46 ± 0.008; and for TAN1, TAN3, and TAN5, it falls between 0.22 ± 0.013 and 0.43 ± 0.01, as the applied load increases from 5N to 15N, respectively. The results indicate that TTN1, TTN3, and TTN5 exhibit the highest range of COF values following TC, while TAN1, TAN3, and TAN5 are in the middle range, and TBN1, TBN3, and TBN5 display the lowest values. The low coefficient of friction (0.08) of TBN3 under a 5N applied load shows the composite's excellent lubricity, attributed to the inherent lubricious features of the h-BN nanoparticles. 45
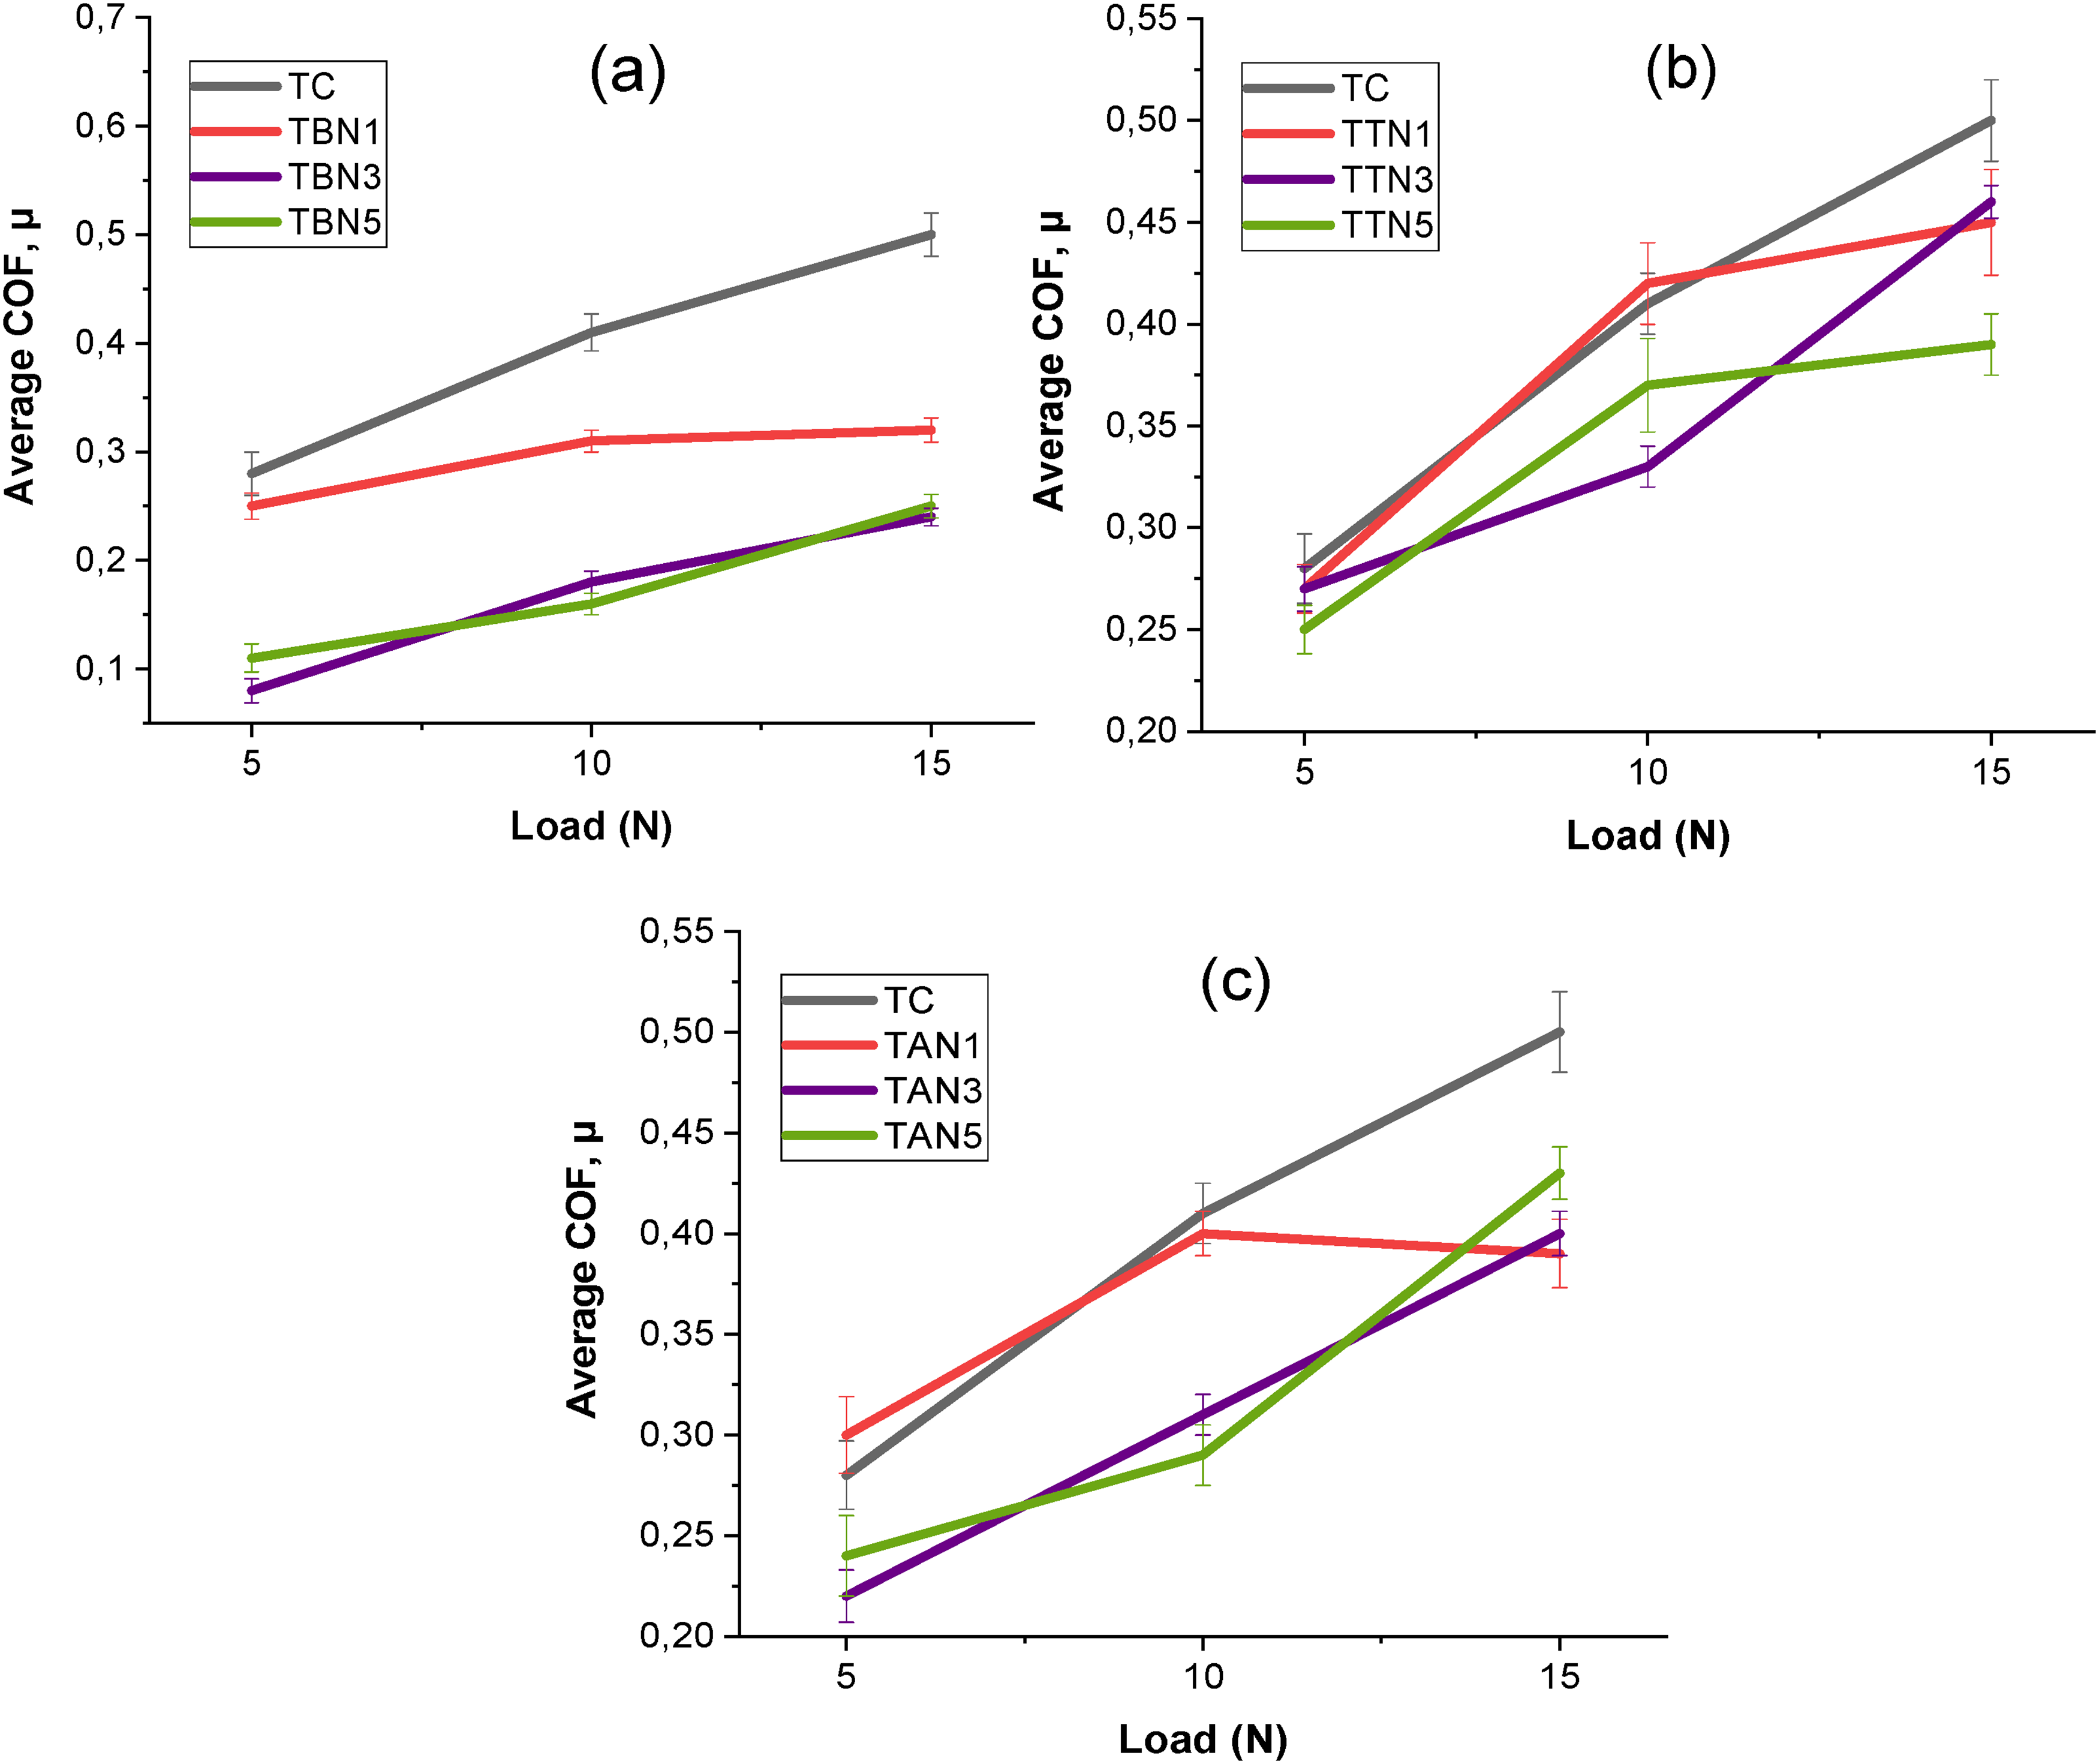
Comparison of the average COF under applied loads of 5N, 10N, and 15N for: (a) TC, TBN1, TBN3, and TBN5, (b) TC, TTN1, TTN3, and TTN5, and (c) TC, TAN1, TAN3, and TAN5.
Additionally, it may be inferred that the COF is typically associated with the basic asperity-counter body interaction, which, on the microscale, tends to vary within a specific range upon experimentation. According to Akbari et al., 46 this is the primary cause of the various COF changes that are observed over time for each of the composites. Furthermore, by supporting the applied load, the hard constituent reinforcing phases in the composites help in limiting the point of interaction between the opposing bodies and the ball, which lowers the COF and lessens undue abrading and incising the surface of the material. This essentially explains a significant contributing factor to the improvement in the materials’ wear rates.
As a sequel to the wear experiment, SEM was utilized to examine the worn surfaces of the samples, as embodied in Figure 14. The pure Ti6Al4V alloy demonstrates a lower hardness value than the composites, resulting in wear tracks characterised by deep ploughing grooves and wear debris, as presented in Figure 14(a), owing to the abrasive action of the counter body. This affirms the comparatively higher specific wear rate of the pure alloy (Figure 11). Consequently, abrasive wear, which arises from plastic deformation and micro-cutting of the ductile alloy resulting from the interaction between the sample and the counter body, appears to be the main wear mechanism in the pure Ti6Al4V alloy.46,47 The frictional force between the two surfaces intensifies as a result of unlubricated contact, leading to considerable surface degradation caused by inadequate resistance to adhesive wear. Concurrently, increased temperatures and the production of loose wear debris further intensified the wear process. The escalation of sliding resulted in a subsequent rise in temperature, causing the wear debris to work-harden and fuse onto the wear track surface of the pure alloy. 48
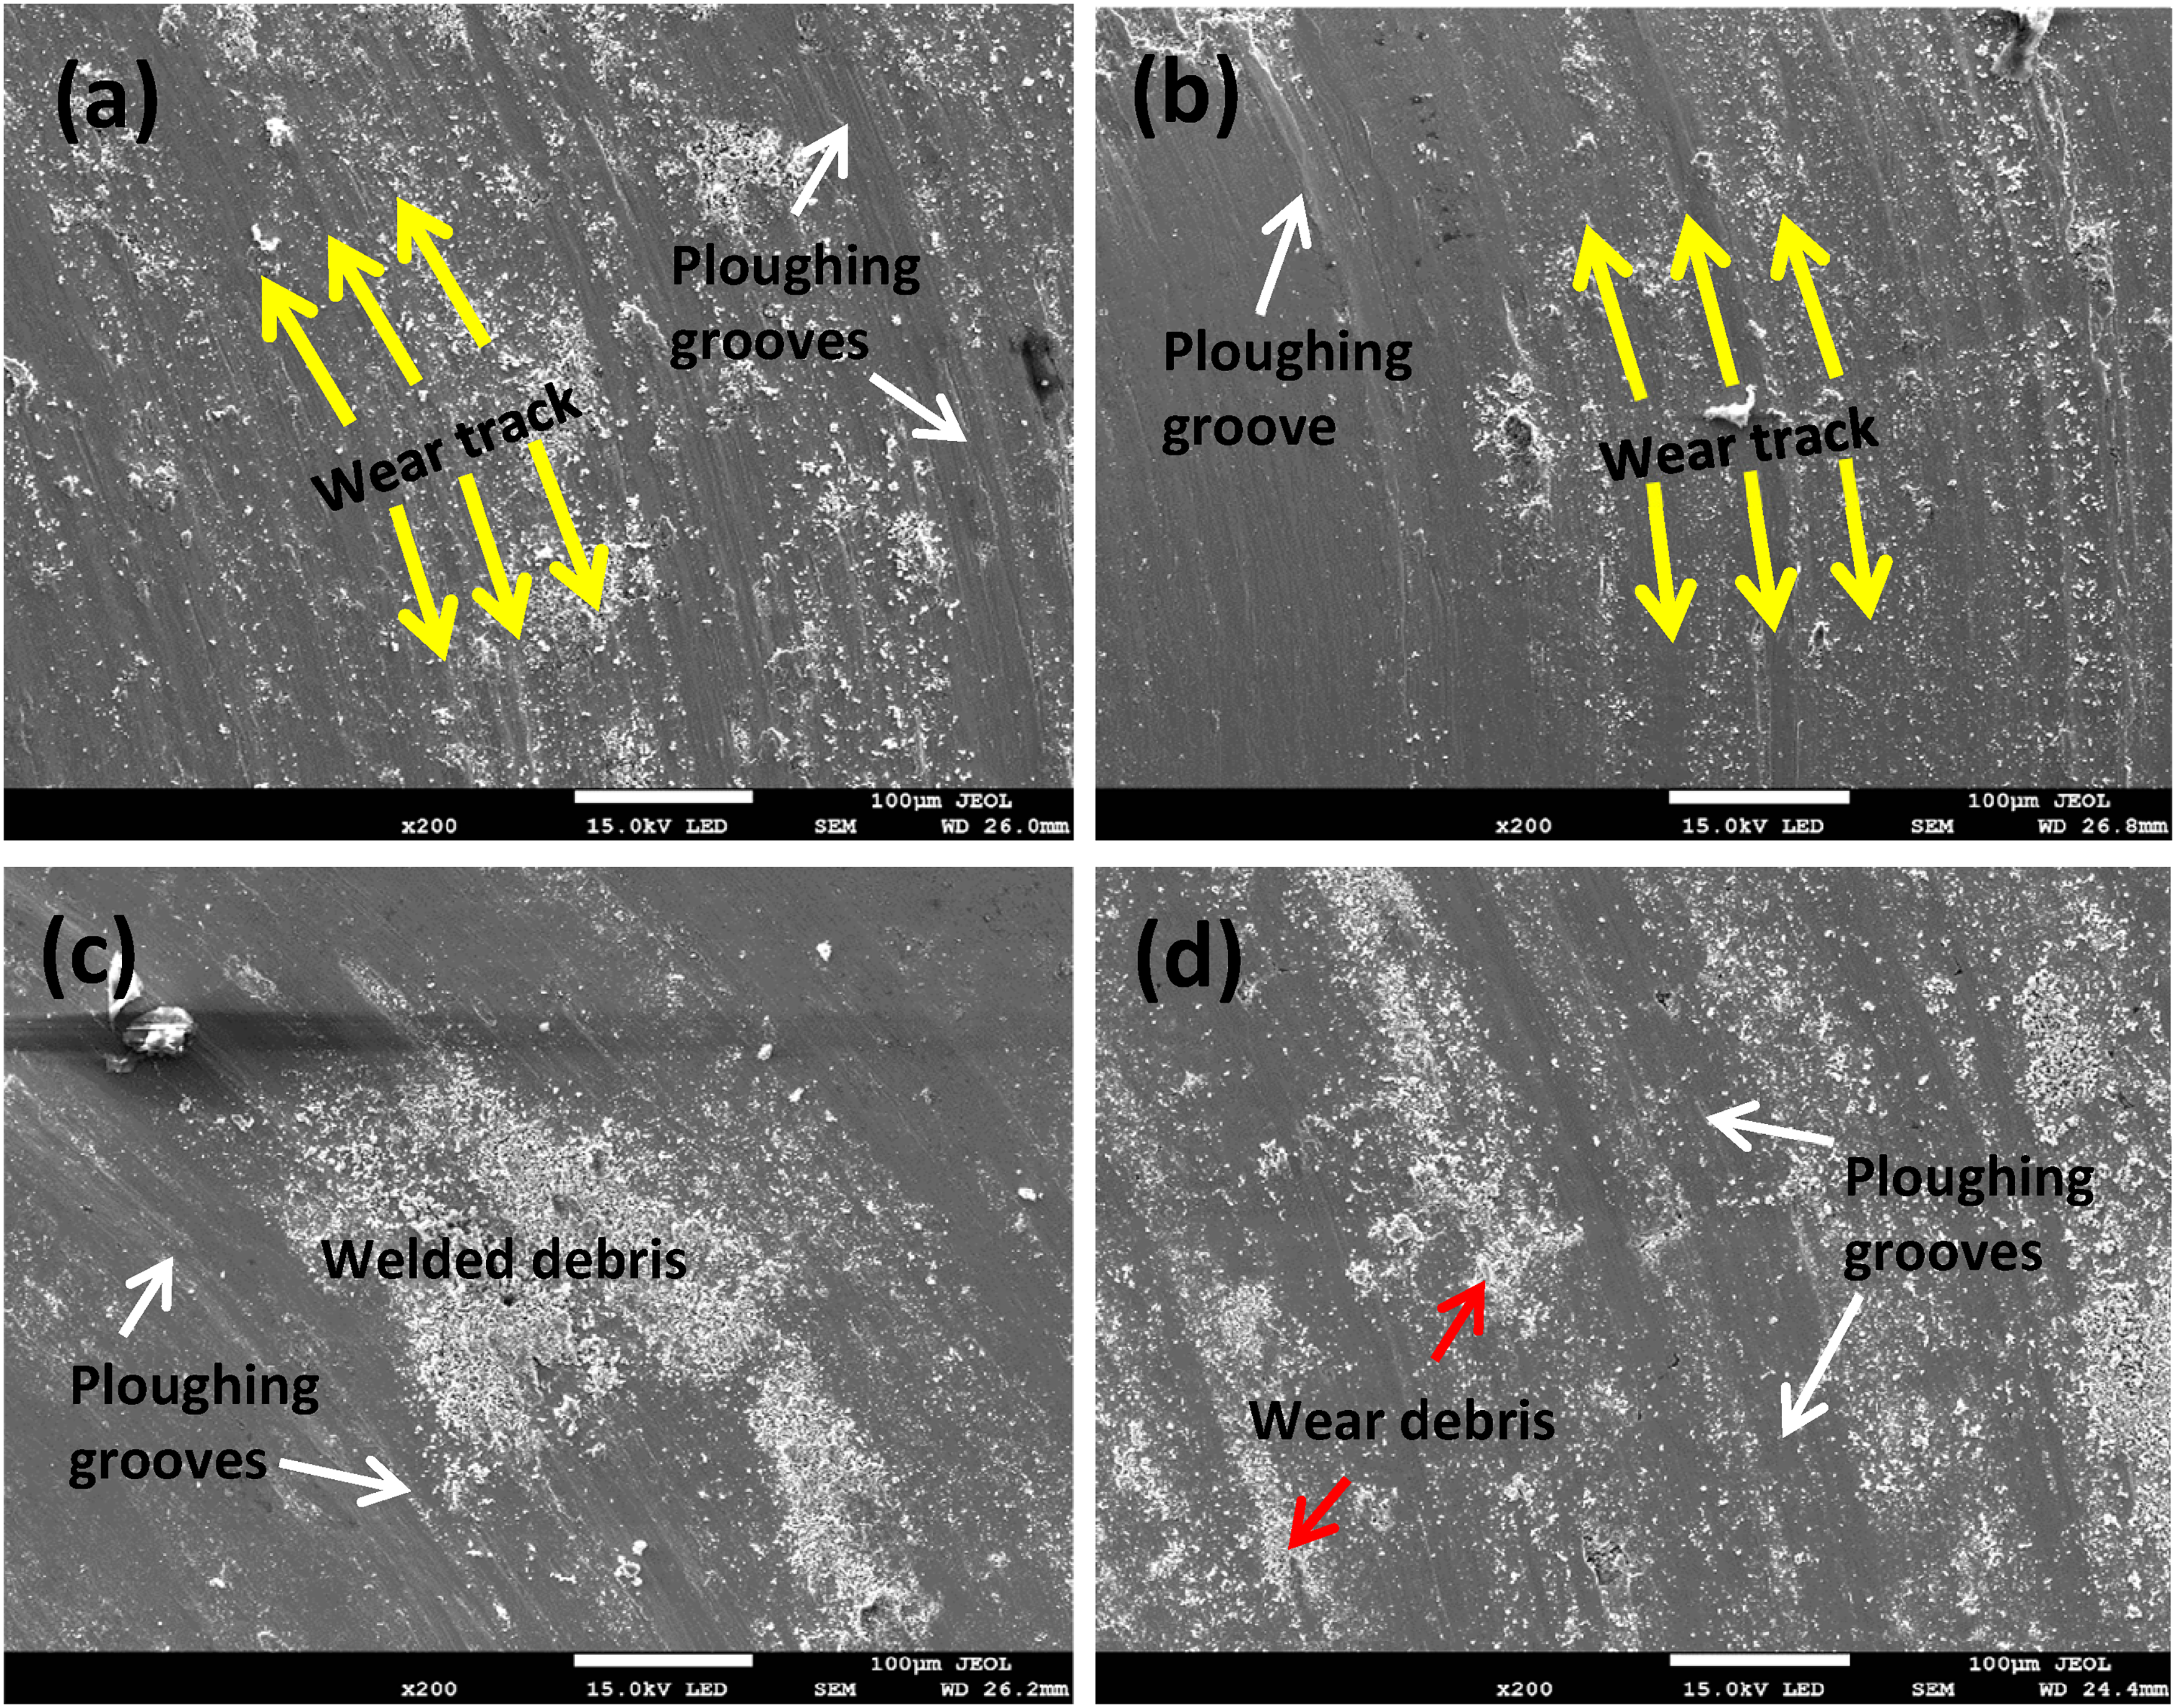
SEM micrographs of the worn surfaces under applied load of 10N: (a) Ti6Al4V alloy (b) h-BN-reinforced (c) TiN-reinforced and (d) AlN-reinforced spark plasma-sintered Ti6Al4V-based composites.
Furthermore, there is a noticeable reduction in the quantity of ploughing grooves having shallow-depths and wear debris when h-BN reinforcement is integrated into the alloy matrix (Figure 15(b)). Figure 14(c) depicts wear tracks characterised by distinct ploughing grooves and coalesced residual welded debris in comparison to the pure alloy. The structural view of the collected wear and welded debris and the wear processes of the composites illustrated in Figure 14(c) and (d) bear resemblance to those of the pure alloy, suggesting that abrasive and adhesive wear typically emerge as the predominant wear mechanisms. The increased hardness of the composites indicates a remarkable resistance against ploughing by the counter body, resulting in reduced specific wear rate of the composites observed (Figure 11). This suggests that the constituent secondary phase particles are influential in the determination of the size and morphology of wear debris, as demonstrated by the enhanced resistance to wear demonstrated by the refractory nitride-reinforced composites developed in this study. Moreover, it is essential to emphasize that the notable improvement in wear resistance demonstrated by the h-BN-reinforced TMCs, in contrast to their counterparts, may be attributed to their enhanced and comparatively superior hardness properties and the self-lubricating nature of h-BN phase particles, as similarly observed by Nsiah-Baafi et al., 49 Falodun et al., 36 and Dai, Li, and Zhang, 50 who investigated analogous materials employing ball-on-disk wear methodologies.
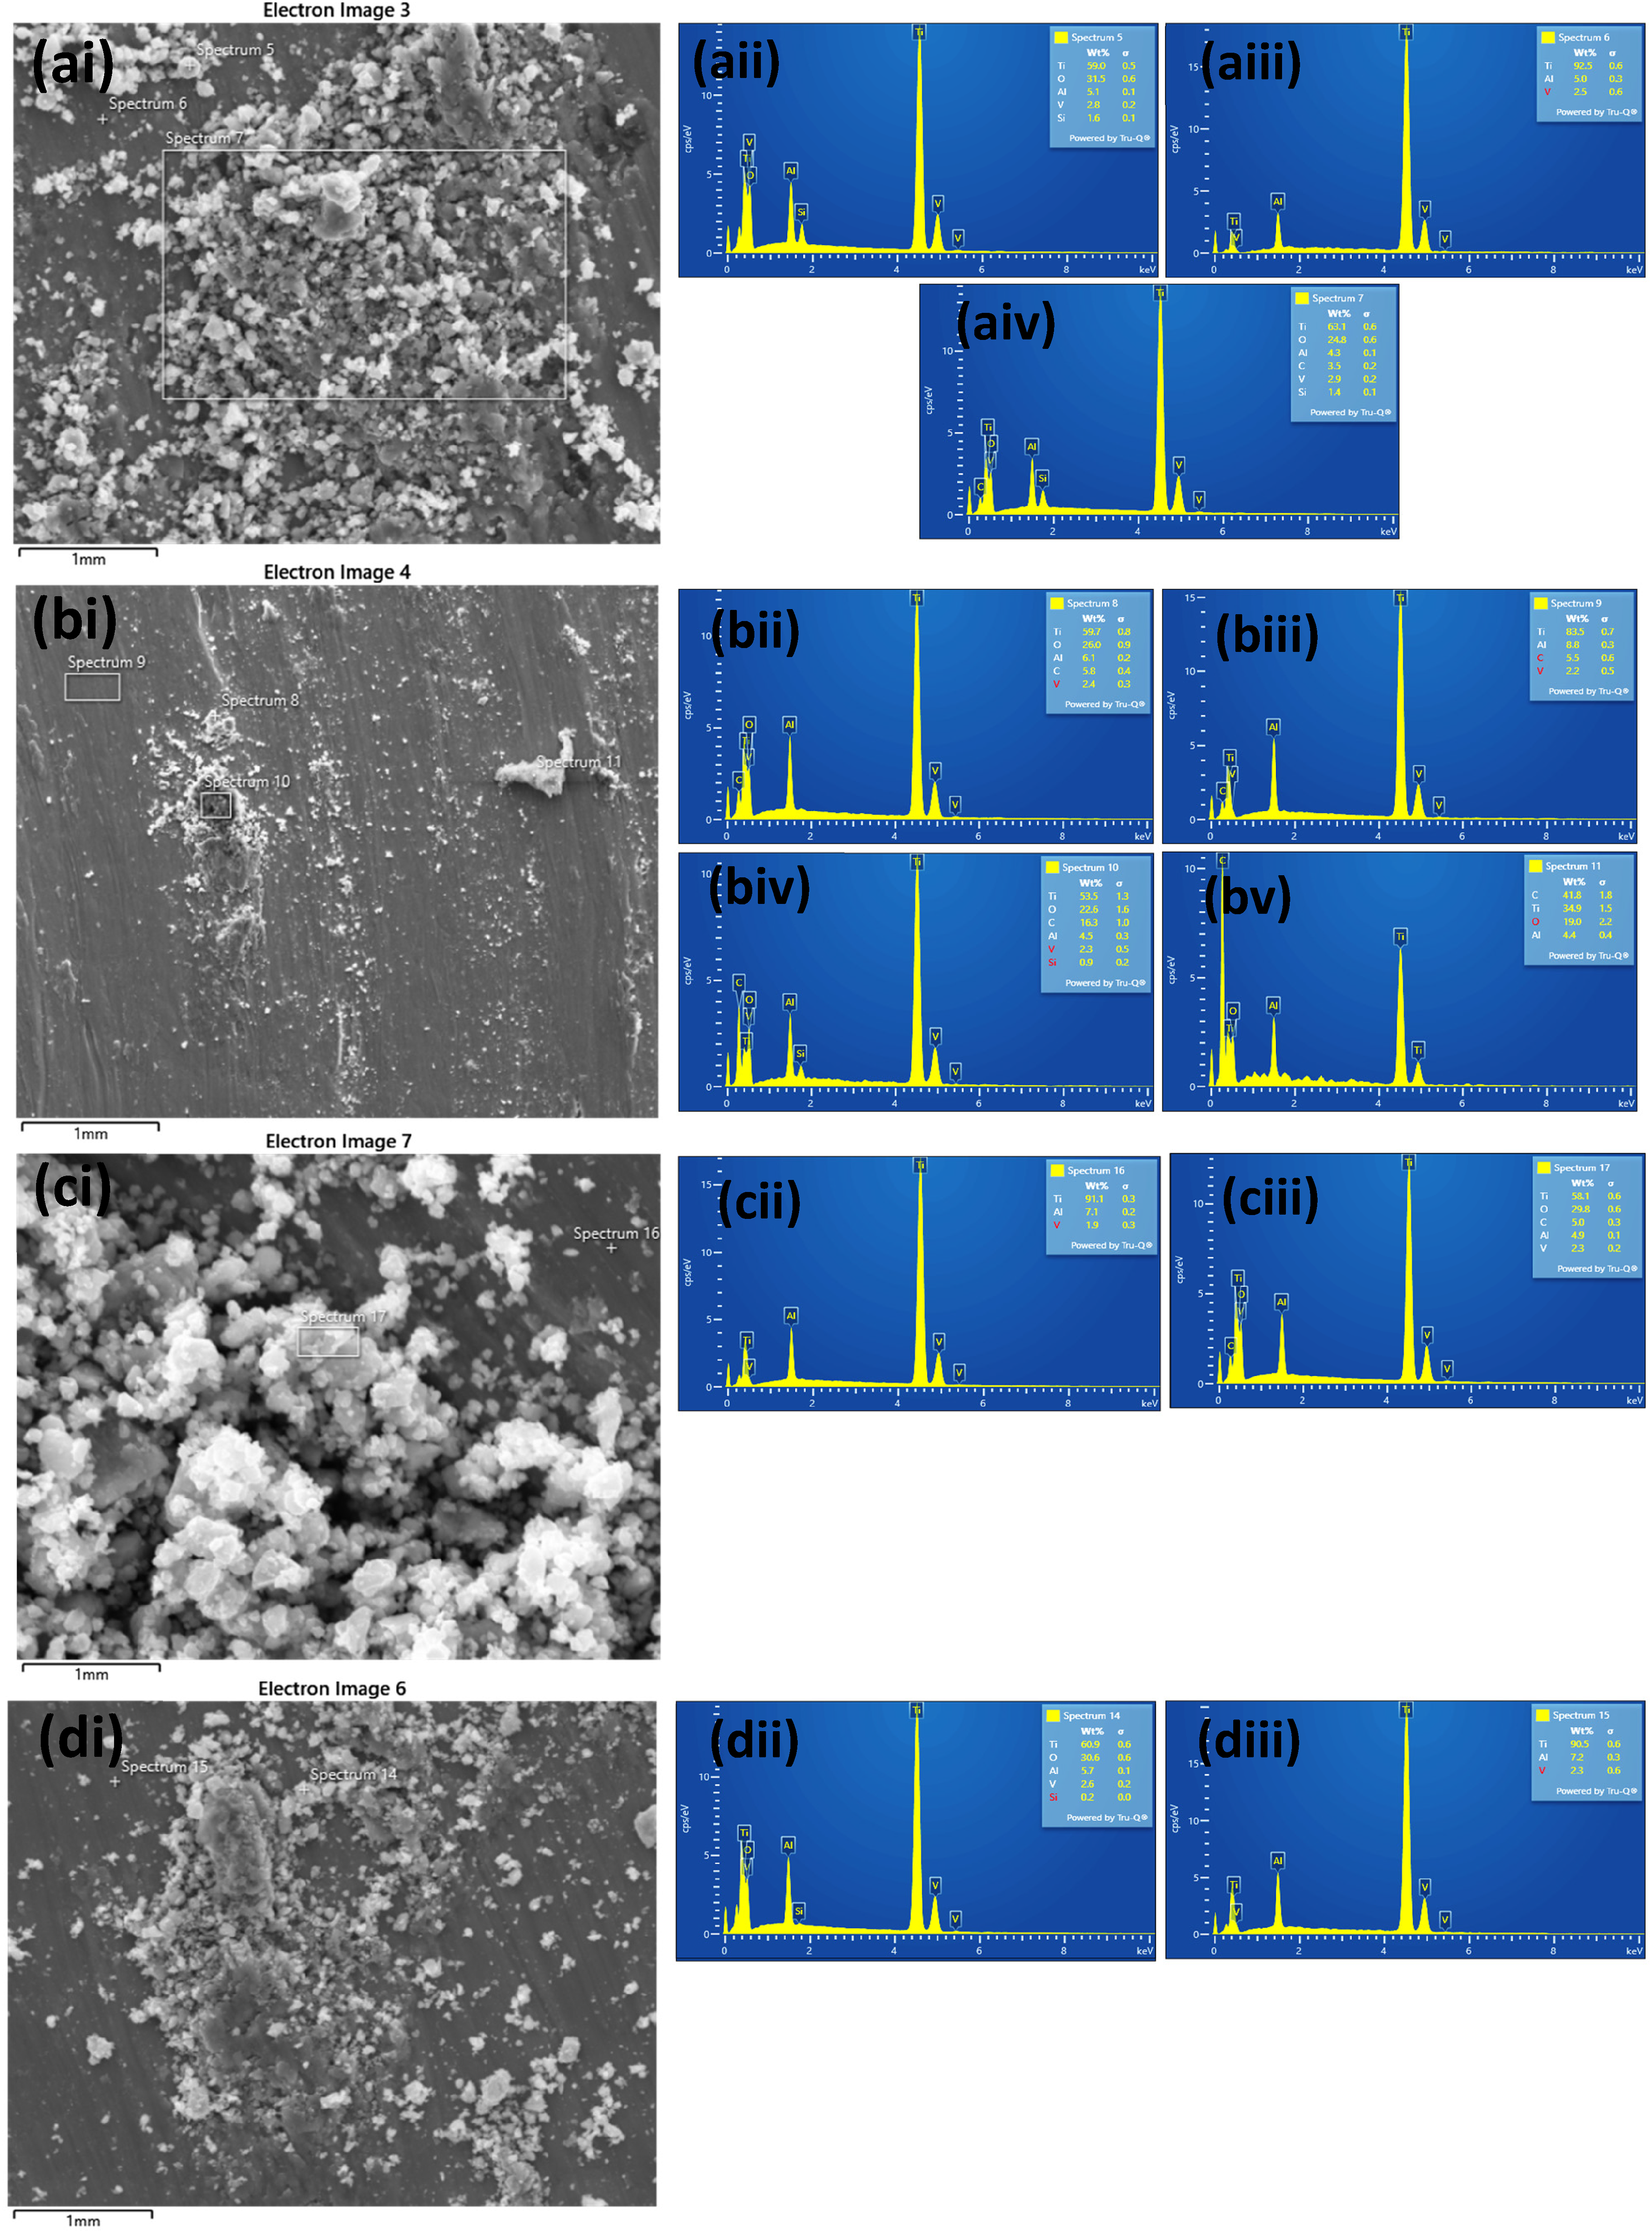
EDS analysis of the worn surfaces under applied load of 10N: (a) Ti6Al4V alloy (b) h-BN-reinforced (c) TiN-reinforced and (d) AlN-reinforced spark plasma-sintered Ti6Al4V-based composites.
The mechanism governing the wear of the sintered materials was further examined by assessing the elemental composition on the worn surfaces of the unreinforced Ti6Al4V alloy and reinforced composites using EDS analysis, as illustrated in Figure 15(a)–(d). Figure 15(a)–(d) reveals the elemental compositions of the alloy and composite matrix (Ti, Al, and V), as depicted in spectrum 6 (Figure 15(aiii)), spectrum 9 (Figure 15(biii)), spectrum 16 (Figure 15(cii)), and spectrum 15 (Figure 15(diii)). Additionally, a relatively high concentration of O is observed in spectra 5 (Figure 15(aii)) and 7 (Figure 15(aiv)), spectra 8 (Figure 15(bii)) and 10 (Figure 15(biv)), spectrum 17 (Figure 15(ciii)), and spectrum 14 (Figure 15(dii)) on the worn surfaces of the pure Ti6Al4V alloy, h-BN-reinforced, TiN-reinforced, and AlN-reinforced composites, respectively. This indicates that the ploughing by the rigid steel ball causes tribo-oxides (Ti and Al oxides) to be formed as a result of the interaction between the new surface and the atmosphere. Simultaneously, the presence of C and Si is observed at low concentrations, while traces of the Fe element from the counter body are not distinctly detected. The observed C may have originated from the counterface material released during its frictional interaction with the samples. Hence, the occurrence of wear as the surfaces interact with atmosphere, resulting in the formation of thin oxide films during sliding contact, particularly under non-lubricated conditions, where friction generates heat that may accelerate oxidation. The findings indicate that the dominant mechanisms governing wear in the analyzed materials are majorly abrasive, and slightly adhesive and oxidative.
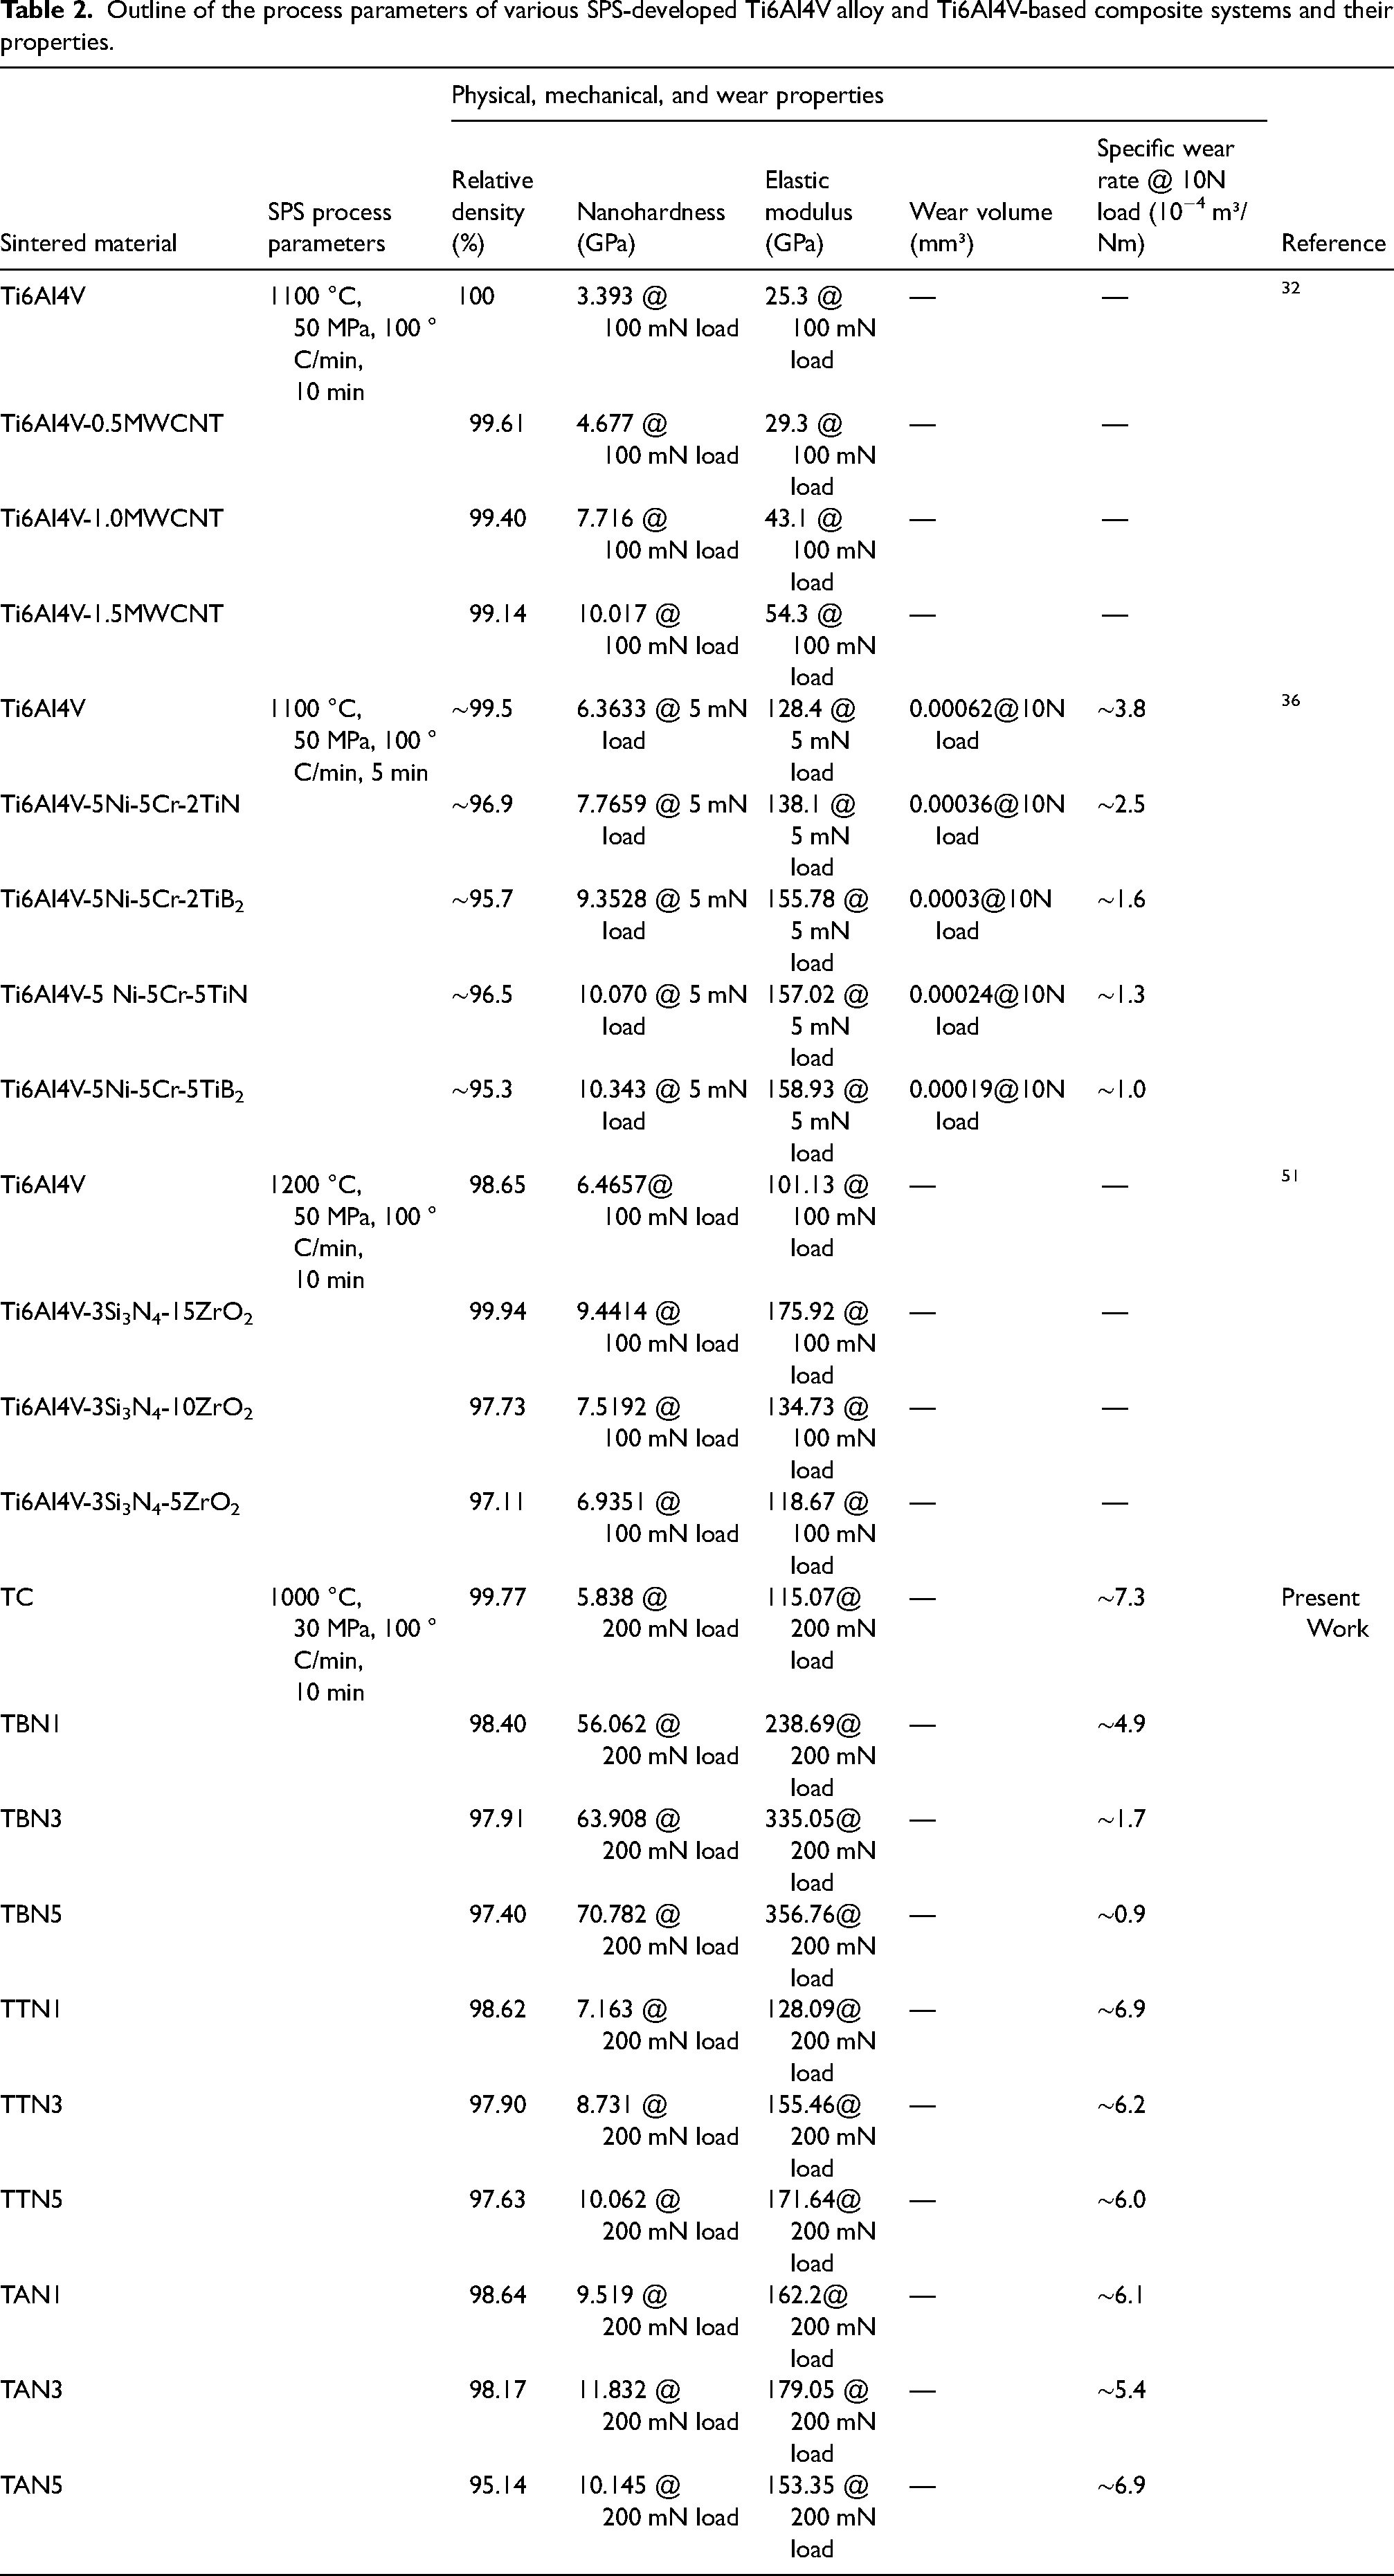
Table 2 presents the process parameters alongside physical (relative density), mechanical (hardness and elastic modulus), and wear (wear volume and specific wear rate) properties of various SPS-developed Ti6Al4V alloy and Ti6Al4V-based composite systems that exhibit comparable characteristics to the current investigation. Direct comparisons are difficult to make due to the variety of starting materials reported in the accessed publications. However, it is noteworthy that the incorporation of various ceramic reinforcements positively influences the properties of Ti6Al4V-based composite systems, resulting in significant enhanced performance in hardness, elastic modulus, and resistance to wear across the studies reviewed. 9
Outline of the process parameters of various SPS-developed Ti6Al4V alloy and Ti6Al4V-based composite systems and their properties.
This study examined the impact of different weight compositions (1, 3, and 5 wt. %) of refractory nitride nanoparticles, specifically h-BN, TiN, and AlN, on the performance of Ti6Al4V-based composites developed via SPS. The microstructure and phase evolution, along with densification, mechanical attributes (nanoindentation hardness and modulus of elasticity), as well as wear characteristics of developed composites, were evaluated comparatively. The following conclusions are derived:
The SEM images corroborate the absence of significant porosities, cracks, or other defects in the sintered composites, which could undermine the desired properties. Furthermore, the XRD plots indicate no presence of impairing intermetallic phases that could adversely affect the advantageous properties of the sintered composites. Consequently, it is feasible to fabricate Ti6Al4V matrix composites reinforced individually with 1, 3, and 5 wt. % of refractory nitride nanoparticles (h-BN, TiN, and AlN) using SPS, provided that no adverse interactions occur between the matrix and reinforcements during the sintering process. The incorporation of varied contents of h-BN, TiN, and AlN reinforcements (1, 3, and 5 wt. %) into the Ti6Al4V matrix results in a gradual decline in the relative densities of the developed composites, from 98.4% to 97.4% for h-BN-reinforced composites, 98.62% to 97.63% for TiN-reinforced composites, and 98.64% to 95.14% for AlN-reinforced composites. The presence of porosities, recognised as a primary factor in inadequate densification of sintered materials, likely accounts for the observed depreciation in densification. It is found that this does not significantly affect the assessed properties, including mechanical and wear characteristics of the developed refractory nitride-reinforced composites. The nanoindentation test demonstrates a substantial increase in the nanoindentation hardness of the reinforced Ti6Al4V-based composites, rising from 8.731 ± 0.244 GPa to 70.782 ± 0.794 GPa, and an enhancement in the modulus of elasticity from 128.09 ± 3.11 GPa to 356.76 ± 4.05 GPa, compared to the Ti6Al4V alloy without reinforcement, which measures 5.838 ± 0.323 GPa and 115.07 ± 3.63 GPa, respectively. The enhancement of the nanomechanical properties in spark plasma-sintered refractory nitride-reinforced Ti6Al4V-based composites is primarily due to the load transfer mechanism from the Ti6Al4V alloy matrix to the more resilient reinforcement particles, resulting in dispersion strengthening and the inhibition of dislocation motion. In comparison with the unreinforced alloy, the wear results indicate that the average COF of the reinforced Ti6Al4V-based composites decreases with an increase in the applied load. The data analysis reveals that TiN-reinforced composites show the highest COF values, second only to the monolithic alloy. AlN-reinforced composites follow, while h-BN-reinforced composites display the lowest COF values. The specific wear rate of the monolithic alloy sample at each applied load is greater than that of the composites, which is due to the superior hardness profiles of the refractory nitride-reinforced Ti6Al4V-based composites.
Footnotes
Acknowledgments
This work is based on the research supported wholly/in part by the National Research Foundation of South Africa (Grant No. 150574), Centre for Energy and Electric Power (CEEP); Surface Engineering Research Laboratory (SERL) under the Leadership of Professor API Popoola, Faculty of Engineering and the Built Engineering in Tshwane University of Technology (TUT), Pretoria, South Africa.
Authors’ contributions
John Olorunfemi Abe: Conceptualization, Investigation, Methodology, Data curation, Writing-Original draft preparation, Visualization
Olawale Popoola: Conceptualization, Supervision, and Writing-Reviewing
Patricia Popoola: Conceptualization, Supervision, Project administration, and Resources
Availability of data and materials
The raw and processed data will be made available on request.
Consent to participate
The authors are all members of the same research group.
Consent to publish
All the authors are in support of the publication.
Declaration of conflicting interests
The authors declared no potential conflicts of interest with respect to the research, authorship, and/or publication of this article.
Ethical approval
There is no ethical consideration in the work.
Funding
The authors disclosed receipt of the following financial support for the research, authorship, and/or publication of this article: This work was supported by the National Research Foundation of South Africa, (grant number 150574).