
Abstract
This research explores the corrosion resistance and anti-wear property of near-equimolar Ti20-Al16-V16-Fe16-Ni16-Cr16 High Entropy Alloys (HEAs), fabricated at varying temperatures through spark plasma sintering (SPS) procedure. The alloy powders were processed and sintered at temperatures ranging from 700°C to 1100°C, and the resulting HEAs underwent comprehensive characterization. The tribological behavior of these sintered HEAs and their corrosion response in sulfuric and chloride environments were systematically investigated. Microstructural analyses were conducted before and after exposure to corrosive media using a scanning electron microscope. Notably, the assessments in both acid and salt media revealed that HEAs sintered at 1100°C exhibited the highest corrosion resistance, whereas those sintered at 700°C displayed the least resistance. The wear rate is improved by 130% over Inconel 718 alloy in the created HEA. This research signifies the potential of Ti20-Al16-V16-Fe16-Ni16-Cr16 HEA prepared through tailored SPS procedures, as corrosion and wear resistance alternatives surpass the performance of Ti6AlV4 and traditional alloys.
Keywords
Introduction
The continual progress in engineering materials has ushered in a new era of metal alloys, supplementing the existing repertoire of applications. A noteworthy addition to this domain is the emergence of high entropy alloys (HEAs), distinguished by their equimolar compositions comprising a minimum of five elemental metals. These alloys showcase remarkable properties, encompassing elevated corrosion resistance,1–4 commendable wear resistance,5,6 favorable electrical and magnetic attributes, 7 as well as high fracture toughness and fatigue resistance,7,8 among numerous others. The distinctive characteristics of HEAs are rooted in the cooperative synergy among multiple elements, adopting structures such as body-centered cubic (BCC), face-centered cubic (FCC), hexagonal close-packing (HCP), or their intricate combinations within HEAs rather than generating various intermetallic phases.1,9,10 Unlike traditional alloys, which grapple with the complexities of developing intermetallic compounds that might compromise mechanical properties, HEAs circumvent these limitations. Their high configurational entropy and sluggish diffusion tendencies facilitate the formation of straightforward crystal-structured solid-solution phases,11–13 steering clear of the intricate challenges associated with traditional alloy development. This marks a significant departure from the conventional constraints, positioning HEAs as innovative materials with a promising future in diverse engineering applications.
Researchers have used a variety of fabrication techniques to create HEA, including; severe decomposition, 14 ultrasonication, 15 carbothermal shock synthesis, 16 and fast-moving bed pyrolysis. 17 However, it was found that these techniques were either not economically feasible or had low productivity, which called for additional research in the field to increase production efficiency and industrial scalability. 18 The benefits of the process led to the selection of spark plasma sintering (SPS) for the development of HEA. As a result of the use of pulsed DC during SPS, which lowers the activation energy of defect diffusion and migration, impurities and voids are evaporated, leading to reduced porosity in HEAs formed using SPS than those made using the hot pressed (HP) approach, according to Fu et al. 19 As a result, SPS is one of the best methods for creating HEA with little grain development, and interlocked grain boundaries.20–22 By using mechanical alloying (MA) and SPS to create Co0.5FeNiCrTi0.5 HEA, Fu et al. 23 significantly improved the microstructure and microhardness of the material. NiCoCrCuFe HEA produced by SPS has superior mechanical and microstructural qualities compared to that produced via stir casting, according to Yeh et al. 24 . When Cr is added to HEA systems, Qiu et al. 25 found that the systems’ resistance to corrosion and pitting is increased.
Due to its low density, high strength, high modulus, and low coefficient of thermal expansion (CTE), Ti6Al4 V has gained significant attention in recent years for use in high temperature/strength applications in the aerospace, medical, turbine, chemical storage, and marine industries.18,26 However, its weak shear strength and corrosive acid sensitivity in HCl or H2SO4 limit its industrial applications. The creation of Ti20-Al16-V16-Fe16-Ni16-Cr16 HEA with SPS was envisioned to overcome these Ti6Al4V's shortcomings. The inclusion of ferromagnetic properties of Ni and Fe increase modulus, wear resistance, resistance to oxidation, and resistance to corrosion in an acidic medium. Ni also has an FCC crystal structure, and during HEAs formation, FCC crystal structures cause a higher lattice distortion effect, which reduces strain hardening and prevents crystal dislocation. Contrarily, Fe is an α-phase BCC crystal at ambient temperature, but when heated to 910°C, it changes to an FCC γ-phase, which will help to increase strength and solid solution evolution. To facilitate the evolution of the BCC phase, which increases the ductility and corrosion resistance of the HEAs, Cr was added to the alloys.27–29 The inherent properties of the Ti-Al-V alloy are notably enhanced by the inclusion of chromium (Cr), nickel (Ni), and iron (Fe), imparting superior characteristics in terms of oxidation resistance, corrosion resistance, and creep resistance.
Also, tribological characterization of HEA has drawn attention from various researchers recently. The BCC phase of HEA is the most desired phase for enhancement of wear characteristics of a HEA. This is because, despite the fact that flexibility is hindered, the BCC phase promotes resistance to brittleness, which improves anti-wear feature. Hence, this study developed HEAs with capabilities surpassing those of the conventional TiAl4 V alloy, particularly when subjected to corrosive and wear environments. The SPS procedure was chosen as the fabrication method, offering a versatile and controlled process for synthesizing advanced materials. The key focus lies in exploring the impact of different sintering temperatures during the SPS process on the resulting HEAs, with the anticipation that varying temperature conditions will yield distinct microstructures and, consequently diverse properties.
Experimental method
Materials
In the experimental setup, a diverse array of powders was employed, each distinguished by specific attributes. The titanium (Ti) powder, boasting 99.9% purity, particle sizes spanning 45–55 µm, and a density of 4.54 gcm−3, played a pivotal role. Similarly, the aluminum (Al) powder, with a purity of 99.9%, a particle size of 45 µm, and a density of 2.7 gcm−3, contributed to the composition. The vanadium (V) powder, featuring 99.9% purity, particle sizes ranging from 45–50 µm, and a density of 6.1 gcm−3, was also incorporated into the experimental matrix. Furthermore, the iron (Fe) powder, boasting 99.9% purity, a particle size of 45 µm, and a density of 7.87 gcm−3, played a crucial role in the experiment. Nickel (Ni) powder, known for its 99.9% purity, particle sizes ranging from 45–65 µm, and density of 8.9 gcm−3, was an integral component. Finally, the chromium (Cr) powder, characterized by 99.9% purity, particle sizes between 40–65 µm, and a density of 7.19 gcm−3, added another dimension to the experimental mix. All these powder materials were sourced from TLS Technik in Germany.
Method
The fabrication process involved the precise blending of these powders in a tubular mixer, with each component weighed accurately to achieve a near equiatomic HEA composition of Ti20-Al16-V16-Fe16-Ni16-Cr16. Ensuring a consistent dispersion of particles, the mixing persisted for 10 h at a speed of 69 revolutions per minute. To enhance homogeneity, steel balls with an 8-mm diameter were introduced to the powder mix at a ball-to-powder ratio of 4:5.
30
The precise amount of material required to form a pellet with a 40-mm diameter and a 5-mm thickness was carefully measured and deposited into a graphite die. The prepared mixture of powders was then introduced into the sintering chamber of the SPS machine (KCE-FCT-HHPD 25, Germany). Subsequently, the machine was initialized with specific pressures: vacuum pressure set at 70.5 Pascal, relative pressure at 69
Characterization and measurement
With the aid of an X-ray diffractometer (XRD—Bruker D8, Madison, WI, USA), a scanning electron microscope (SEM) coupled to an electron dispersion spectroscope (SEM-EDS, TESCAN), the crystal structure and microstructure of the materials were examined. Using the rule of mixture, the theoretical density (bulk density) of the combined powders was determined using Equation 1.
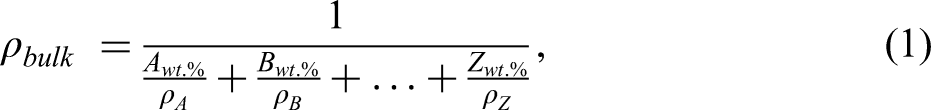
The Archimedes approach was used to compute the experimental density.
32
Equation 2 was used to compute the relative densification (R.D) of the sintered samples.


Results and discussion
Illustrated in Figure 1 are the SEM micrographs depicting the as-received powders, which reveal prevalent spherical particle morphology. A notable aspect to be highlighted is the electrochemical investigation is the further demonstration of how these spherical particle components contributed to the enhancement of the corrosion resistance of the spark plasma sintered HEAs. The utilization of spherical grains in constituent powders is associated with both a high relative density and a comparatively slower grain development when compared to particles of alternative shapes. 33 This characteristic adds a layer of significance to the role of particles’ morphology in the fabrication process and materials’ properties.
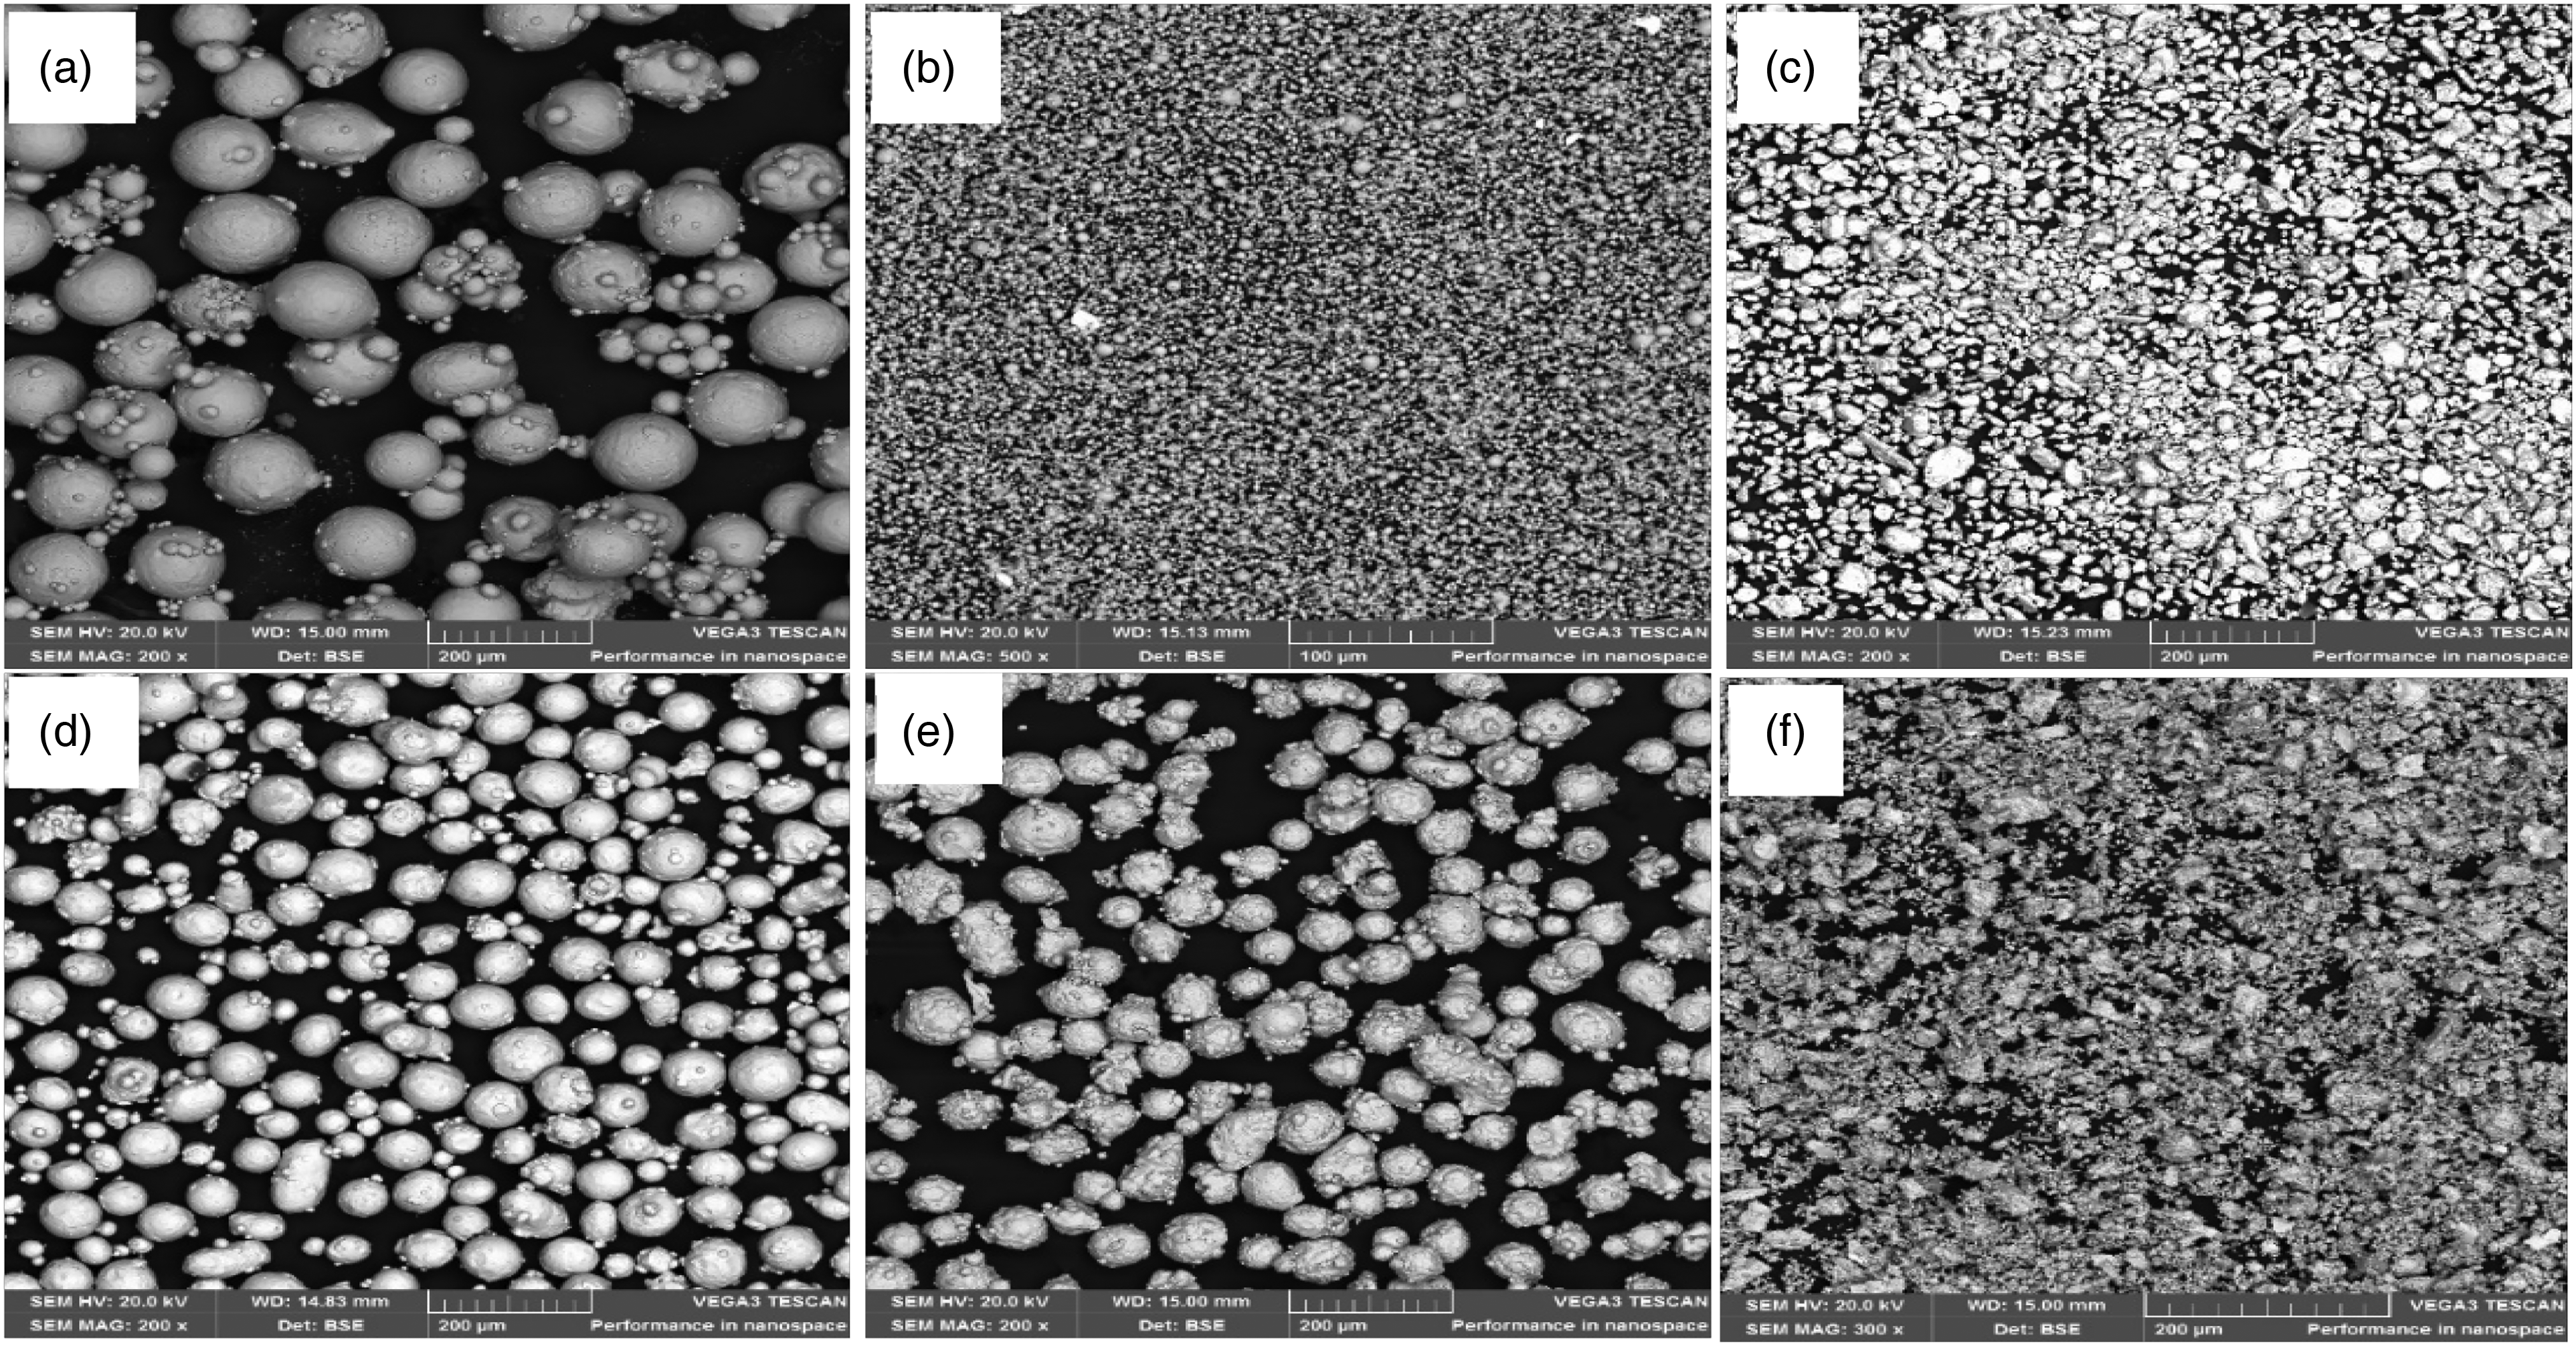
SEM micrographs of powders (a) Ti, (b) Al, (c) V, (d) Fe, (e) Ni and (f) Cr.
Figure 2 presents the X-ray diffraction graph depicting the received powders. Among all the constituent elements, titanium (Ti) stands out with the highest number of diffraction peaks. The particle sizes in this context are in microns rather than nanometers. This distinction is crucial as micron-sized particles typically exhibit thin and well-defined peaks, in contrast to the strained broad peaks often associated with nano-sized particles. 34 The detailed analysis of these X-ray diffraction patterns provides valuable insights into the crystalline structure and composition of the powders, particularly emphasizing the distinctive characteristics attributed to the particle sizes in the micron range.
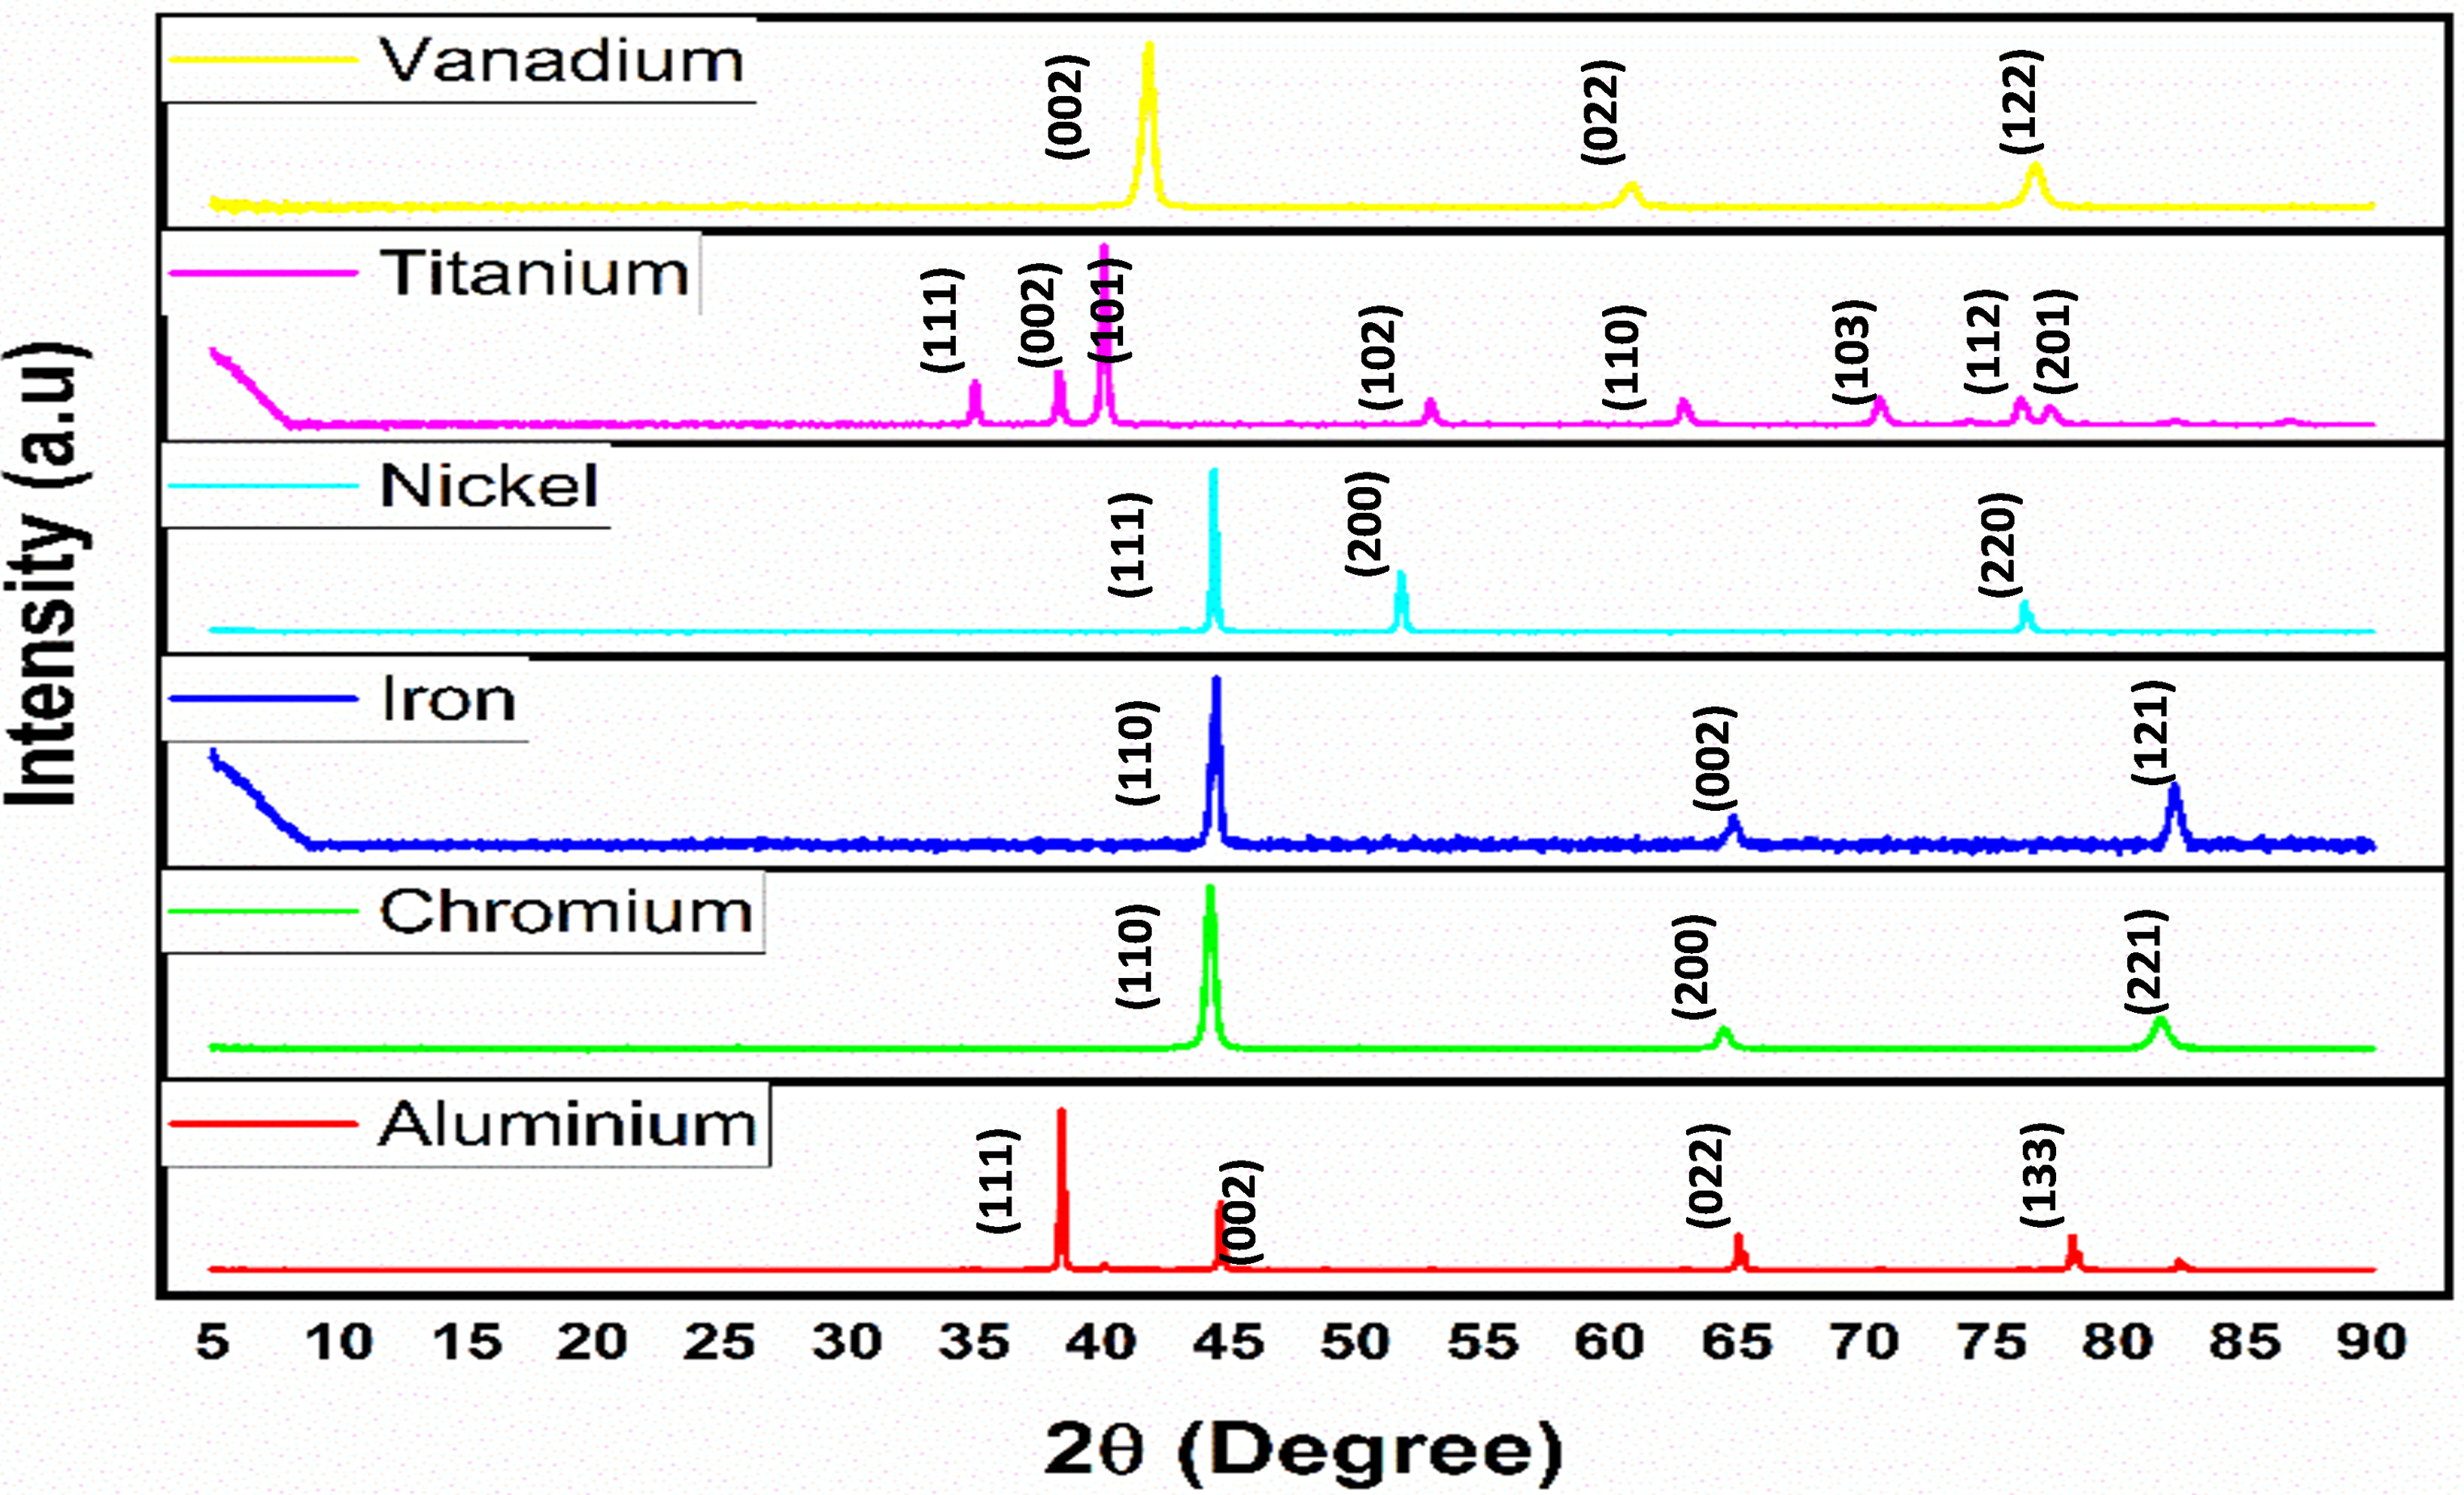
XRD of the powders.
Figure 3 showcased the SEM images of the sintered High HEA samples. In Figure 3(a), the presence of porosity in the sample sintered at 700°C indicates insufficient temperature for full alloy densification. This outcome suggests incomplete impurity vaporization and particle micro-diffusion, factors influenced by the pulsed current in Spark Plasma Sintering. 22 This deficiency in the sintering process is likely responsible for the observed weak corrosion resistance, a characteristic that will be further explored in subsequent sections. For Figure 3(b), which represents a sample sintered at 800°C showed improvements. The number of pores was decreased, and distinct phases were evolved. However, a few remaining pores and weak grain boundaries persist. As the sintering temperature increases, there is a noticeable enhancement in grain boundary strengthening and compaction. In Figure 3(c), the sample sintered at 900°C exhibits complete crystallization, with additional compaction and densification contributing to the nearly closed pores. Although some dark spots indicative of flaws is still visible, the overall characteristics of this HEA sample have significantly improved. Figure 3(d) presents a sample sintered at 1000°C, revealing a microstructure with two separate crystallized phases. At this temperature, impurity vaporization, grain boundary compaction, and micro-diffusion of particles contribute to maximal densification under optimal SPS conditions. The dark phase demonstrates a BCC structure rich in α and β-Ti, Al, and Cr. Meanwhile, the less intense phase comprises of V, Cr, Fe, and Al-rich FCC structures.
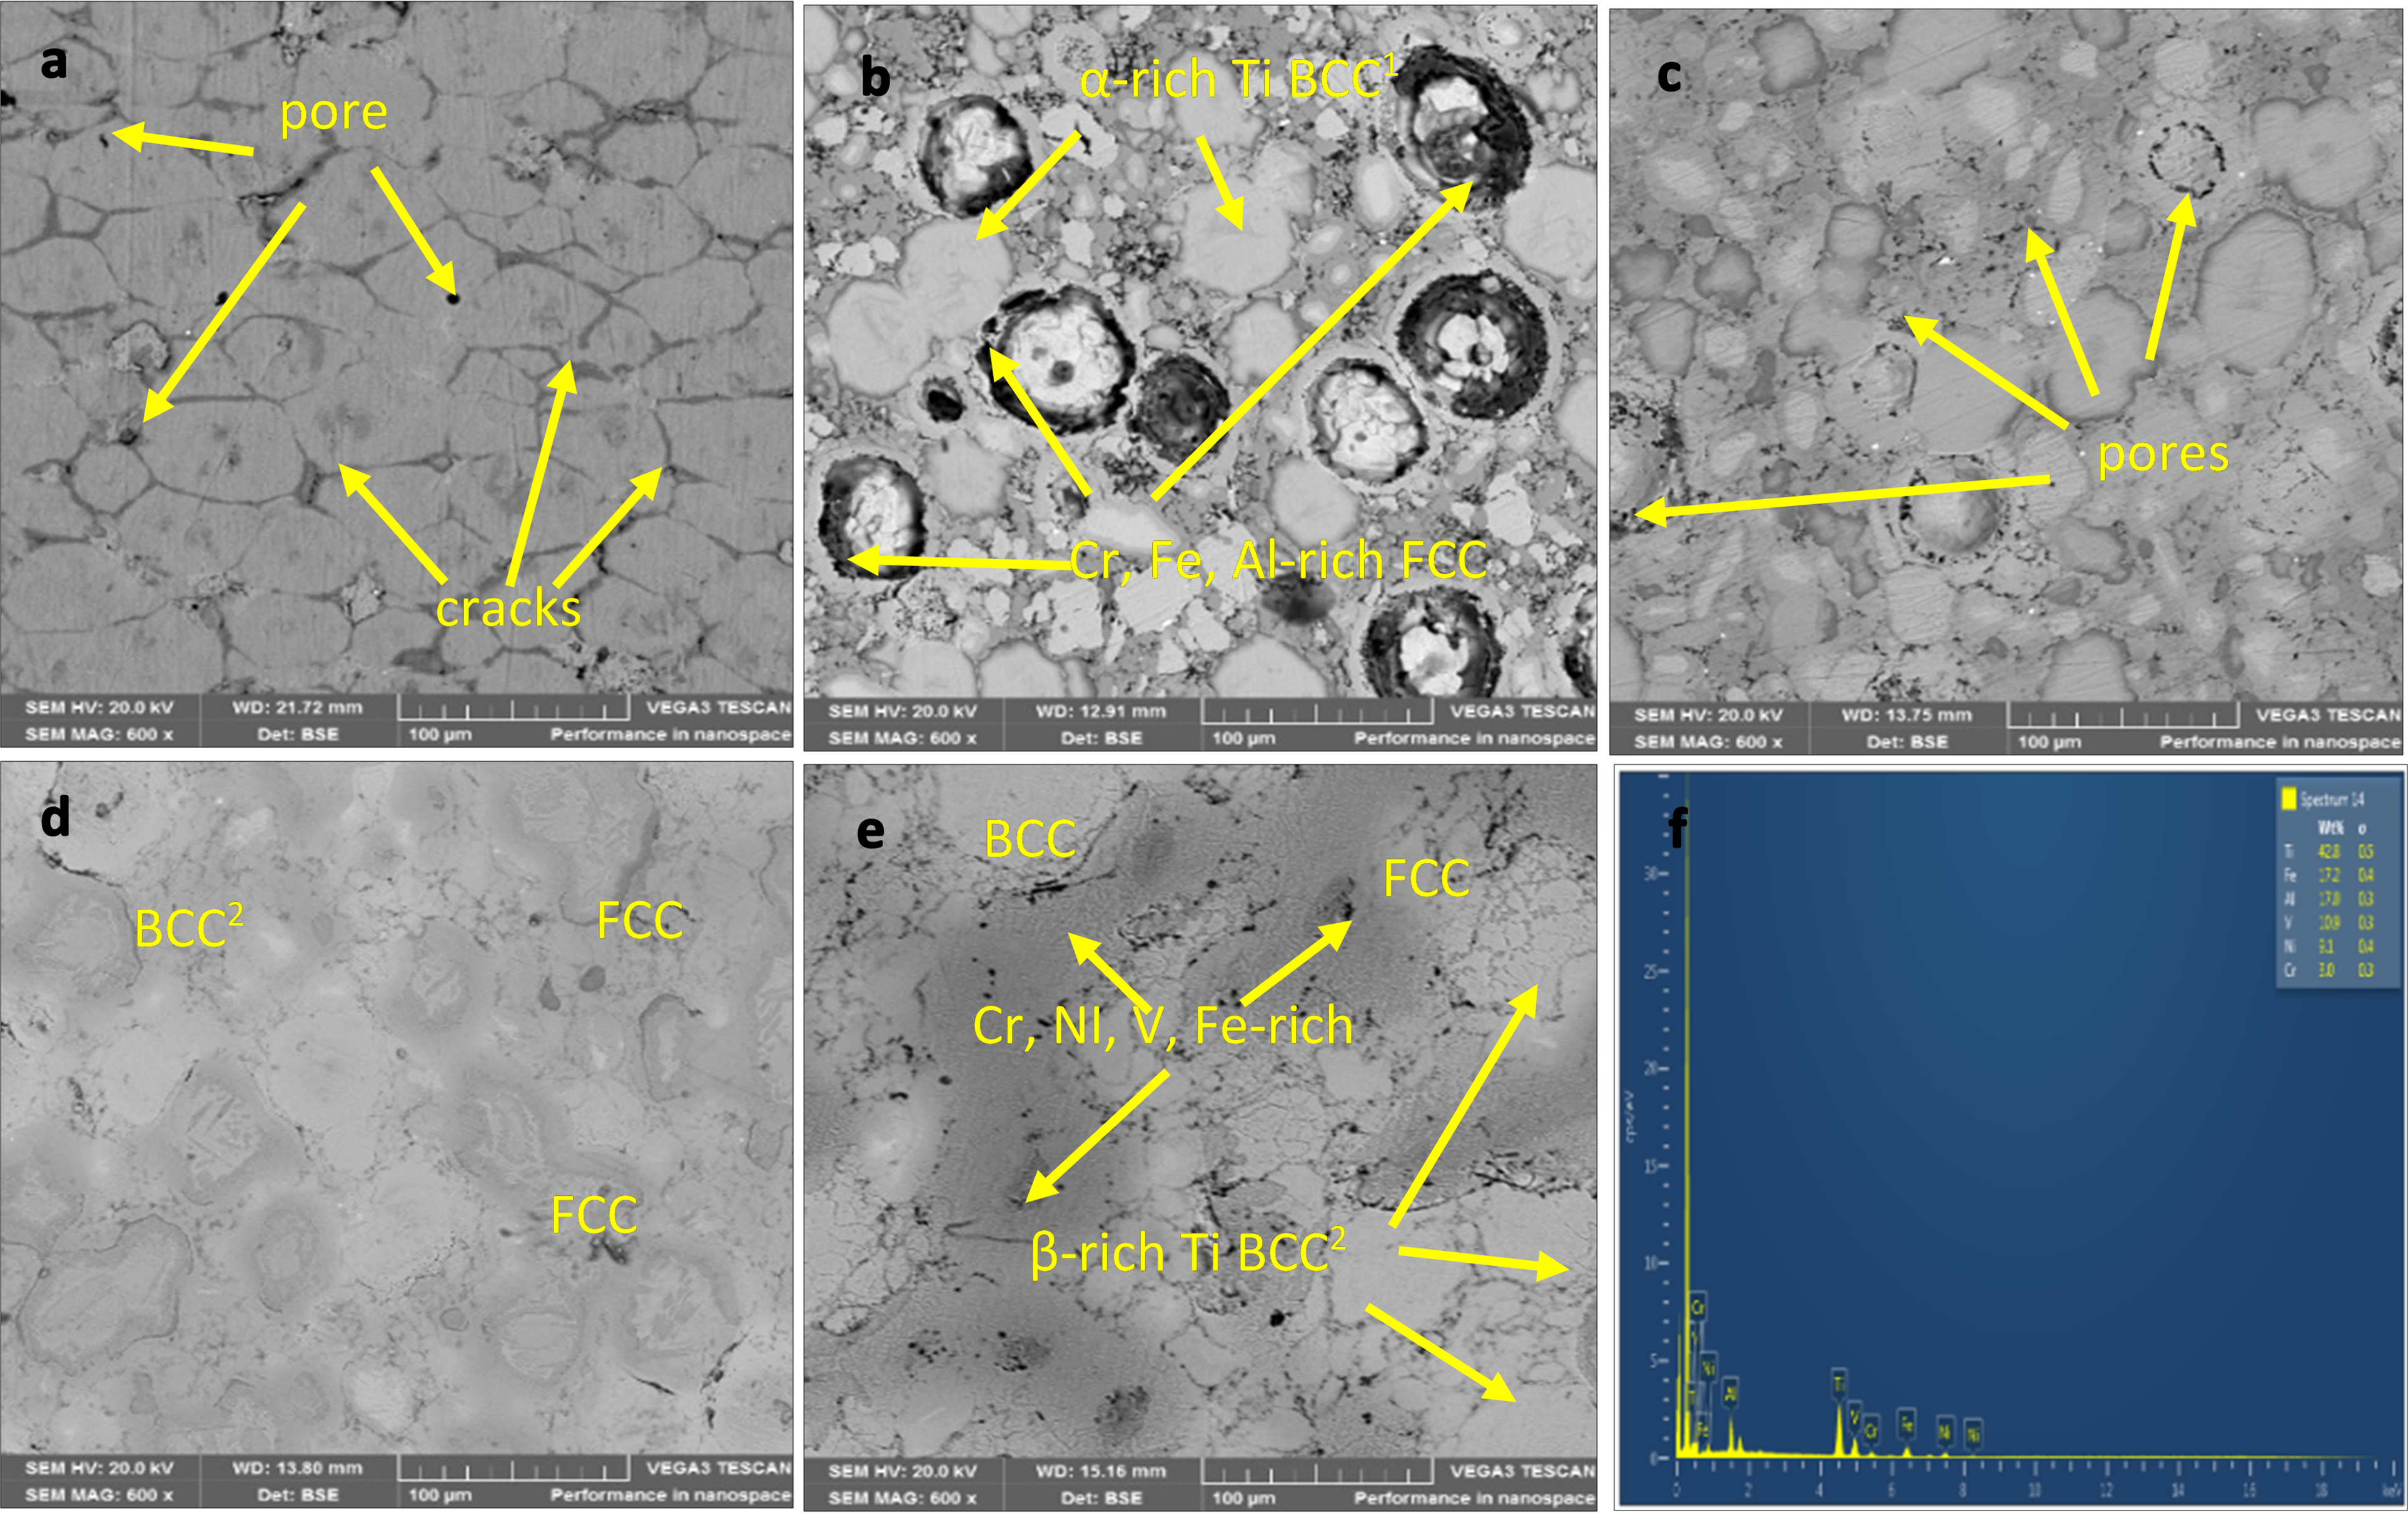
SEM micrographs of HEA sintered at (a) 700°C (b) 800°C (c) 900°C (d) 1000°C (e) 1100°C and (f) EDS of Ti-rich phase.
At sintering temperatures of 700 and 800°C and 900, 1000, and 1100°C, respectively, the alloy's α-stabilizer (Al) and β-stabilizer (V) encouraged the production of α -Ti-rich BCC1 phase and β-Ti-rich BCC2 phase, respectively. Therefore, as the sintering temperature exceeded the temperature at which α-Ti transforms to β-Ti (883°C), V, α β-stabilizer, encouraged the creation of β -Ti-rich BCC2. Because of this, the diffraction peak's position changed from 45° in the 700°C and 800°C samples to 41° in the other samples (Figure 4). The lighter FCC phase is rich in V, Cr, Fe, and Al, whereas the darker BCC phase is rich in Ti, Al, and Cr. 18 The corrosion resistance property of the alloy sintered at 1000°C and 1100°C improved due to the evolution of Ti's BCC2 phase at higher sintering temperatures.
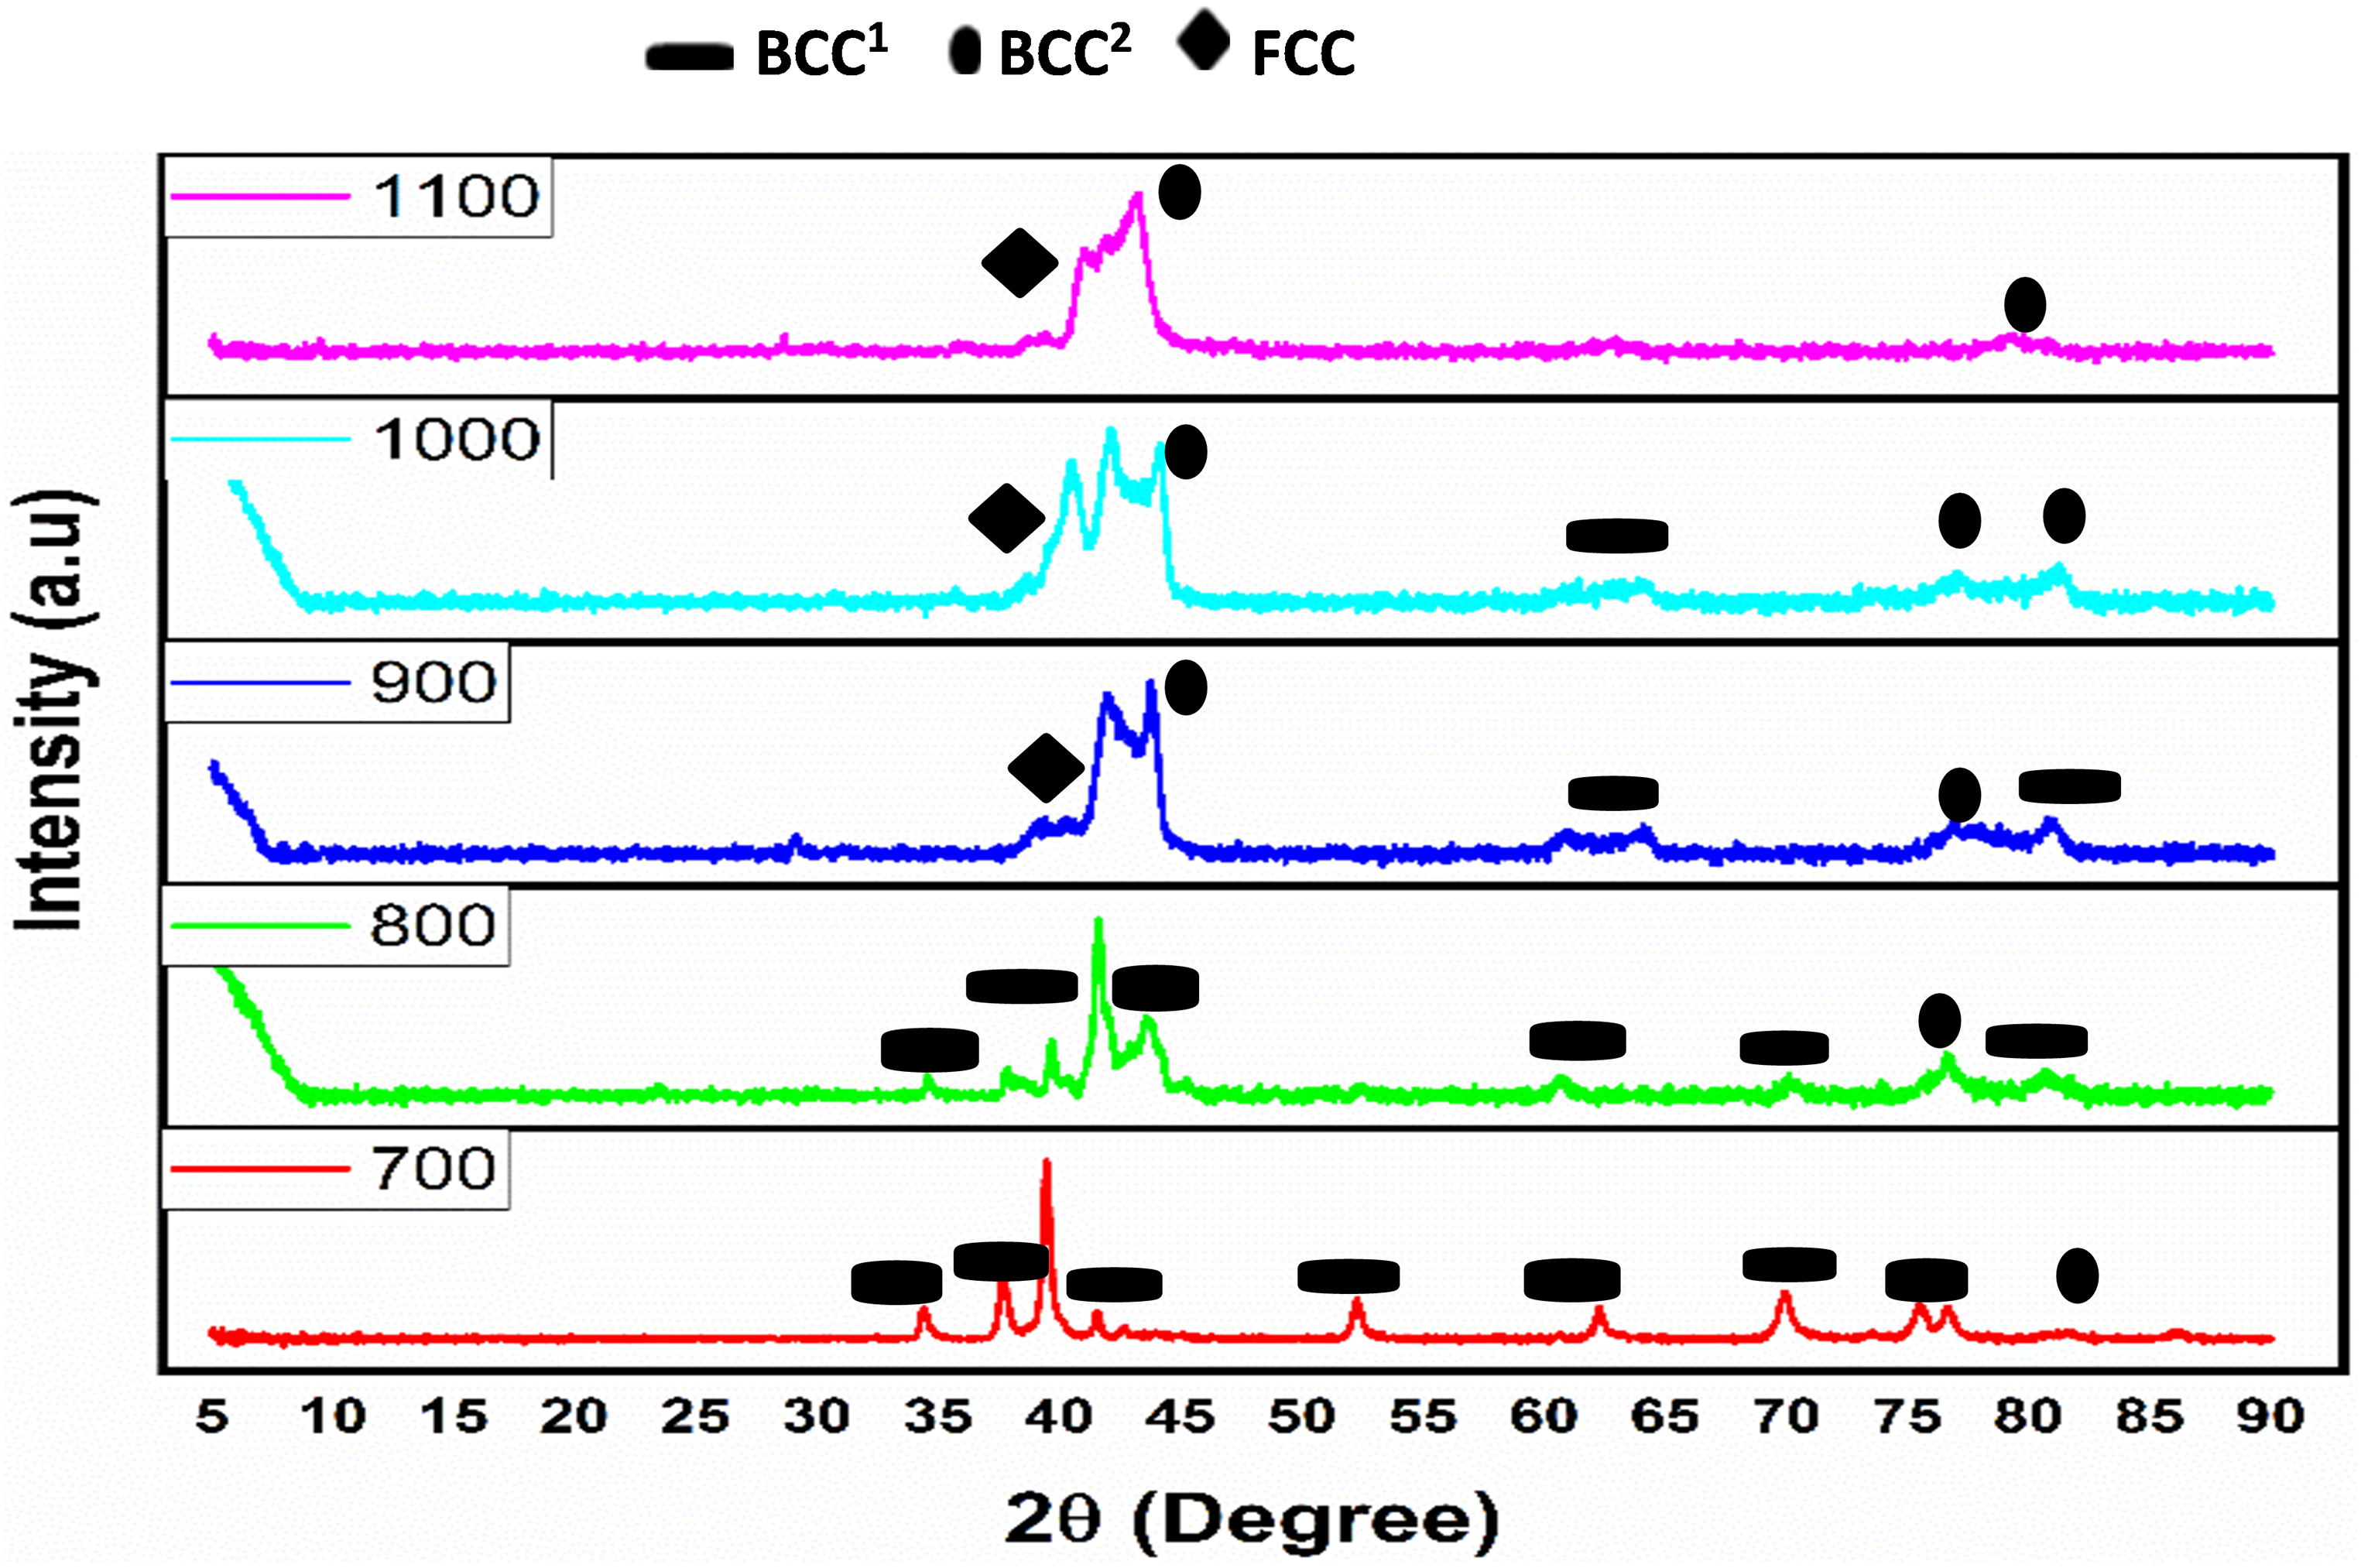
XRD patterns of the sintered powders at different sintering temperatures.
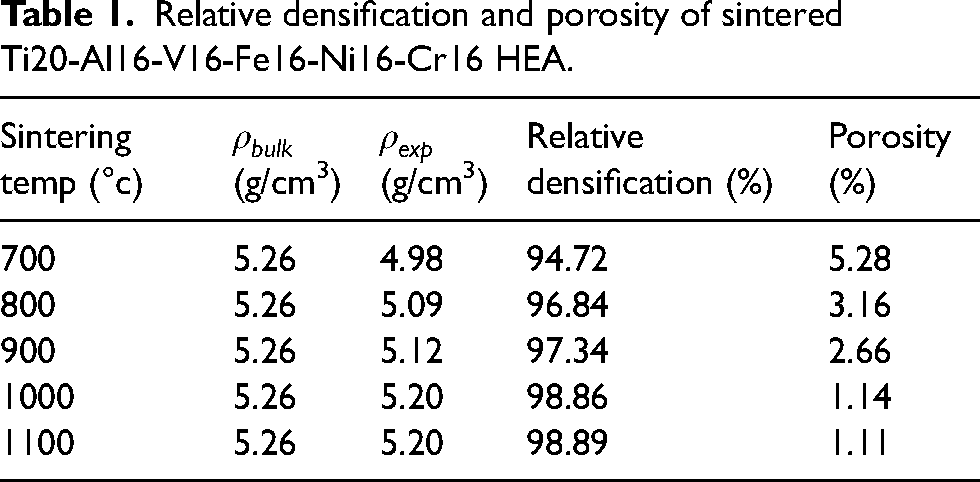
Additionally, the introduction of aluminum into the alloy instigated a strengthening process known as lattice distortion, concurrently enhancing the alloy's ductility. The relatively large atomic radius of aluminum facilitated lattice deformation in the crystal, promoting the creation of the BCC phase. 35 As detailed in Table 1, the elevation of the sintering temperature corresponded to the improved compaction and relative densification. The XRD analysis in Figure 4 revealed the absence of detrimental intermetallic compounds, attributable to the high entropy effect. This effect facilitated the formation of a solid solution alloy rather than complex intermetallic compounds. 36
Relative densification and porosity of sintered Ti20-Al16-V16-Fe16-Ni16-Cr16 HEA.
The presence of nickel with its 10 valence electrons surpassing the threshold of 8, played a crucial role in fostering the formation of the FCC phase, 37 particularly evident at the diffraction angle of 77° as observed by Luo et al. 38 Furthermore, the transition of BCC α-Fe to FCC γ-Fe was observed at a diffraction angle of 82° when the sintering temperature increased from 900 to 1000°C, considering the curie temperature of pure iron (Fe) is 910°C. 39 At 1000°C, the high-entropy effect led to the dissolution of constituent elements into a solid solution, depicted in Figure 4 of the XRD, where all elements coexisted in both FCC and BCC phases within a single peak. Although smaller diffraction peaks were present at 1000°C, their crystallinity diminished when the temperature was further elevated to 1100°C. The reduced strength observed at 1100°C can be attributed to the loss of crystal peaks. 18 The predominant diffraction peaks were BCC when the sintering temperature was below 1000°C, but at 1000°C, the α-Fe BCC transformed into the γ-Fe FCC phase. Additionally, consistent with another study, 40 the transformation from α-Ti BCC1 to β-Ti BCC2 was observed. At a diffraction angle of 42° was the superimposition of BCC and FCC phases, highlighting the intricate phase transformations occurring within the HEA.
Electrochemical analysis
The samples underwent electrochemical tests in aggressive H2SO4 and NaCl environments at room temperature, and the potential against log current was plotted in Figure 5. The Tafel parameters were extrapolated from the Potentiodynamic Polarization
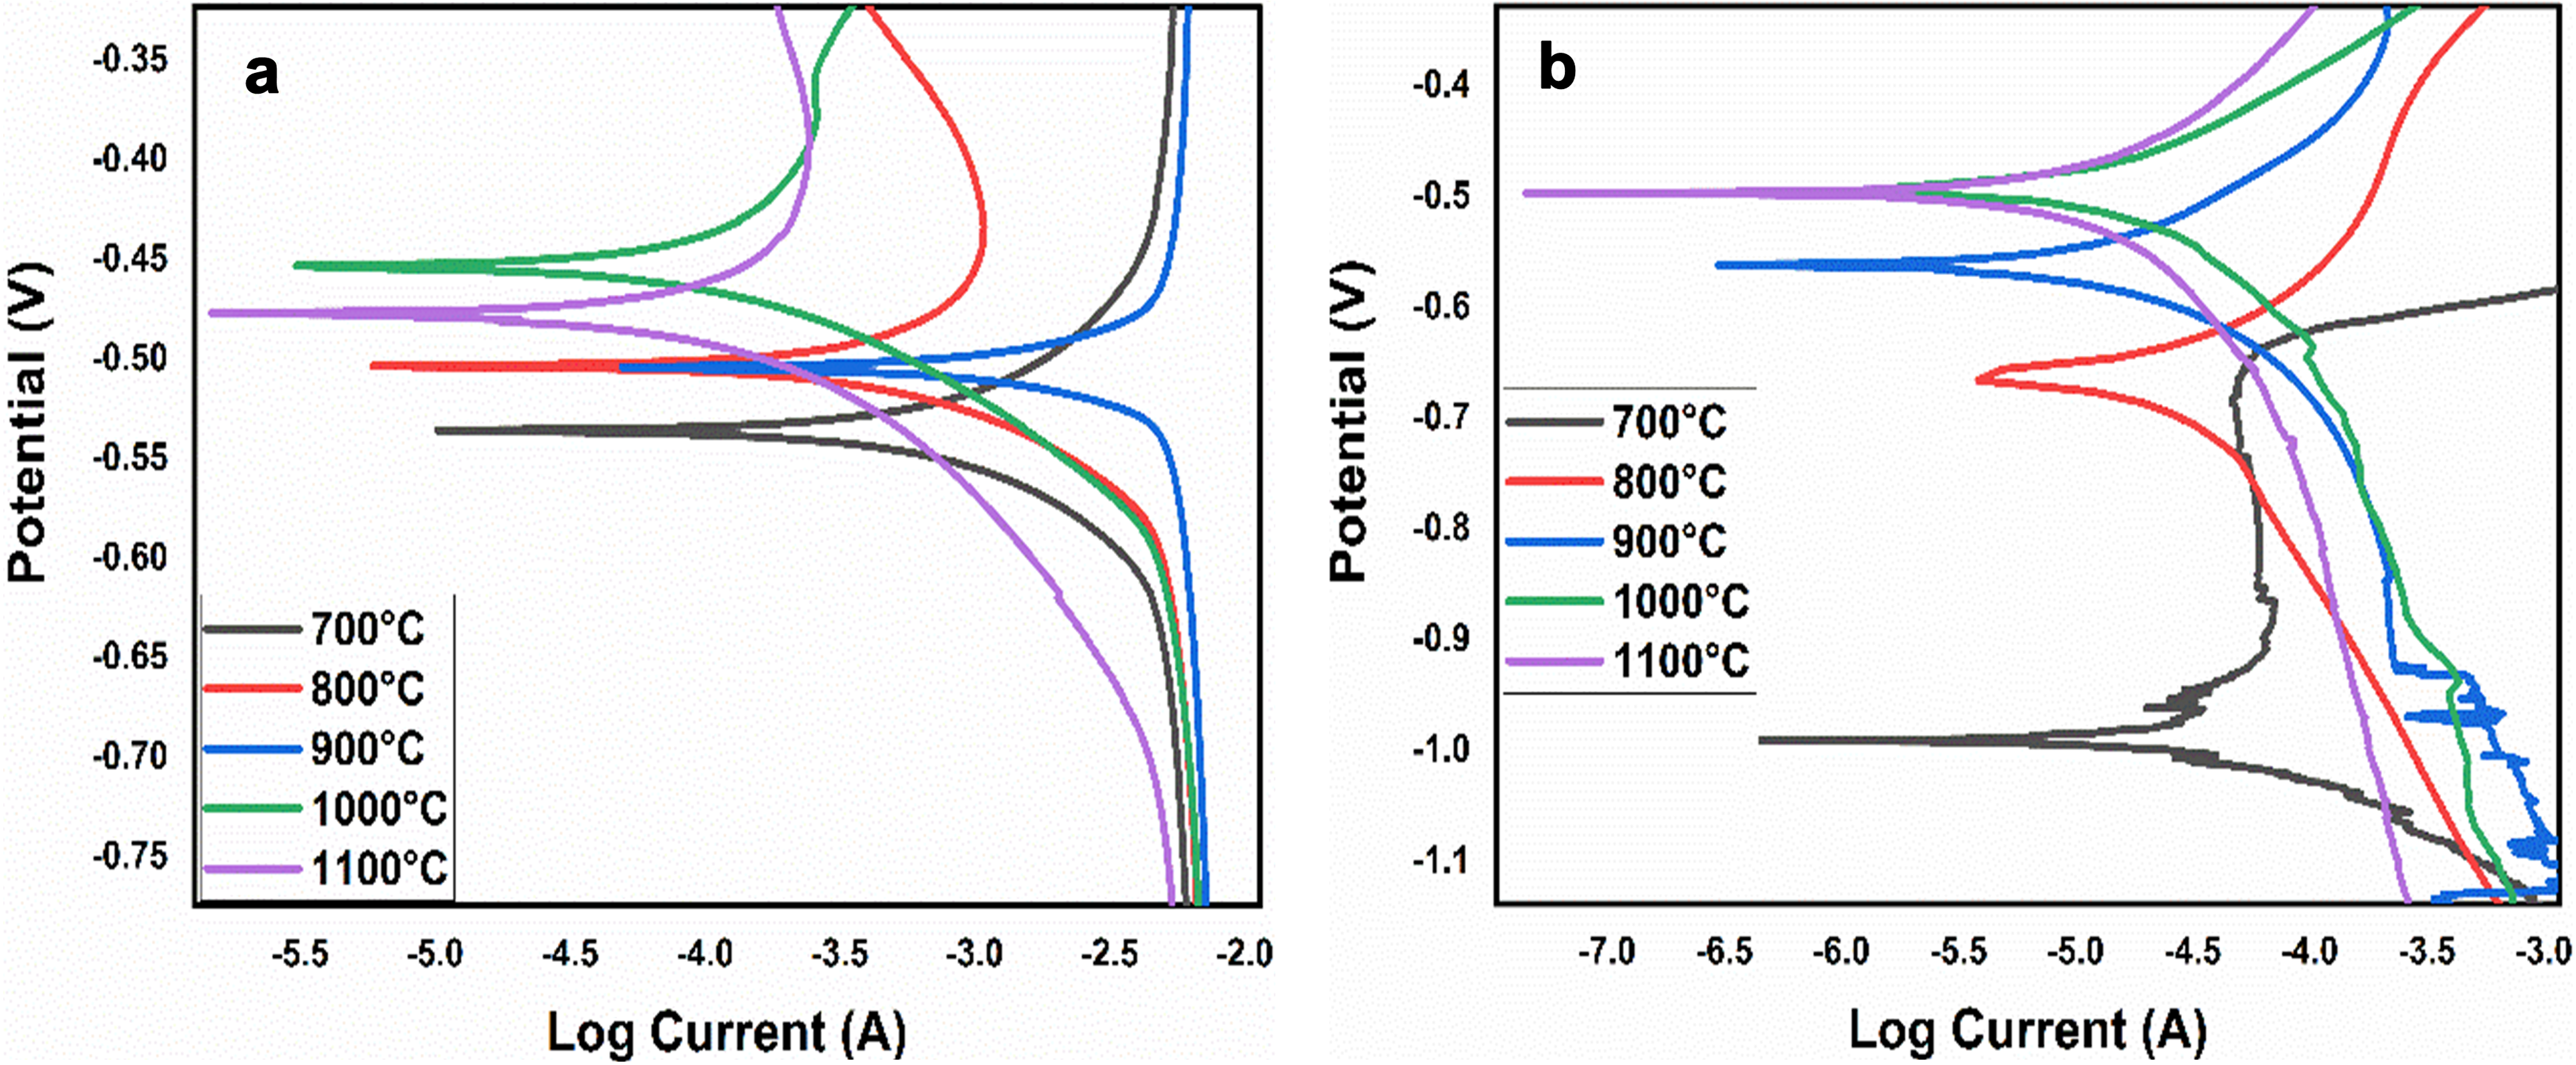
Potentiodynamic polarization of sintered HEA in (a) H2SO4 and (b) NaCl.
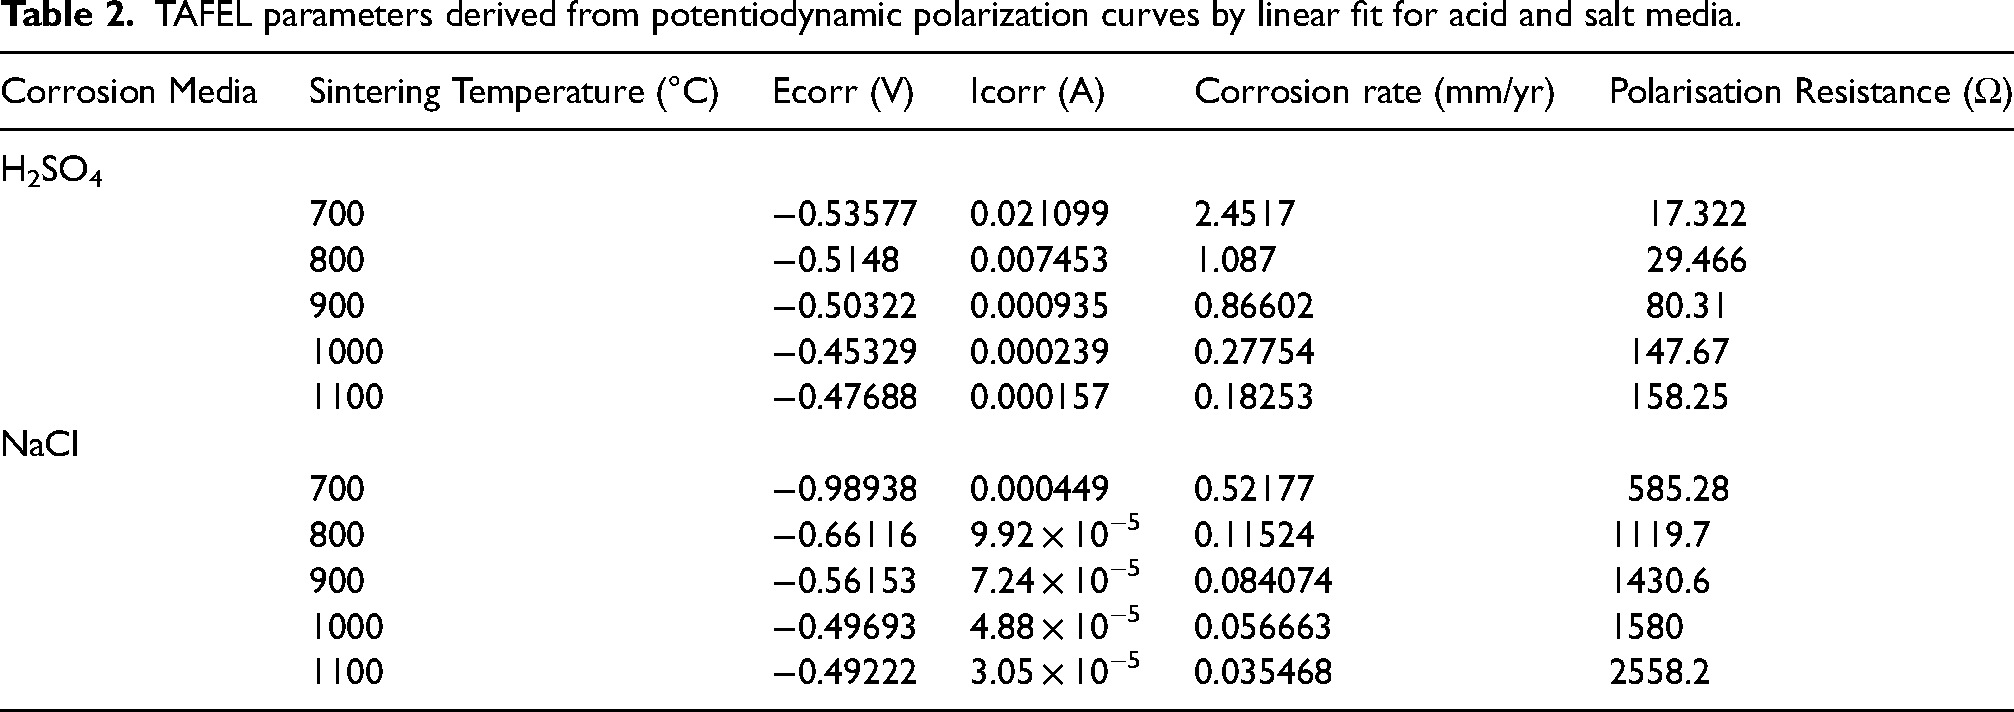
TAFEL parameters derived from potentiodynamic polarization curves by linear fit for acid and salt media.
In a general context, the corrosion initiation in HEAs typically originates from a physical or chemical heterogeneity, encompassing imperfections, intermetallic regions, mechanically fractured areas, grain boundaries, inclusions, or disruptions.44,45 Figures 6 and 7 present SEM imagery of the sintered HEAs after exposure to aggressive attacks in sulfuric and chloride environments, respectively. A detailed analysis of the SEM images in Figure 6 reveals an enhancement in particles homogeneity with an increase in sintering temperature. However, Figure 6(a) displays pronounced non-uniformity with visible pores and cracks, creating pathways for liquid H2SO4 infiltration in the sample sintered at 700°C. This susceptibility to corrosion is reflected in the exceptionally high corrosion rate observed in comparison to samples sintered under different conditions.
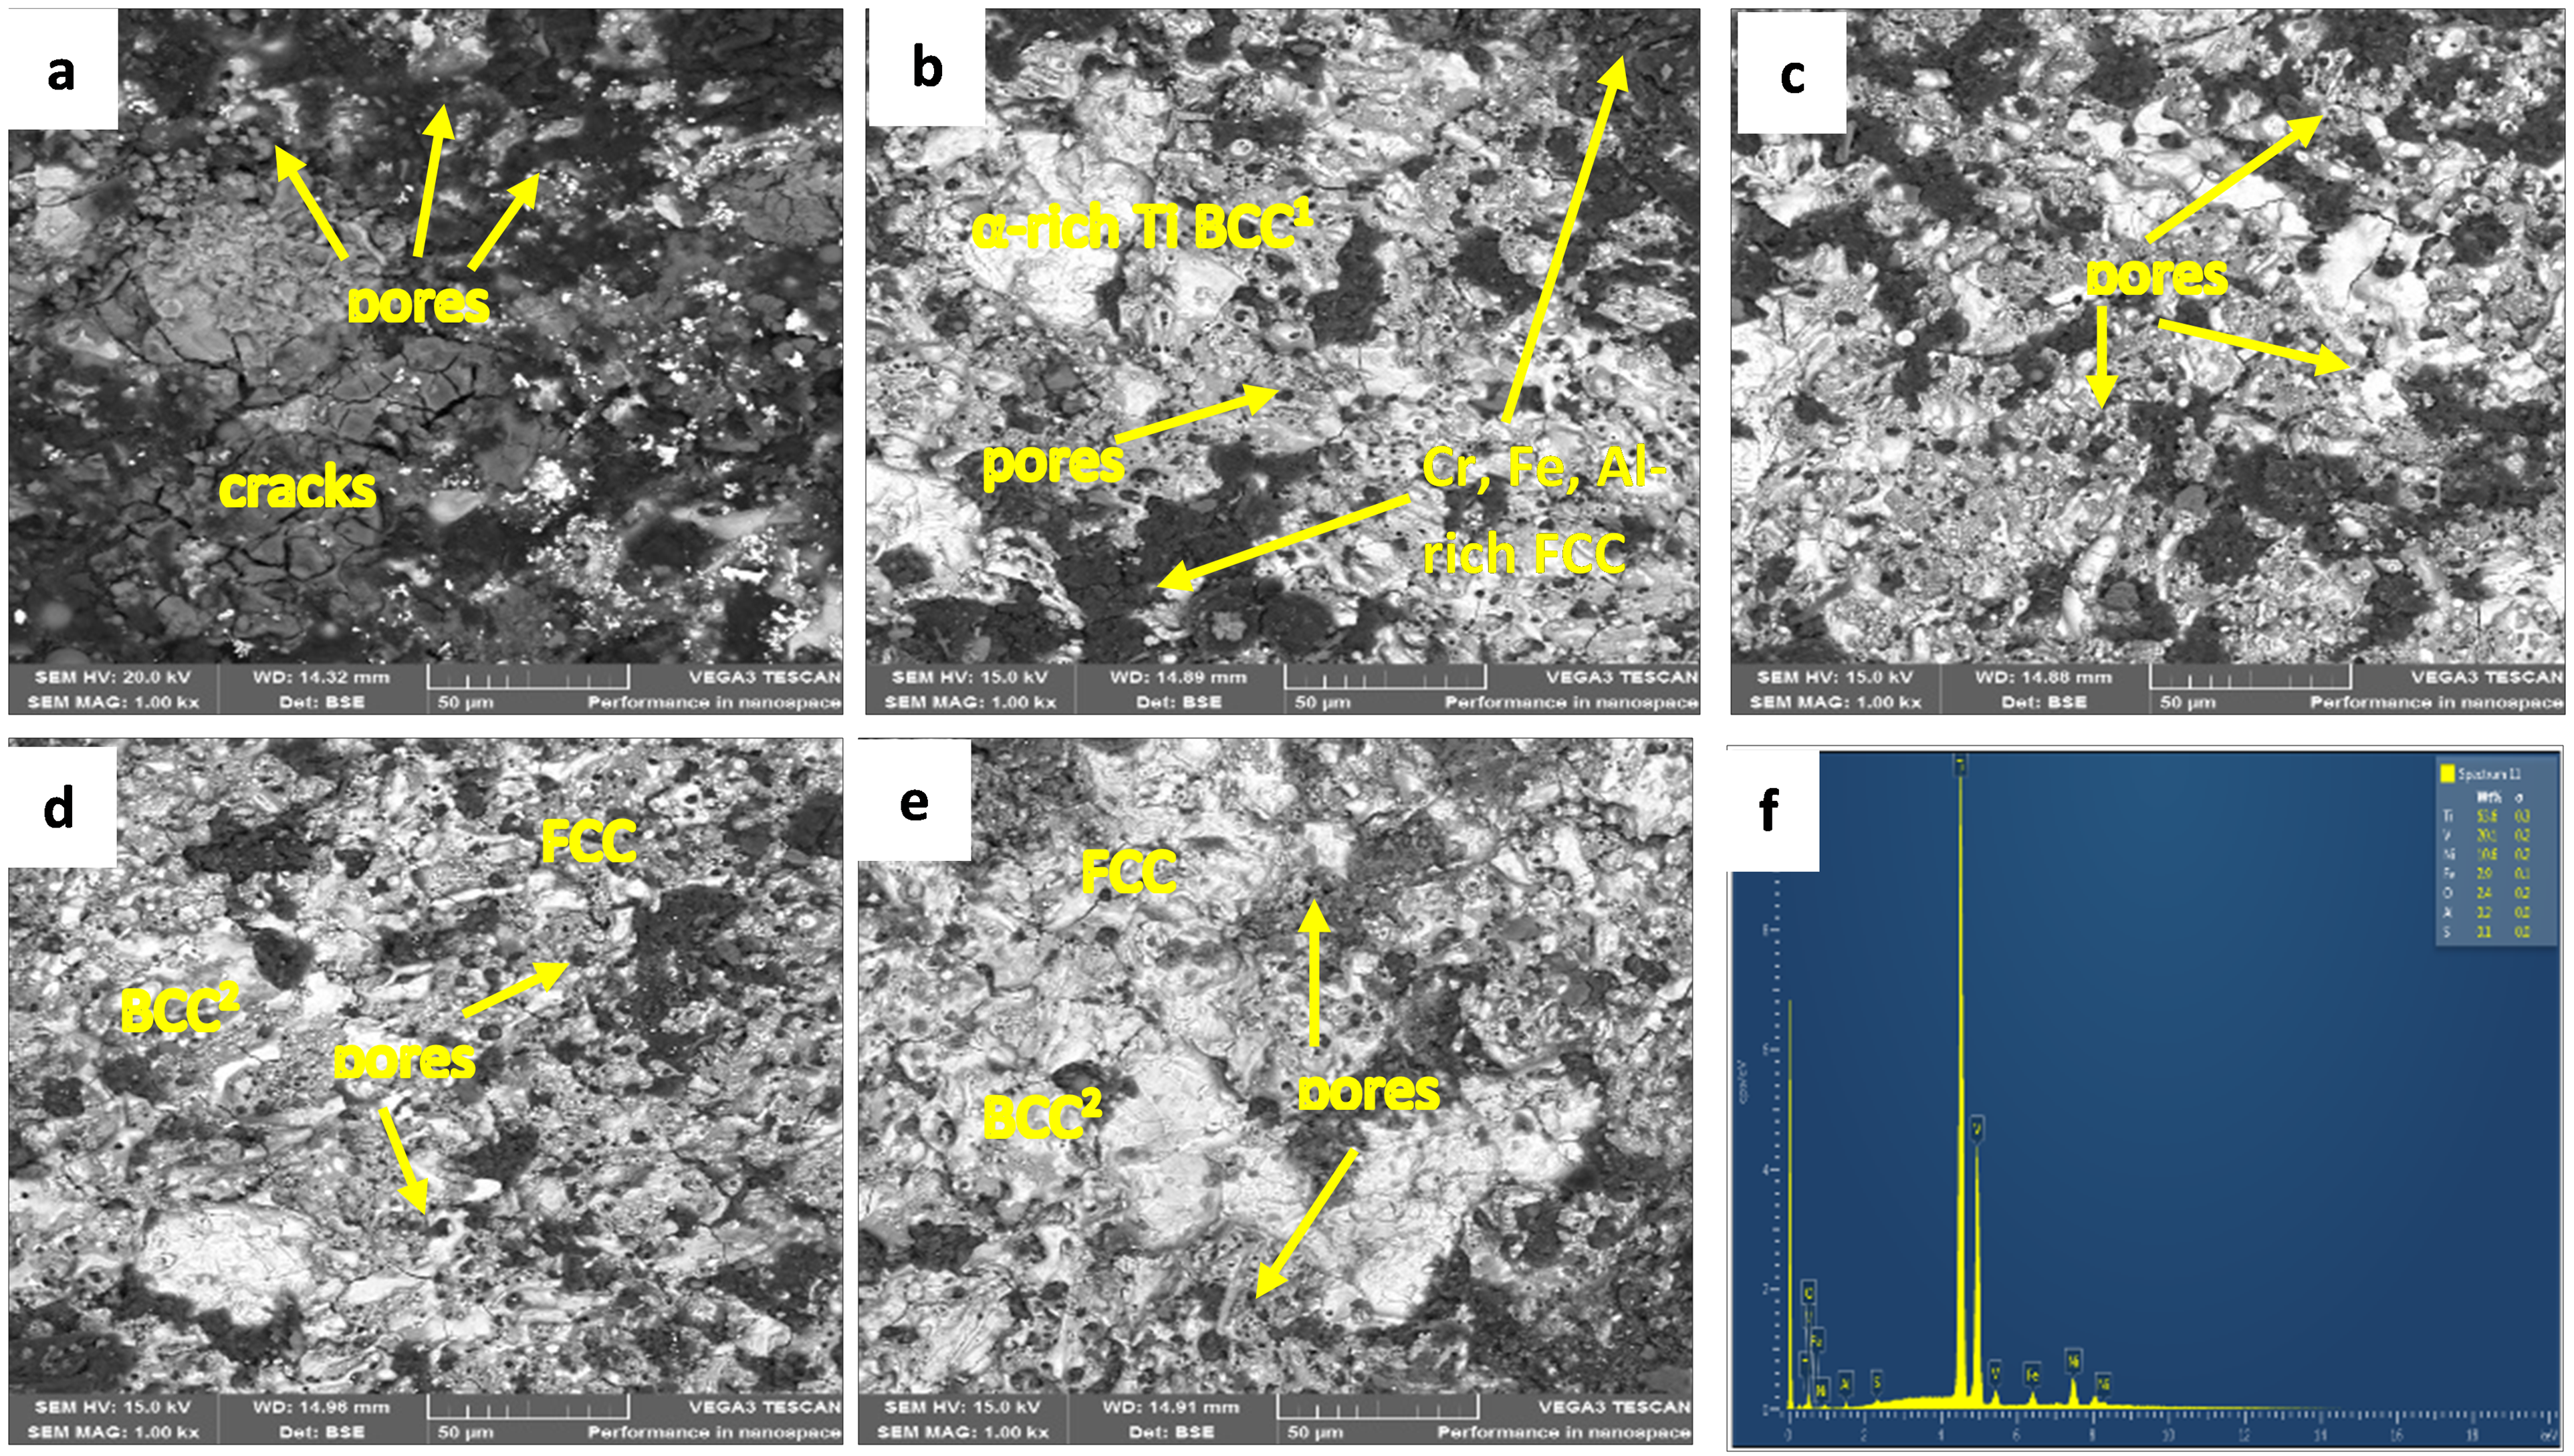
SEM images of HEA at (a) 700°C (b) 800°C (c) 900°C (d) 1000°C (e) 1100°C and (f) EDS of Ti-rich phase after exposure in H2SO4 Medium.
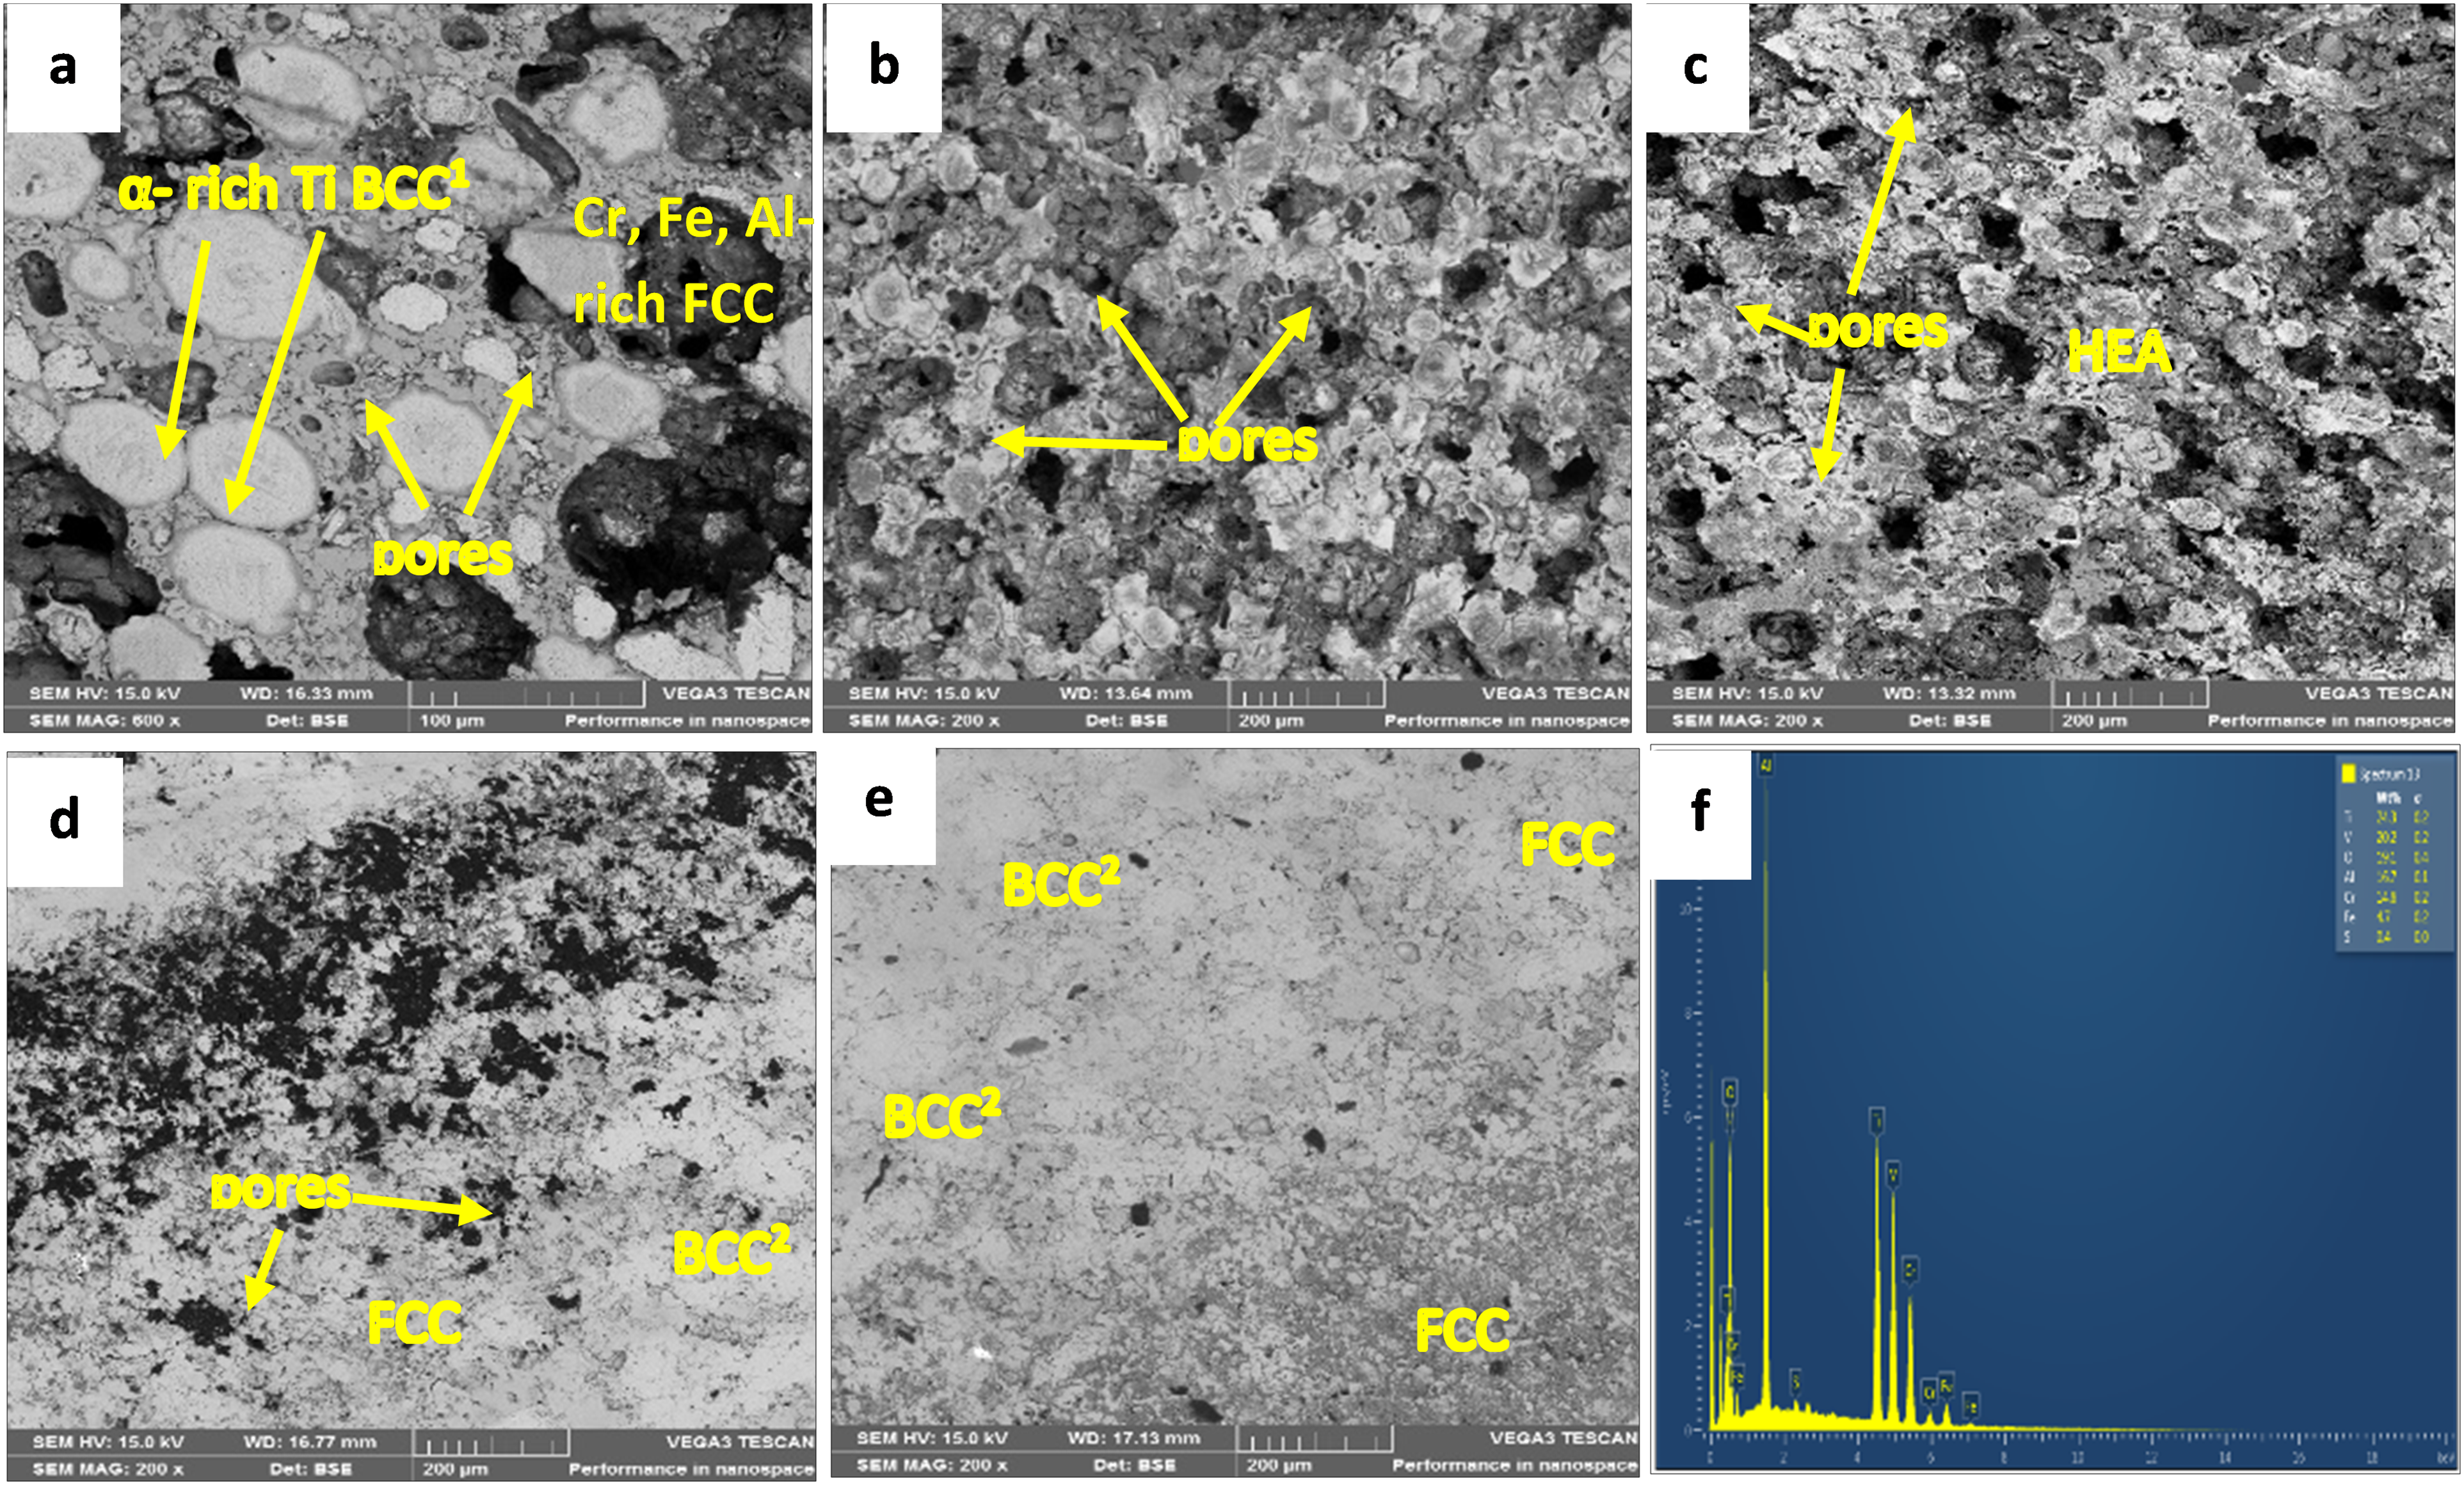
SEM images of HEA at (a) 700°C (b) 800°C (c) 900°C (d) 1000°C (e) 1100°C and (f) EDS of Ti-rich phase after exposure in NaCl medium.
The decrease in micropores, as indicated in Table 1, aligns with the observable features of the SEM images in both sulfuric and chloride mediums, indicating that higher sintering temperatures contribute to reduced porosity. Samples sintered at 1000°C and 1100°C exhibit superior corrosion resistance, evidenced by their fine and smooth surfaces, fewer pores, and microcracks (Figures 6(d) and 6(e)). This trend suggests that elevated sintering temperatures promote microstructural uniformity in the SPSed Ti20-Al16-V16-Fe16-Ni16-Cr16 alloys, limiting plausible localized corrosions caused by galvanic coupling at 1000°C and 1100°C during exposure to H2SO4 and NaCl solutions. The high densification observed in these samples is also correlated with their remarkable corrosion resistance. Comparing the attacks on sintered samples in different mediums, those exposed in the NaCl medium exhibit superior resistance to corrosion compared to those in the H2SO4 medium, as evident in their corroded SEM images (Figures 6 and 7). This correlation aligns with their Tafel parameters detailed in Table 2. It is plausible to assume that metallurgical parameters, including alloy composition, microstructure, and elemental partitioning to phases, play a regulatory role on how these alloys respond to various environmental circumstances. 46
Tribological analysis
The resulting HEA samples’ coefficient of friction (COF) measured in both dry and wet tribology modes is shown in Figure 8, which was measured at a steady state and presented as the average of the overall wear test duration as recorded by the profilometer (Surtronic S128). The COF shows that the COF reduces as the sintering temperature increases, reaching its lowest level at 1000°C before beginning to rise once more. This pattern demonstrates that as the material's metallurgical and thermodynamic stability rises, so does its COF. It was also demonstrated that the COF reduces as the applied load increases. This is well demonstrated by Amonton's law of friction, which indicates that as the applied load increases, the COF of metallic materials falls. 47 As a result, increasing the input load causes much heat to be created, which raises the material's temperature and sets off reactions that weaken the material's thermodynamic, intermolecular, and metallurgical bonding. 48 Soft material experiences less COF than hard and brittle material because it acts as a lubricating agent. Additionally, it was noted in Figure 8 that COF in the dry condition was larger than COF in the wet condition across all samples. This is because deionized water reduces the material's COF by acting as a lubricant and a coolant. 49
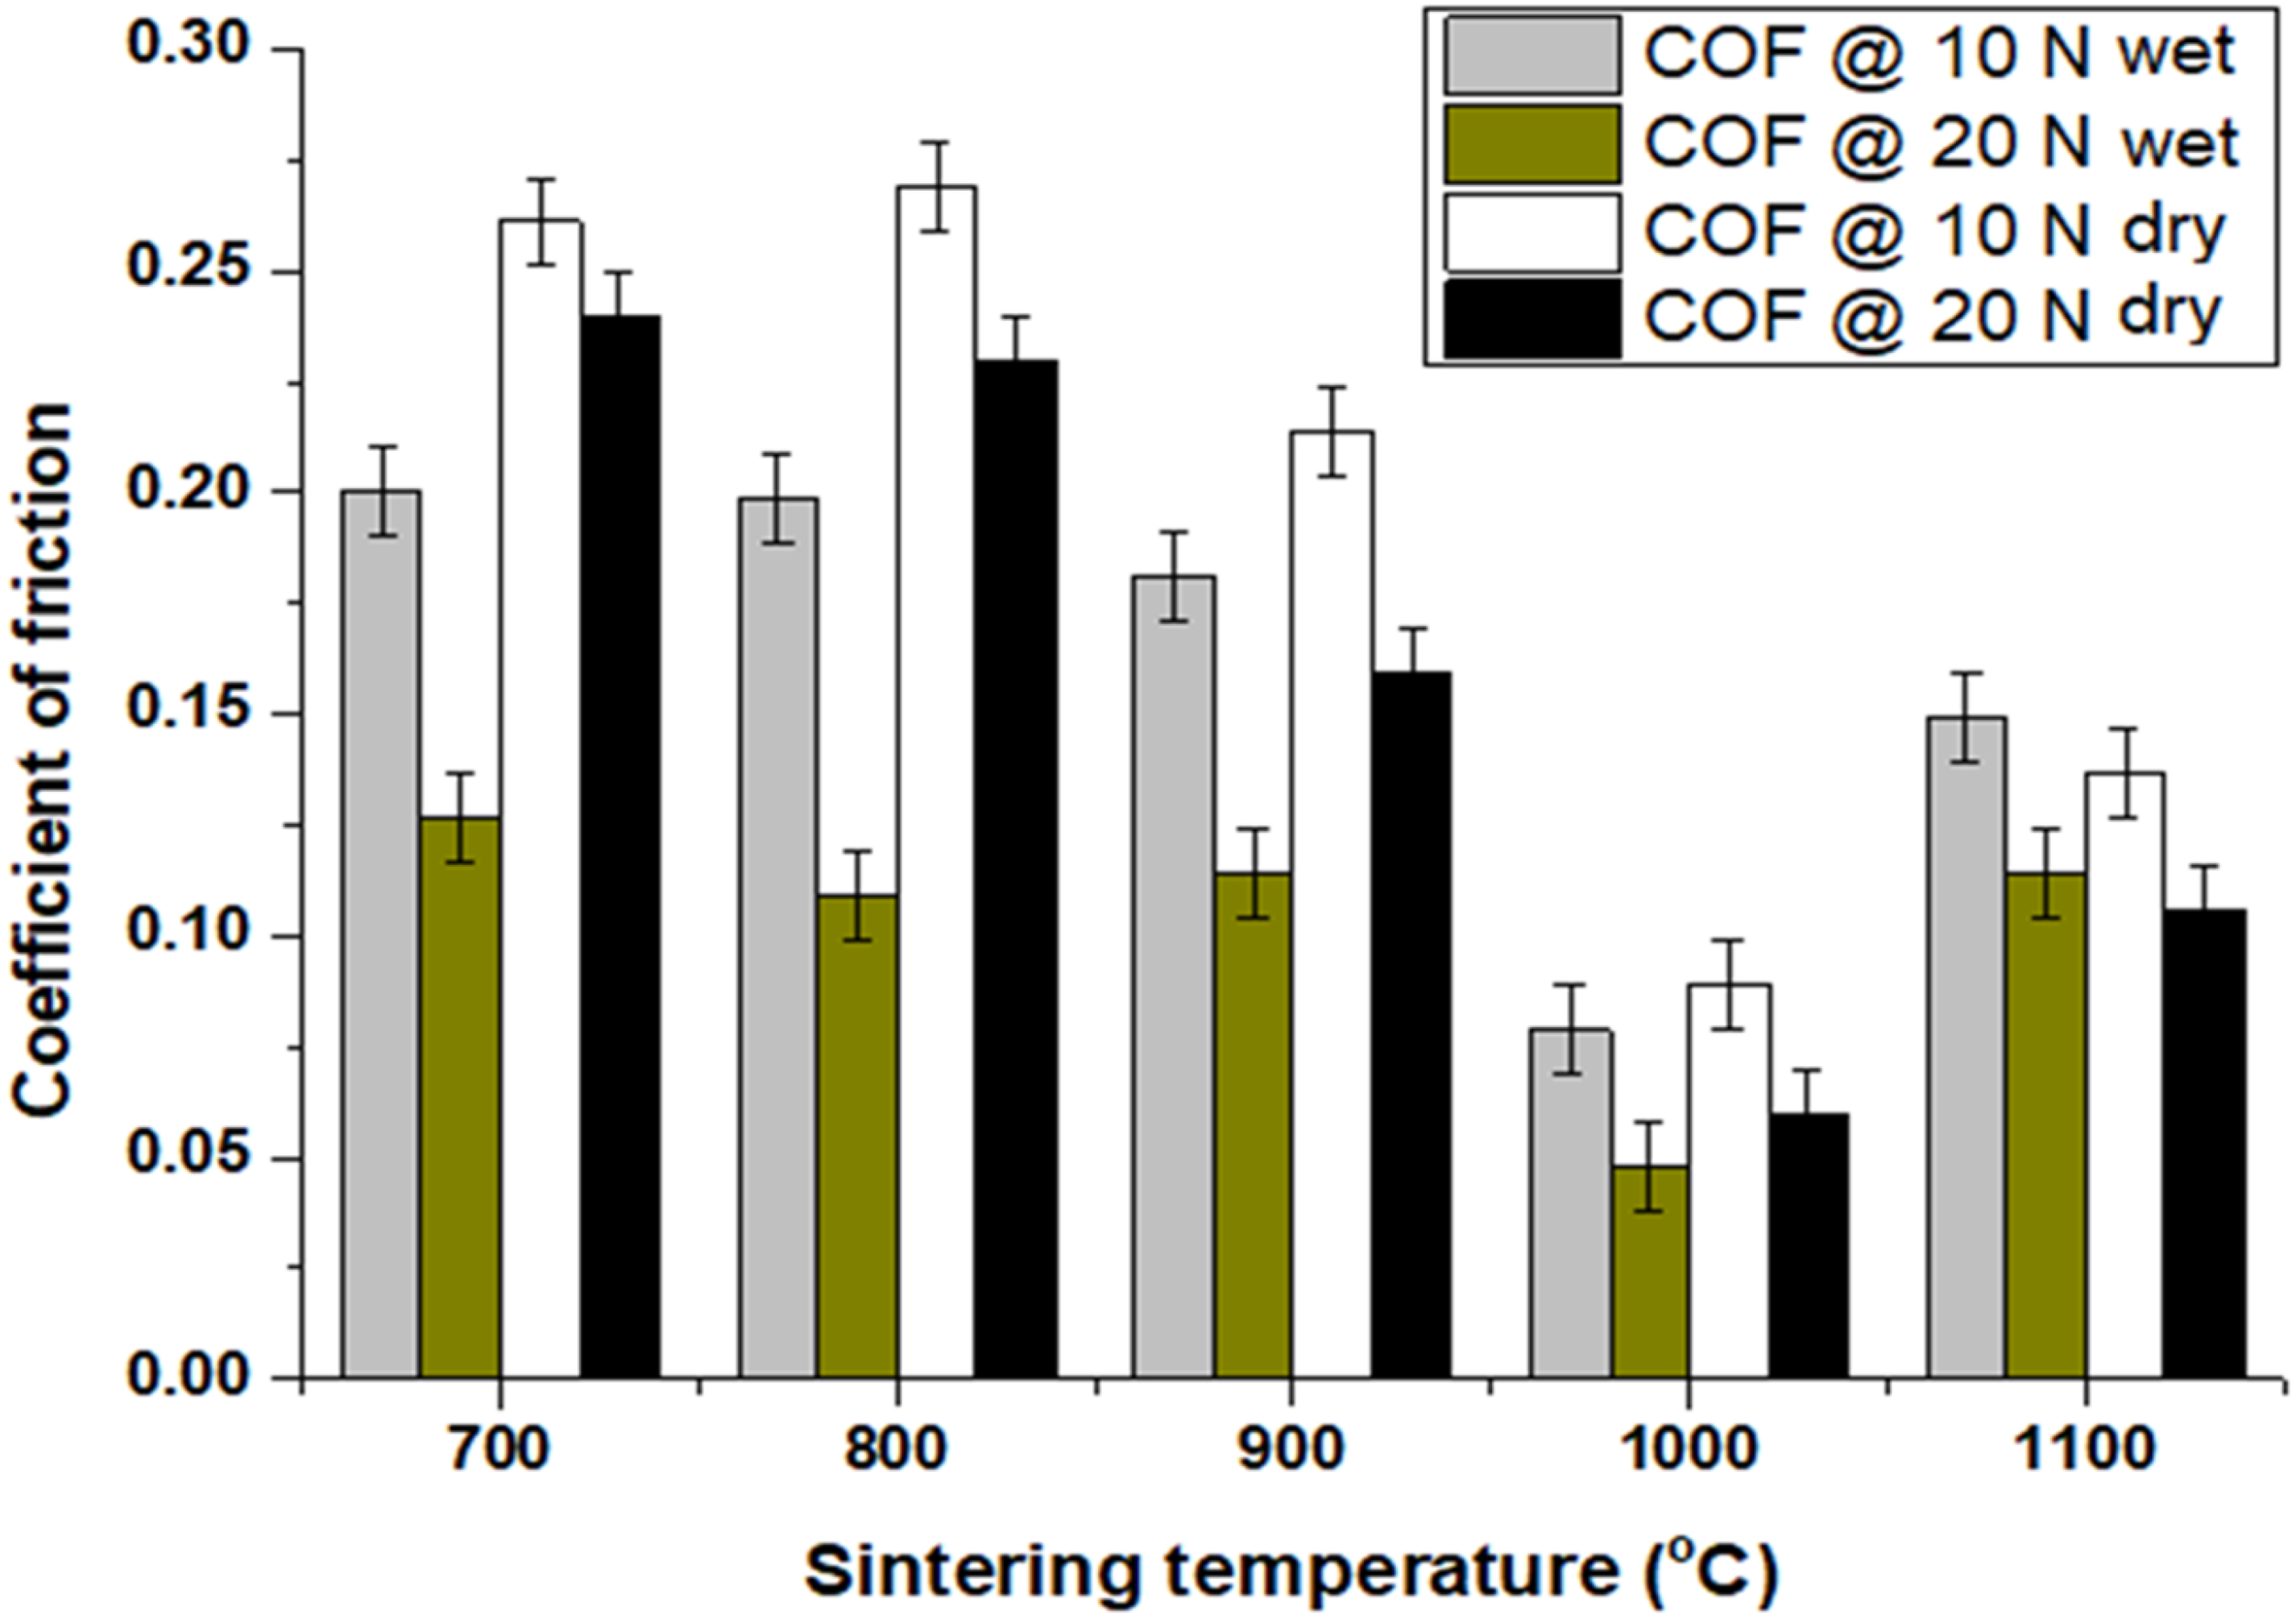
Coefficient of friction of samples tested on dry and wet modes.
With a COF of 0.025 for the sample sintered at 1000°C and a COF of 0.254 for the sample sintered at 700°C, the sample sintered at 1000°C had a 916% higher COF than the sample sintered at 700°C. When the sample was sintered at lower temperatures, the uncrystallized BCC and FCC phases and insufficient metallurgical bonding were the key contributors to the sample's increased COF. This is due to yet to be developed crystalline BCC and FCC phases which enhance ductility, hardness, modulus, and resistance to galling and oxidation 50 in HEA and afterwards induce good tribological characteristics, as revealed by a sample sintered at 1000°C. The availability of adequate components helped the HEA's improved wear resistance even more. This is because research has revealed that Cr 51 is a crucial element known for enhancing the tribological properties of materials, while V 52 and Fe 53 create critical oxides that enhance the anti-wear of HEA even at high temperatures. Under applied stresses of 10 N and 20 N, Figure 9 displays the tribology rate of samples placed through wear testing in both dry and wet conditions, which shows how the wear resistance increased as the sintering temperature increased. In general, the addition of Al to the alloy enhanced the wear characteristics of the produced HEA, which also increased the crystallization of the BCC phase, 54 and increasing strength.
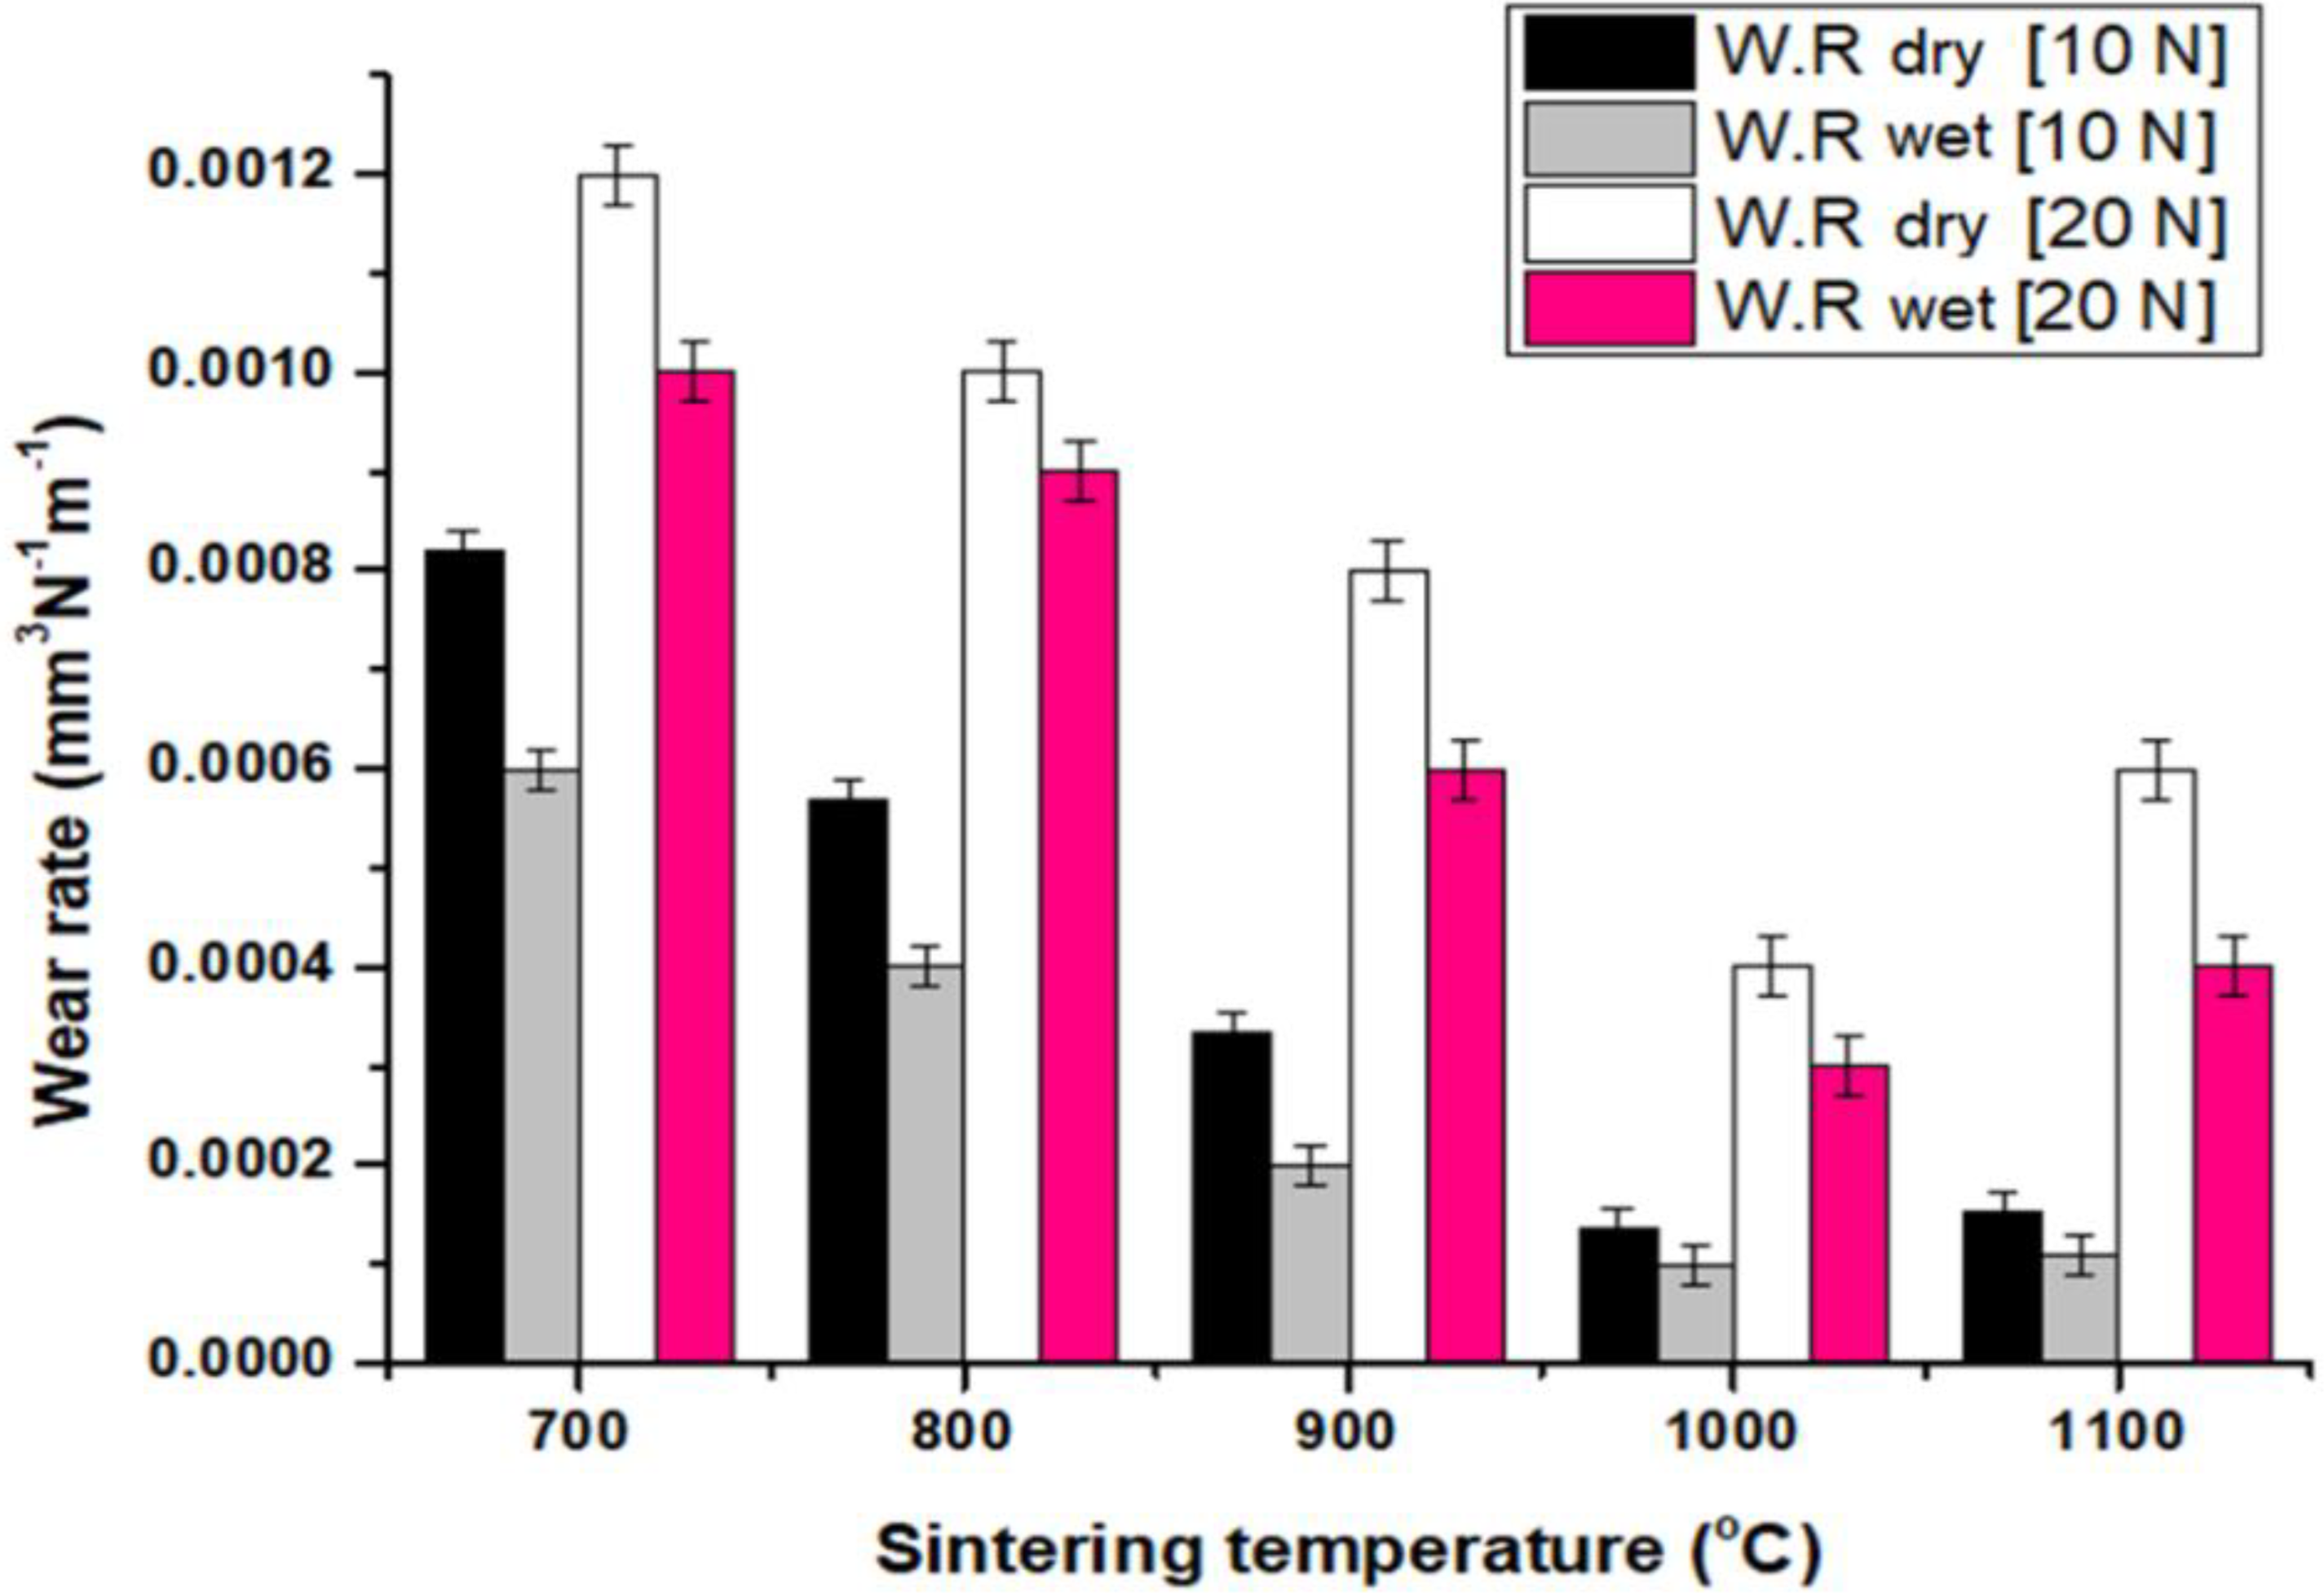
Wear rate of sintered samples of HEA.
Materials with a large mechanical strength have a high anti-wear, according to Chuang et al. 55 A material's resistance to erosion and indentation also affects how resistant it is to wear, according to Archard. 56 It can be proven that in both dry and wet conditions, the wear rate increased as the applied stress increases. According to the observations made by other authors, higher loads result in greater impact and shear forces, which in turn causes more materials to delaminate.57,58 The quantity of material removed per unit load decreased when water acted as a coolant to decrease heat, 59 hence the tribology rate measured in the dry mode was greater than the tribology rate recorded in the wet condition. At 20 N of loading (dry mode), the sample fabricated at 700°C exhibited the maximum wear rate of 8.2 × 10⁻³ mm3N−1m−1, whereas the sample fabricated at 1000°C exhibited the lowest wear rate of 1.3 ×10⁻⁴ mm3N−1m−1. This value generally shows that it is better than the tribology rates of a number of popular alloys, such as Inconel 718, which has a value of 3–6 ×10⁻⁴ mm3N−1m−1 (an enhancement of 130%), AISI 316L steel, which has a wear rate of approximately 1 ×10⁻³ mm3N−1m−1 (an improvement of 666%), and TiAl and Fe3Al alloys, which have wear rates of approximately 1 ×10⁻³ mm3N−1m−1 (same as 666%).60–62 Notably, raising the fabricating temperature from 700°C to 1100°C improved the wear rate by 620% for similar sample.
Figure 10 displays the COF patterns of the samples as they underwent a dry condition wear test. The two primary stages of the profiles are run-in and steady-state stages. 63 Friction force begins by rapidly increasing from zero to its steady state. The amount it moves up depends on the material's strength, asperity, and applied load.64,65 Figure 10(a) displays the views at 10 N loading. The sample fabricated at 1000°C had a COF that increased to 0.132, and then plummeted to 0.01 before remaining at a steady state of 0.036, whereas the sample sintered at 700°C had the maximum COF range, which was about 0.17 to 0.51. This suggests that the earlier sample was more metallurgical stable than the latter. Also, Figure 10(b) shows that the COF range for sample sintered at 1100°C is around 0.06 to 0.12, at 1000°C is around 0.12 to 0.12 and at 700°C is around 0.17 to 0.34. Therefore, it can be acknowledged that as applied force increases, the COF decreases. This is due to the fact that increased force produces increased heat, which softens the material and lowers COF. 65
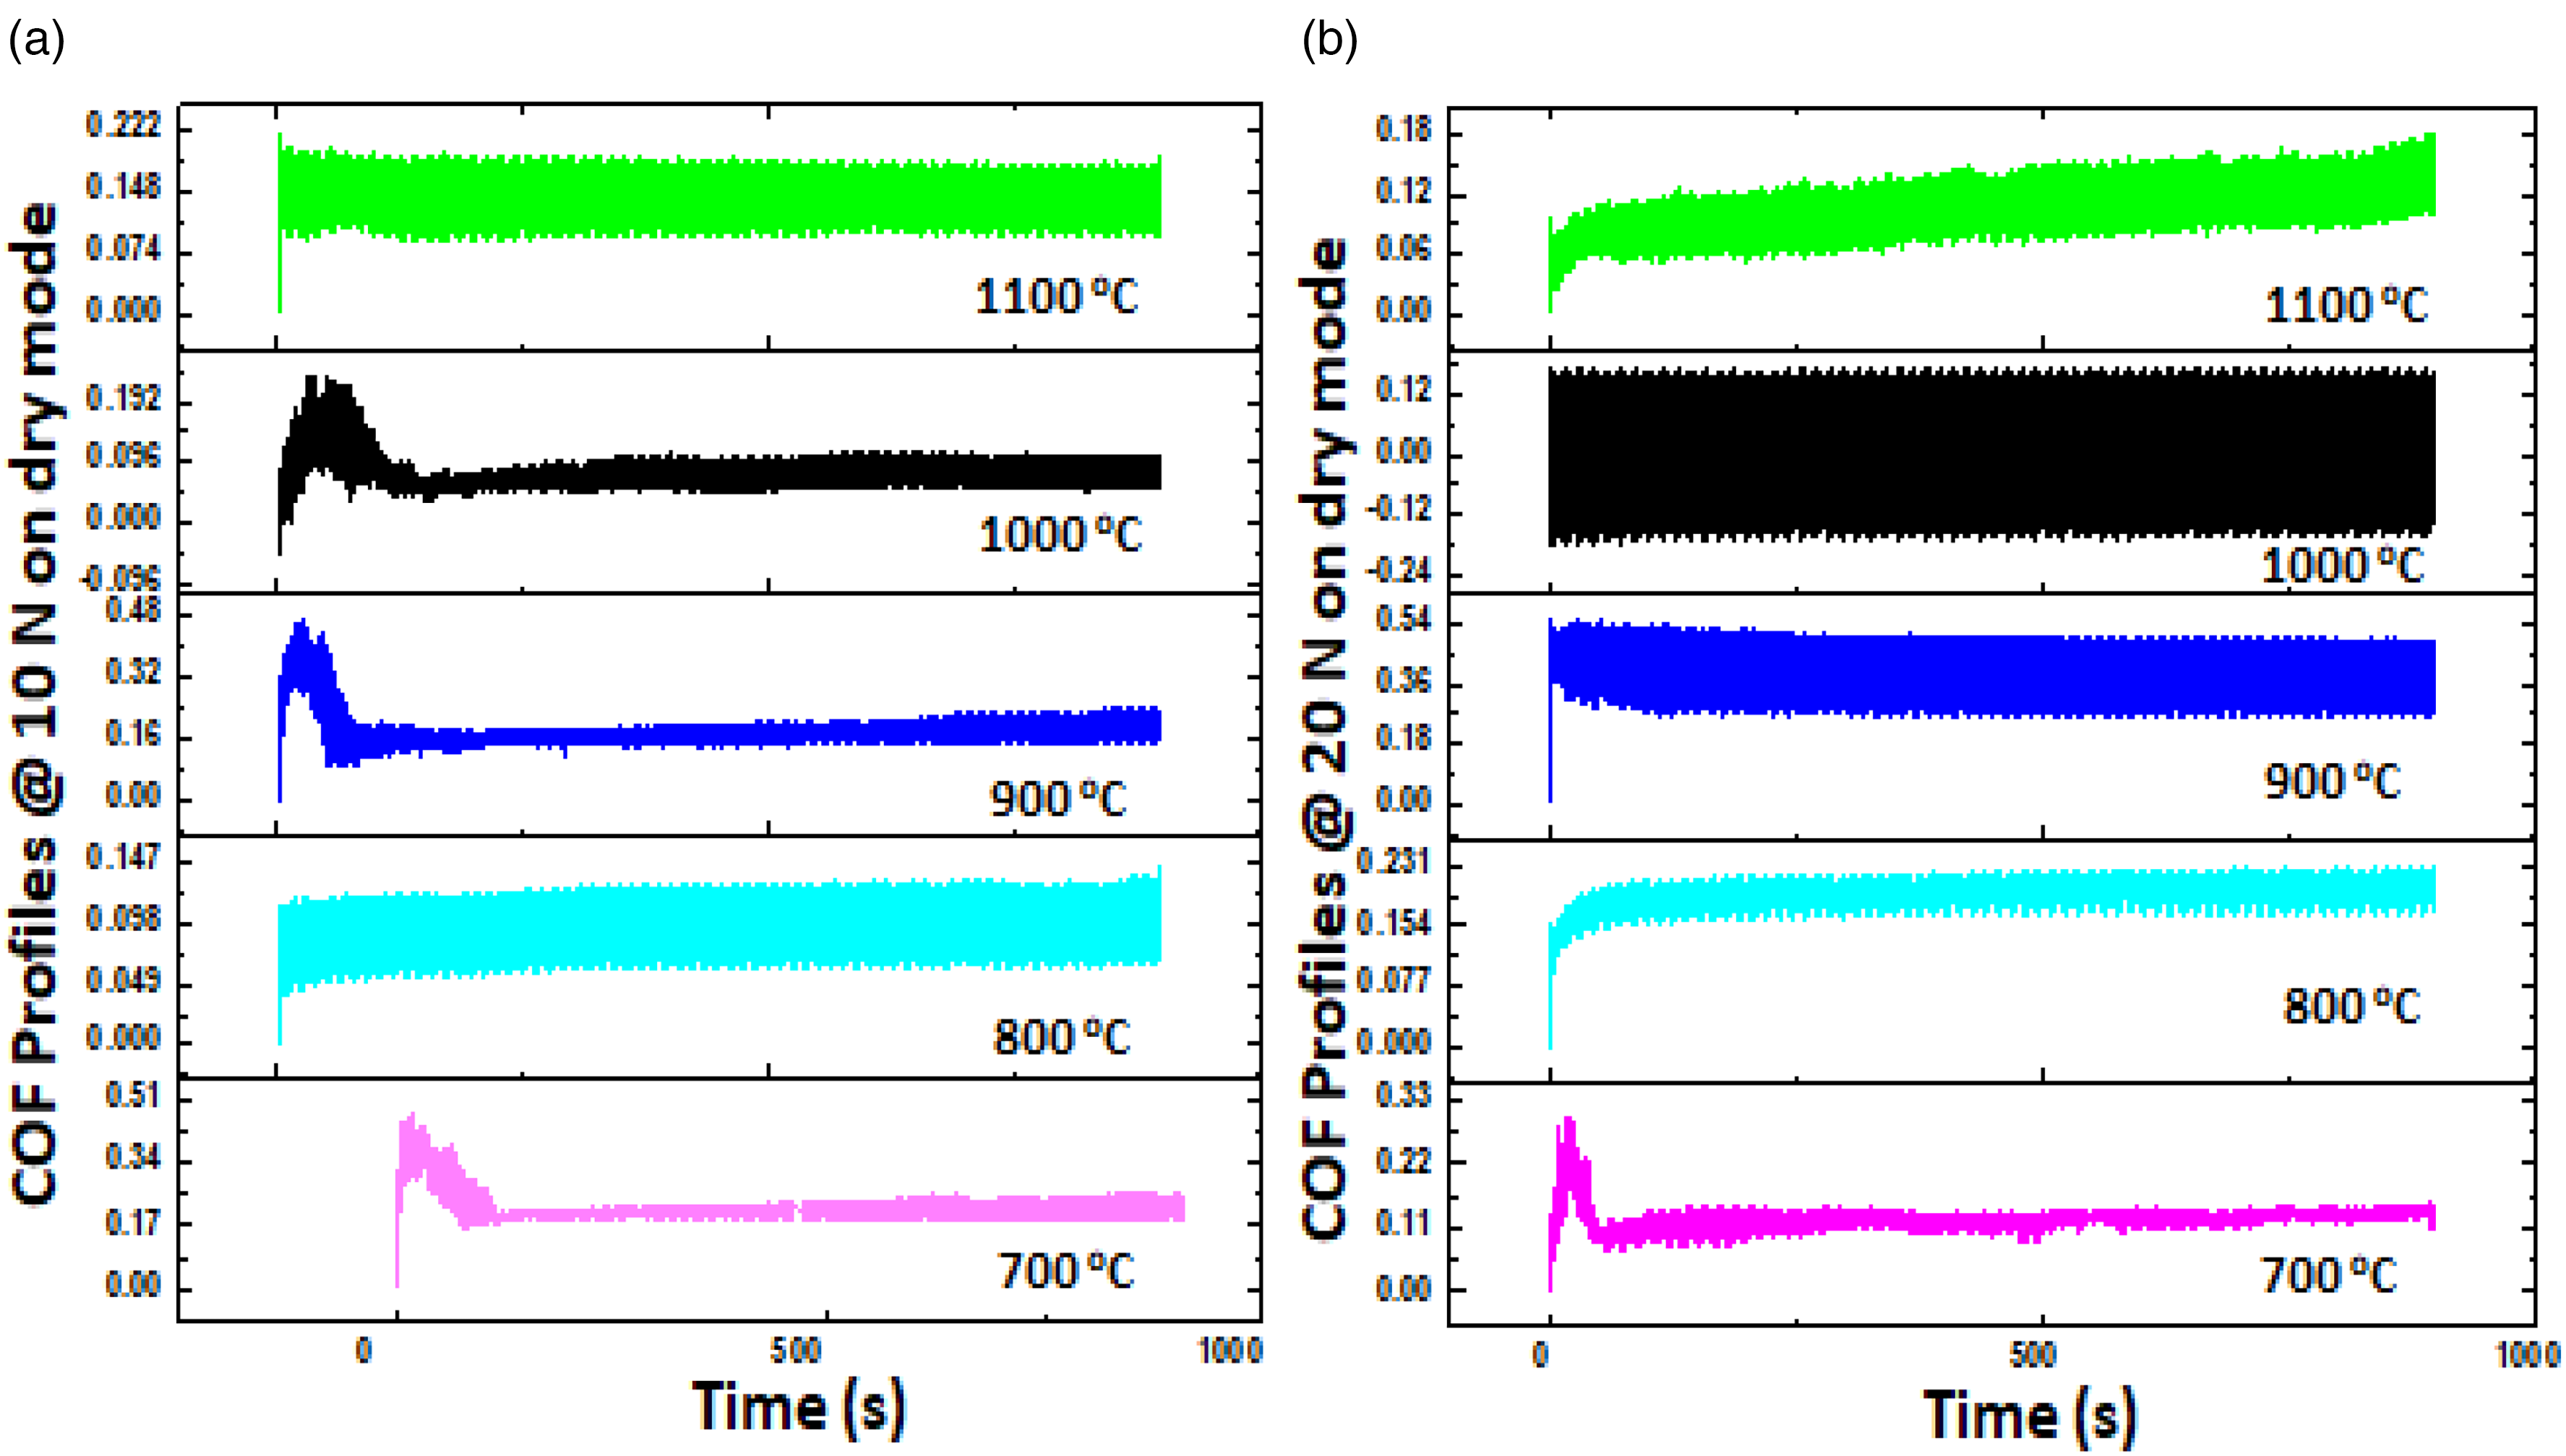
Coefficient of friction profiles of sample tested on dry condition at (a) 10 N (b) 20 N.
Figure 11 displays the COF patterns for samples examined using deionized water in the wet condition. The COF dropped as the applied forced rose in accordance with Amonton's law. 47 Water encourages the development of Al, V, and Fe oxides that can act as lubricating films more than in a dry medium.53,66,67 As can be shown, the alloys’ thermodynamic and metallurgical stability may be predicted using the COF profiles. Samples sintered at higher temperatures (1000°C and 1100°C) displayed more stable profiles compared to samples sintered at lower temperatures. Figure 12 depicts the wear scars left on the samples that were put through a dry mode tribology test with a 20 N loading. As the fabrication temperature increased from 700°C to 1100°C, the tribological condition changed from adhesive only to adhesive and delamination to finally abrasive tribology.
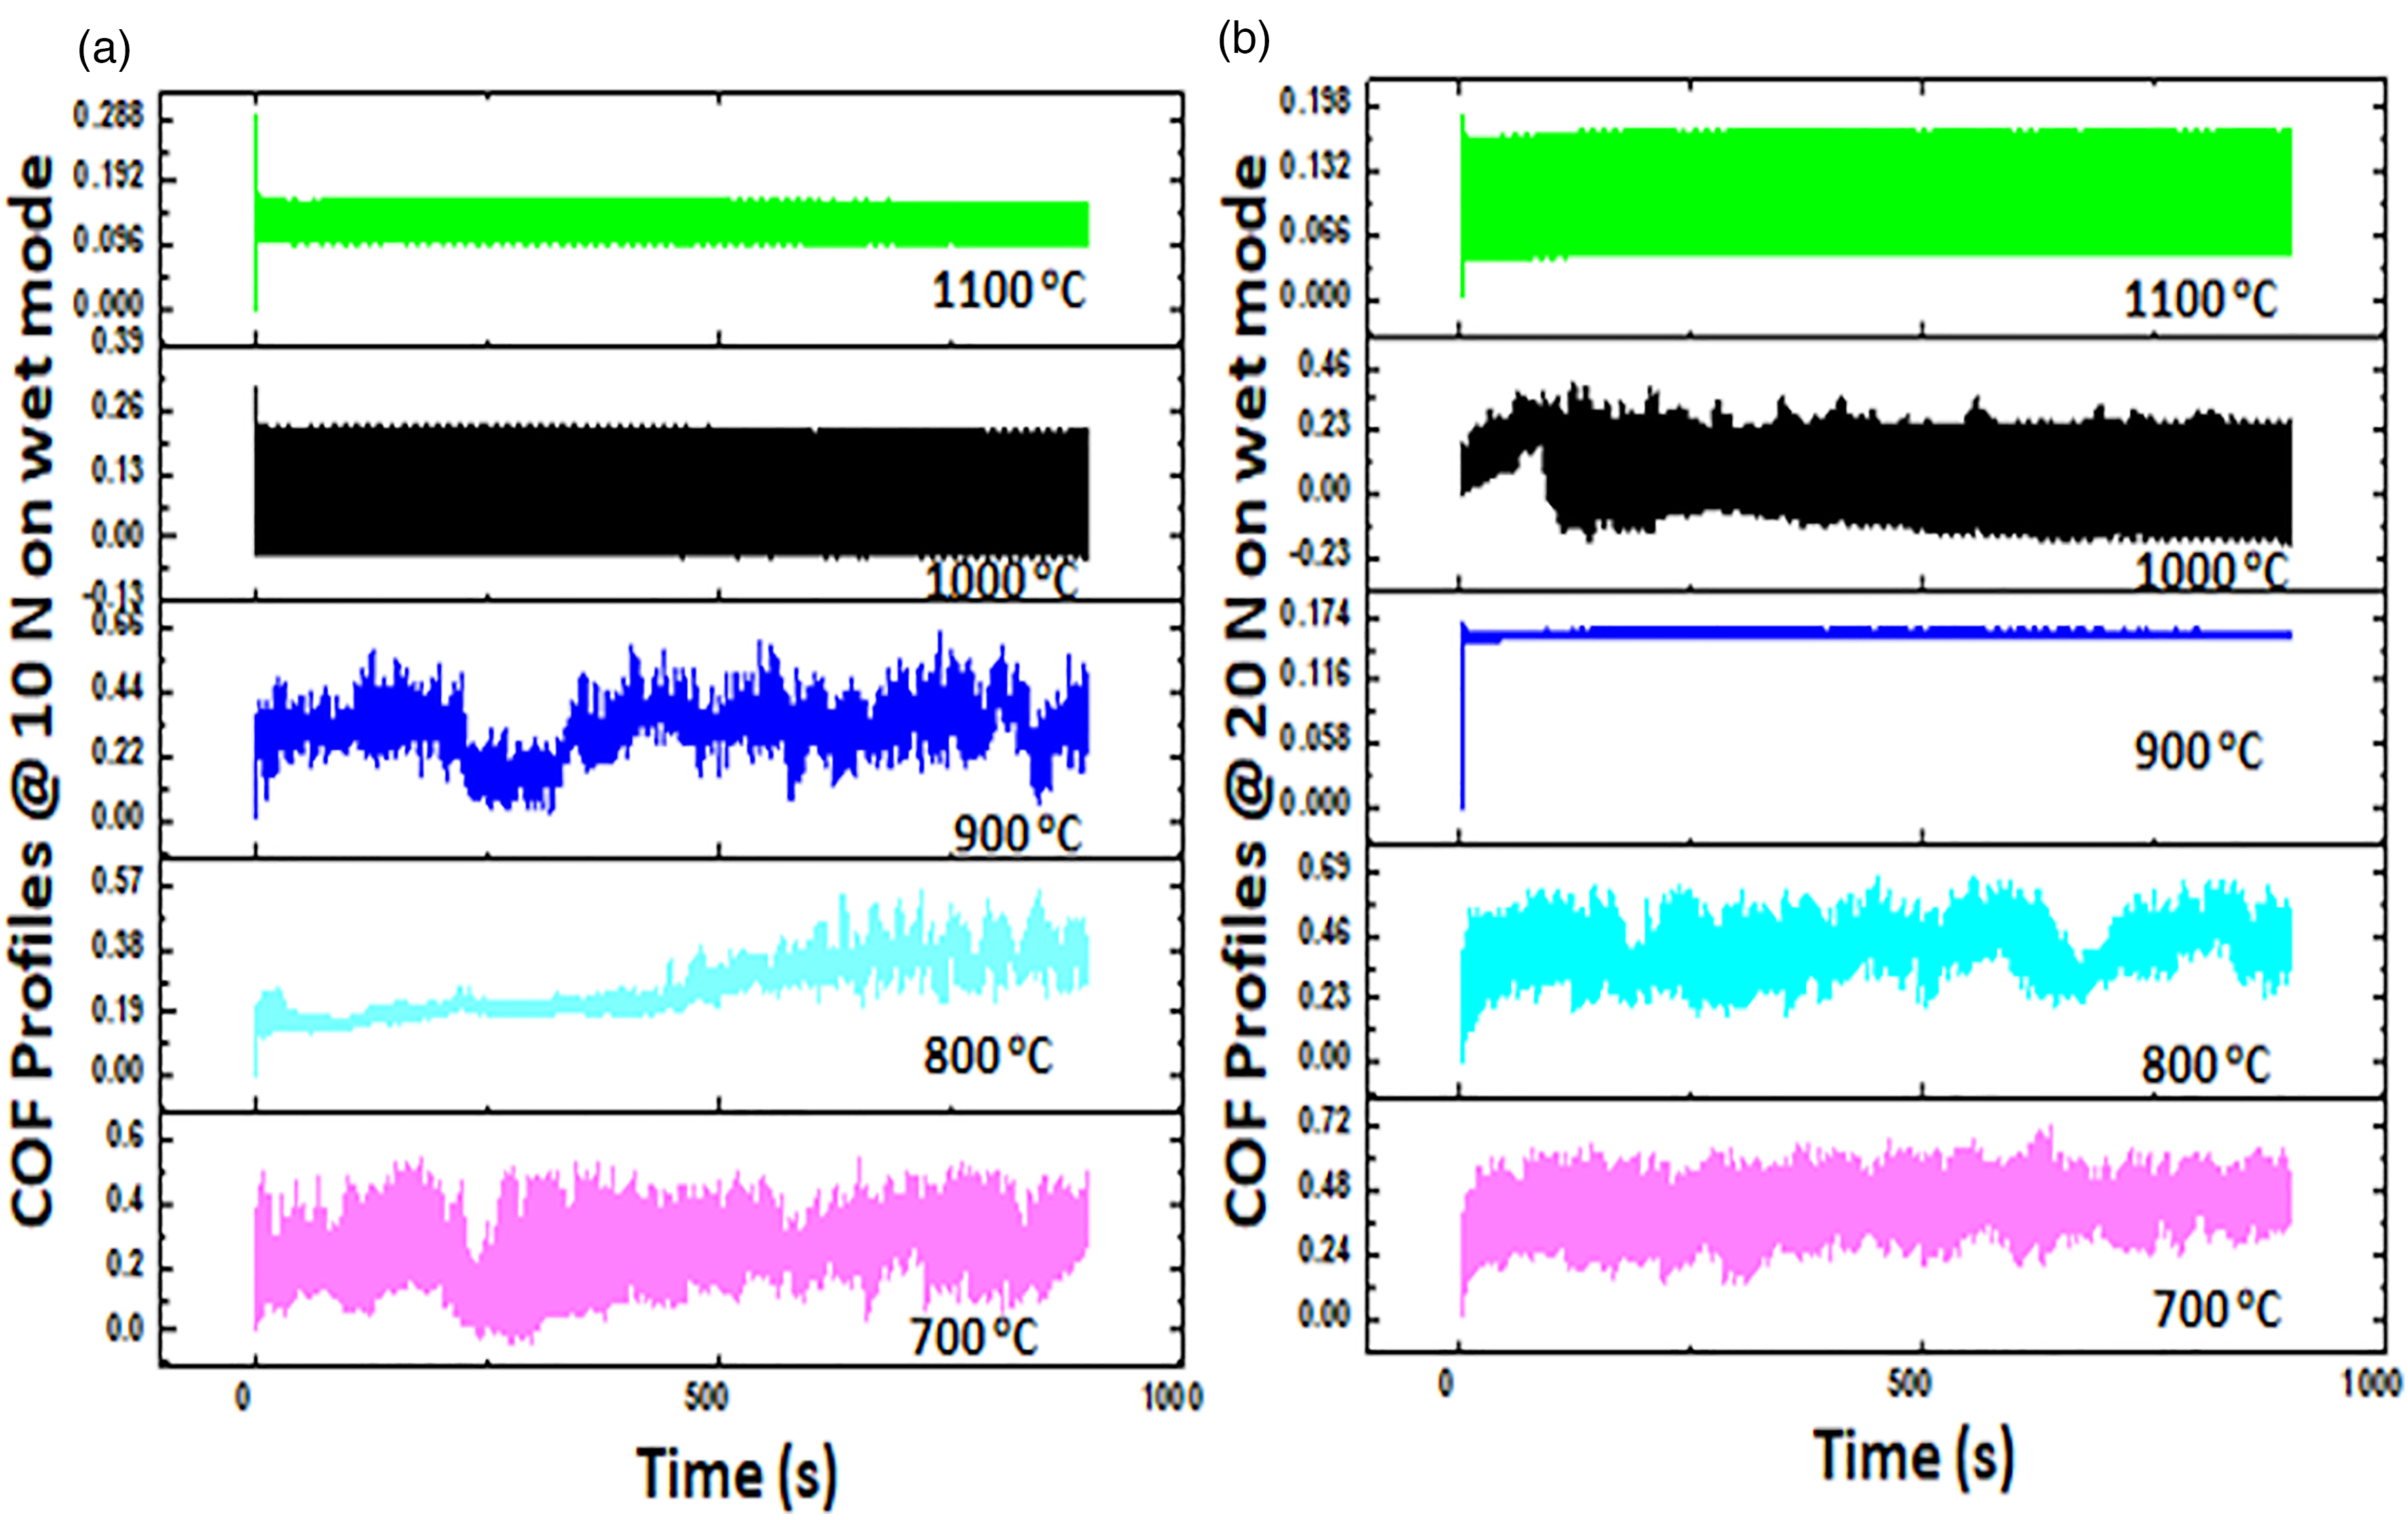
Coefficient of friction profiles of sample tested on wet mode at (a) 10 N and (b) 20 N.
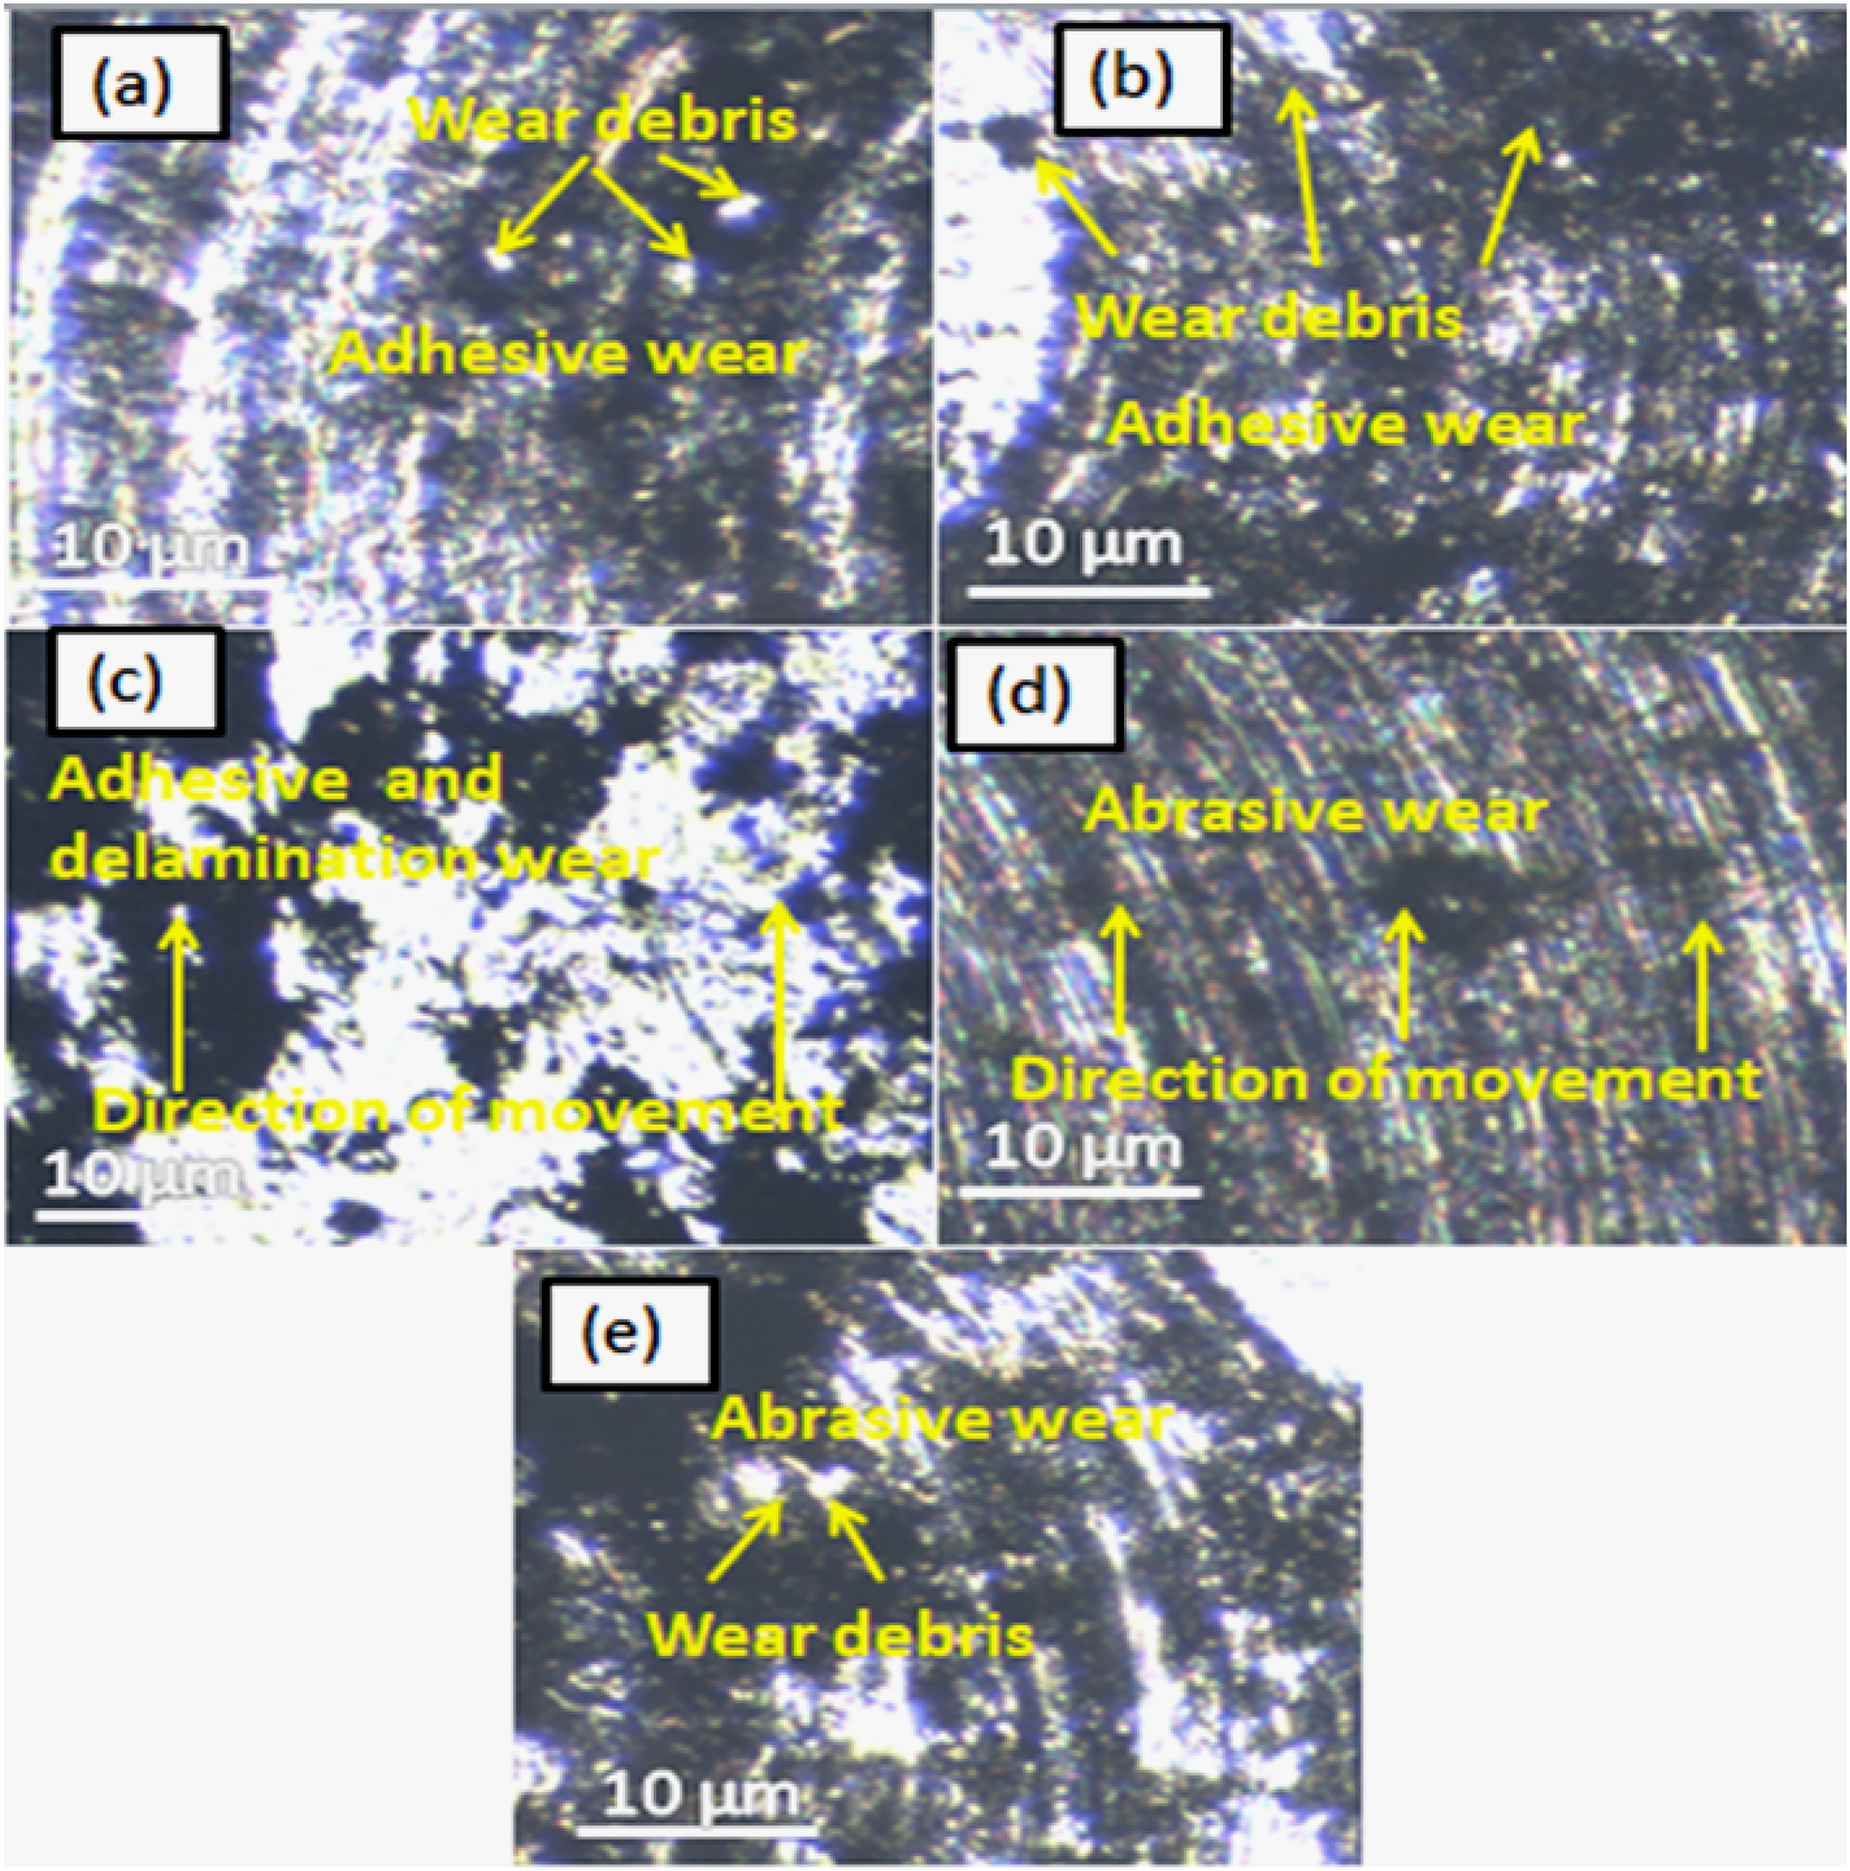
Wear track profiles of samples subjected to tribological tests (a) 700°C (b) 800°C (c) 900°C (d) 1000°C and (e) 1100°C.
Figure 12(a) depicts the tribology track on a sample fabricated at 700°C. As whitish material was being removed, it was obvious that the type of wear was adhesive wear. Material erosion left behind grooves that run parallel to the sample's direction of motion. The sample showed weak metallurgical bonding, as evidenced by the significant amount of components that had been removed. Figure 12(b) displays the wear track on a sample that was sintered at 800°C. It is clear that materials were removed, however not as much as the sample sintered at 700°C. From a mechanical and tribological standpoint, this sample is preferable to a sample sintered at 700°C. The wear track for the sample sintered at 900°C is displayed in Figure 12(c), which shows adhesive and delamination wear mode. There was a lot of wear debris in this sample because so many materials were removed. This demonstrates the sample's weak bonding and weak intermolecular forces. In Figure 12(d), the sample that was sintered at 1000°C is depicted, which reveals that the material pull off was significantly decreased and the wear mode had switched to an abrasive one. Despite their short depth, the grooves run parallel to the direction of motion. Figure 12(e) displays a sample that was sintered at 1100°C. Abrasive wear mode and white wear debris were the signs of wear.
This study has investigated the tribological and corrosion properties of Ti20-Al16-V16-Fe16-Ni16-Cr HEA sintered at different temperatures. However, it is recommended that further studies should be done to bridge the limitations of this present study. Further study should be on similar or different HEA formulations using the same spark plasma sintering technology but considering other sintering parameters such as input power, sintering duration, holding time, and applied pressure. Another advanced fabrication method with parameters’ optimization such as laser additive manufacturing can also be used on similar or different HEA formulations. With such HEA development, other properties determination should be focused such as hot corrosion, triobocorrosion, mechanical properties, and thermal stability.
Conclusion
The SPS development of Ti20-Al16-V16-Fe16-Ni16-Cr HEA yields the following findings:
Optimal SPS temperatures of 1000°C and 1100°C result in samples characterized by a fully blended solid solution of HEAs and refined particles rich in both FCC and BCC phases. Among the samples, those sintered at 1100°C demonstrate the highest corrosion resistance, while those sintered at 700°C exhibit the least. The full development of a solid solution at 1100°C coupled with subsequent stabilization, is credited with enhancing corrosion resistance. The developed HEA displays minimal corrosion rates of 0.18253 mm/yr and 0.035468 mm/yr when subjected to acidic and salty media at room temperature. This signifies a remarkable 92% and 94% reduction compared to HEA at 700°C. At a loading of 20 N, the developed HEA showed the lowest tribology rate of 1.3 × 10⁻⁴ mm3N−1m−1. This amounted to a 130% and 666% improvement over Inconel 718 and TiAl alloy, respectively. The sample fabricated at 1000°C had the lowest COF (dry mode) of 0.084. The tribology experiments’ dry mode had a higher wear rate than the wet mode because deionized water acted as a coolant and lubricating agent to lessen frictional coefficient. The tribological rate increased as the load increased, although COF reduced as the applied force increased because larger load produces more heat and remove more material, which reduces material properties and decreases COF.
Footnotes
Acknowledgment
The authors would love to appreciate Tshwane University of Technology for their support towards this study.
Authors’ contribution statements
Data availability statement
The authors confirm that the data supporting the findings of this study are available within the article.
Declaration of conflicting interests
The authors declared no potential conflicts of interest with respect to the research, authorship, and/or publication of this article.
Funding
The authors received no financial support for the research, authorship, and/or publication of this article.