
Abstract
Background
Control of the arterial partial pressure of carbon dioxide (PaCO2) is important in the ventilated patient. End-tidal carbon dioxide (ETCO2) levels are often used as a proxy, but are clinically limited. The difference between the PaCO2 and ETCO2 has been suggested to be 0.5–1.0 kPa. However, this has not been consistently reflected in the physiologically unstable pre-hospital patient. This study aims to elucidate the PaCO2-ETCO2 gradient for pre-hospital intubated patients.
Methods
This was a retrospective, cohort study using data identified from the HEMSbase 2 database (Feb 2015–Nov 2018). Patients were included if they had documented ETCO2 and arterial PaCO2 measurements. Arterial PaCO2 data that could not be linked to within 5 minutes of ETCO2 were excluded. Bland-Altman plots were calculated to describe agreement.
Results
A total of 73 patients were identified. Aetiology was arranged into three categories: 13 (17.8%) medical, 22 (30.1%) traumatic and 38 (52.1%) out-of-hospital cardiac arrest (OHCA). The median PaCO2-ETCO2 gradient was 2.0 [1.3–3.1] kPa. A PaCO2-ETCO2 gradient of 0–1 kPa was seen for only 11 (15.1%) of total patients. The Bland-Altman agreement for all aetiologies was more than the accepted gradient of 0-1 kPa with the largest bias and widest limits of agreement seen for OHCA (–3.2 [0.3 – –6.8]).
Conclusion
The magnitude of the differences between the ETCO2 and PaCO2, levels of variation and inability to predict this suggest that ETCO2 is not a suitable surrogate upon which to base ventilatory settings in conditions where pH or PaCO2 require precise control.
Introduction
Capnography provides a non-invasive and continuous assurance of tracheal tube placement.1–3 End tidal carbon dioxide (ETCO2) also contributes to circulatory assessment,1–3 particularly in cardiac arrest 4 , 5 and has a role in both metabolic6–9 and respiratory monitoring. 10 , 11 Mechanical ventilation enables clinicians to control the arterial partial pressure of carbon dioxide (PaCO2) and consequently arterial pH with potential physiological benefits across a range of illness. Hypercapnia (PaCO2 >6.0 kilopascals, kPa) causes acidosis and cerebral vasodilation, so increasing intracranial pressure. 12 , 13 Conversely, hypocapnia (PaCO2 <4.0 kPa) causes alkalosis and cerebral vasoconstriction, which may lead to cerebral ischaemia. 12 , 14 , 15 Unintentional hypercapnia and hypocapnia frequently occur in clinical practice and may worsen outcomes for patients, particularly those with a traumatic brain injury (TBI).14–16 In patients successfully resuscitated from cardiac arrest, acidosis has a negative inotropic and pro-arrhythmogenic effect, and is associated with an increased risk of multi-organ failure and mortality.17–19 However, recent data observed that mild to moderate hypercapnia may be associated with a high probability of good neurological outcome, suggesting that acidosis may be of benefit in out-of-hospital cardiac arrest (OHCA). 20
ETCO2 is frequently used by clinicians as a surrogate for PaCO2 1 , 2 , 3 but does not necessarily correspond to the PaCO2 levels obtained on an arterial blood gas (ABG). 1 , 2 Understanding the relationship between the PaCO2 and ETCO2 is important in guiding ventilation decisions for physiologically unstable pre-hospital patients.21–24 The Association of Anaesthesists of Great Britain and Ireland (AAGBI) recommend maintaining ETCO2 4.0–4.5 kPa to achieve normocapnia post-intubation with pre-hospital emergency anaesthesia. 25 In healthy adults the acceptable difference between PaCO2 and ETCO2 is widely quoted as 0.5–1 kPa. 26 Most studies exploring this relationship have been undertaken in spontaneously breathing patients11,27–29 or in the operating theatre. 30 , 31 In ventilated unstable pre-hospital patients the difference may vary as a consequence of ventilation-perfusion mismatch, acid-base disturbance, haemodynamic instability and ventilator set-up. 32 , 33 Studies exploring the relationship between PaCO2 and ETCO2 in unstable patients have shown significant heterogeneity.
The literature on the relationship between ETCO2 and PaCO2 is conflicting and may differ across disease processes, with an increasing gradient associated with increasingly severe metabolic and physiologic disturbance. 14 , 16 , 22 These studies have largely been undertaken in an Emergency Department (ED) 11 , 14 , 16 , 34 , 35 or intensive care unit (ICU) 10 , 26 , 36 setting. Four studies have examined the PaCO2-ETCO2 gradient in pre-hospital intubated patients, all of which concluded that the PaCO2 cannot be estimated by the ETCO221–24 Methodological limitations of these studies include a variable time lag between ETCO2 and PaCO2 sampling, 22 , 24 focus on a single aetiology alone, 22 , 24 and small sample size. 21 , 23 , 24
PaCO2 is rarely available to pre-hospital clinicians and consequently ETCO2 values are often used to adjust ventilation.1–3 There is a paucity of data on patients with OHCA and TBI, areas where acid base and PaCO2 levels are known to affect outcomes. 14 , 15 , 17 , 19 This study aims to describe the relationship between PaCO2 and ETCO2 for pre-hospital intubated patients with a priori subgroup analysis for patients with medical, OHCA and major trauma as pathological groups.
Methods
This was a retrospective, cohort study using data drawn from the electronic medical records (HEMSbase 2, V1.0 2015, Medic One Systems, London, England) of a doctor-paramedic pre-hospital critical care team covering a mixed urban – rural population of around 6.3 million. 37 , 38 A consecutive sample of all eligible patients on HEMSbase 2 (February 2015 to November 2018) was collected. Patients were included if they were invasively ventilated with a documented PaCO2 drawn and analysed within 5 minutes of the documented end-tidal value. Venous, capillary and unlabelled samples were excluded. Samples analysed but with device failure and any sample that could not be definitively identified as drawn within 5 minutes of the ETCO2 were also excluded. The study was registered locally as a service evaluation, approved by the Caldicott Guardian, and was conducted on retrospective, non-identifiable patient data. The study was run through the NHS Health Research Authority Ethical Approval Decision Tool and followed the principles of the Declaration of Helsinki, consequently ethical approval was not required.
ETCO2 values were measured by sidestream sampling (Microstream, FilterLine Set, Oridion Medical, Jerusalem, Israel) using a Zoll X monitor (Zoll Medical Corporation, Cheshire, England) with the values and timing directly exported from the monitor into the HEMSbase 2 database. PaCO2 samples were processed using the i-STAT point of care device (i-STAT, Abbott Point of Care Inc., Princeton, USA), which was calibrated as per the manufacturers guidelines 39 with a factory programmed internal quality check system. It was serviced every 6 months with ad-hoc servicing following any failure or repair. The values from the i-STAT device were manually entered by clinicians into HEMSbase 2. The Zoll X allowed recording of heart rate and blood pressure whilst the i-STAT device also recorded pH. Timings of the PaCO2 values were identified from the recording of the i-STAT analysis time on HEMSbase2 and/or the hand written Patient Report Form (PRF), or from the timing of first invasive blood pressure measurement on the patients monitor (when it was clearly documented that the i-STAT sample was taken on insertion of an arterial line). Aetiology was classified as either medical, trauma or OHCA based upon HEMSbase 2 coding. Haemodynamic status was calculated as shock index from the measurements closest to (and within 5 minutes of) PaCO2 and ETCO2 sampling. Failure of i-STAT (device use which did not result in PaCO2 measurement) was identified by manually reviewing all free text on the database. All data points were derived from different individual patients.
Classification error was identified and defined as when the ETCO2 classification (hypocapnia (<4kPa)/ normocapnia (4–6 kPa)/hypercapnia (>6 kPa)) 25 , 40 did not match the PaCO2 classification.
Analysis
Data were analysed in Excel for Windows (Microsoft Office Professional 2013, V 15.0, Microsoft Corporation, Redmond, Washington, USA). Data are reported as n (%), and median [inter-quartile range]. Statistical analysis was conducted using R (R Core Team (2018), R; A Language and environment for statistical computing. R Foundation for Statistical Computing, Vienna, Austria. https://www.R-project.org). Bland-Altman plots were calculated for each aetiology to describe the agreement between the PaCO2-ETCO2. A regression model incorporating age, gender, pH and shock index was undertaken. For all analyses, significance was accepted at α = 0.05 with 95% confidence intervals.
Results
During the study period a total of 73 patients had complete data (Figure 1). The aetiology was arranged into three categories: medical (13, 17.8%), traumatic (22, 30.1%), and OHCA (38, 52.1%). Demographics are described in Tables 1 and 2. The ETCO2, PaCO2 and PaCO2-ETCO2 gradient for medical, OHCA and trauma aetiologies is presented in Table 1.
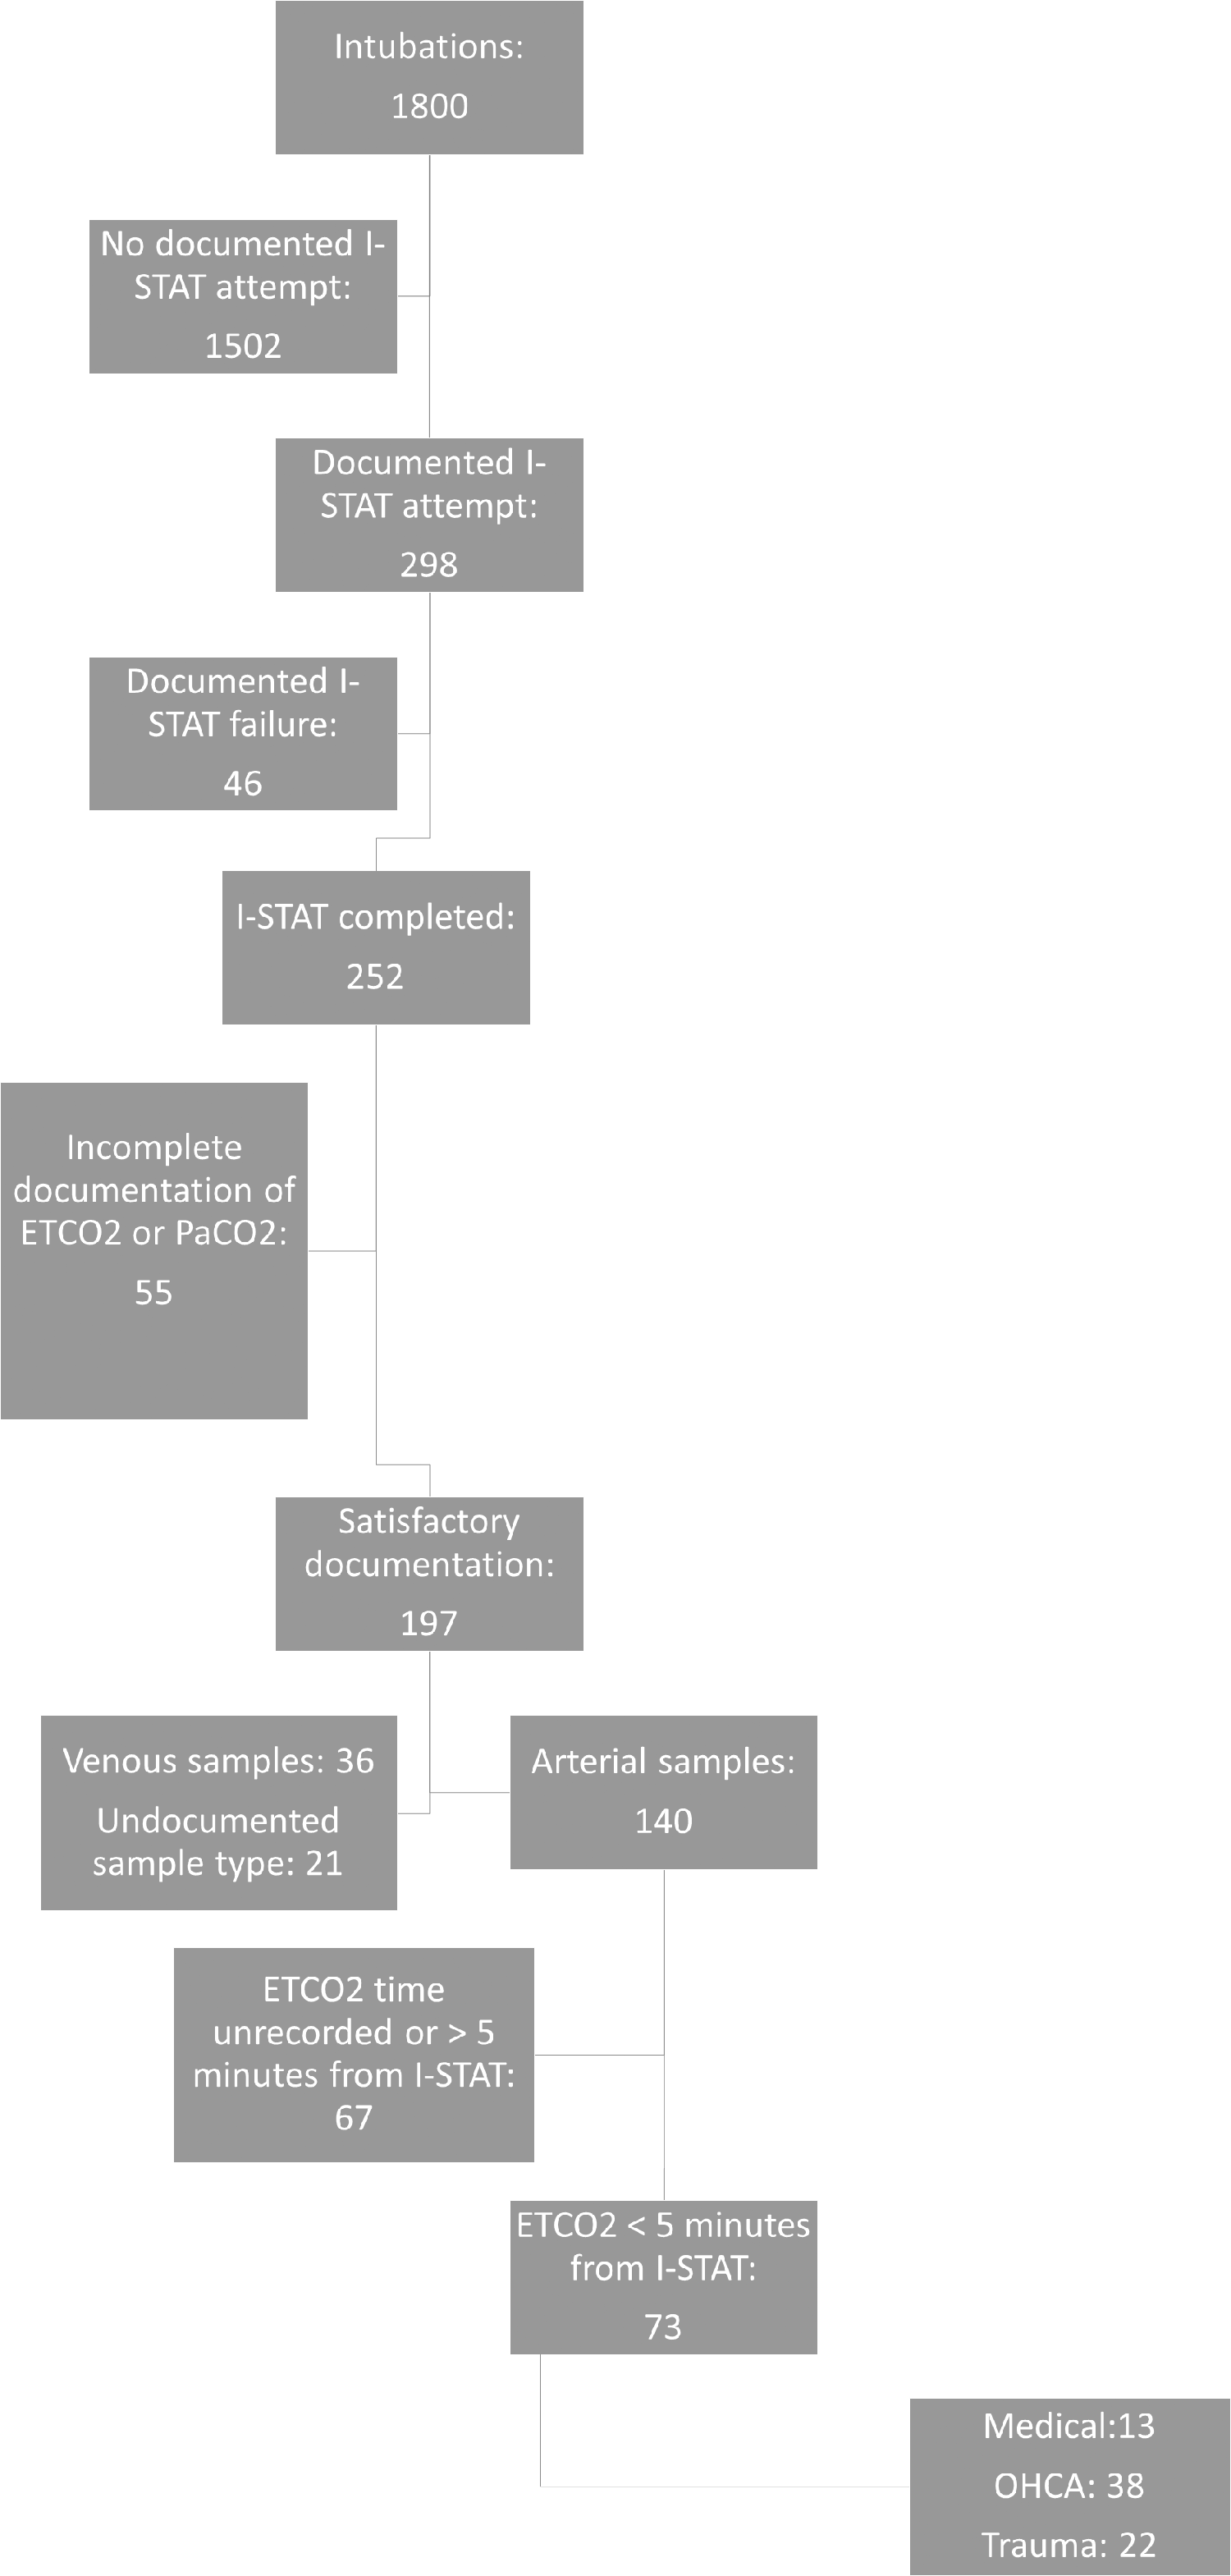
A consort diagram describing the number of intubated patients with usable PaCO2-ETCO2 data (n = 73).
Table demonstrating demographics and ETCO2, PaCO2 and PaCO2-ETCO2 gradient for medical, OHCA and trauma aetiologies (n = 73).
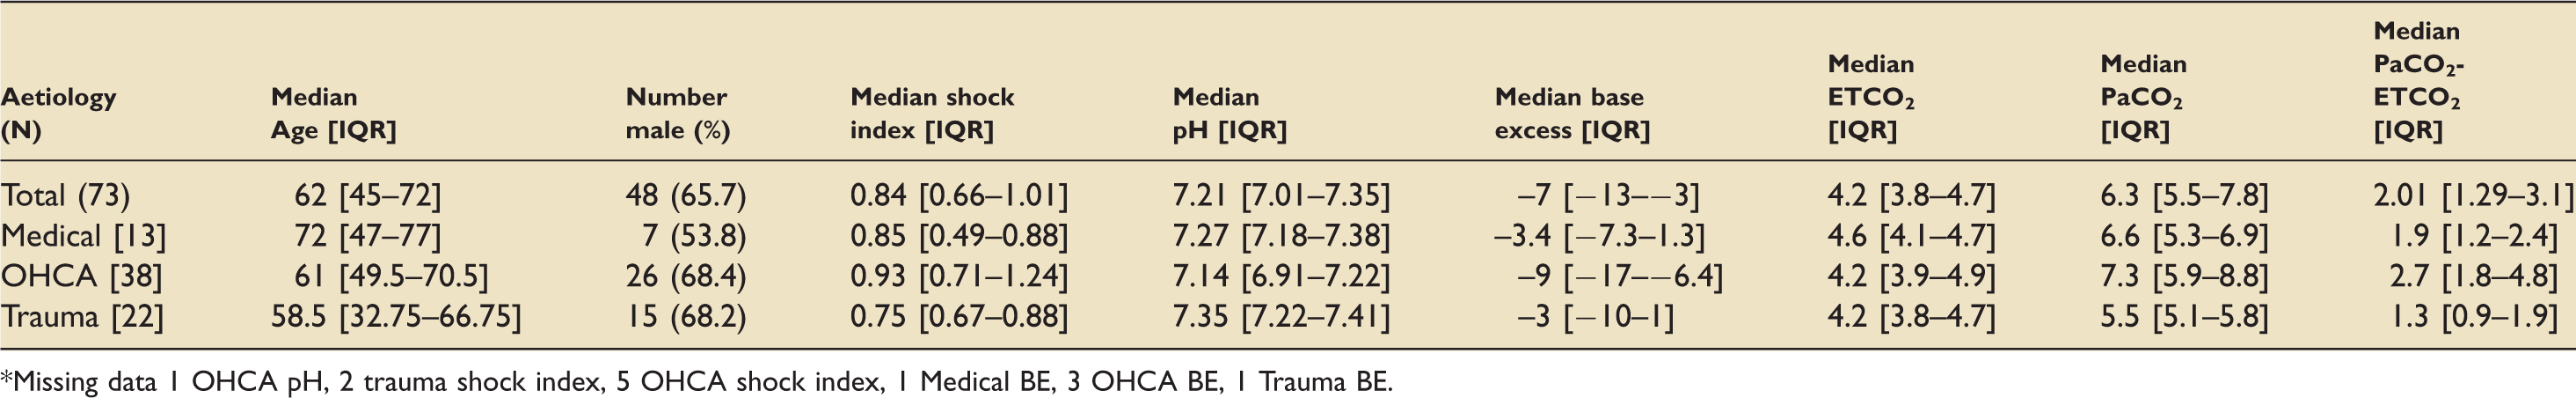
*Missing data 1 OHCA pH, 2 trauma shock index, 5 OHCA shock index, 1 Medical BE, 3 OHCA BE, 1 Trauma BE.
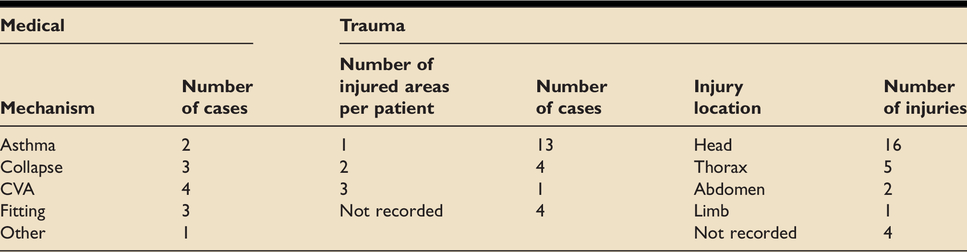
Table demonstrating further demographics for medical and trauma aetiologies.
The levels of agreement between ETCO2 and PaCO2 are presented using Bland-Altman plots (Figure 2). The Bland-Altman bias for all aetiologies (−2.5 (CI −3.0 to −2.1) was considerably greater than the putatively acceptable gradient of 0 −1 kPa and limits of agreement were wide (upper 1.1 (CI 0.3 to 1.8) and lower −6.2 (CI −6.9 to −5.5). The largest bias (−3.2 (CI −3.9 to −2.7)) and widest limits of agreement (upper 0.3 (CI −0.7 to 1.4) and lower −6.8 (CI −7.9 to – 5.8)) seen for OHCA.
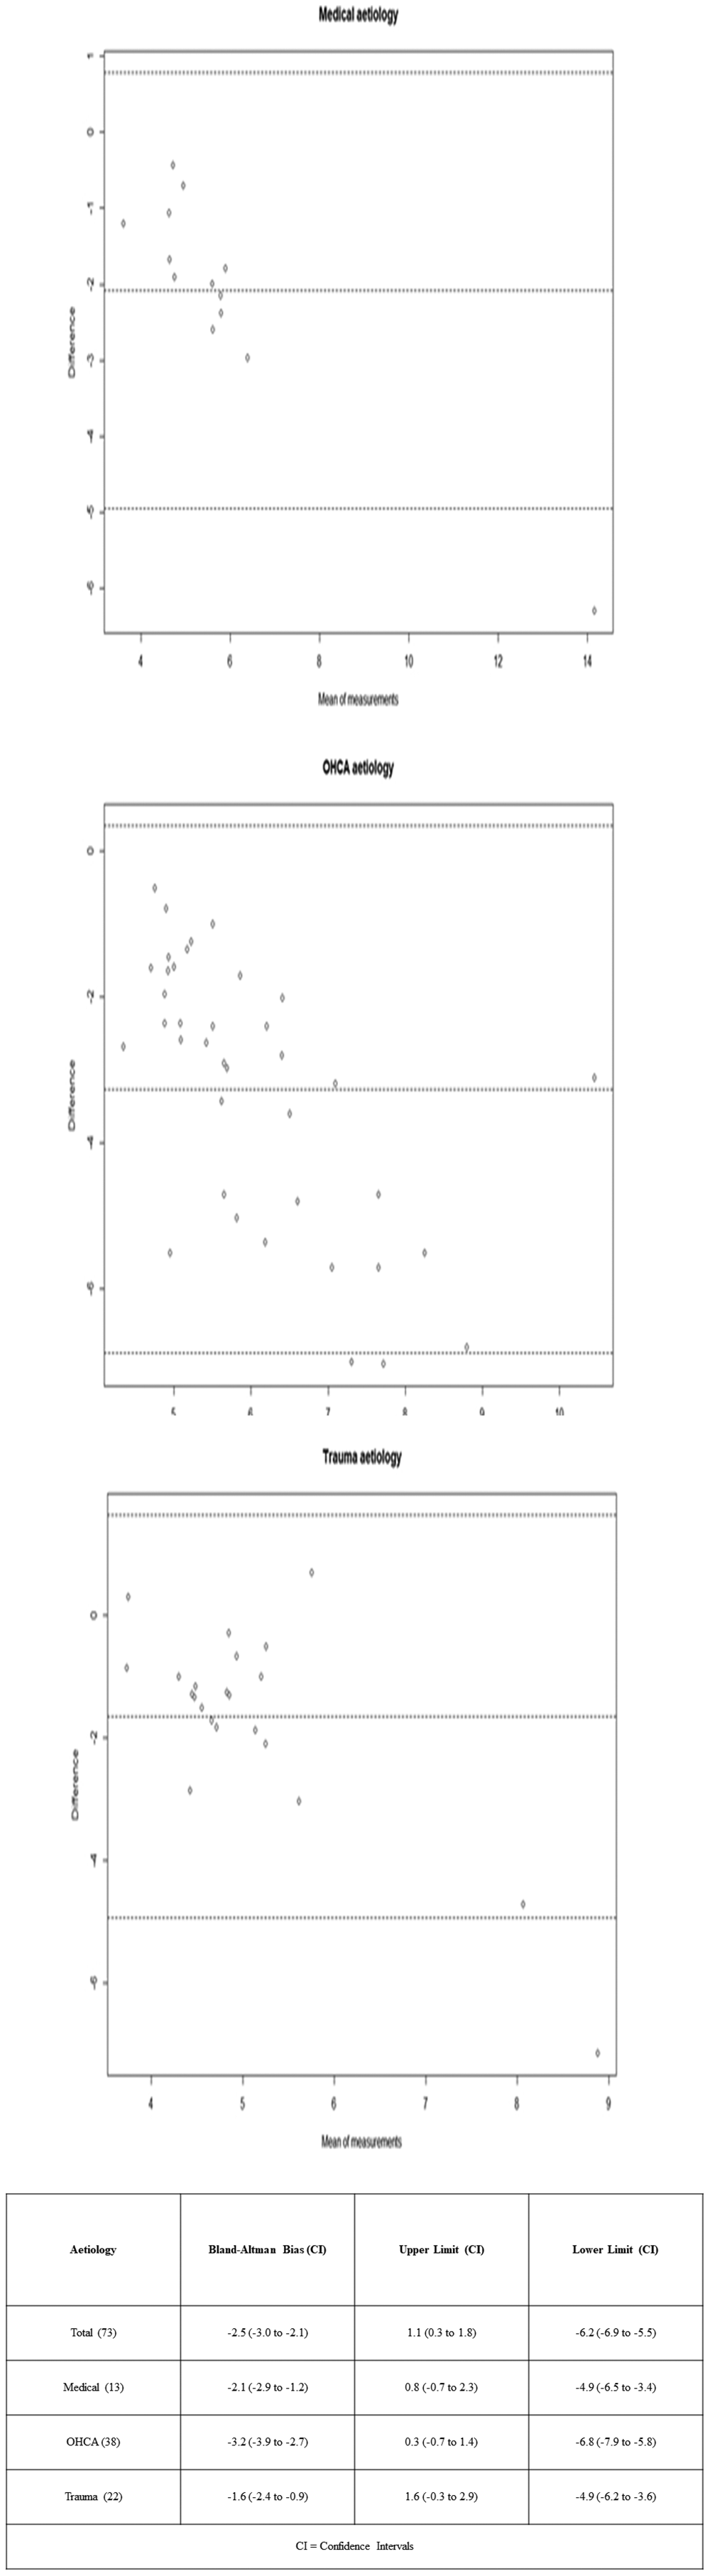
Bland-Altman Plots demonstrating PaCO2-ETCO2 gradient in pre-hospital intubations of all aetiologies from a single UK Helicopter Emergency Medicine Service (n = 73).
The commonly accepted PaCO2-ETCO2 gradient of 0–1 kPa (median 0.7 [0.51 – 0.93]) was seen for 11 (15.1%) of total patients whilst a gradient between 1–5 kPa (median 2.1 [1.6–2.85]) was seen for 60 (82.2%) of patients). The PaCO2-ETCO2 gradient was observed to be ≥5 kPa (median 5.7 [5.5–6.9]) for 11 patients (15.1%). Classification error is demonstrated in Table 3. As recommended by AAGBI an ETCO2 of 4.0–4.5 kPa was seen in 21/73 (28.7%) and 11/21 (52.3%) of these were misclassified as normocapnic (4–6 kPa) when the PaCO2 was hypercapnic (>6.0 kPa).
Table demonstrating classification error in pre-hospital intubations of all aetiologies.
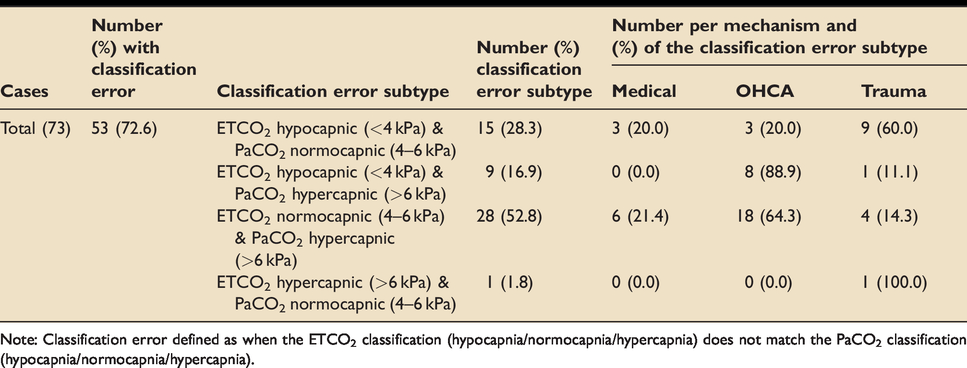
Note: Classification error defined as when the ETCO2 classification (hypocapnia/normocapnia/hypercapnia) does not match the PaCO2 classification (hypocapnia/normocapnia/hypercapnia).
In 71 (97.3%) of patients PaCO2 was higher than the ETCO2. In two (2.7%) patients with trauma the converse was observed. One patient was a 45 yr pedestrian involved in a collision with a heavy transport vehicle sustaining injuries to the head and abdomen. She had a shock index of 0.66, respiratory rate of 19, pH 7.4, PaCO2 5.4 kPa, ETCO2 6.1 kPa and PaCO2-ETCO2 –0.7 kPa. The second patient was a 19 yr who fell from a building sustaining an isolated head injury. He had a shock index of 0.64, respiratory rate of 25, pH 7.5, PaCO2 3.6 kPa, ETCO2 3.9 kPa and PaCO2-ETCO2 –0.3 kPa.
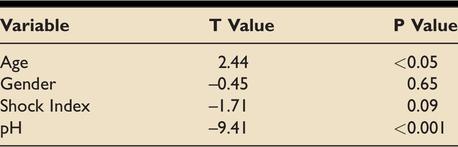
A regression model (Table 4) demonstrated that a significant effect was seen for age (p < 0.05) and pH (p < 0.001).
Table demonstrating P values from linear regression model for PaCO2-ETCO2 gradient in pre-hospital intubations of all aetiologies (n = 73).
Discussion
The Bland-Altman bias for all aetiologies was more than the commonly accepted gradient of 0-1 kPa and limits of agreement were wide. The variation in the PaCO2-ETCO2 gradient was observed to differ based on aetiology with the largest bias and widest limits of agreement seen for OHCA, perhaps in relation to the low cardiac output in this patient group and subsequent high ventilation/perfusion (V/Q) mismatch. Classification error was common and a high percentage of patients who were hypercapnic (>6.0 kPa) were misclassified as normocapnic (4.0–6.0 kPa) by the ETCO2. The magnitude of the differences between the ETCO2 and PaCO2, levels of variation and inability to predict this suggest that ETCO2 is not a suitable surrogate upon which to base ventilatory settings in clinical conditions where pH or PaCO2 require precise control. However there is not sufficient data to quantify potential harms.
In this study all but two pre-hospital intubated patients had an ETCO2 < PaCO2 and the majority displayed a PaCO2-ETCO2 gradient >1 kPa. In two cases a negative PaCO2-ETCO2 gradient was observed. The reasons for this unexpected findings are not readily apparent. This has previously been described most commonly in pregnancy, 41 obesity and infants. 42 , 43 It may reflect the use of large tidal volumes with low respiratory rates, an increased cardiac output, low functional residual capacity or lung compliance.41–43 The patients in our study did not meet these criteria. It may be measurement or calibration error or reflect that readings were taken prior to a steady state being reached following a period of hypoventilation – for example following adjustments to ventilatory parameters or pause in ventilation.
In healthy patients27–29 and in selected studies in the ED11,35 and ICU setting10,26,34,36 a close relationship and acceptable difference between the ETCO2 and PaCO2 has been observed. However, the literature is conflicting on this and a predictable relationship between the ETCO2 and PaCO2 has not been demonstrated in the pre-hospital environment.21–24 The authors were able to identify only four studies performed in the prehospital arena.21–24 In a study of 100 pre-hospital intubated patients of mixed aetiologies Belpomme et al. 21 recorded ABG results after intubation (with a stabilising ventilation period of approximately 15 minutes) and on arrival at hospital, comparing these to the ETCO2 measurements. Similarly to the study reported here PaCO2 was measured by the i-STAT analyser. 21 Bland-Altman plots were not performed and analysis of variance was completed by the Fisher test. 21 Belpomme et al. observed a mean pre-hospital of PaCO2-ETCO2 gradient of 9 mmHg ± 13.6 with a range of -19.7 to 75 mmHg (1.2 kPa ± 1.8 (range –2.6 to 9.9 kPa) and concluded that there was wide variation in the PaCO2-ETCO2 gradient. 21 Similarly in the study reported in this journal the overall median PaCO2-ETCO2 gradient was 2.01 kPa [1.29 – 3.1] with a range of -0.7 to 7.15 kPa. Belpomme et al. did not identify aetiology specific differences in the PaCO2-ETCO2 gradient, however subgroup analysis was limited by small sample sizes with each aetiology including only 3–30 patients. 21 20% of all patients were described as cardiac aetiology but it is not clear if any patients were post OHCA. 21
Prause et al. compared ETCO2 to PaCO2 for 61 ABG samples (OPTI 1 blood Gas Analyzer (AVL, Graz, Austria)) drawn from 27 patients intubated in the pre-hospital environment. 23 The authors concluded that there was no correlation (using linear regression analysis) between the ETCO2 and PaCO2 in patients who underwent cardiopulmonary resuscitation (CPR) (R2 = 0.04) and in those with respiratory insufficiency of cardiopulmonary origin (R2 = 0.02). A weak (R2 = 0.34) but statistically insignificant (p = 0.053) correlation was reported for patients with extrapulmonary respiratory disturbances (largely cerebral). 23 The data included samples from patients receiving CPR in whom a higher Vd/Vt is expected. 23 The accuracy of ETCO2 measurement is a major limitation to Prause et al’s study. 23 The capnometry device (Capnometry module of the Defigard 2000 (Schiller, Linz, Austria)) was not equipped with CO2 curve display and the authors report that CO2 was likely measure in mid-expiration rather than end, unlike in the study reported here. 23 The small sample size and lack of analysis for pH and haemodynamic status (as conducted in this study) are further limitations. 23
Cooper et al.
22
explored the PaCO2-ETCO2 gradient in a prospective study of 162 pre-hospital invasively ventilated trauma patients. Pre-hospital ETCO2 values maintained enroute were recorded and an arterial PaCO2 was obtained within 15 minutes of hospital arrival using bench-top laboratory analyser (rather the portable analysers as in this study).
22
Haemodynamic status was not explicitly stated but inferred from the injury severity score.
22
The authors concluded that overall the ETCO2 did not correlate (linear regression analysis
Recently Price et al. conducted a retrospective cohort study of 40 adult patients with TBI who were intubated pre-hospital. 24 The study was conducted at the same pre-hospital organisation as the study reported here. 24 Price et al. compared the ETCO2 to PaCO2 measurements taken within 30 minutes of hospital arrival. 24 The authors concluded that there was only a moderate correlation (R2 = 0.23, p = 0.002) between PaCO2 and ETCO2. 24 The Bland Altman bias was 1.7 (CI 1.4 to 2.0) kPa with upper and lower limits of agreement of 3.6 (CI 3.0 to 4.1) kPa and −0.2 (CI −0.8 to 0.3) kPa. 24 There was no evidence of a larger gradient associated with more severe TBI (p = 0.29). 24 For patients with coexisting serious thoracic injury a larger gradient was observed (2.0 (±1.1) kPa) but no significant gradient correlation was reported (R2 =0.13, p = 0.10). 24 The pre-hospital gradient was not analysed, however, a subgroup of seven (17.5%) of patients had a pre-hospital arterial blood sample via the I-STAT and on arrival had a lower and more appropriate PaCO2 compared with the no ABG group (4.7 (±0.2) kPa). 24 This may suggest that the pre-hospital ABG allowed early and appropriate adjustment of ventilation. Although undertaken at the same organisation as this study, there were only a small number of patients with a pre-hospital ABG and these were not closely matched to a pre-hospital ETCO2 reading, making it likely that few to none patients crossed over between study datasets. Similarly to Cooper et al. the wide and variable time between ETCO2 and PaCO2 measurements is a limitation as it is possible that changes in the gradient may reflect changes in the ventilation strategy during this period. 22 , 24
The above four studies and the data presented in the study published here highlight the poor levels of correlation and agreement between the PaCO2 and ETCO2. All offer a similar message regarding the limitation of using ETCO2 to estimate the PaCO2 for the pre-hospital patent.21–24 The differences between ETCO2 and PaCO2 levels, the lack of a predictable relationship and the variation with differing levels of resuscitation and cardiac output suggest that in conditions such as TBI where outcomes may be altered by PaCO2/pH then measured arterial levels are required. However in many clinical scenarios, such as ventilating a critically unwell patient with bronchospasm the clinical focus is on the ventilatory pressures and PaCO2 a secondary concern, so ETCO2 levels may be acceptable to the treating team.
The gradient in trauma is further explored in studies by Warner et al. and Lee et al. 14 , 16 Warner et al collected PaCO2 and ETCO2 data on 180 intubated ED trauma patients. 14 There was a significant but weak correlation between the ETCO2 and PaCO2 (R2 = 0.277, p = <0.001) but with wide confidence intervals. Warner et al. reported that the strongest correlation was for patients with isolated TBI (R2 = 0.52) whilst the weakest were seen in patients with severe abdominal injuries (R2 = 0.19) or with a shock index ≥0.9 (R2 = 0.17). 14 Lee et al. 16 reported a moderate correlation (r = 0.67) between the PaCO2-ETCO2 for 66 patients with TBI cared for in the ED. Patients with severe chest trauma (p = 0.049), hypotension (p = 0.017) and metabolic acidosis (p = 0.018) had a greater difference in the PaCO2-ETCO2 gradient. 16 In a subgroup of 28 patients with no hypotension, acidosis or trauma a strong correlation was observed (r = 0.893, p = <0.001). 16 The study reported in this journal identified that with decreasing pH the PaCO2-ETCO2 gradient increases. The data reported in this study was insufficient to allow adjustment for base excess. The overall effect of acidosis on the PaCO2-ETCO2 gradient is likely in part a consequence of the acidosis reflecting tissue hypoperfusion and increased V/Q mismatch. 33 In the studies by Warner et al. 14 and Lee et al. 16 it is possible that the most physiologically deranged patients with expectedly greater differences between the PaCO2 and ETCO2 were not included as they died prehospital or were transferred directly to operating theatre. Overall, the previous literature suggests that in trauma patients with higher injury severity, chest wall injuries and haemodynamic instability the difference and variability between the ETCO2 and PaCO2 increases. 16 , 22 The study reported here involved 13/22 (59%) single system trauma from a small number of patients with a median SI 0.75 [0.67–0.88] and pH of 7.35 [7.22–7.41] suggesting a less injured cohort.
For OHCA previous literature describing the PaCO2-ETCO2 gradient is limited to the small sample of 12 patients analysed by Prause et al. 23 Previous studies have reported an increased mortality associated with hypercapnea.17–19 However, in a recent prospective multi-centre study of 280 post-ROSC patients undergoing targeted temperature management Kilgannon et al observed that PaCO2 had an inverted “U” shaped associated with mild to moderate hypercapnia having the highest probability of good neurological outcome with further increases reducing the likelihood of good neurological outcome. 20 Whilst in a retrospective, observational study of 58 post-ROSC patients Kim et al. 19 evaluated the PaCO2 and ETCO2 values at 6, 12 and 24 hours. PaCO2-ETCO2 gradients were significantly lower in survivors than non-survivors at 12 hours (p = 0.040) and 24 hours (p = <0.001). 19 This may reflect the increased gradient in the more critically unwell patients. 19 In the study reported in this journal the greatest variance between the ETCO2 and PaCO2 was observed for patents with OHCA with most patients being acidotic (pH 7.14 [6.91 - 7.22]). Clinical consideration of the greater difference and variance in the PaCO2-ETCO2 gradient for OHCA cases may prompt close arterial monitoring and more aggressive ventilation for this aetiology.
In a physiology based retrospective cross-sectional study of 493 data points from 56 mechanically ventilated paediatric ICU patients McSwain et al. 36 calculated the PaCO2-ETCO2 gradient across a range of deadspace volume/tidal volume (Vd/Vt) values using the Bohr equation. 36 The authors reported that the strength of the correlation between ETCO2 and PaCO2 decreased as Vd/Vt increased (Vd/Vt ≤ 0.40 (R = 0,95); Vd/Vt >0.70 (R2 = 0.78) 36 and observed that the gradient between the PaCO2 and ETCO2 increased with increasing Vd/Vt (from an average of 0.04 kPa (0.3 millimetres of mercury (mmHg)) at low Vd/Vt to 2.4 kPa (18 mmHg) at high Vd/Vt). 36 The physiological principals can be expected similar in adult populations. 36 McSwain et al concluded that the ETCO2 is a useful indicator of PaCO2 provided that the physiologically expected increase in the PaCO2-ETCO2 gradient is considered. 36 However, increased variability and an inconsistent difference in the PaCO2-ETCO2 gradient with increasing dead space makes clinical use challenging as PaCO2 cannot be reliably predicted. 36 Pre-hospital patients with critical illness have high Vd/Vt and the variability in the gradient, particularly for trauma and OHCA patients, suggests that the ETCO2 cannot consistently predict the PaCO2 and therefore arterial sampling of the PaCO2 may be useful in the pre-hospital environment.
Limitations
This study involved the use of point of care i-STAT (i-STAT, Abbott Point of Care Inc., Princeton, USA). In a prospective study of intubated adult patients in an ICU setting by Thomas et al. 44 the i-STAT samples were concluded as being acceptable surrogates for bench-top laboratory measurements. However, the ICU setting differs from the pre-hospital setting where differing external and operator factors may affect machine performance. Indeed we identified 46/298 (15.4%) attempted blood gas analyses failed (Figure 1). Reasons included error codes, temperature, clotted blood, underfilled/overfilled samples, the machine failing to turn on and operator failure. The number of attempted blood gas samples was less than the number of intubations (298/1800 (16.5%)), suggesting clinicians selected patients for analysis. The median shock index of 0.84 [0.66–1.01] and high percentage of single system trauma infers that sicker patients may not have been chosen for pre-hospital arterial sampling or did not have this recorded due to the concurrent pressures on clinicians for these patients. The small sample size also risks analysis being effected by extreme outliers, for example five cases involved a PaCO2-ETCO2 gradient of >6 kPa.
Furthermore, as data collection was retrospective the authors were unable to ensure that data was consistently taken in a steady state in relation to intubation or changes in ventilator settings.
Overall the number of missing data risks high levels of bias and reflects the difficulties with retrospective data collection in the pre-hospital environment and limited further sub-group analysis. However our findings are consistent with previous work.
Conclusion
The Bland-Altman bias for all aetiologies was greater than the widely accepted gradient of 0–1 kPa and limits of agreement were wide. A high percentage of cases involved hypercapnic patients being misclassified as normocapnic by the ETCO2. The data in this study suggests that in a high proportion of patients, particularly those with major trauma or OHCA, ETCO2 is not a sufficiently accurate predictor of PaCO2 to guide ventilator settings. Arterial blood gas monitoring may therefore provide useful data for prehospital teams where control of acidaemia and carbon dioxide levels are of clinical relevance. This data presented here is insufficient to draw firm conclusions and larger, prospective studies are required.
Disclaimers
Views expressed in the submitted article are our own and not an official position of East Anglian Air Ambulance.
Footnotes
Acknowledgements
The authors would like to acknowledge and thank Richard Hindson, Dr Ed Barnard and Dr Jeremy Mauger for their valued support on this project.
Declaration of conflicting interests
The author(s) declared no potential conflicts of interest with respect to the research, authorship, and/or publication of this article.
Funding
The author(s) received no financial support for the research, authorship, and/or publication of this article.