
Abstract
Microarray expression datasets generate a huge number of genes, but only a few genes provide information about cancer diseases. In this context, feature selection approaches have been developed to deal with this problem. Filter-based methods, in particular, select the relevant genes and remove the irrelevant ones using different evaluation metrics. In this study, we shed light on nine univariate filter methods. Three categories of filter methods were investigated using eight microarray datasets, including binary and multi-class samples. The support vector machine and Naive Bayes classifiers were used to assess classification accuracy. Different comparison methods were used to assist the researchers in visualizing the performance of each studied filter. Precisely, statistical tests were applied in terms of classification accuracy, and the feature ranking similarity of the filter methods was studied based on a rank correlation measure.
Introduction
Large-scale biological data analysis, or microarray datasets, is currently a challenge for biostatistics and machine learning researchers due to the construction of this kind of dataset: the huge number of features (genes) versus a small number of instances. The microarray data are used to obtain information about genes that can be helpful for cancer identification or diagnosis. In a bi-class problem, microarray datasets are used to distinguish between normal and cancer patients. In the case of multi-class problems, the datasets are used to classify various types of cancer.
Based on this consideration, feature selection approaches were developed to remove all the non-informative genes and detect only the relevant ones. Filter, wrapper, and hybrid methods are the most useful types of feature selection. Filter-based methods rank the features using a specific relevance measure without invoking any classification algorithm. A subset of features is selected, and its cardinal is either predefined or set according to a certain threshold. 1 The most commonly used filters are correlation, 2 (MI), 3 information gain (IG), 4 reliefF, 5 and relevance. 6 On the contrary, wrapper-based methods select the subset of features with the best results based on a classification algorithm, such as the genetic algorithm, 7 firefly algorithm, 8 binary bat algorithm, 9 particle swarm optimization, 10 flower pollination algorithm 11 and artificial bee colony. 12 Besides filters and wrappers, the hybrid-based approaches 13 combine the merits of both of them. On the other hand, the feature selection approaches can be grouped into three different categories based on the presence of the target class label in the datasets, namely, supervised, semi-supervised, and unsupervised methods.
Historically, filter-based methods 14 were considered as the most important process in feature selection as a consequence of their low computational cost compared to the other methods, which made them able to deal with high-dimensional dataset classification. Rouhi and Nezamabadi-pour 15 developed a filter based on an improvedbinary gravitational search algorithm. Kavitha et al. 16 combined the symmetric uncertainty (SU) and relief filters using score normalization in order to select the relevant and non-redundant genes. Based on an estimation of relevance between features and the class label, Ke et al. 17 presented a score-based criteria fusion. On the other hand, many hybrid-based methods have been developed using the filter ranking method as a first stage. Chamlal et al. 18 used a score of importance based on the preordonnaces theory to remove the irrelevant features as a first step before the wrapper stage. Zhang et al. 19 proposed a hybrid approach where the IG was applied in the filter step. Minimum redundancy maximal relevance and analysis of variance filters were used by Dabba et al. 20 and Baliarsingh et al., 21 respectively.
In this article, we present a comparative study of nine univariate filter-based methods. The studied filters were divided into three groups based on how the relevance between the features and the class was assessed: entropy, statistics, and similarity-based methods.
The aspects used in this study are described as follows:
Nine univariate filter-based methods from different domains were studied. Eight microarray datasets of varying sizes are used, with features ranging from 2000 to 12,600 and instances ranging from 60 to 181. Binary and multi-class cases were considered. Two commonly used classifiers are considered to test the performance of the filter methods based on their classification accuracy. Support vector machine (SVM) and Naive Bayes (NB) classifiers. Different number of selected features were evaluated, ranging from 2 to 60, increasing by 2. Pairwise comparison of the filters was developed in terms of accuracies using the Friedman statistic test and in terms of feature ranking similarity using a rank correlation metric.
The remainder of this article is organized as follows: the “Filter methods” section presents the studied filter-based methods. In the “Experimental protocol and results” section, we describe the protocol used for the experiments and analyze the results. The “Conclusion” section contains the conclusions of this study.
Filter methods
In this study, we shed light on the most frequently used univariate filter methods for high-dimensional datasets. The studied methods were divided into three categories: entropy-based, statistics-based, and similarity-based methods. A brief description of the used filters is presented in this section.
Entropy-based methods
The entropy-based methods are the most useful metrics in the filter feature selection approaches. These methods are based on the information-theoretic concept of entropy. The basic idea of this metric is to measure the uncertainty of the feature. The uncertainty of a discrete feature increases when all possible values occur with the same probabilities. Let X be a discrete variable and p be the probability mass function. The entropy of X is defined as follows:

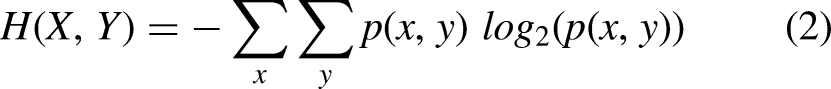

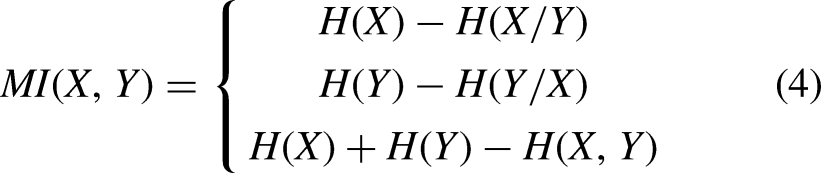
The MI measure is used to calculate the correlation and the statistical dependency between an explanatory variable X and the target class label Y. It can be understood as the amount of information shared by X and Y and the decrease in uncertainty. In the context of filter feature selection, this measure can be used to calculate the relevance between X and Y. The greater the MI value between X and Y, the stronger the discriminative power of the explanatory variable. It is can be calculated as follows:
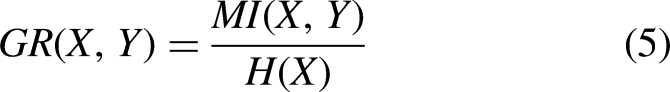
To overcome the bias problem of the MI metric, the gain ratio was developed as the normalization of MI between a random variable and the class label. It is defined as the ratio of MI to the entropy measure. As a result, it is clear that this metric favors features with smaller entropy. It is defined as follows:
It is defined as a modification to the MI in order to reduce the bias toward detecting variables with a large number of different values and normalize the MI to the range [0, 1]. 0 indicates an independent relationship between the feature and the class label, while 1 indicates a stronger dependency relationship between them. It is computed as follows:

Gini impurity is the most frequently used in the decision tree algorithm for feature selection, such as classification and regression tree. This importance score is calculated using probability theory by summing the product of the probability of choosing a sample with a class label and its probability of being wrongly classified. This metric is defined as follows:

Statistics-based methods
These types of filter-based methods evaluate the importance of features based on statistical metrics. The studied statistical methods are described below:
The preordonnances association offers a way to measure the relevance between the preordonnances induced by an explanatory variable and the class label. This metric is defined as the Kendall rank coefficient between the ranks induced by the preordonnances. The strength of this coefficient is that it can deal with heterogeneous or mixed datasets. Also, do not require any preprocessing of the variables. The higher the value of the preordonnances association, the stronger the relevance.
Let X and Y be a random variable and the class label, respectively;

The Spearman correlation is defined as a non-parametric metric. It measures the dependence between the ranks induced by a feature X and the target class Y using a monotonic function. The closer the coefficient to 1, the stronger the relationship. Precisely, if Y tends to increase when X increases, the coefficient is positive, while if Y tends to decrease when X increases, the coefficient is negative. The Spearman correlation is computed as follows:

The chi-square filter is a statistical test that measures the divergence between the expected and observed distribution of a feature. The greater the value of this statistic metric, the greater the dependency between the feature and the class label. It can be computed as given in equation (10), where

Similarity-based methods
The similarity-based filters rank the features according to their ability to preserve the similarity of the studied datasets based on the class label. The used filters are described below:
The Fisher score is the most popular similarity-based method. It is a supervised method that ranks the features according to the class variable. This measure favors the feature that makes instances of the same class close to each other and makes instances of different classes far apart. Let X be a random feature,

The Laplacian score is an unsupervised method that ranks the features according to the Laplacian matrix and the variance. A feature is relevant if it preserves the graph structure represented by the Laplacian matrix. Let X be an explanatory variable. W represents the similarity weight matrix computed by the nearest neighbor graph. If

Experimental protocol and results
This section exposes the methodology followed in this article to evaluate the filter-based methods, datasets, performance measures, classifiers, and techniques used for a pairwise comparison. This section also discusses the results with different interpretations.
Datasets description
To compare the performance of the studied filter-based methods and evaluate the quality of the methods to be applied to microarray datasets. We use eight real-world datasets from microarray data analysis, which include binary and multi-class datasets. The detailed statistics about these datasets are exposed in Table 1. Microarray datasets are high-dimensional data and are available in R packages such as “sdwd” and “varbvs.”
Summary of the studied microarray datasets.
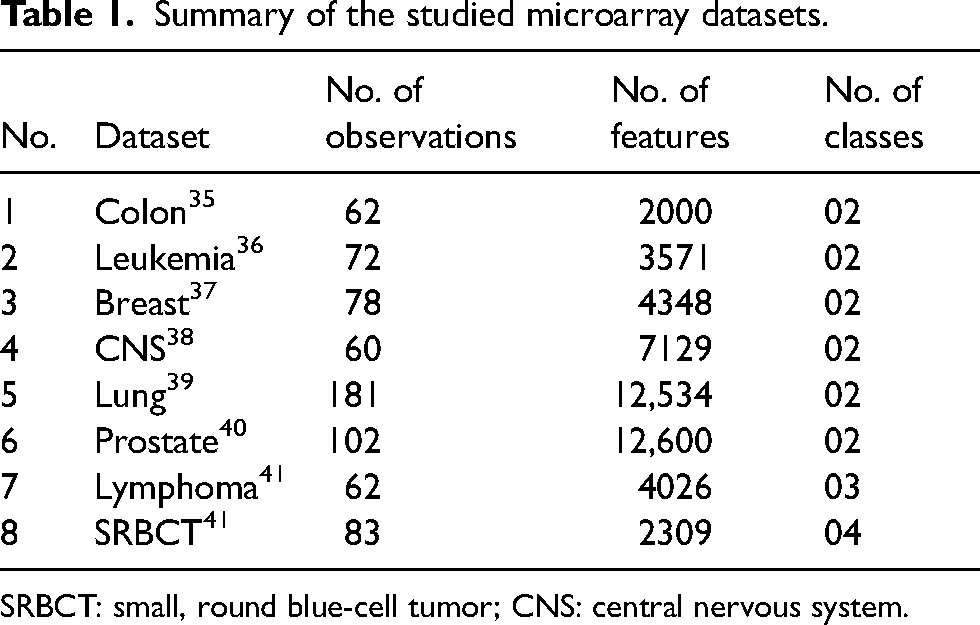
SRBCT: small, round blue-cell tumor; CNS: central nervous system.
Performance measure and classifiers
The performance measure used to evaluate the studied filter methods is the classification accuracy described in equation (13), where TP and TN represent the number of positive and negative samples correctly classified, respectively. FP and FN denote the number of positive and negative samples wrongly classified, respectively. On the other hand, to ascertain the performance of the filter in terms of classifiers, we used the two most commonly used classifiers to validate a filter ranking method: the SVM
31
classifier is the most commonly used in feature selection and classification tasks due to its performance and robustness to high-dimensional datasets, such as microarray datasets. The main idea of this classifier is to select a small number of boundary vectors for each label. Then, the selected boundaries are separated using a linear hyperplane. The NB
32
classifier takes the features’ conditional independence for granted, based on probabilistic knowledge; that is, it calculates the probability of instances for each label. For the evaluation, 10-fold cross-validation is used.
Statistical tests for performance comparison
In order to establish a statistical analysis and comparison of the studied filter-based methods, the Friedman test and post hoc techniques are used. First of all, the non-parametric Friedman test
33
is employed to test the statistical differences among the methods over the microarray datasets. This test ranks the studied methods according to their results (accuracy). The Friedman test considers the methods to perform equally in the null hypothesis at the significance level
Feature ranking similarity of the filter methods
The key idea of this analysis is to evaluate the similarity of the studied filter methods based on feature ranking. First, we generate the selection orders for all methods and datasets. Then, for each dataset, we compute the rank correlation between the selection orders of all pairs of methods, and the average results of all datasets are used to assess the feature ranking similarity.
Results
Tables 2 and 3 present the accuracies of the nine studied filter methods for the eight microarray datasets, using the SVM and NB classifiers. An examination of these tables reveals that the gain method is the best in terms of achieving the greatest number of best accuracies (marked in bold), where it was the best seven times, followed by MI, Gini, and PrC, which were the best six times with results close to those obtained by the gain method. Then, the SU, chi-square, and Fisher methods were the best four times, while the SpC method got the best results two times.
Results (accuracy) of the three studied types of filter methods using SVM classifier.
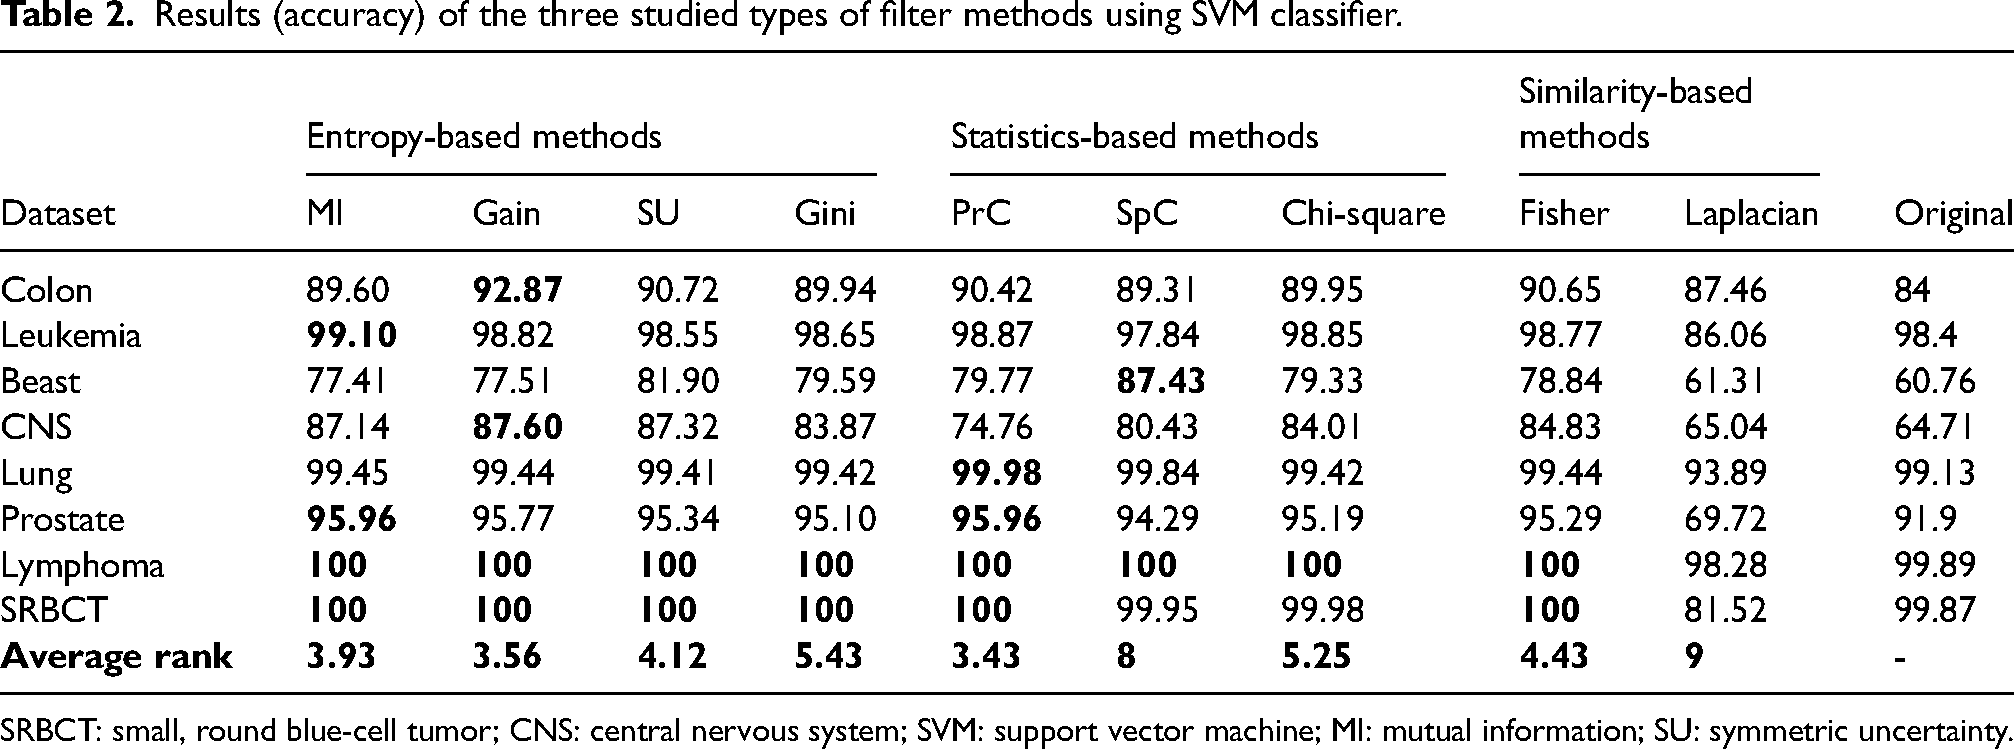
SRBCT: small, round blue-cell tumor; CNS: central nervous system; SVM: support vector machine; MI: mutual information; SU: symmetric uncertainty.
Results (accuracy) of the three studied types of filter methods using NB classifier.

SRBCT: small, round blue-cell tumor; CNS: central nervous system; NB: Naive Bayes; MI: mutual information; SU: symmetric uncertainty.
Through this comparison, if we compare the average rank among the entropy-based methods, the gain ratio and Gini methods perform the best against all competitors using the SVM and NB classifiers, respectively. While the PrC outperforms the other statistics-based methods, it is closely followed by the chi-square filter. For both classifiers, the PrC method achieves an accuracy of >90% for almost all the datasets except the breast and CNS datasets, where the accuracies were far better than those obtained with the original datasets. Finally, comparing the similarity-based methods to the other methods, they do not perform well. Among these, the Fisher score is far better than the Laplacian score, knowing that the Laplacian score achieves the worst results for all the studied datasets and classifiers.
In order to investigate the impact of the number of selected features on the performance of the filter methods, Tables 4 and 5 display the accuracies for several subset sizes, starting from two features to 60, increasing by two for different categories of filters (entropy, statistics, and similarity-based methods), using the SVM (Table 4) and NB (Table 5) classifiers, with 10-fold cross-validation repeated 100 times. On the one hand, we observe that as the number of features increases, accuracy improves in almost all cases. Also, some of them have similar results when the number of selected features is large enough. On the other hand, it demonstrated once more that the gain ratio outperforms the other entropy-based methods, with results close to those obtained by the other methods, where the Gini index agrees with the gain ratio in 98 % of the cases, which is mathematically demonstrated by Raileanu and Stoffel. 34 Among the statistics-based methods, PrC performs better than SpC and chi-square. However, for some datasets, the SpC performs extremely well compared to the PrC method. It can be concluded that the PrC is stable when compared to other statistics-based methods studied. Finally, for similarity-based methods, the Fisher score performs far better than the Laplacian score for all the datasets using both classifiers.
Classification accuracy versus the number of selected features for different types of filter methods using SVM classifier.


SRBCT: small, round blue-cell tumor; CNS: central nervous system; SVM: support vector machine; MI: mutual information; SU: symmetric uncertainty.
Classification accuracy versus the number of selected features for different types of filter methods using NB classifier.

SRBCT: small, round blue-cell tumor; CNS: central nervous system; NB: Naive Bayes; MI: mutual information; SU: symmetric uncertainty.
The results of the statistical Friedman test corresponding to the accuracy of the studied filter methods are presented in Table 6. From this table, for both classifiers, we obtain a p-value <0.05, which means that statistical differences are detected. Meanwhile, Tables 7 and 8 expose the post hoc comparison among the accuracy of the studied datasets over SVM and NB classifiers, respectively. According to the SVM classifier results, the Laplacian score from the similarity-based methods is clearly the worst method when compared to the other studied ones. In the same way, the results of the pairwise comparison using the NB classifier are shown in Table 8. It can be seen that there is a significant difference between the SpC method and MI, gain, SU, Gini, chi-square, and Fisher filters. Also, the results prove once again that the Laplacian score is the worst method and should be avoided.
Results (p-value) of the Friedman test for the comparison among the studied filter methods using SVM and NB classifiers.

SVM: support vector machine; NB: Naive Bayes.
Results (p-value) achieved on post hoc comparison for

SRBCT: small, round blue-cell tumor; CNS: central nervous system; SVM: support vector machine; MI: mutual information; SU: symmetric uncertainty.
Results (p-value) achieved on post hoc comparison for
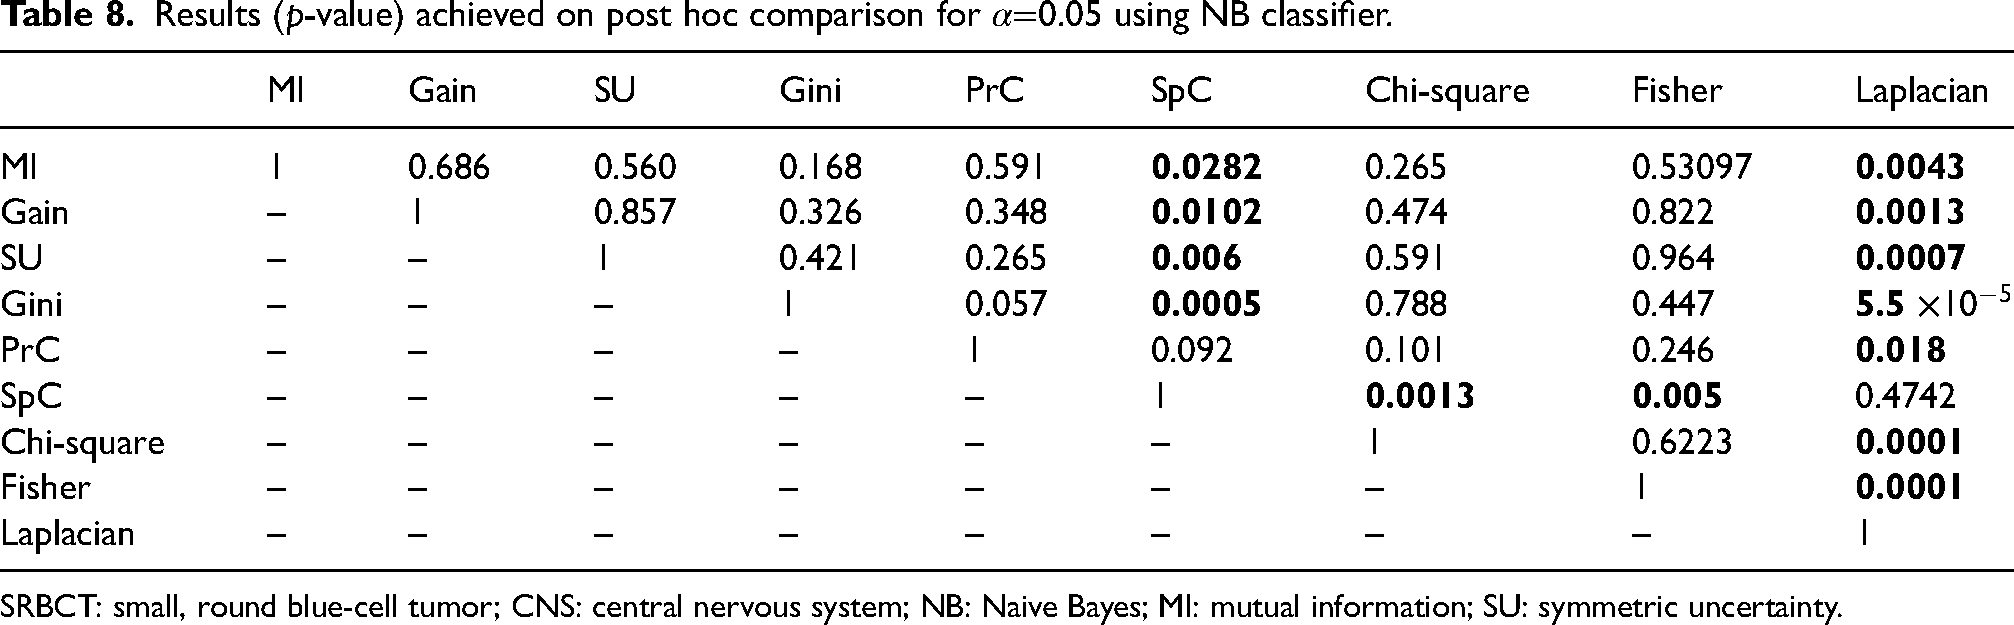
SRBCT: small, round blue-cell tumor; CNS: central nervous system; NB: Naive Bayes; MI: mutual information; SU: symmetric uncertainty.
In terms of feature ranking, Figure 1 exposes the rank correlation between all pairs of methods. The higher the correlation between two methods, the more similar they are. With a value of 0.883, the gain and MI methods produce the highest value. This makes sense, as the gain method is a modified version of the MI method, followed by the mean rank correlation between the chi-square and Gini methods (0.713), the chi-square and SU methods (0.132), the Laplacian score and Fisher score methods (0.085), and the PrC and chi-square methods (0.075). The other methods are not similar; the resulting mean rank correlation is negative.

Mean rank correlation between the selection order of all pairs of studied filters.
Conclusion
In this article, nine univariate filters were studied using eight microarray datasets. We employed various methods for filter evaluation and pairwise comparison. On the one hand, the comparative assessment in terms of classification accuracy used statistical tests. On the other hand, the feature ranking similarity used a rank correlation measure. The filter-based methods were grouped into three categories for a more accurate study.
As a general finding from our study, the preordonnances association measure performed the best compared to all the methods using the SVM classifiers in terms of average rank. The gain ratio and MI were the second and third best filters, respectively. One of the most important findings was that the founded accuracies were very close to each other, with the exception of the Laplacian score, which was significantly lower. On the contrary, the filters rank the features differently, except for those with about the same evaluation criteria. These large experiments serve as a reference for researchers to choose a filter feature selection depending on the used datasets or classifiers.
Footnotes
Author’s note
The paper was selected from ICAMDS22.
Declaration of conflicting interests
The author(s) declared no potential conflicts of interest with respect to the research, authorship, and/or publication of this article.
Funding
The author(s) received no financial support for the research, authorship, and/or publication of this article.