
Abstract
Decision trees are frequently used to overcome classification problems in the fields of data mining and machine learning, owing to their many perks, including their clear and simple architecture, excellent quality, and resilience. Various decision tree algorithms are developed using a variety of attribute selection criteria, following the top-down partitioning strategy. However, their effectiveness is influenced by the choice of the splitting method. Therefore, in this work, six decision tree algorithms that are based on six different attribute evaluation metrics are gathered in order to compare their performances. The choice of the decision trees that will be compared is done based on four different categories of the splitting criteria that are criteria based on information theory, criteria based on distance, statistical-based criteria, and other splitting criteria. These approaches include iterative dichotomizer 3 (first category), C
Introduction
Classification problems have been a long-standing focus in data mining and machine learning areas. Decision trees are among the most powerful and popular classifiers for handling these problems due to their numerous benefits, such as their simple architecture, high performance, and adaptability.
The decision tree development process can be summarized in three steps. The first phase involves applying an attribute selection method to pick the best attribute that will serve as the separating attribute. In the subsequent stage, the training data set is divided depending on the chosen splitting attribute. The child nodes are produced in the final phase by creating a branch for each category of the partitioning attribute. This process is repeated iteratively for each non-empty child node until a set of stopping conditions (all instances in the node belong to the same class, the number of instances is fewer than a given minimum,

Illustration of the process of constructing a decision tree using the top-down partitioning technique.
The most challenging part of building decision trees, as shown by Figure 1, is establishing an attribute selection method that will be applied to choose the dividing attributes. Therefore, researchers have suggested a variety of decision tree strategies that are based on various node-splitting criteria. These criteria can be categorized into several groups, including information theory-based criteria, distance-based criteria, statistical-based criteria, and other splitting criteria. The first splitting category contains: Information Gain (IG)
1
, Gain Ratio (GR)
2
, Normalized Gain (NG)
3
, Average Gain (AG)
4
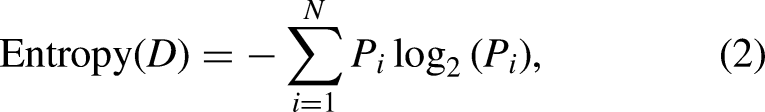
, and etc. In fact, the IG metric uses entropy, which is a measurement derived from information theory, as an impurity measure. Whereas the GR criterion, a kind of variation of the IG measure, was developed in order to counteract the IG’s main shortcoming. Moreover, the NG metric is a normalization of the GR indicator. Furthermore, the AG measurement, a variation of the GR criterion that addresses the problem arising from the undetermination of the GR metric, can be utilized as a node split criterion. On the other hand, the four metrics Gini Index (GI)
5
, Twoing
5
, Cluster Separation (ClusterS)
6
, and Margin of Separation (MarginS)
7
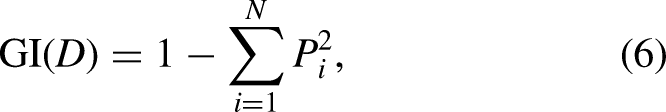
are thought of as distance-based splitting criteria. The GI is another measure of impurity that is based on probability theory. While the Twoing indicator is advised when the domain of the target attribute is fairly broad. For the ClusterS, it is a measure based on the analysis of clusters. Finally, the MarginS metric is some sort of margin or boundary that is used as a separation between different classes. The third node splitting category is based on statistical coefficients, such as
One of the top priorities in machine learning is still creating effective and ideal decision trees that are based on various new splitting metrics. Chandra et al.
12
created decision trees using the Distinct Class-based Splitting Measure (DCSM), a novel splitting criterion that is founded on the concept of distinct classes. In addition, Wang and his team
13
introduce a less greedy two-term Tsallis Entropy Information Metric (TEIM) algorithm for decision tree classification using a new split criterion that is based on two-term Tsallis conditional entropy. Furthermore, Zhou et al. in 2021
14
describe the Feature Weight based Decision Tree (FWDT) decision tree approach based on the feature weight principle, where the weights of features are determined by employing the ReliefF algorithm
15
. Additionally, a brand-new node partitioning metric called Entropy Gini Integrated Approach (EGIA), which combines the GI and entropy, was designed by Singh & Chhabra in
The splitting criterion that is utilized when building a decision tree has a significant impact on the performance of the model. In order to verify this assertion, this work compares the performance of several decision tree methods that are based on various splitting criteria in terms of four evaluation metrics: Classification accuracy, tree depth, leaf nodes, and tree construction time. In other words, the main objective of this paper is to contrast various splitting measures that belong to different categories. Consequently, six decision tree algorithms are chosen based on four categories of splitting criteria, including two decision trees with information theory-based splitting criteria (Iterative Dichotomizer 3 (ID3)
1
and C
The main contributions of this study are:
Background on the six compared decision tree processes ID3, C Twelve data sets from diverse fields are used to assess the effectiveness of the six techniques using four different evaluation measurements. To further analyze the obtained results, the Friedman and post-hoc Nemenyi tests are carried out.
The remaining sections of the paper are organized as follows: first, a brief overview of the ID3, C
Background on decision tree algorithms
The six decision tree strategies that will be examined in this work involve three well-known methods, including ID3, C
The next subsections provide a brief summary of the different decision tree procedures that employ splitting criteria from various categories.
Decision trees with information theory-based splitting criteria
ID3 method:
The ID3 decision tree technique employs the IG metric to evaluate the significance of attributes.
In a data set

Assume that the attribute

Finally, the attribute with the highest IG value is then picked as the splitting attribute since it is the most relevant one.
C4.5 technique:
The C
In a data set


According to the C
Decision tree with distance-based splitting criterion
CART
strategy:
The GI is utilized as an attribute evaluation metric by the CART technique to choose the optimum splitting attributes.
For a data set
Since the CART technique only allows for the creation of binary decision trees with two child nodes per node, the training data set

Decision trees with statistical-based splitting criteria
PCC-Tree algorithm:
The PCC-Tree technique analyzes attributes, selects the best attributes for splitting, and identifies the best splitting points by using the PCC as an impurity measure.
Assume that
Structure of the data set.

The PCC-Tree technique starts by substituting each attribute 
Furthermore, another vector is generated for each attribute 
Finally, the splitting attribute 
In equation (10), DR approach:
As the first preprocessing stage, the DR decision tree technique discretizes the numerical attributes of the data set using the k-means strategy. The DR metric, a modification of the preexisting CR statistic, is then used to evaluate the importance of all attributes.
The DR of a categorical attribute 
where
The numerator of the DR measure represents the dispersion in the relative importances of an attribute among individual classes and the denominator represents the dispersion in the importance of that attribute across the whole population. On the other hand, the relative importance of the attribute
According to Equation (11), the attribute with the highest value of DR will be chosen as the splitting attribute.
Decision tree based on another splitting criterion
FWDT approach:
The k-means strategy is used as a preprocessing stage of the FWDT approach to discretize the numerical attributes of the data set. Before constructing the decision tree, the attribute space is reduced using the ReliefF feature selection method, which assigns weights to attributes. Then, all the attributes that have weight values above a certain threshold are chosen, while the others are afterwards removed. The median of the sorted feature weight vector serves as the threshold for the ReliefF method in the FWDT technique.
To evaluate the weight of an attribute 
In the traditional ReliefF algorithm, 

Greater importance of the attribute to the class attribute is indicated by a bigger estimated weight value.
After the discretization and pre-filtering steps, the decision tree can be constructed based on the remaining attributes. Therefore, the splitting attribute used to separate the current node is the one with the highest weight value.
Each of the six decision tree techniques ID3, C
Advantages and disadvantages of the ID3, C

Experimental study
In this section, the performances of the decision tree strategies ID3, C
Data set and computing environment description
Several data sets with various numbers of instances, attributes, and classes are collected for the purpose of experimentally comparing the efficacy of the ID3, C The Bankruptcy data set forecasts bankruptcy based on The Breast Cancer W-D data set, a diagnostic Wisconsin breast cancer database, consists of The Hayes Roth data set belongs to the topic of human subjects study. This database includes The Hepatitis data set is made up of The Immunotherapy data set involves information about wart treatment results of The Iris data set employs The New Thyroid data set is a multi-class database that describes The Pima data set makes a diabetes diagnosis prediction for a patient based on specific diagnostic measurements ( The Seeds data set analyzes The Somerville data set includes The Statlog dataset, a heart disease database, divides The Wine data set identifies the origin of wines using chemical analysis. This data set contains
Table 3 provides a summary of the characteristics of the data sets that were collected.
Detailed information on the employed data sets.

ID3: iterative dichotomizer 3; CART: classification and regression trees; PCC-Tree: Pearson’s correlation coefficient based decision tree; DR: dispersion ratio; FWDT: feature weight based decision tree; IG: information gain; GR: gain ratio; GI: Gini index.
The hardware condition used in this experiment is an Intel (R) Core (TM) i
Description of evaluation metrics
The performance of the ID3, C Classification accuracy is the most important performance indicator for assessing the overall effectiveness of a classifier. It is determined by the number of unseen instances that a classifier correctly classifies out of the total number of instances provided for testing. The classification accuracy is expressed as follows: Decision tree depth represents the size of a decision tree (i.e., the total number of nodes in a tree). Leaf node count identifies the number of leaf nodes in a decision tree. Tree development time indicates the time required by a decision tree algorithm for constructing a tree.
A decision tree strategy performs well when the classification accuracy is higher, the tree depth is shallower, there are fewer leaf nodes, and the tree is formed more quickly.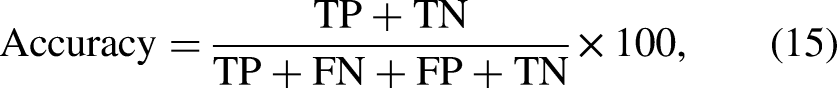
Each data set is treated using the five-fold cross-validation methodology 19 . Consequently, every reported result in this framework is based on the average value of 50 times five-fold cross-validation.
Analysis of the classification accuracy reached using the ID3, C
, CART, PCC-Tree, DR, and FWDT strategies
The classification accuracies obtained using the ID3, C
Classification accuracies (%) produced by the ID3, C

ID3: iterative dichotomizer 3; CART: classification and regression trees; PCC-Tree: Pearson’s correlation coefficient based decision tree; DR: dispersion ratio; FWDT: feature weight based decision tree.
The bold font is utilized to highlight the best results for each data set.
Based on the analysis of Table 4, it can be seen that none of the C
It can be said that the results for classification accuracy obtained using the three traditional decision tree methods are preferred to those acquired using the three other recent techniques.
The Friedman test
20
, which is based on the average ranks, is used to further examine the classification accuracy levels attained by the six algorithms on the 12 data sets. The null hypothesis that will be tested asserts that the testing accuracies of the ID3, C
Average ranks for classification accuracies of the six methods.
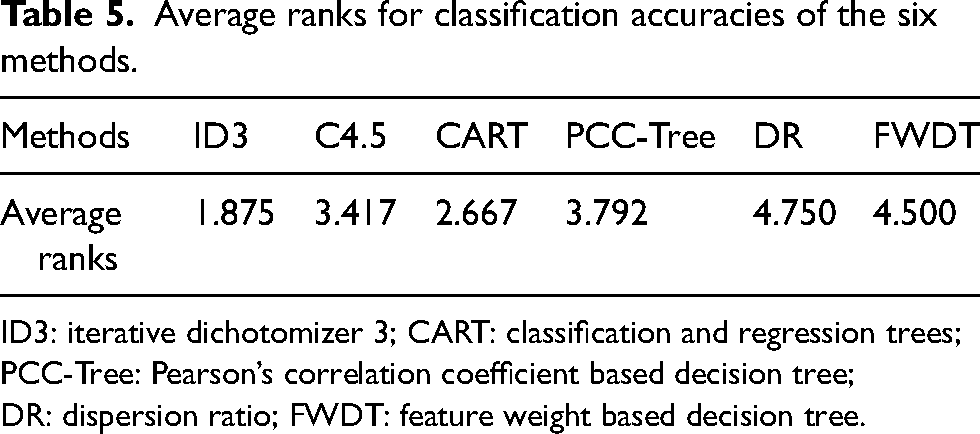
ID3: iterative dichotomizer 3; CART: classification and regression trees; PCC-Tree: Pearson’s correlation coefficient based decision tree; DR: dispersion ratio; FWDT: feature weight based decision tree.
The ID3 method appears to be the best among the six approaches in terms of classification accuracy given that it has the lowest average rank, as shown in Table 5.
Given that 
Later, based on the Friedman statistic, Iman’s F statistic can be computed as in equation (17).
The Friedman statistic
After ruling out the null hypothesis, a post hoc Nemenyi test
20
is employed to determine which strategy performs better than the others. The Nemenyi test reveals that there is a statistically significant difference in the performance of at least two decision tree strategies when the critical difference (CD), which is given by the equation below, exists between the corresponding average rankings of the two approaches.
The pairwise differences (in absolute value) of average rankings for classification accuracies that are attained by the ID3, C
Pairwise differences of average ranks for testing accuracies.

ID3: iterative dichotomizer 3; CART: classification and regression trees; PCC-Tree: Pearson’s correlation coefficient based decision tree; DR: dispersion ratio; FWDT: feature weight based decision tree.
The examination of Table 6 demonstrates that, in terms of classification accuracy, the ID3 methodology performs significantly better than the DR and FWDT strategies. However, it is evident that in terms of classification accuracy, none of the three recent decision tree methods, PCC-Tree, DR, and FWDT can significantly exceed the other three traditional ones.
Comparison of the tree depth among the ID3, C
, CART, PCC-Tree, DR, and FWDT techniques
With regard to the tree depth measurement, Table 7 displays the tree depths that were reached by applying the ID3, C
Tree depths produced by the ID3, C

ID3: iterative dichotomizer 3; CART: classification and regression trees; PCC-Tree: Pearson’s correlation coefficient based decision tree; DR: dispersion ratio; FWDT: feature weight based decision tree.
The bold font is utilized to highlight the best results for each data set.
According to Table 7, the C
The Friedman test is also employed to further analyze the tree depths that the six algorithms on the 12 data sets have acquired. The null hypothesis asserts that the tree depths of the ID3, C
Average ranks for tree depths of the six methods.

ID3: iterative dichotomizer 3; CART: classification and regression trees; PCC-Tree: Pearson’s correlation coefficient based decision tree; DR: dispersion ratio; FWDT: feature weight based decision tree.
Given that the CART methodology, as shown in Table 8, has the lowest average rank among the six techniques, it seems to be the most effective in terms of the tree depth metric.
The Friedman 

In order to establish which approach works better than the others, the post hoc Nemenyi test is additionally performed. The pairwise differences (in absolute value) of average ranks for tree depths attained by the ID3, C
Pairwise differences of average ranks for tree depths.

ID3: iterative dichotomizer 3; CART: classification and regression trees; PCC-Tree: Pearson’s correlation coefficient based decision tree; DR: dispersion ratio; FWDT: feature weight based decision tree.
In terms of the tree depth, the ID3 methodology greatly beats both the C
Examining the number of leaf nodes produced by the ID3, C
, CART, PCC-Tree, DR, and FWDT methods
Table 10 displays the leaf node counts that were reported by implementing the ID3, C
Number of leaf nodes produced by the ID3, C
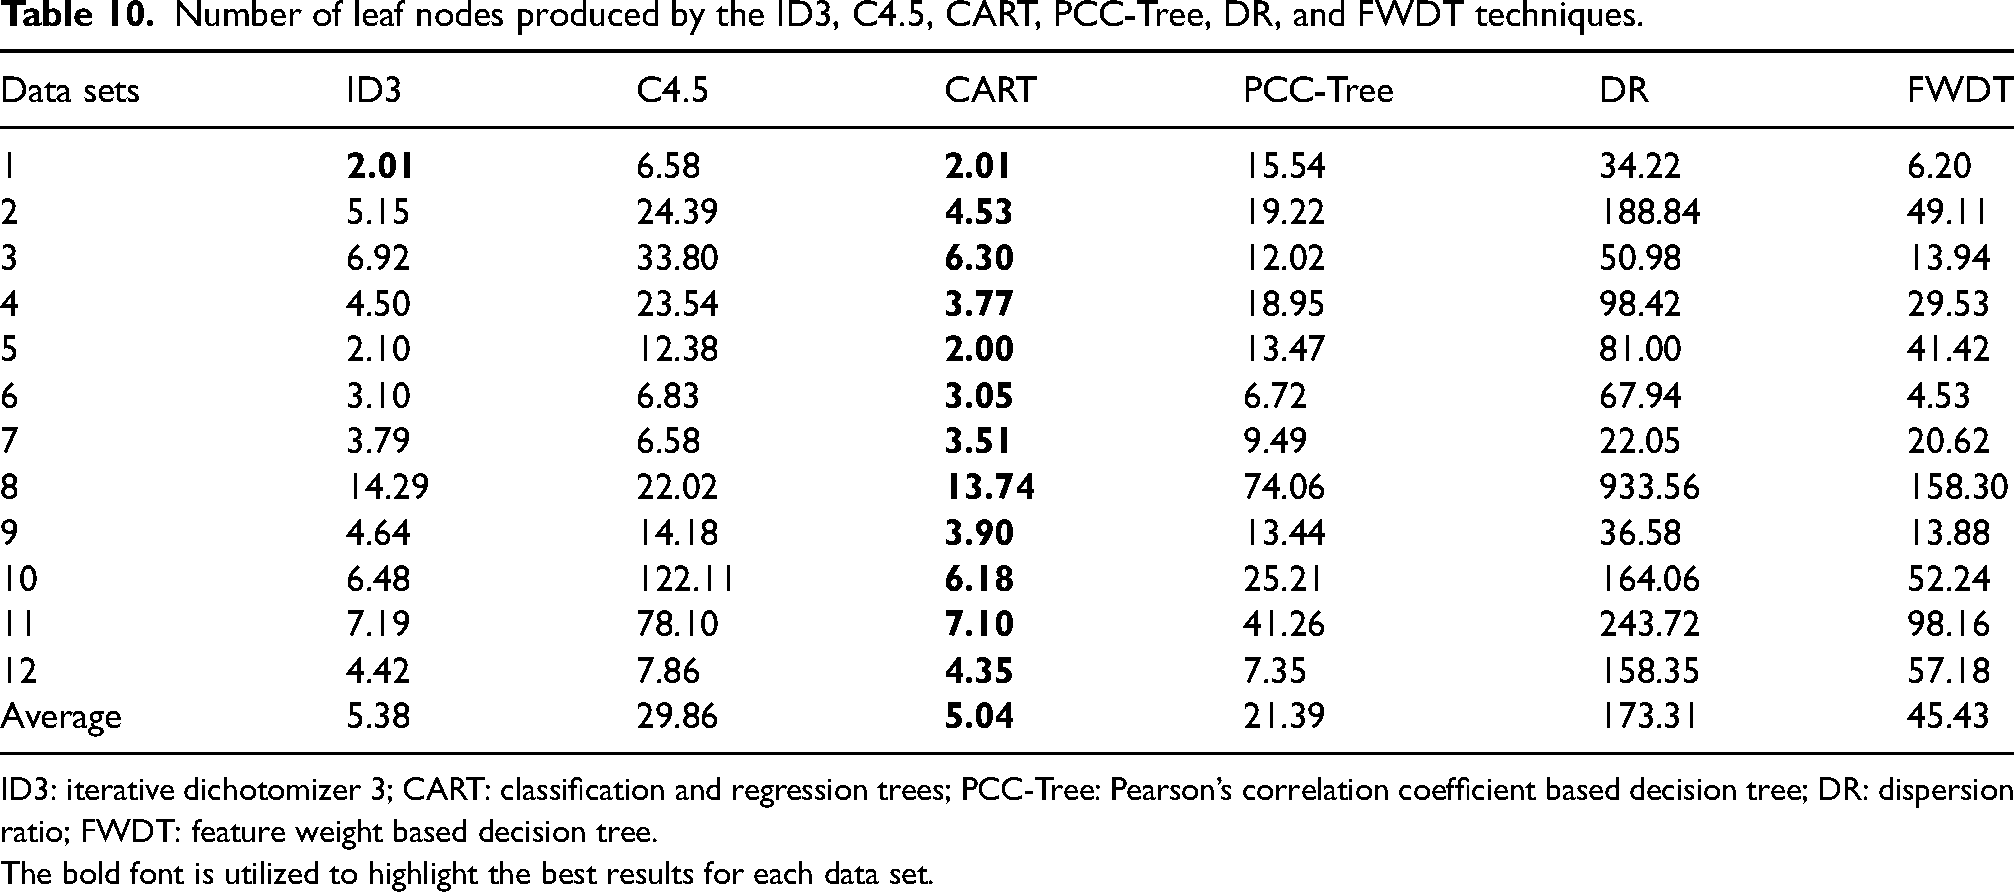
ID3: iterative dichotomizer 3; CART: classification and regression trees; PCC-Tree: Pearson’s correlation coefficient based decision tree; DR: dispersion ratio; FWDT: feature weight based decision tree.
The bold font is utilized to highlight the best results for each data set.
The CART strategy, just like it did for the tree depth metric, surpasses all five other strategies in terms of leaf node count, as indicated by Table 10. It can provide the fewest number of leaf nodes across all data sets (
The leaf node counts acquired by the six algorithms are further examined using the Friedman test. The tested null hypothesis states that the numbers of leaf nodes of the ID3, C
Average ranks for leaf nodes of the six methods.
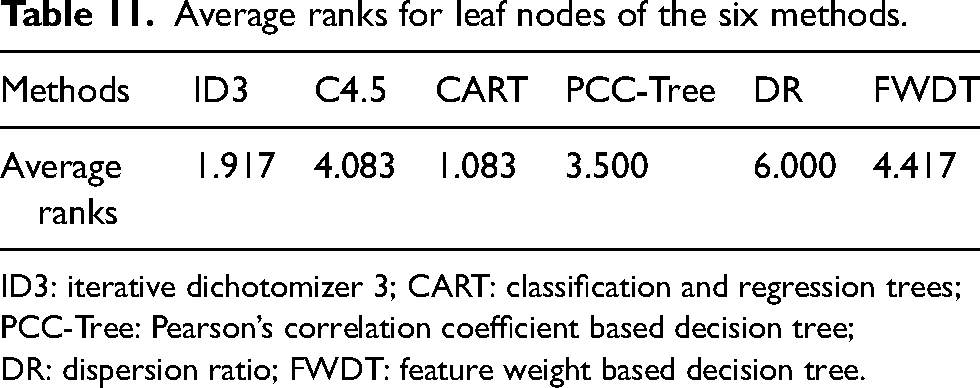
ID3: iterative dichotomizer 3; CART: classification and regression trees; PCC-Tree: Pearson’s correlation coefficient based decision tree; DR: dispersion ratio; FWDT: feature weight based decision tree.
The 

Additionally, the post hoc Nemenyi test is conducted to discover which method performs more effectively than the others. Table 12 displays the pairwise differences (in absolute value) of average rankings for leaf nodes generated by the ID3, C
Pairwise differences of average ranks for leaf nodes.
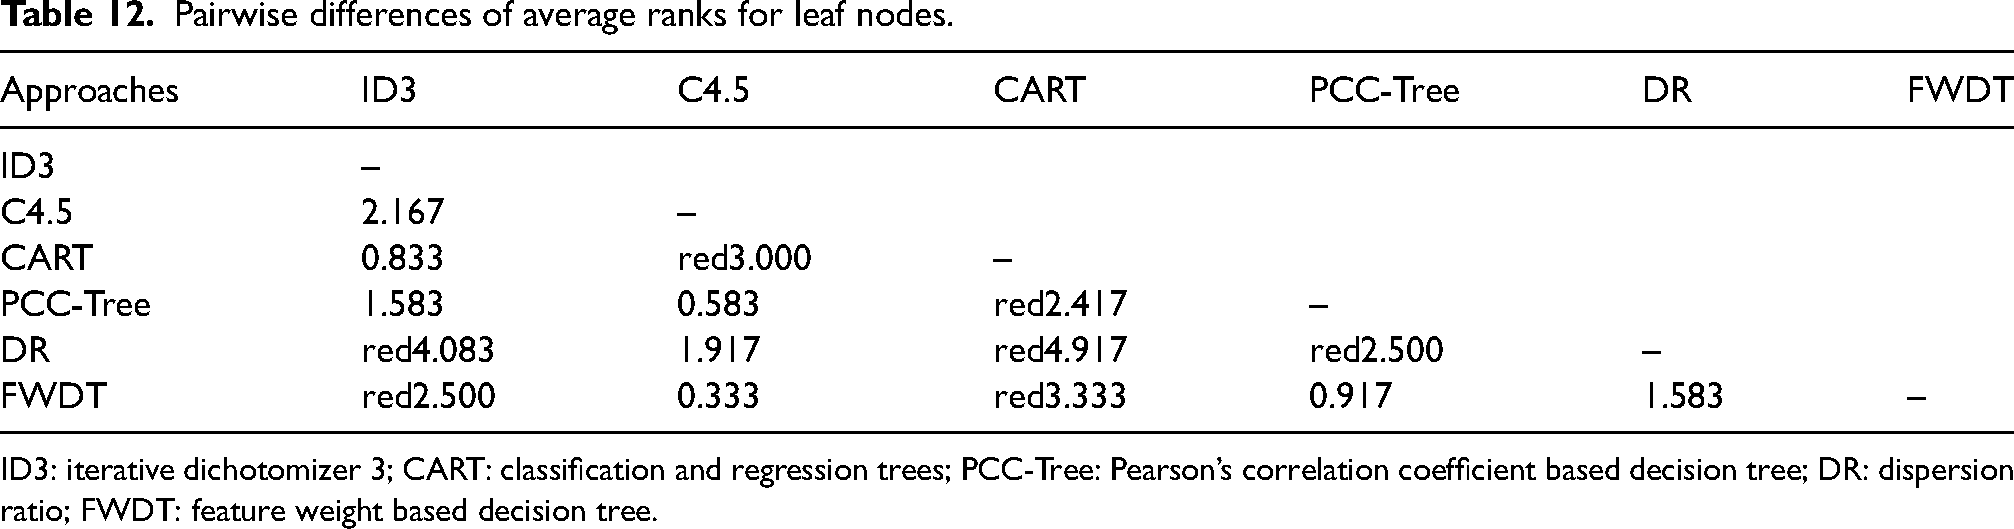
ID3: iterative dichotomizer 3; CART: classification and regression trees; PCC-Tree: Pearson’s correlation coefficient based decision tree; DR: dispersion ratio; FWDT: feature weight based decision tree.
Table 12 analysis shows that the ID3 method produces decision trees with leaf node counts that are significantly lower than those produced by the DR and FWDT approaches. The CART technique, on the other hand, greatly surpasses each of the C
Comparison of the tree construction time among
the ID3, C
, CART, PCC-Tree, DR, and FWDT approaches
Table 13 gives the times (in seconds) that the ID3, C
Comparison of the running time (seconds) among the ID3, C

ID3: iterative dichotomizer 3; CART: classification and regression trees; PCC-Tree: Pearson’s correlation coefficient based decision tree; DR: dispersion ratio; FWDT: feature weight based decision tree.
The bold font is utilized to highlight the best results for each data set.
According to Table 13, the ID3 technique takes the second-shortest amount of time to generate decision trees, after the CART methodology. The average amount of time required to generate a tree using the CART approach is merely
Similarly, the Friedman test is also conducted to test the null hypothesis, which states that the times taken by the ID3, C
Average ranks for tree construction times produced by the six methodologies.

ID3: iterative dichotomizer 3; CART: classification and regression trees; PCC-Tree: Pearson’s correlation coefficient based decision tree; DR: dispersion ratio; FWDT: feature weight based decision tree.
For the tree building time measure, the 
The Nemenyi test is employed to identify which method performs better than the others. The pairwise differences (in absolute value) of average ranks for tree building durations are summarized in Table 15. Pairwise differences that differ by more than CD are highlighted in red.
Pairwise differences of average ranks for tree construction time.
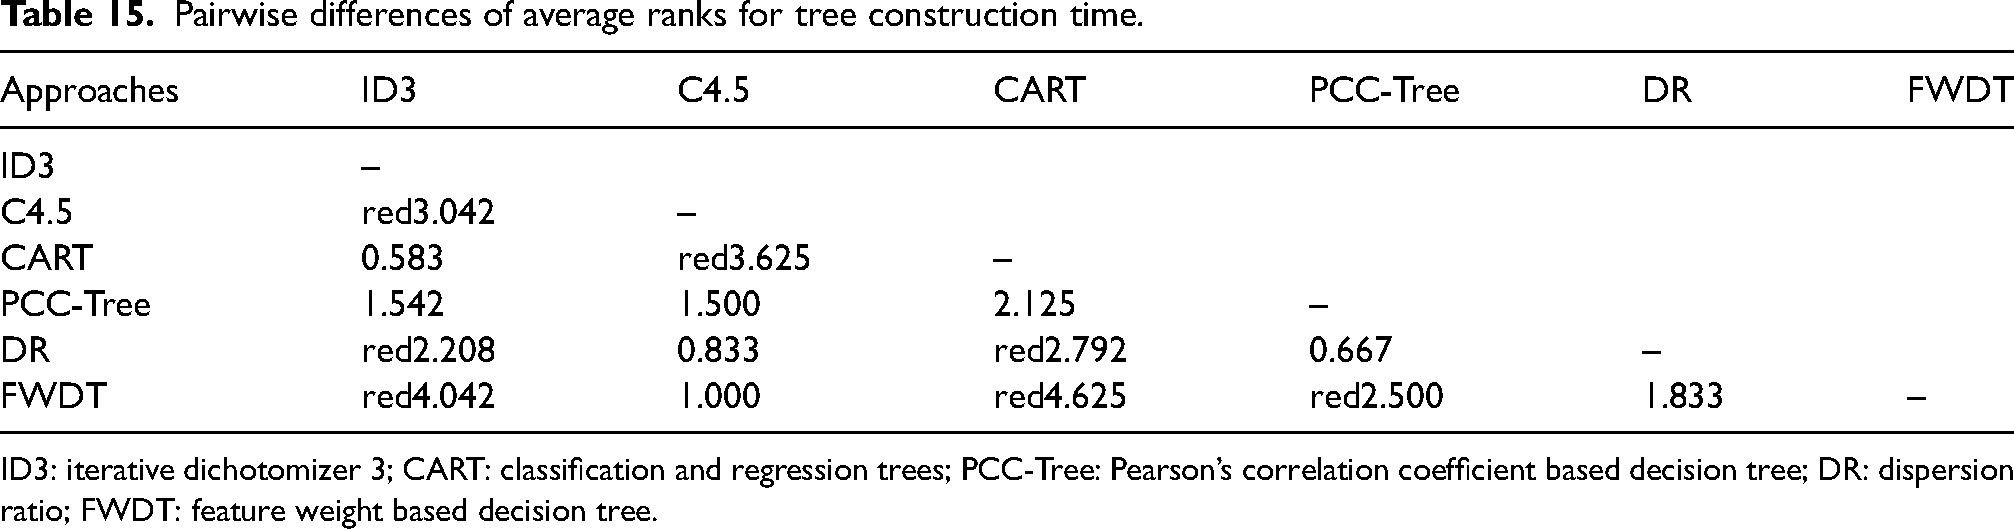
ID3: iterative dichotomizer 3; CART: classification and regression trees; PCC-Tree: Pearson’s correlation coefficient based decision tree; DR: dispersion ratio; FWDT: feature weight based decision tree.
It can be deduced from Table 15 that the C
In summary, the results of using the ID3, C

Comparison among the effectiveness of the ID3, C
Therefore, it can be said that the Friedman and post hoc Nemenyi tests demonstrate that the ID3 and CART procedures are preferred and more efficient than the other techniques in terms of all the four measurements (classification accuracy, tree depth, leaf nodes, and tree construction time).
Conclusion
This paper investigated the efficacy of six decision tree methods that are based on a variety of node splitting metrics. These criteria belong to various categories, including criteria based on information theory, criteria based on distance, statistical-based criteria, and other splitting criteria. The six decision tree strategies comprise the three well-known ID3, C
On eleven data sets with various dimensionalities, the six procedures are validated to see how well they perform in terms of four metrics: classification accuracy, tree depth, leaf nodes, and tree construction time. The obtained results demonstrate that the traditional ID3 and CART approaches perform better than the other methods. To further analyze the experimental results statistically, the Friedman and post-hoc Nemenyi tests are performed. These two tests confirm that the ID3 and CART techniques are very comparable in terms of effectiveness and are both preferable to the other methodologies.
A novel decision tree method, which is based on preordonance theory21–24, will be proposed in the future work.
Footnotes
Acknowledgements
This work was supported by the National Center for Scientific and Technical Research of Morocco (CNRST).
Declaration of conflicting interests
The authors declared no potential conflicts of interest with respect to the research, authorship, and/or publication of this article.
Funding
The authors received no financial support for the research, authorship and/or publication of this article.