
Abstract
The optimization of experimental results has repeatedly posed major challenges for scientist and engineers. In this work, a systematic multi-layer optimization scheme is proposed in conjunction with particle swarm optimization algorithm to locate a global optimum that fits a cost function. The technique utilizes SP-lines to form three-dimensional patches surfaces from experimental data in multi-layer fashion and incorporates a multi-layer search using particle swarm optimization. The novel technique is illustrated and verified over two layers of experimental data to show its effectiveness.
Introduction
Researchers use experiments to answer questions by following the scientific method. Consequently, experiments design and results analysis are used to verify and validate the initial hypothesis or assertions. Typically, many trials of the experiments are carried out producing huge amounts of multi-variable and multi-dimensional data. Even though there are many references on experimental design and statistical data analysis, but only a few addresses the data representation and search for an optima, especially for multivariate experiments, where the collected data from the repetition of the trials upsurge.1–3
Currently, in literature, the optimization of experimental results has constantly posed major challenges for scientists and engineers. In such multivariate problems, the use of non-linear techniques like design of experiments (DoE) is used to explore the interaction effects of experiment variables. The DoE is considered the most effective and economical technique to evaluate the individual and combined effects of experiment variables on output responses. 4
Other multivariate optimizing techniques exist; such as the response surface methodology, which is a collection of statistical and mathematical methods, is well known as a useful method to analyze engineering problems based on both modeling and optimizing the response surface that is influenced by experiment variables. 5 Neural Nets (NNs) and Genetic Algorithms (GAs) are used to solve multi-objective optimum problems. 6 More techniques are found that use the knowledge-based learning extreme method with cuckoo search to determine the optimum points. 7
Historically, polynomials were used due to their attractive mathematical characteristics. Through the advent of computers, splines have gained high importance. They were first used as a replacement for polynomials in interpolation, then as a tool to construct smooth and flexible shapes in computer graphics.
The complexity of optimization strategies increases when dealing with experimental data. In this work, a novel Multi-layer Optimization (MLO) strategy that may be used to deal with experimental data is proposed. The techniques utilize the well-developed generated surfaces that are widely used for modeling in aerodynamically constrained shapes. Once the data is fitted by such surfaces and arranged in multi-layers then newly developed search techniques are used to hunt for optimum points based on a cost function.
The generation of data fitted surfaces is possible using many of the well-developed techniques. Representations for surfaces such as polynomial surface patches and tensor product cubic splines or interpolation methods such as bilinear interpolation are very popular. Approximation of surfaces using variational methods and regression splines is another option. Segmentation of point measurements into surface patches are used by many researchers. Finally, registration of surfaces with point measurements is another field area of such surface generating techniques. 8
Multi-layer graphing overview
Piecewise linear approximations of experimental data require many pieces to express reasonable, realistic and smooth surfaces. On the other hand, the set of experimental data individual surface points would take large amounts of storage. Fitting a single formula for a surface if possible would be nice, but most of the time is not possible. Hence, a collection of surface patches that utilize piecewise simple formulae might work with a reasonable amount of storage. The disadvantage would be how to specify and render such surface patches.
Fitting surfaces to data point is of interest to many industries. Commonly use of splines for the development of modeling in the aircraft and automobile industries is popular and widely used.9–12
Surfaces may be captured and defined by Parametric or Implicit formulae. A parametric representation of the form:


In this work, cubic Splines are used to represent experimental data and create a mesh of the unknown surface space. Once the mesh is constructed the generated surface patches borders are used to encapsulate using a surface polynomial. Hence, a surface patch border is fitted using a cubic Spline with known border location that are used as a constraint. The following equations maybe generated for the surface patch at the designated locations.


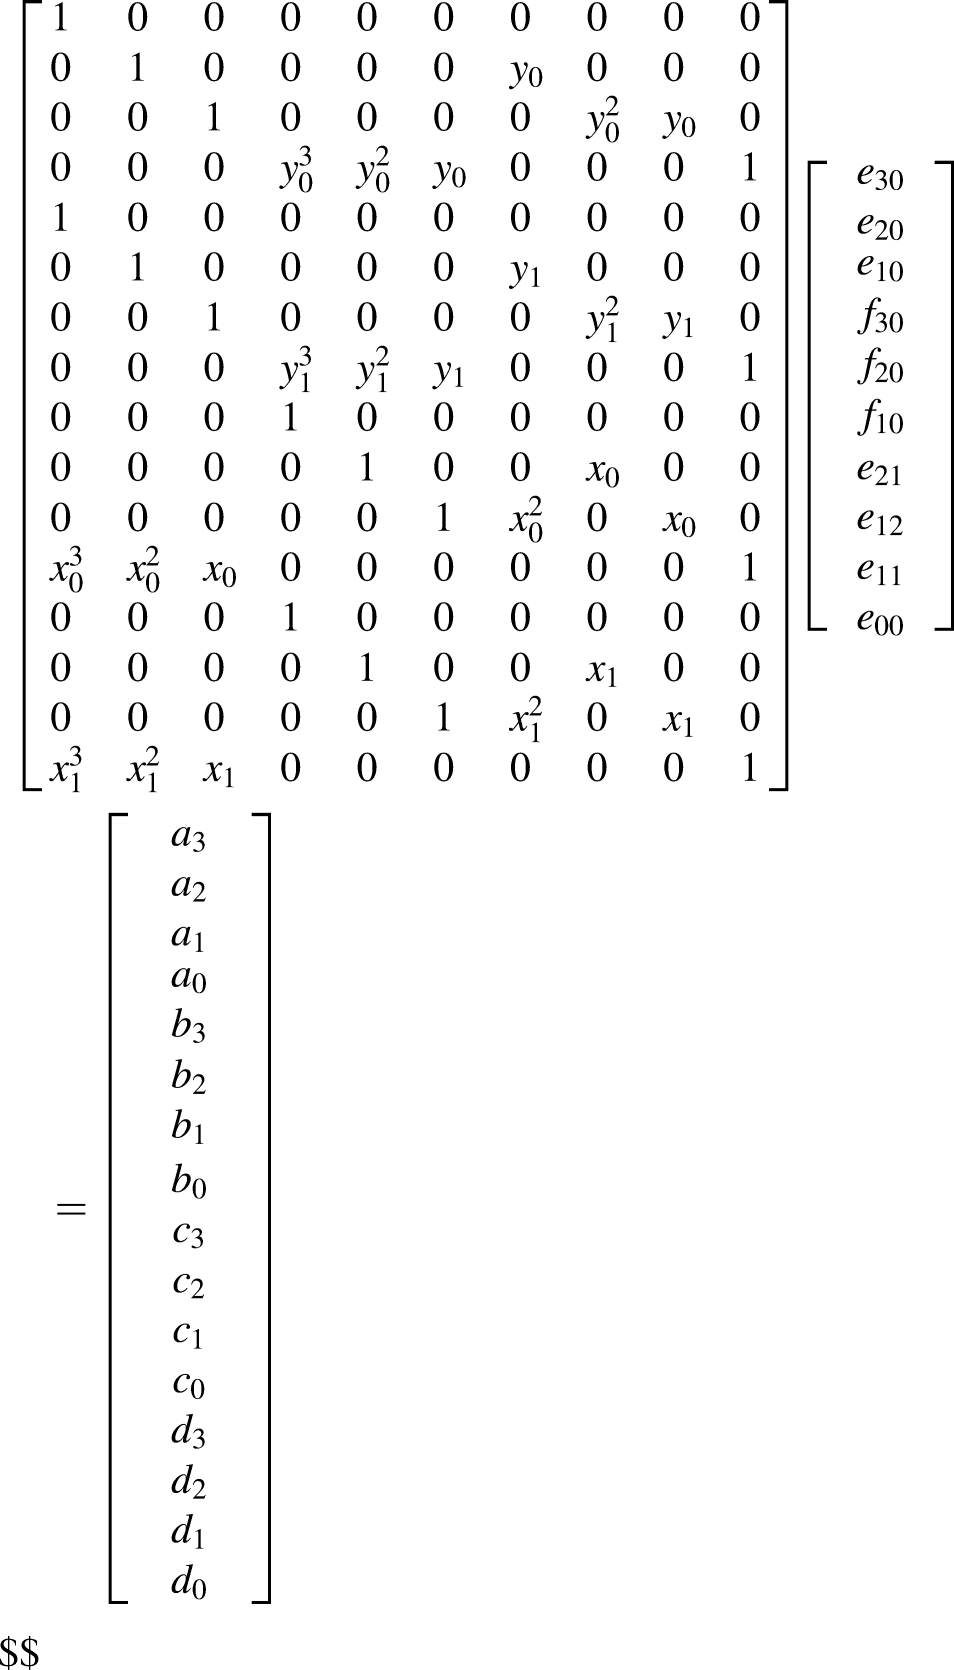
In a more compact form and using matrix notation, the following is adopted.


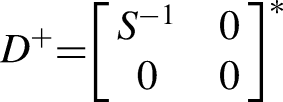
Finally, the solution to the matrix equation (8)
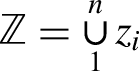
From the previous derivations, the piece-wise defined patch surfaces could be attained. Hence, the overall surface constitutes the collection or the union of the patched surfaces that are represented by equation (7).

Particle swarm optimization overview
The particle swarm optimization (PSO) has been shown to be an effective optima searching technique for difficult multidimensional none-convex problems. 15 Recently, the PSO has been successfully applied to solve large scale optimization problems in a diversity of fields. PSO was shown that for certain problems it actually outperformed GAs. 16 It is considered a stochastic evolutionary computational technique with minimal computational effort when compared with GA. Further analysis shows that the difference in computational effort between PSO and the GA is problem-dependent. It appears that PSO outperforms the GA with a larger differential in computational efficiency when used to solve unconstrained nonlinear problems with continuous design variables and less efficiency differential when applied to constrained nonlinear problems with continuous or discrete design variables.17,18
Kennedy and Eberhart have discovered the Particle Swarm Optimizer while they were trying to model the social behavior of artificial life, such as bird flocking, fish schooling, …etc. 15 A good metaphor of the PSO algorithm is to imagine a swarm of bees in a field searching for flowers. The objective of the swarms is to find the location of the most flowers. Basically, each bee will conduct a random search and it will memorize the densest location of flowers it encountered.
Now, under the assumption that all the individual swarms may share their best discoveries, then each individual swarm is guided by its own finding and it is influenced or swayed by the others reported best locations. Consequently, the swarms’ trajectories are dynamically changing and they will span the field to explore the densest flower locations. That is the swarms’ decisions are drawn from their own experience and others’ experiences and a blend of the two effects is created to create a flying trajectory. 19
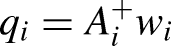
The particles are moving and sweeping the solution space intelligently and it also summarizes the used pseudo-algorithm. Each particle in the swarm tracks its position by means of two vectors; one accelerates the particle in the direction of its own and another towards a global best for the whole swarm (best of the bests). The advancement of the particles in the solution space is controlled by a simple kinematic equation of the form:


PSO pseudo algorithm


The MLO algorithm
A systematic MLO algorithm is summarized in this section. The MLO algorithm was mainly devised to optimize experimental data results with multi-variables.
MLO pseudo algorithm
For i = 1 to n
end for i

The local convergence of the aforementioned algorithm depends on large on two conditions; namely, an algorithm condition and a convergence condition. The algorithm condition guarantees that new algorithm estimations cannot be worse than the current ones, while the convergence condition describes the ability of the algorithm to get closer to the optimality region in each iteration.
Algorithm condition
Let
The algorithm condition verifies if the algorithm can sample a point in the optimality region, where one can think of this optimality region as the set of points around the optimum of the solution space in which the fitness of the PSO particle is lesser than the optimal solution value plus a strictly positive tolerance ε. In other terms, at each iteration, if the new obtained fitness is better than the previous one, then the new one replaces the best fitness. Consequently, this algorithm condition, stipulates that the new solution suggested by D cannot be worse than the current solution.
Convergence condition
A l ocal optimum is obtained by the following sufficient condition:
The second condition is the convergence condition that describes the ability of the algorithm to have a non-zero probability to get closer to the optimality region or sample a point within this region at each iteration. Showing that the algorithm satisfies the algorithm condition and convergence condition is sufficient to prove that the algorithm at least converges to a local minim, complete detailed proof of these conditions may be found in the following reference. 20
Consequently, the proposed algorithm satisfies the algorithm condition, while the convergence condition guarantees that the particles’ trajectory is convergent and the particles will keep moving closer to the global best particle. The effectiveness of the proposed algorithm and its convergence is demonstrated using a real engineering application.
Numerical application
In order to demonstrate and verify the effectiveness of the proposed optimization algorithm consider the popular internal combustion fuel mixing problem. A certain low grade of Gasoline is selected and prepared to be mixed with different concentrations of Methanol with the objective of achieving better engine output measured performance. In this application, consider nominal Gasoline with Octane Number of 89, which will be mixed with different percentages of Methanol. The desired volume percentages of Methanol that are to be added are 3%, 6%, 9%, 12% and 15%. The Methanol percentages for this study were selected such that the Methanol percentages were varied till the octane number equals to 100 (i.e. at 15% methanol) is achieved. The tests were carried out at the University of Jordan's laboratory, to study the effect of these fuel blends on the engine's performance. This was done using the TecQuipment TD43 engine that is depicted in Figure 1. This is a power test 4-Stroke, single cylinder, variable compression ratio engine having displacement volume of 582 cm3 with an electrical dynamometer that is directly coupled to it. The experimental data of brake torque, brake power, air and fuel flow rate were directly obtained from the engine control panel, while the ambient conditions were obtained through the fitted instruments.

Td43 variable compression ratio test engine.
With the engine compression ratio fixed at 8, and the fuel flow control knob opened at its optimum level as recommended by the manufacturer, and at engine speed of 1500 RPM the ignition angles were varied to find the best torque angle. An optimum angle was found to be 15 degrees before top dead center, and it was fixed for the rest of the experiments. All measurements were performed under wide open throttle and variable speed conditions, over the range of 1000 to 2500 rev/min in steps of 250 rev/min. More details on the experimental work and data analysis maybe found on references.21–23
The optimization problem
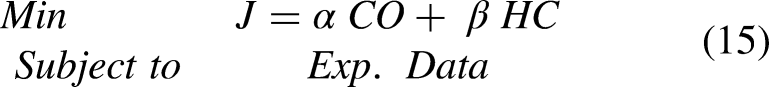
Where it is of practical interest to study the performance of internal combustion engines using multi-component fuels. This application presents an experimental investigation into the effect of Methanol over carbon monoxide (CO) and hydrocarbon (HC) emissions level. All the experiments were carried out under the same conditions (as much as possible) for uniformity and with variable speed conditions. To demonstrate the proposed technique let's consider two sets of experimental data that require the simultaneous optimization of using the following cost function.
There are many engineering methods; such as Kent-Eisenberg and artificial neural network (ANN), that are widely used to correlate and model diversity of experimental data. Such techniques are used because direct mathematical modeling is either complex or in some cases not possible. Once the model is available different predictions and optimum parameter studies may be performed. In this work, an experimental driven data based mathematical model was build, tested and verified using the ANN technique and the optimum conditions for engine power, torque and specific fuel consumption were found. The model neural network's diagram is shown in Figure 2.

ANN network with seven hidden layers.
The activation function for the hidden layers was chosen to be the Gaussian function, where the inputs to the network were the engine speed (RPM) and calorific values (Qcv). Several number of hidden layers were tested and the best results were obtained with seven layers. The equations for the hidden layers for the CO predictions is given by equations H1 through H7 as shown in the equation below.


Comparison between the experimental and model predicted values.
The results of the ANN optimization process are as shown in Figure 4. The optimum values estimated by the ANN optimization were found to be <1119, 41,323>, which results in an optimized operation with a minimum cost function value at arbitratry chosen weights of α = 30 and β = 1.

ANN optimization results by SAS-JMP© with weights of α = 30 and β = 1.
MLO
Using experimental data and equations (3)–(7) one can construct meshed patches of the two layers’ surfaces as depicted in Figures 5 and 6. While Figures 7 and 8 illustrate a high order single polynomial fitted surfaces using Matlab built-in functions. It is clear that the meshed patches have a better representation of the experimental data.
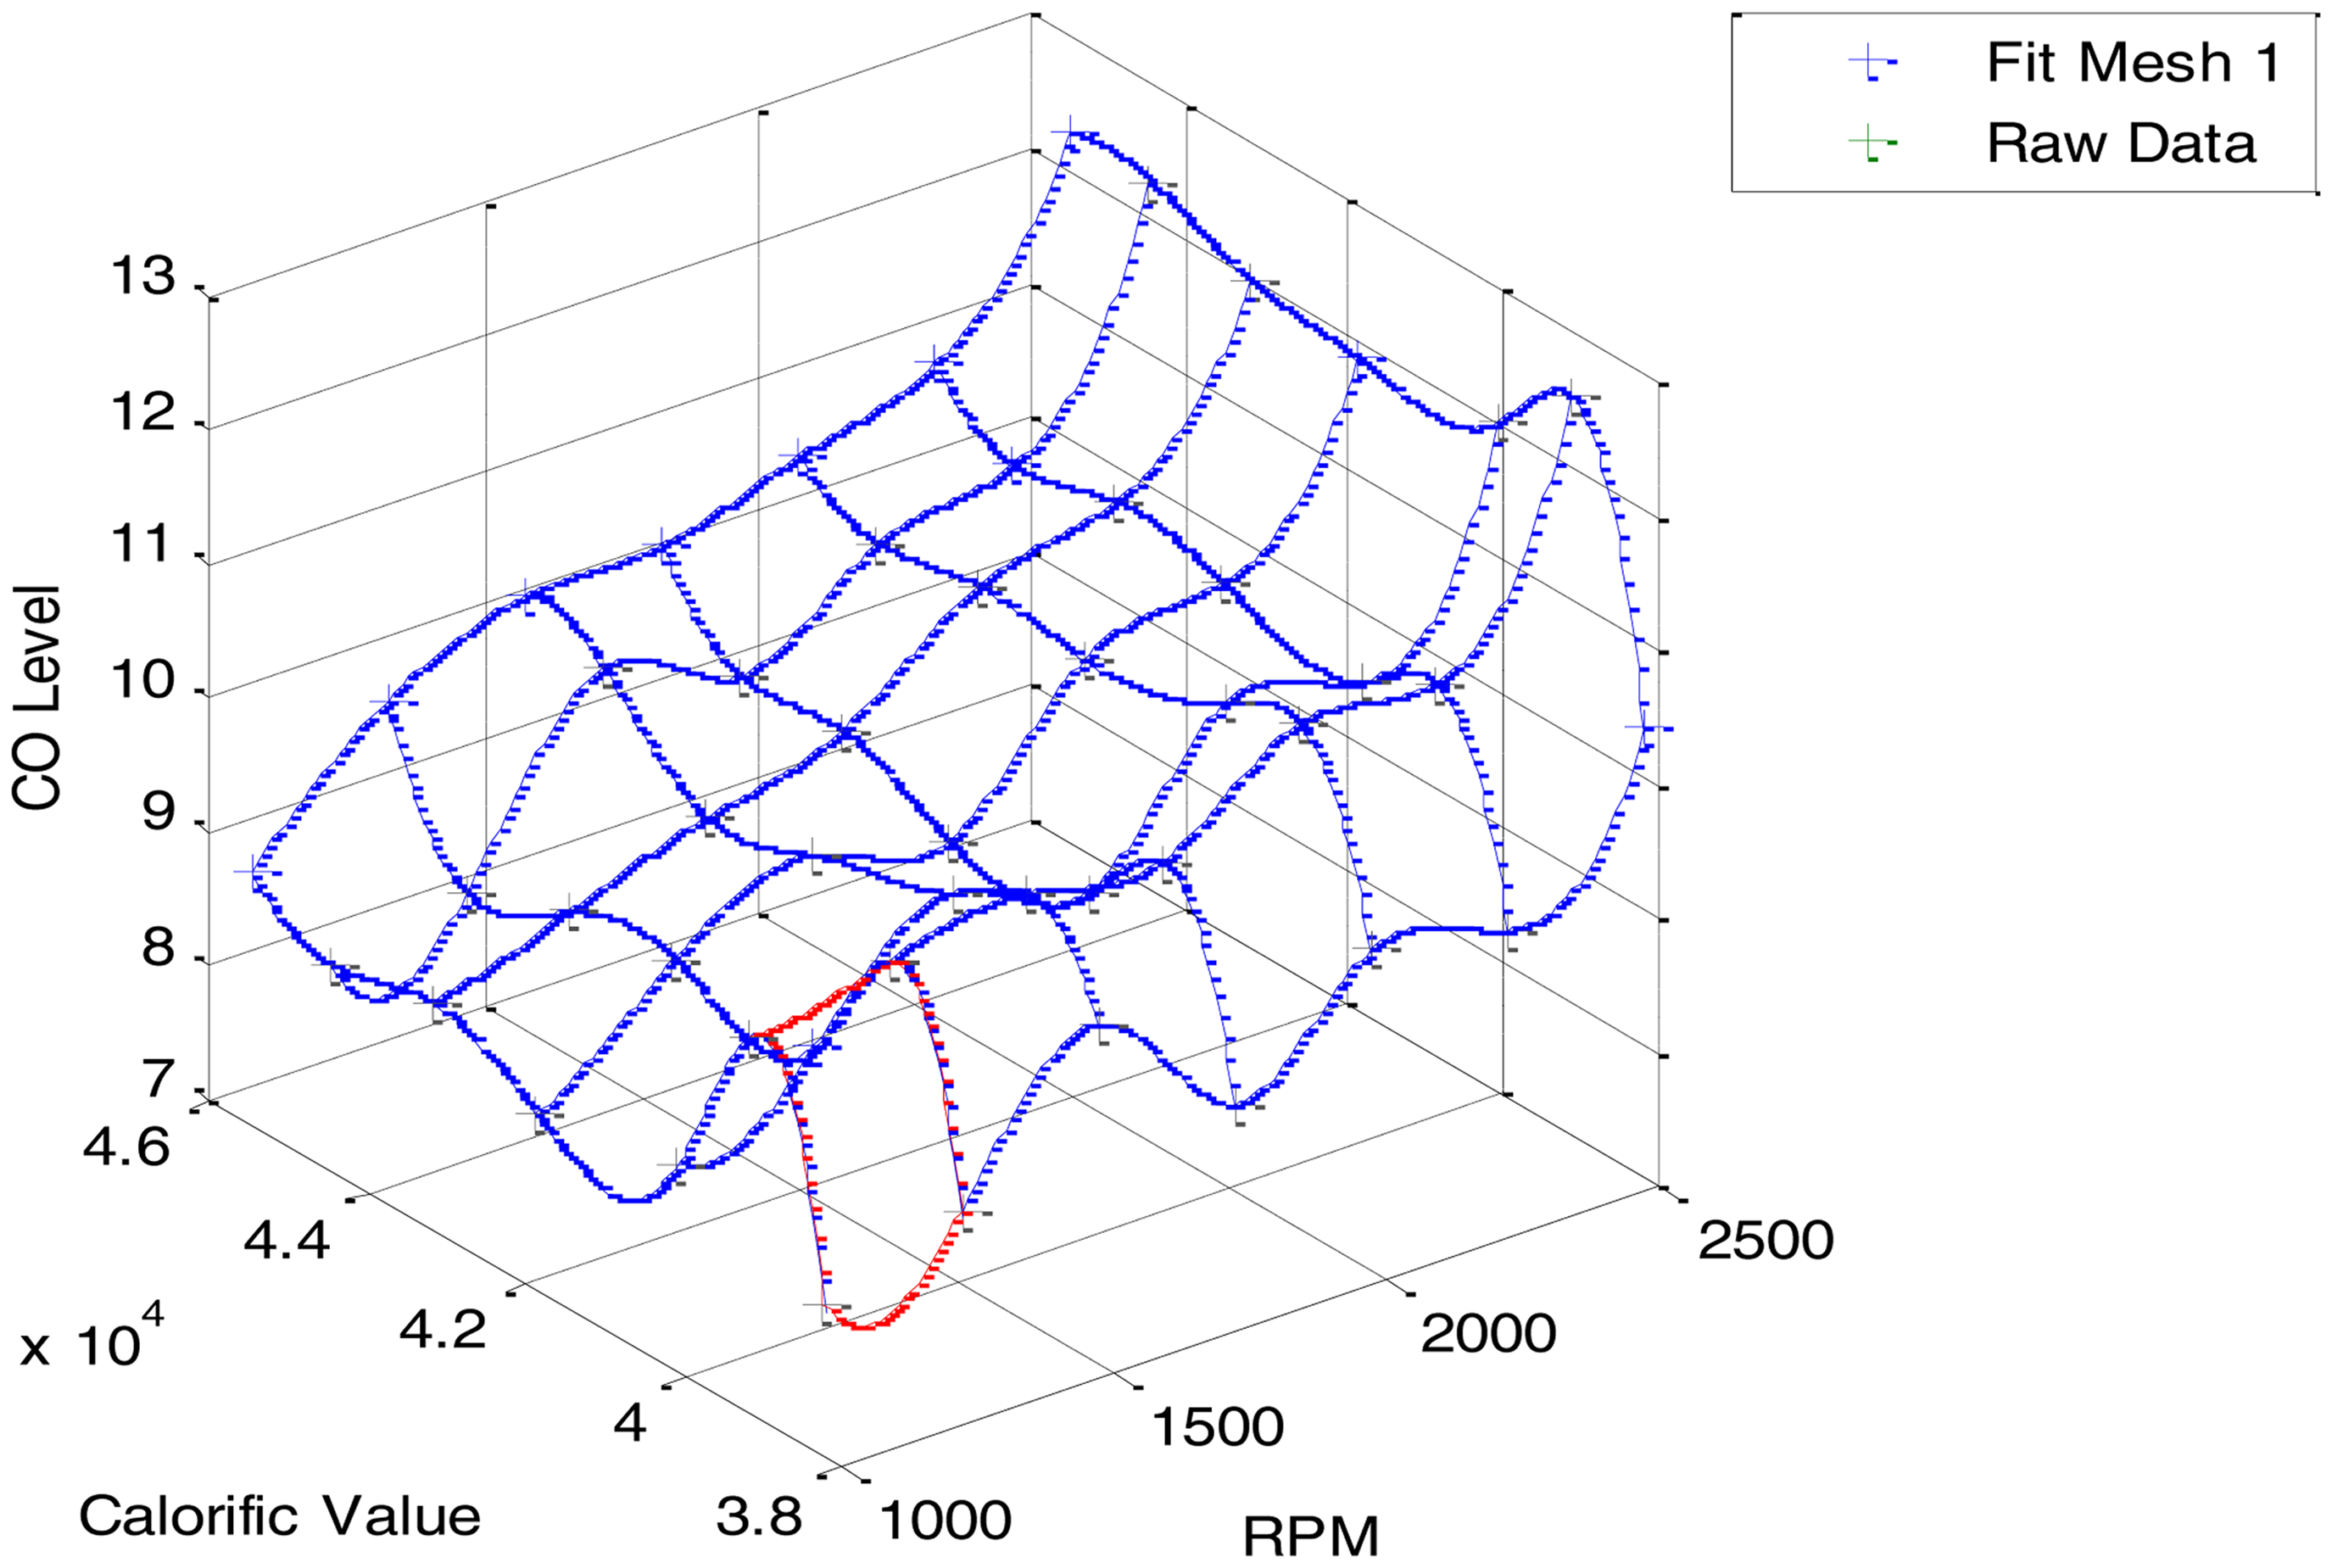
Layer 1 data fitted wire mesh.

Layer 2 data fitted wire mesh.
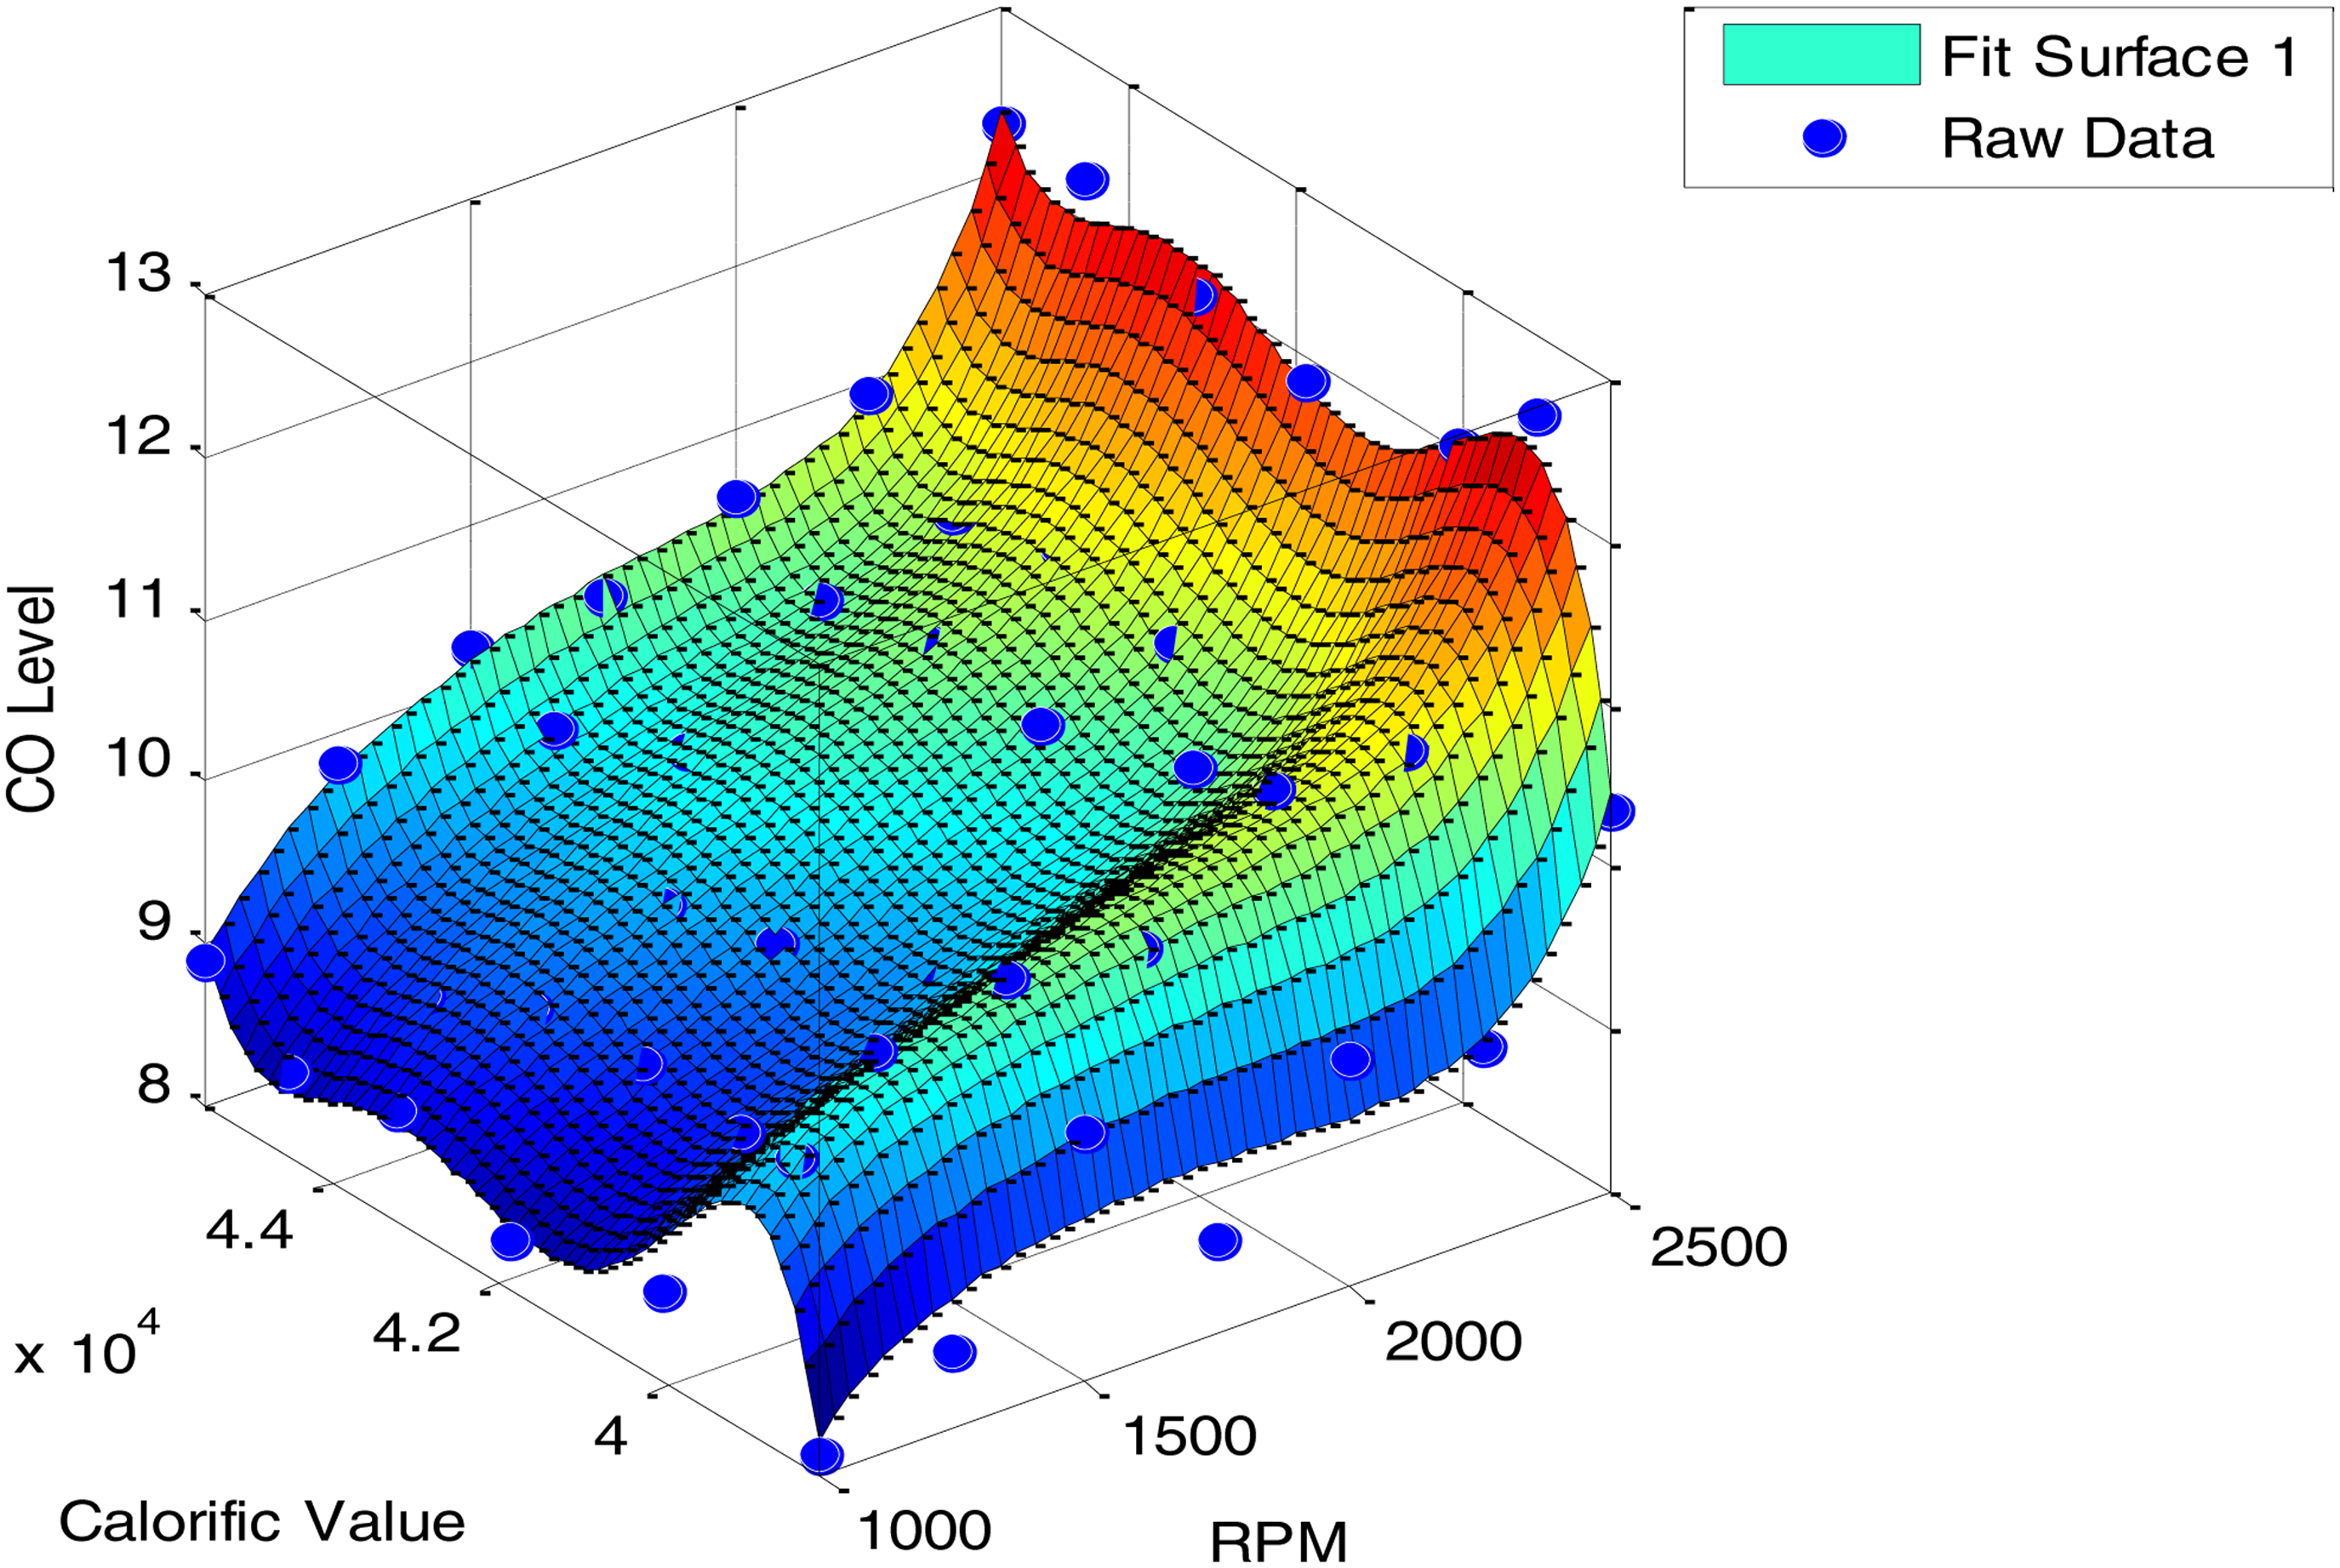
Layer 1 data fitted surface.
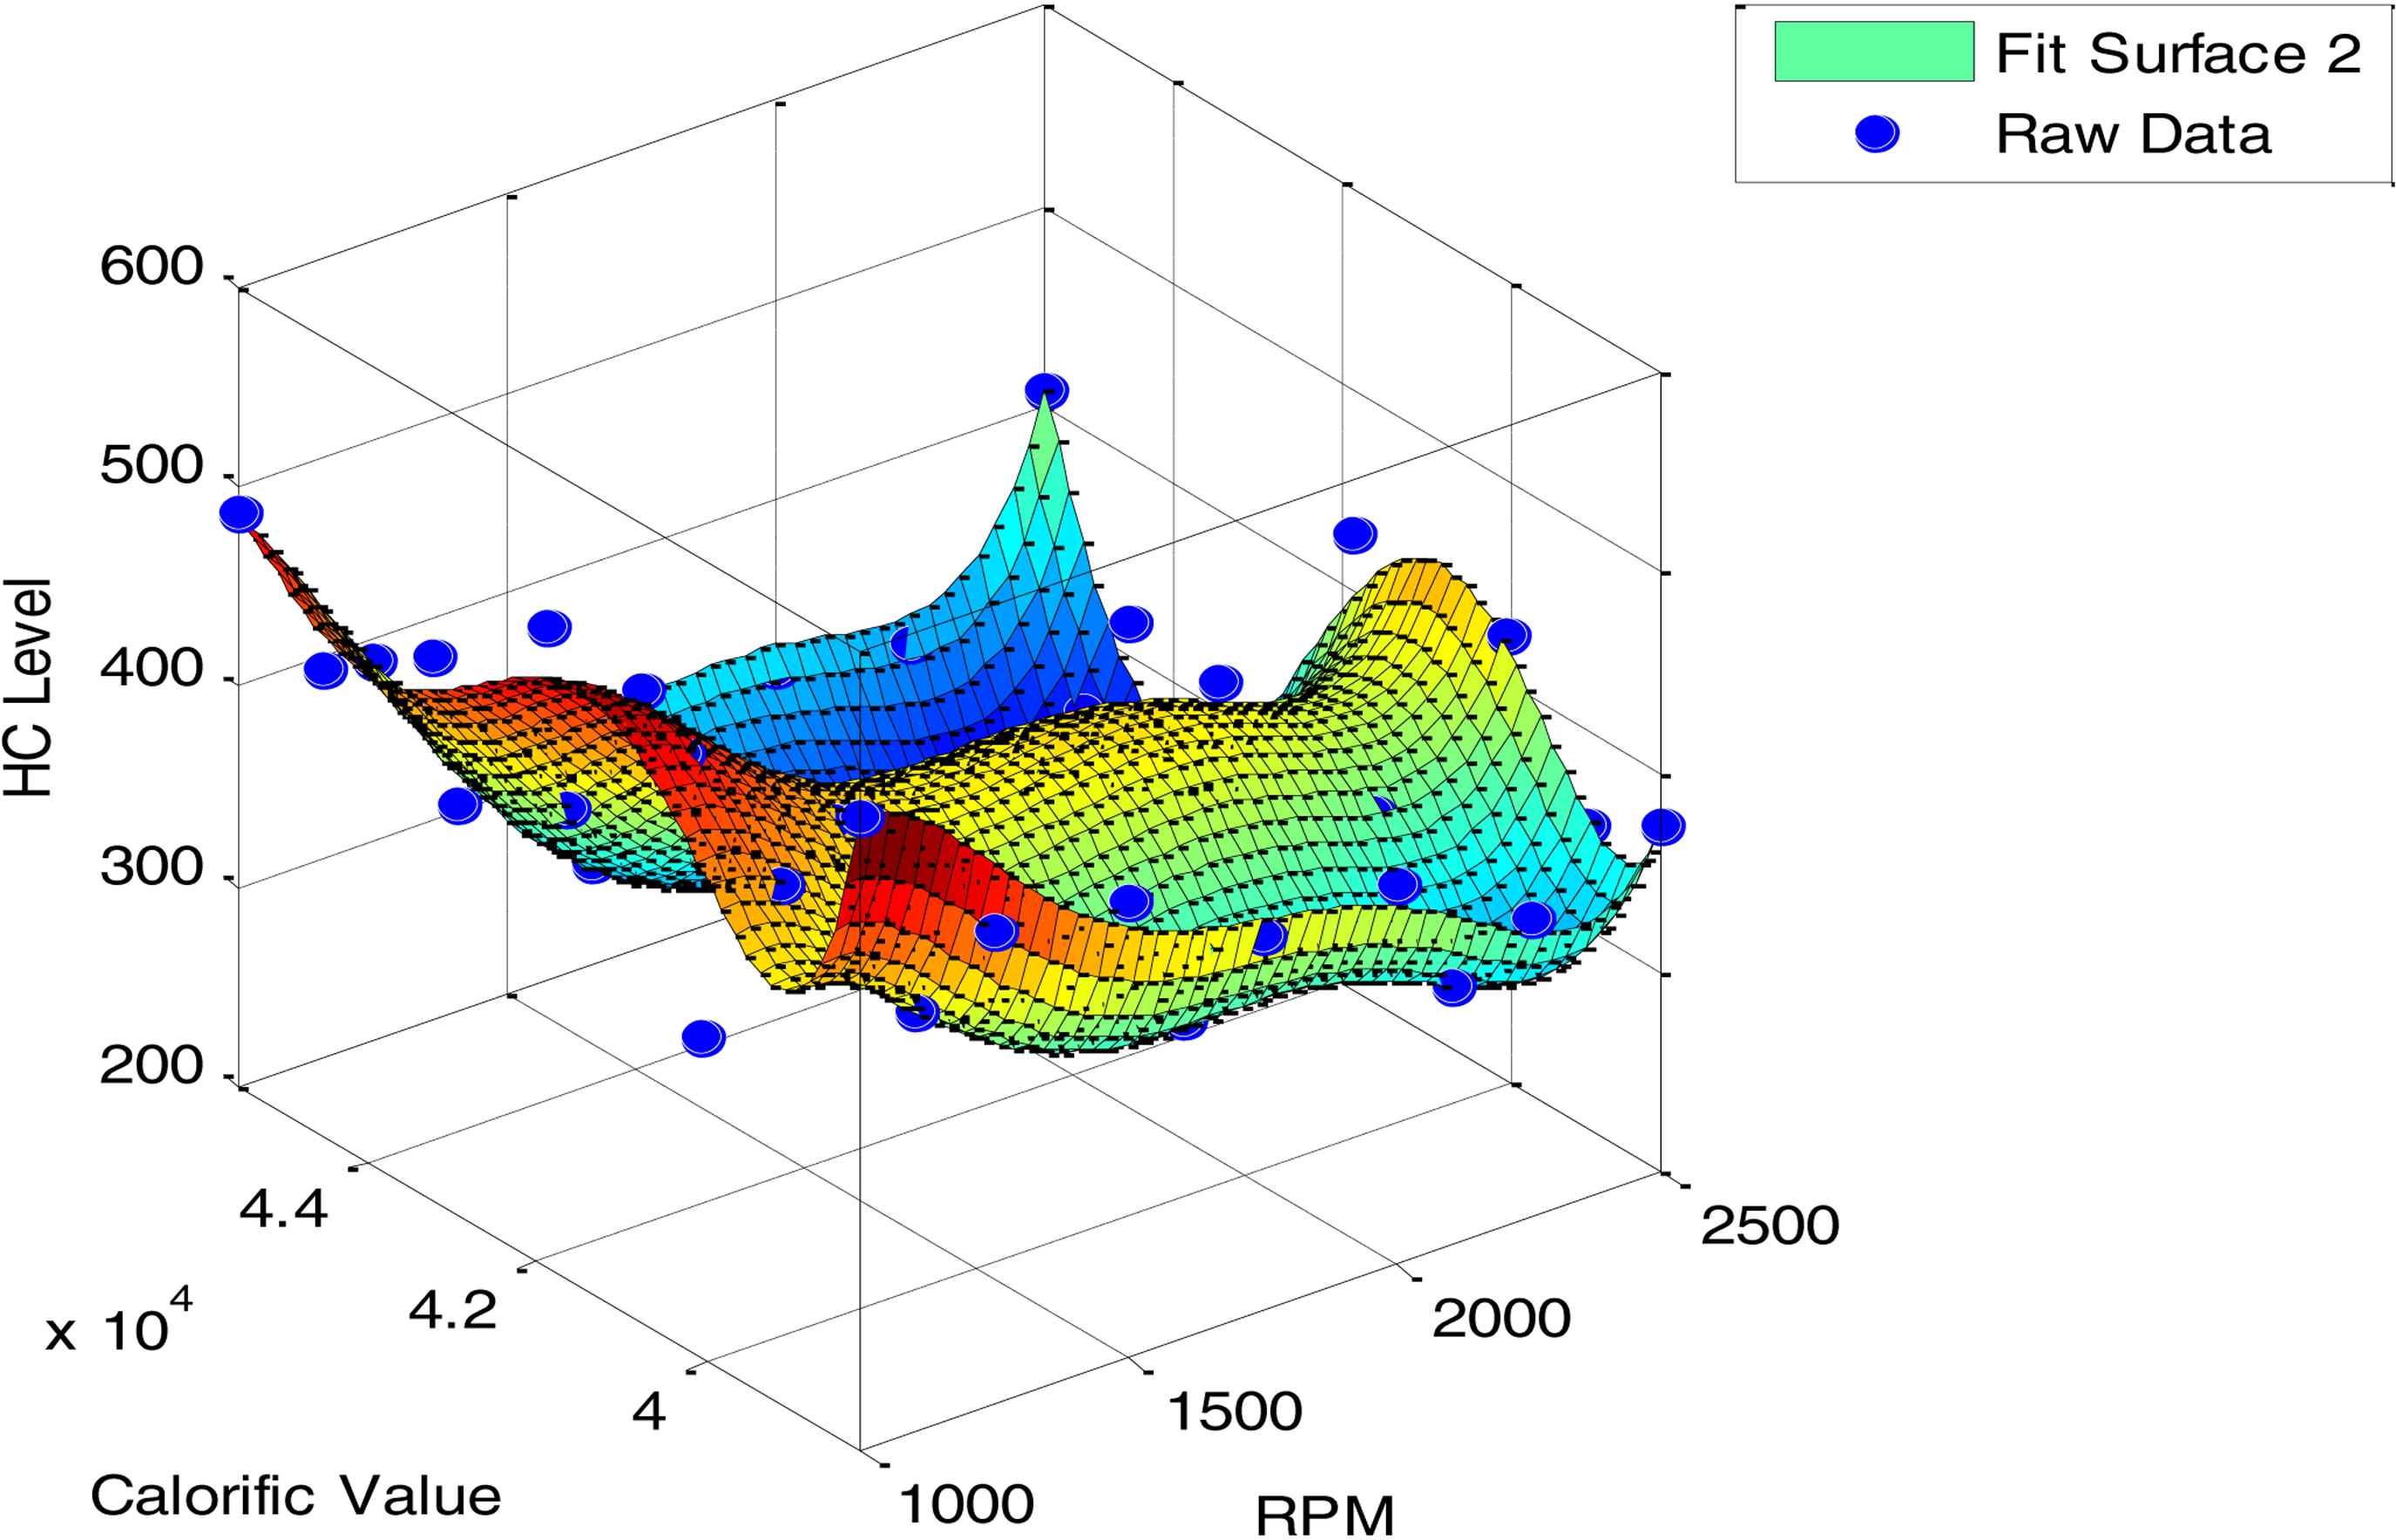
Layer 2 data fitted surface.
Once these patched surfaces are represented one can utilize the powerful search for optimum points using PSO method. The PSO will search the two layers’ spaces simultaneously for the minimum levels of CO and HC that satisfy the cost function depicted by equation (15). The PSO search is restricted to the ranges of the RPM and the Calorific value parameters. The search reveals that the point <1000, 41,463> results in an optimized operation with a cost function value of <33.1>. Finally, while searching normalized values of CO and HC must be used or the cost function weights must be selected carefully. In this example, we have used α = 30 and β = 1.
Figure 9 shows the PSO iterative search within the two layers’ surface spaces. A set of 100 Swarm Particles was used in the search. The speed of convergence is evident from the curve.

PSO converging iteration curve.
Conclusions
A technique that may be used to optimize experimental gathered data is presented, which could be used in resolving major challenges for scientists and engineers in finding optimum points. Systematic construction of the MLO scheme is derived and presented. Patched surfaces are used to capture the behavior of a collected experimental data. The overall surface is constructed from the patched pieces and a regional set of formulae are identified, which will be used for iterative evaluations of a cost function.
PSO algorithm was presented to locate a global optimum that fits a cost function within the constructed surfaces. The PSO algorithm searches the constructed multilayers solution spaces simultaneously and optimize through a user predefined cost function.
The novel technique was successfully applied over two sets of experimental data. SP-Lines were used to form 3D patches surfaces from the experimental data in multi-layer fashion and incorporated a multi-layer search using PSO. The proposed technique was illustrated and verified and showed its effectiveness using ANN.
Finally, this proposed novel technique for constructing experimental data surfaces and performing a search for an optimum may be used for complex data structures that possess lots of layers of data (i.e. multi-variable and multi-dimensional).
Footnotes
Declaration of conflicting interests
The author(s) declared no potential conflicts of interest with respect to the research, authorship, and/or publication of this article.
Funding
The author(s) received no financial support for the research, authorship and/or publication of this article.