
Abstract
The purpose of this study is to investigate whether mutations in key genes affect the prognosis of breast cancer patients, and base mutations is discussed by combining the physical properties of the electron–ion interaction pseudopotential. We study 994 breast cancer mutation samples, including 15,015 mutation genes, and use social network algorithm to screen key genes. In order to analyze the relationship between electron–ion interaction pseudopotential and mutation of key genes, this paper proposes the
Introduction
Breast cancer is a malignant disease with high incidence in women, accounting for 23% of all female cancer cases, and leads to 14% of cancer-related death in cases. 1 China used to be a low incidence country for breast cancer, however, owing to the changes of people’s eating habits, reproductive behaviors, and lifestyles, the risk of breast cancer is continuously increasing. 2 Data from cancer surveillance sites in Beijing, Shanghai, and Harbin have shown that the incidence of breast cancer is rising.3–5 The treatment of breast cancer is early detection and early treatment, and the sooner the discovery, the better the treatment. Previous studies have shown that synonymous codons have different efficiency in translation speed and folding accuracy. 6 Changes in single nucleotides lead to different codon usage, that will cause the protein’s translation efficiency, translation speed, and folding accuracy will all change. In the study, the DNA sequence is represented digitally by using the Electron–ion interaction pseudopotentials (EIIP) of the bases A, C, G, T. The EIIP value is given by Nair and Sreenadhan 7 , Rao and Swamy 8 . In past genetic mutation studies, gene expression profiles were commonly used, but gene expression profiles did not highlight changes in single base. Therefore, we use the physical properties of the base to calculate the changes of the base after mutation, and this study find out the correlation between base mutations and EIIP. Gene mutation types include base substitutions, frameshifts, insertions, and deletions. There are two main types of base substitutions: transition and transversion. Defining purine and purine, pyrimidine and pyrimidine mutations is called transition, the mutation between purines and pyrimidines is called transversion. And the ratio of transition and transversion is generally not equal, it is called “conversion bias”. 9
Materials and methods
Sources of materials
From the cBioportal database (http://www.cbioportal.org), we downloaded 1105 breast invasive cancer samples, including 994 mutant samples and 15,015 mutant genes.
Social network algorithm screen out key gene mutations
The concept of social network first came from the social field, mainly refers to the sum of the relationship between one person and others, and mainly studies the sparsity of relational connections. Since 1954, anthropologist Barnes first used social network analysis to study social structure. Until 1960, social network analysis was clearly defined as a methodology and developed rapidly in interdisciplinary fields, which was widely used in sociology, anthropology, economics, and psychology. 10 Barry, 11 a social network analyst, points out that social networks are huge networks of social relationships among groups. Currently, the mining of relational data12,13 has become one of the most popular research topics in data mining. Cancer is caused by gene mutations or some environmental factors. We studied 994 mutation samples, with a maximum of 3412 gene mutations or at least one gene mutation. In this study, the social network was constructed from the igraph package in R (https://www.r-project.org) with a total of 15,015 mutant genes in 994 samples. And using the spin-glass social classification function in social network algorithm to analyze the gene network. After a series of experiments, we find out that when center degree is 4000-8000, PIK3AC, TP53, CDH1 and GATA3 can be screened by the algorithm. When center degree is less than 4000, the screened genes increase gradually, and center degree reflects the importance of this node in the network. Therefore, this paper sets center degree of 4000 as an important segmentation point. And this study selects data without direction metrics, sets the background of the image to white and sets the node size as follows: if the gene with a center degree greater than 4000, the node size is set to 10. If the gene has a center degree less than 4000, the node size is set to 2. Therefore, as can be seen from Figure 1, PIK3CA, TP53, CDH1, and GATA3 are key gene mutations in breast cancer.
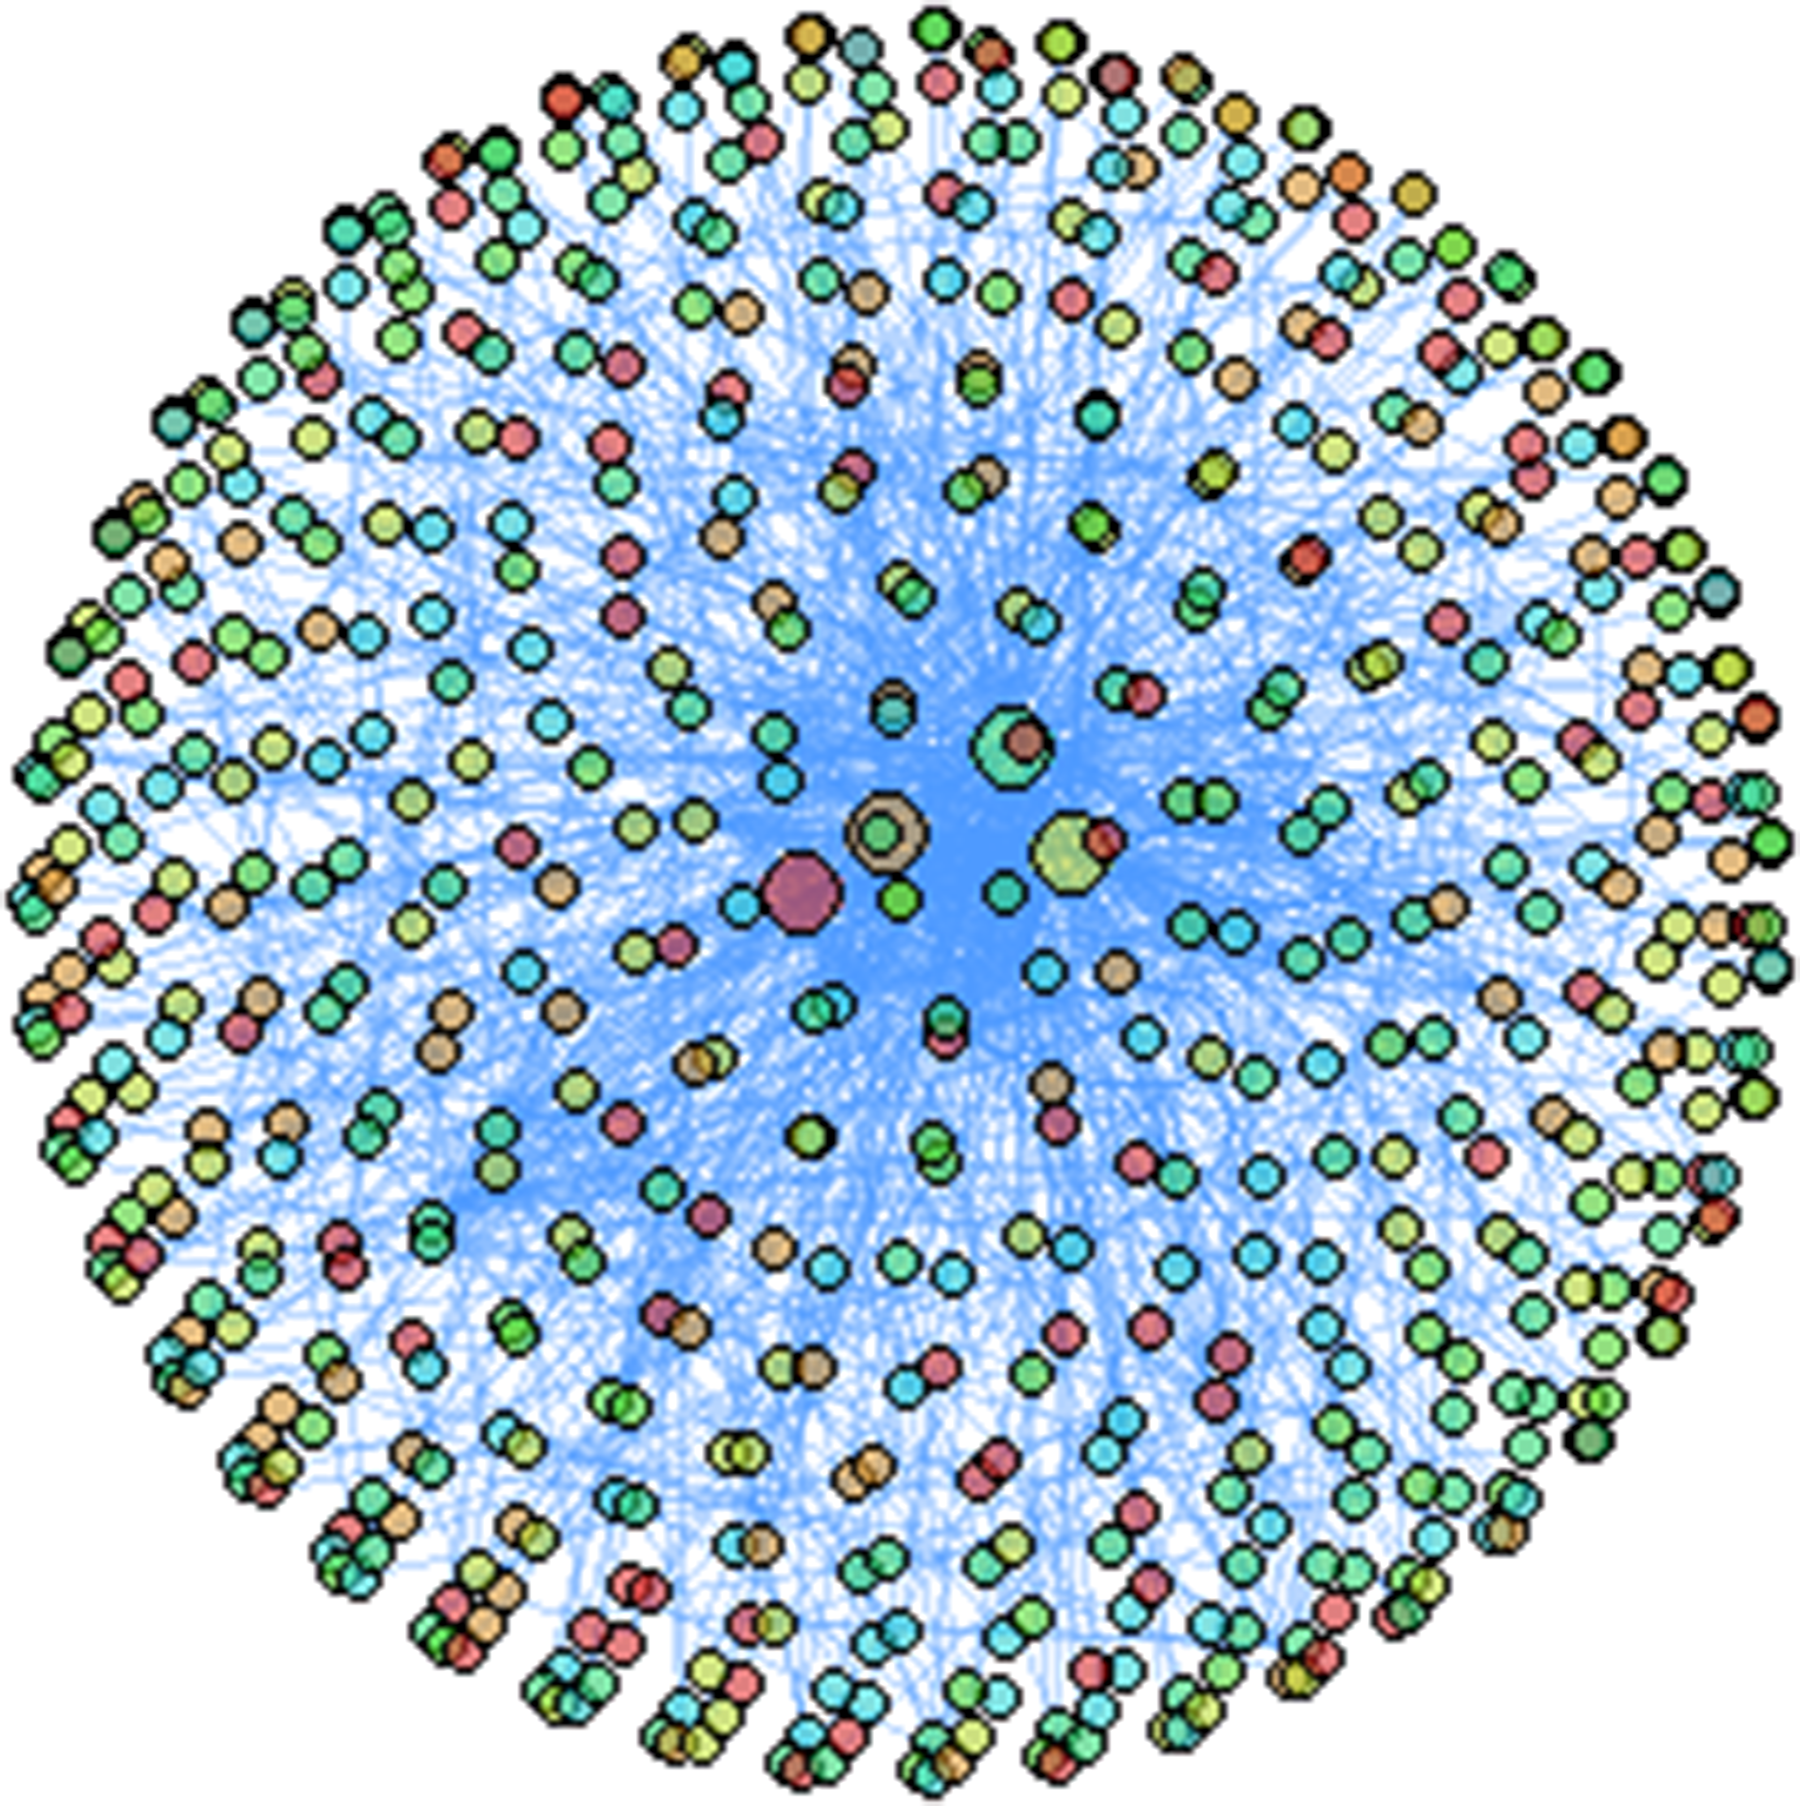
Social network algorithm screen out key gene mutations.
E difference value
With the development of bioinformatics, there are many ways to numerically map bases in a sequence. Such as Voss mapping, real number mapping, Z-curve mapping, and the mapping established by Yan and Zhu
14
:
Electron–ion interaction pseudopotential (EIIP) table.

The results of the above analysis show that PIK3CA, TP53, GATA3, and CDH1 are key gene mutations in breast cancer. Among the key gene mutations, the number of substitution mutations of single base A, C, G, and T was 213, 169, 252, and 71, respectively. Combined with Table 1, it can be seen that the EIIP value of T is the highest, whereas the number of T mutations is the lowest. And the EIIP value of G is the lowest, whereas the number of G mutations is the highest. To consider the correlation between base mutations and EIIP value, we propose the following 
To further understand the correlation between EIIP values and single base mutations, this study uses
Head map. (a)
Result
Differential gene expression
In MT Birgani’s
16
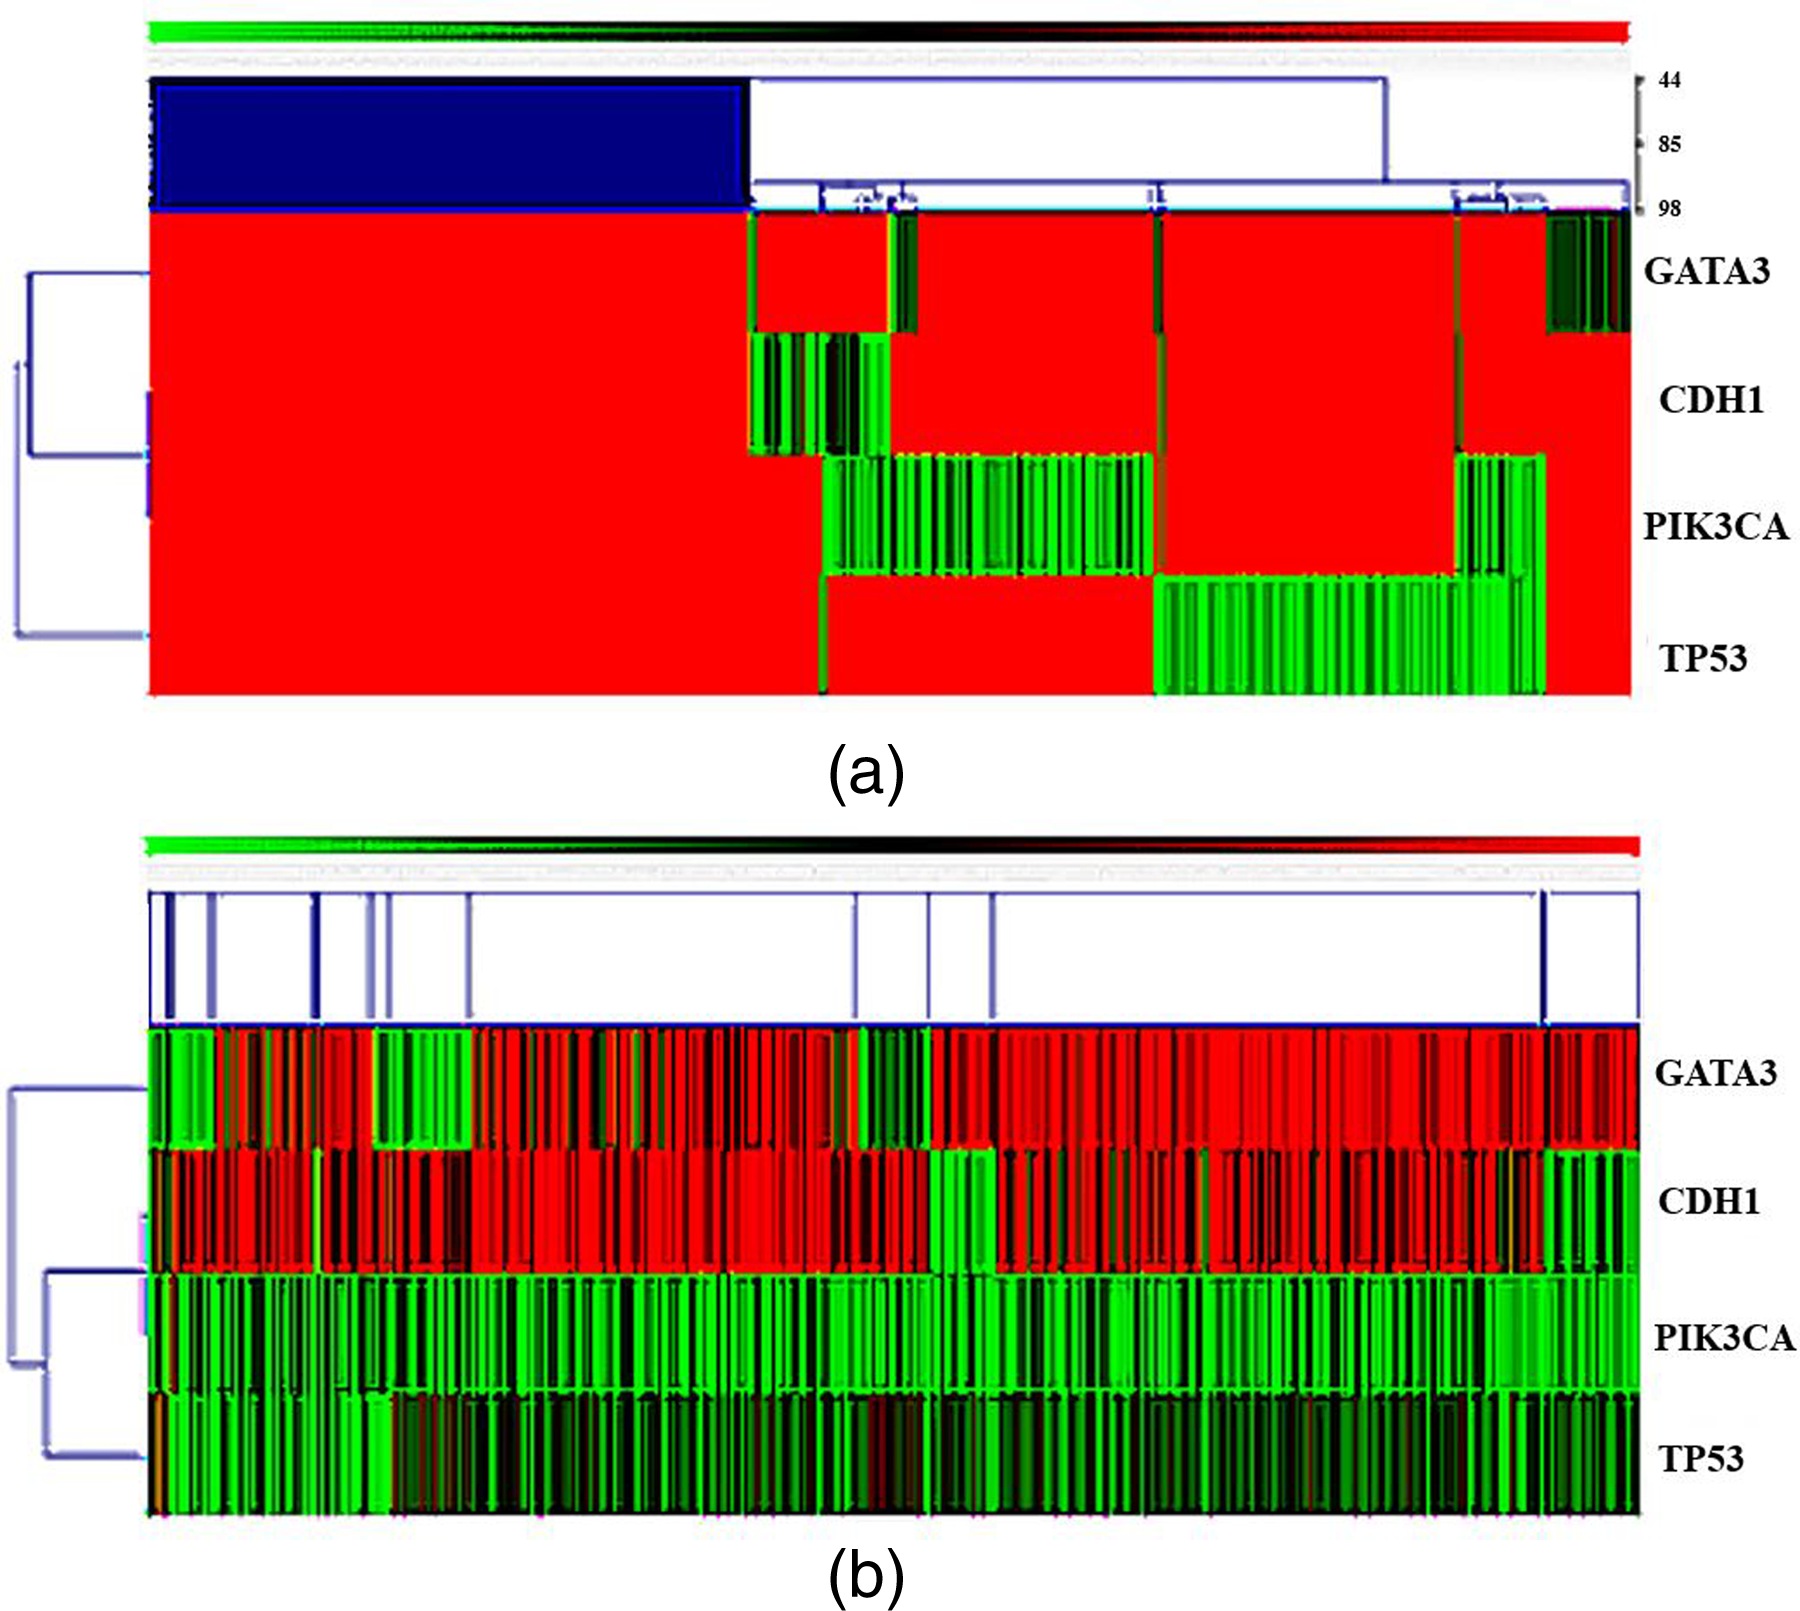
study on the genes mutation of liver cancer, by using mRNA expression level. In this study, we use Kendall’s Tau matrix and single linkage clustering methods to analyze differential expression of key genes in breast cancer samples, as shown in Figure 2(b). According to this figure, GATA3, CDH1 are highly expressed in breast cancer samples, PIK3CA, TP53 are low expressed in breast cancer samples. In breast cancer samples, Figure 2(a) mainly reflects the mutation of key genes. Figure 2(b) mainly reflects the expression of genes, which cannot reflect gene mutations. And in the study of gene mutation,
Survival analysis
To analyse the importance of PIK3CA, TP53, CDH1, and GATA3 in breast cancer, we used the Kaplan–Meier method for survival analysis and tested it with the Tarone-Ware method. As shown in Figure 3(a) to (c) where 0 indicates no mutation in key genes, 1 represents at least one gene mutation in key genes. After survival analysis, we found that TP53, GATA3-TP53, GATA3-PIK3CA-TP53 mutations have significant differences in survival rates for breast cancer patient, and P values were 0.022, 0.041, 0.04, respectively. Based on the above analysis, we conclude that there is a significant difference in survival rate of breast cancer patients with key gene mutations. And it has certain clinical significance for the prognosis of breast cancer patients.
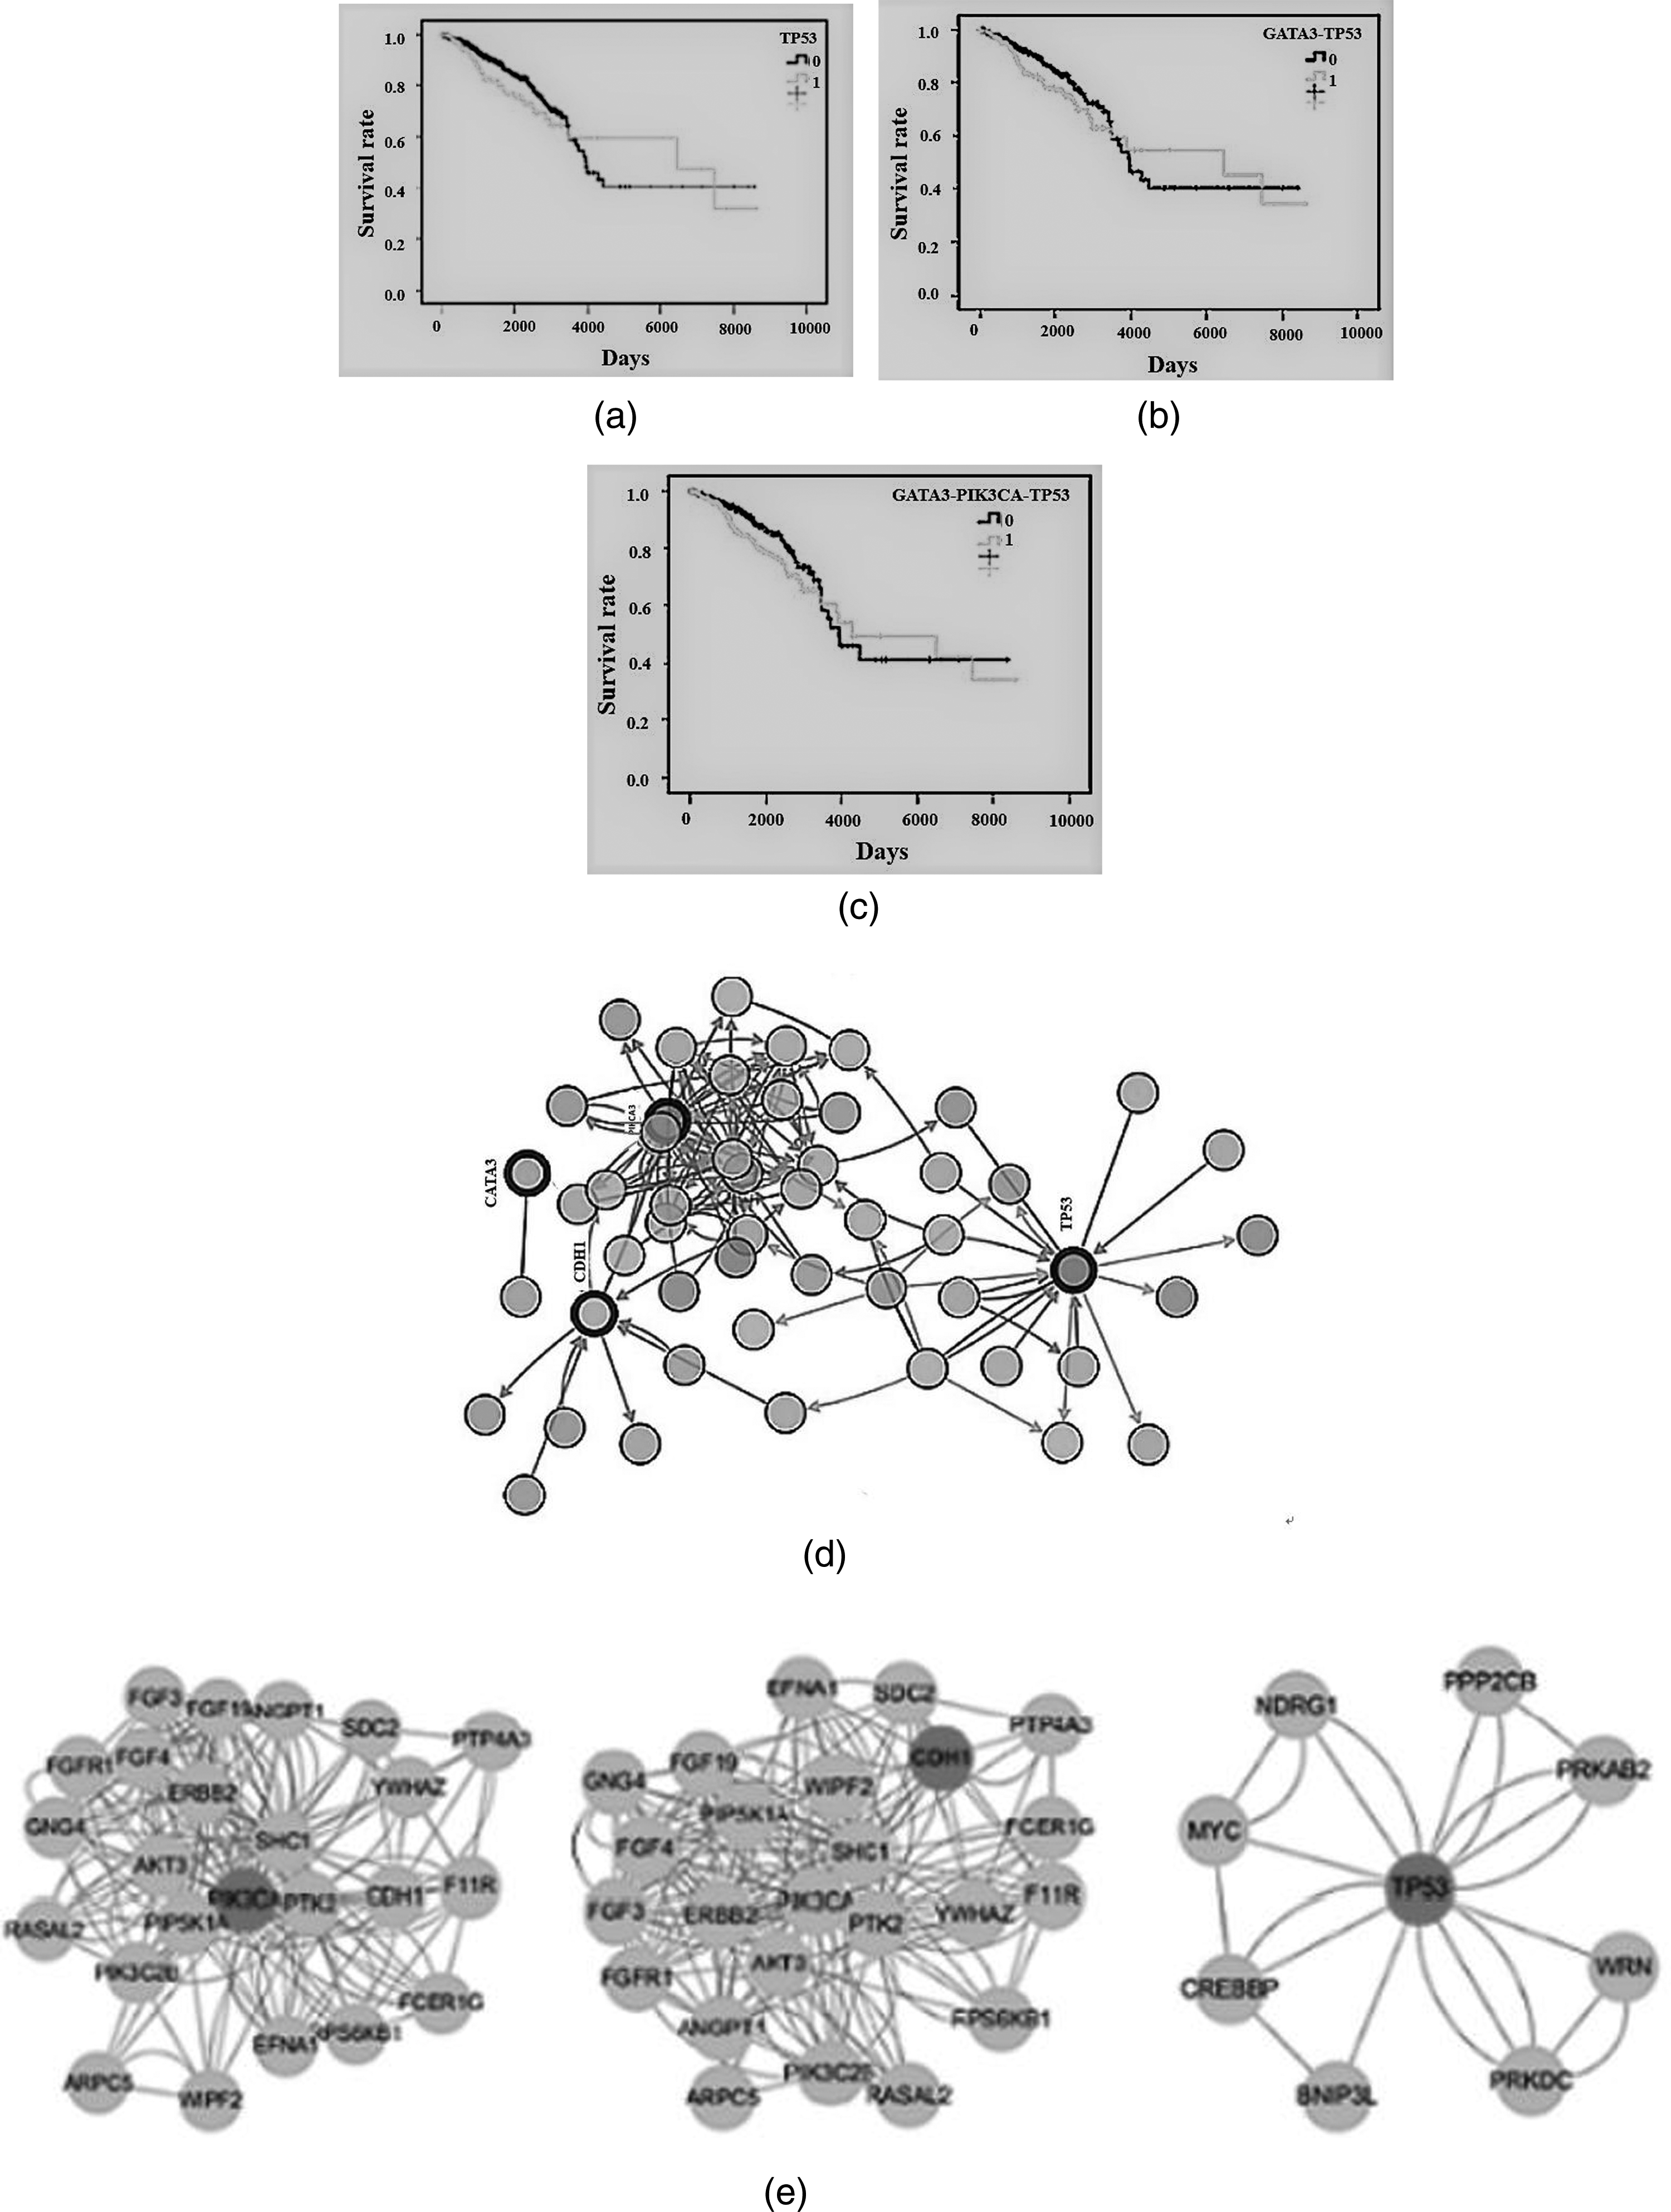
Survival analysis and protein–protein interaction network (PPI). (a)TP53 mutations survival analysis, (b) GATA3-TP53 mutations survival analysis, (c)GATA3-PIK3CA-TP53 mutations survival analysis, (d) PPI network, (e) modularize PPI.
Proteins often interact to form protein complexes, and driving protein function. So through the analysis of protein–protein interaction (PPI) network, key proteins can be found. Using PIK3CA, TP53, GATA3, and CDH1 as seed genes, the interaction genes were queried by cBioPortal database. PPI network in Figure 3(d) from cBioPortal database (http://www.cbioportal.org/).Then this paper use MCODE plug–in to modularize PPI, as shown in Figure 3(e). This analysis primarily helps us discover genes that are more closely linked in the PPI network. However, no genes were found to be more closely associated with GATA3.
KEGG pathway and GO enrichment analysis
In order to study the functional mechanism of 48 genes with the largest number of nodes (nodes
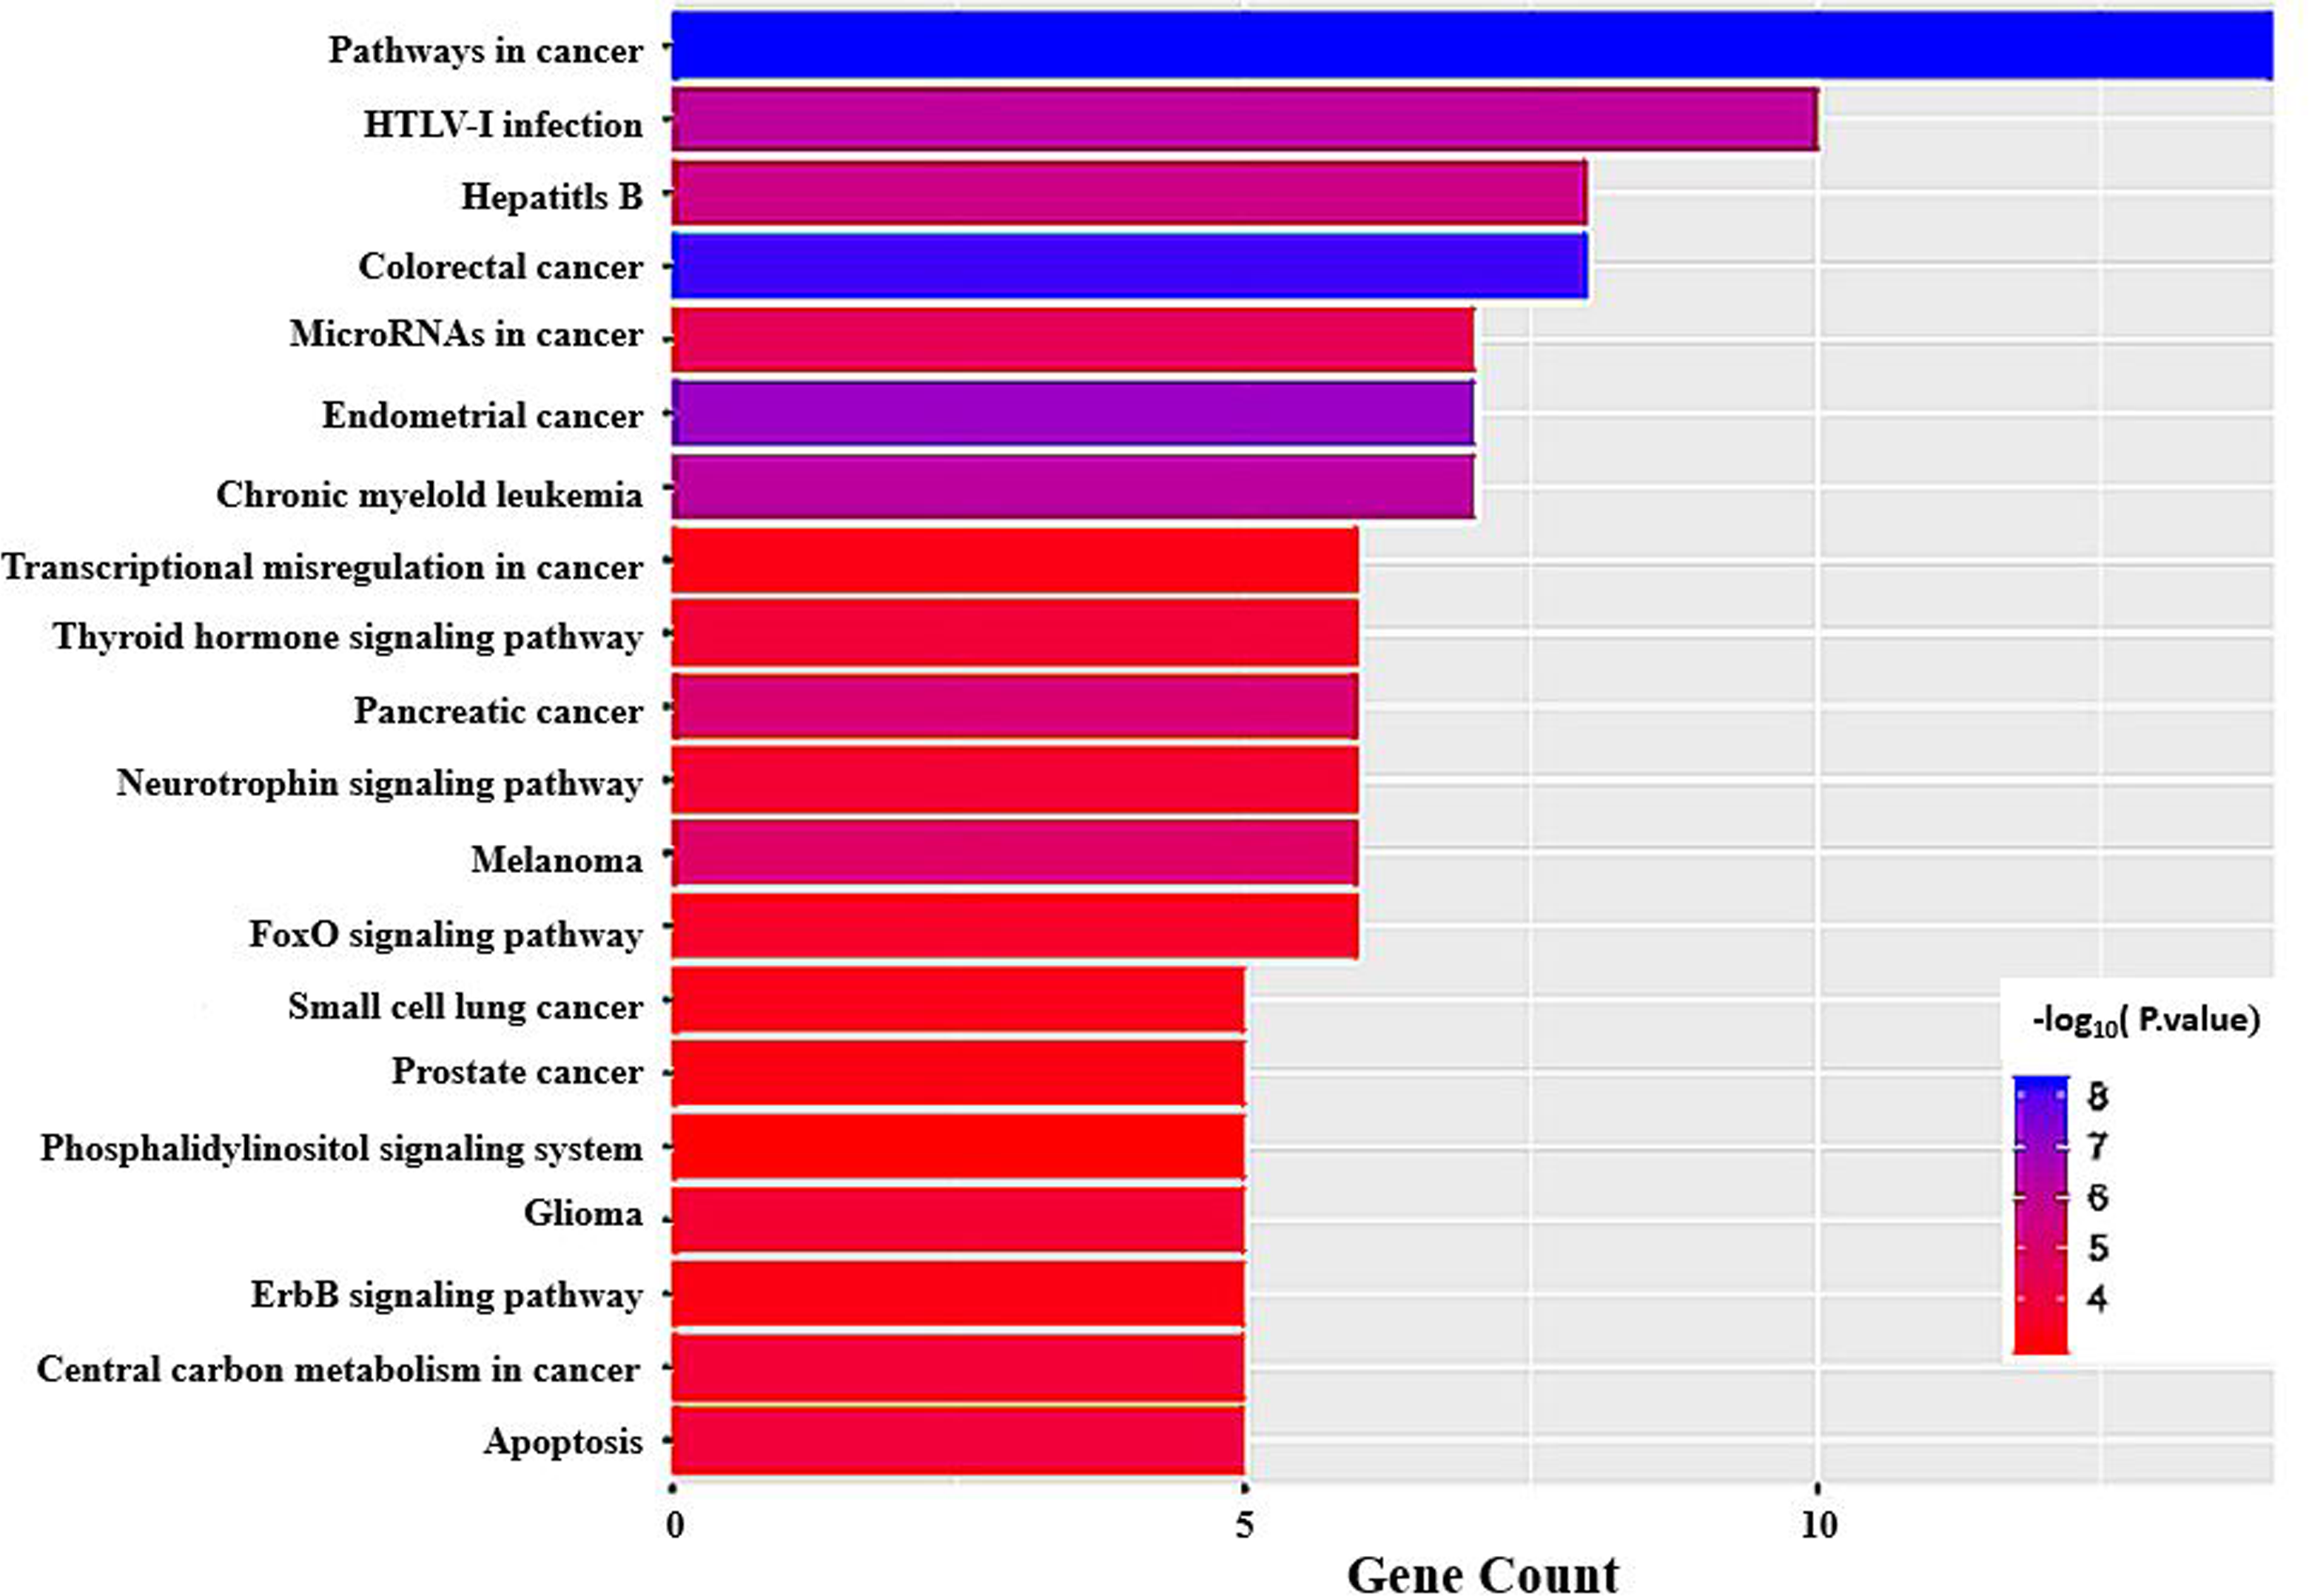
KEGG pathway analysis.
Enriched KEGG pathways and the corresponding target genes.

The biological significance of the 48 genes was analyzed using GO annotations at three levels biological process, molecular functions, and cellular component. The 48 genes were significantly enriched ( Gene ontology (GO) annotations, where MF is molecular function, CC is cellular composition, and BP is a biological process.
Distribution of key gene mutations in GO enrichment.

Conclusion
PIK3CA is an important signal transducer involved in cell proliferation, a large number of clinical studies and practical experience show that: patients with specific mutations of PIK3CA gene are resistant to EGFR and HER2 targeted drug therapy. In breast cancer patients, the mutation frequency of PIK3CA is as high as 30%, mutation of the gene may lead to disorder or activation of signaling pathway 17 .
P53 is a widely studied tumor suppressor gene, when mutated into TP53, the space conformation of P53 has changed, and its anti-cancer effect has also changed. 18 According to the latest data of TP53 mutation database WHO IARC TP53 http://www-p53.iarc.fr/, TP53 mutation rate was the highest in tonsillar and female genital tumors. 19
CDH1 (E-cadherin) is an important member of the cadherin family. Its abnormal expression reduces cell adhesion, makes cells easy to separate from surrounding tissues and is closely related to tumor protein metastasis.20–22. Some studies have found that CDH1 gene mutations are found in hereditary diffuse gastric cancer, ovarian cancer23,24.
GATA3 is one of GATA transcription factor families, also known as GATA binding protein 3, and it has an important function to form and maintain the differentiation of hemoglobin cells. 25 Studies have shown that GATA3 is highly expressed in breast cancer tissues and is associated with the occurrence, development, and prognosis of breast cancer.26,27
In the study of breast cancer, general considerations of gene expression, methylation, copy number variation,16,28 but changes in physical properties of EIIP caused by base mutations are not considered. In this study, key genes were screened from a large number of mutant genes in breast cancer by using social network algorithm. Most importantly, when studying gene mutation in cancer,
Footnotes
Acknowledgments
This work supported by the National Natural Science Foundation of China (Grant No. 11271163), Postgraduate Research & Practice Innovation Program of Jiangsu Provence (Grant No. KYCX18 _1865).
Declaration of conflicting interests
The authors declared no potential conflicts of interest with respect to the research, authorship, and/or publication of this article.
Funding
The authors received no financial support for the research, authorship, and/or publication of this article.
Endnote
This is a revised version of a paper, which named the Correlation analysis between PIK3CA, TP53, CDH1 genes mutations and breast cancer, published in the proceeding of the DCABES 2018 Conference. Special collection selected as Big Data and its Applications.