
Abstract
Medical image fusion can combine multi-modal images into an integrated higher-quality image, which can provide more comprehensive and accurate pathological information than individual image does. Traditional transform domain-based image fusion methods usually ignore the dependencies between coefficients and may lead to the inaccurate representation of source image. To improve the quality of fused image, a medical image fusion method based on the dependencies of quaternion wavelet transform coefficients is proposed. First, the source images are decomposed into low-frequency component and high-frequency component by quaternion wavelet transform. Then, a clarity evaluation index based on quaternion wavelet transform amplitude and phase is constructed and a contextual activity measure is designed. These measures are utilized to fuse the high-frequency coefficients and the choose-max fusion rule is applied to the low-frequency components. Finally, the fused image can be obtained by inverse quaternion wavelet transform. The experimental results on some brain multi-modal medical images demonstrate that the proposed method has achieved advanced fusion result.
Introduction
Different imaging technologies can capture different information of human body. Generally, magnetic resonance imaging (MRI) can well show normal and pathological soft tissue; however, its resolution is low and cannot reflect skeletal information. T1-magnetic resonance imaging (T1-MR) is sensitive to bleeding site and is able to provide more dissection tissue information of human body. Magnetic resonance angiography (MRA) imaging can display the structural information of narrow and closed blood vessels. Computed tomography (CT) imaging prefers to show dense tissue information, 1 which mainly reflects bone and other tissue information with high resolution. Due to the variation of imaging mode, how to integrate multi-modal images into a synthesized image is an interesting researching topic. Medical image fusion can combine important information among multi-modal images into a fused image, which provides more structure and texture and improves pathologic examination accuracy.
Existing image fusion methods can be divided into two categories: the spatial domain-based fusion methods and the transform domain-based methods. The spatial domain-based image fusion method directly fuses source images at the pixel level with overlapped image blocks; this operation might lead to spatial distortion. 2 The transform domain-based image fusion method usually transforms the source image into a transformed domain, in which some fusion rules are designed. With the development of multi-scale decomposition (MSD) theory, the MSD-based image fusion method has become a research hotspot. Yang 3 proposed a discrete wavelet transform (DWT)-based medical image fusion algorithm, which combines wavelet coefficients according to human visual system. Yan et al. 4 designed a dual-tree complex wavelet transform (DT-CWT)-based image fusion method that uses the neighborhood energy as activity measure to fuse high-frequency coefficients. He et al. 5 employed contourlet transform to decompose the source images into several bands, then average fusion rule was used for low-frequency coefficients, and regional variance information was selected as activity measure for high-frequency coefficients. Zhang and Guo 6 used non-subsampled contourlet transform as a MSD tool for image fusion; the high- and low-frequency coefficients are fused by the choose-max strategy and average strategy. The traditional MSD-based image fusion methods make use of the advantages of MSD tools to some extent, but there are still some shortcomings. On the one hand, these MSD tools have their own limitations. For instance, DWT lacks phase description of image; in addition, due to the use of down-sampling operation in the decomposition process, translation invariance is absent. It may produce artifacts or false information in the fused image. CWT has only one phase angle, so it cannot solve the deviation in the vertical and horizontal directions. On the other hand, the construction of activity measurement ignores the relationship between the coefficients and fails to make full use of the feature information transmitted by decomposition coefficients. Therefore, it is necessary to make improvement in the following aspects: selecting a more superior multi-scale image decomposition tool and selecting more expressive image features.
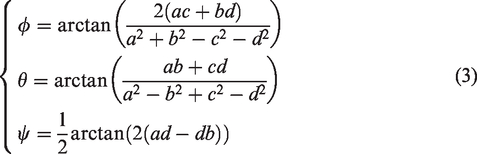
Quaternion wavelet transform (QWT) is achieved by a local quaternion Fourier transform (QFT). The QFT is composed of three imaginary part and one real part 7 : the first two phases can describe the vertical and horizontal displacement of image features, another phase can describe the diagonal texture information of the image, 8 and the amplitude has the characteristic of time-frequency localization and approximate translation invariance. In view of the superiority of QWT, many QWT-based image fusion methods have been proposed in the past few years. For example, Liu et al. 9 proposed a region level-based multi-focus image fusion method using QWT that can use the local variance of the phases and structural similarity to locate the focus region. Zheng et al. 10 constructed a quaternion wavelet contextual hidden Markov model to extract the statistical features for multi-focus image fusion. Thereafter, Chai et al. 11 employed multiple QWT features to get fused image. This method improved the fusion quality by overcoming the inaccurate description for image caused by a single feature. The QWT-based method can produce much better fusion performance due to the better image representation from amplitude and phase of QWT. Hence, we further explore QWT-based feature extraction and apply them to fuse multi-modal medical images. To improve the representation from the texture features of QWT high-frequency coefficients, a clarity evaluation index based on the gradient of the low-frequency amplitude, the phase of low frequency, and the phase of high frequency is proposed. Considering the dependence between QWT coefficients, a context-based rule is designed for fusing the high-frequency coefficients.
The remainder of this paper is organized as follows: the next section introduces the QWT. The main framework of the proposed method and the design of fusion rules are described in the “The proposed fusion method” section. Experimental results and analyses are shown in the “Experimental results and analyses” section. Finally, we conclude this paper in the “Conclusion” section.
Quaternion wavelet transform (QWT)
In this section, we first briefly review the QWT and discuss its structure, then give a demonstration to show its capability on brain image decomposition.
Quaternion theory
I The concept of quaternion and its application in image processing were well studied.7 Suppose that there is a quaternion

Another representation of quaternions is amplitude phase representation, which can be expressed as

Two-dimensional quaternion wavelet construction
The quaternions definition of an image f(x,y) can be expressed by the following formula


The following advantages of QWT transformation make it more suitable for the task of image fusion:
Time-frequency localizing characteristic. Because quaternion wavelet is evolved from wavelet, it also retains the special property of wavelet time-frequency localization. Approximate translation invariance. Because quaternion wavelet transformation uses the double tree structure in Hilbert transform pair, it has unique translation invariant characteristics compared with wavelet, shear wave, contour wave, and other decomposition tools. Multiple coefficient information. A QWT is equivalent to four real DWTs, so at different scales, QWT can provide three phases and one amplitude of the original image.
A T1-MR brain image (Figure 1) is taken as an example to illustrate the QWT decomposition in Figure 2.

Brain T1-MR image.

The QWT decomposition results of T1-MR brain image. (a) LL amplitude, (b) LL vertical phase, (c) LL horizontal phase, (d) LL diagonal phase, (e) LH amplitude, (f) LH vertical phase, (g) LH horizontal phase, (h) LH diagonal phase, (i) HL amplitude, (j) HL vertical phase, (k) HL horizontal phase, (l) HL diagonal phase, (m) HH amplitude, (n) HH vertical phase, (o) HH horizontal phase, and (p) HH diagonal phase.
As can be seen from Figure 2, we can find that three phases of image reflect the texture structure information in vertical, horizontal, and diagonal directions. The high-frequency sub-bands of QWT mainly reflect the outline and structure information of images. In the detail region, the corresponding amplitude is relatively large. On the contrary, in the smooth region, its corresponding amplitude is relatively small.
The proposed fusion method
As illustrated in Figure 3, the whole fusion process consists of four stages: decomposition with QWT, fusion on low-frequency coefficients and on high-frequency coefficients, respectively, inverse transformation with QWT on fused coefficients. The detailed steps are listed as follows:
Decompose the pre-registered paired image A and B into low-frequency sub-bands Fuse the low-frequency coefficients with choose-max fusion rule and get the fused low-frequency coefficients. Fuse the high-frequency coefficients with our proposed fusion rule and get the fused high-frequency coefficients. Combine the fused low-frequency coefficients and the fused high-frequency coefficients with QWT inverse transformation and get the fused image.

The framework of the proposed method. QWT: quaternion wavelet transform.
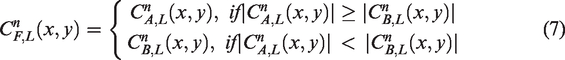
The fusion rule for low-frequency sub-band coefficients
The QWT low-frequency sub-band reflects the general shape of image which contains most of energy of the original image. The more prominent part can be preserved by formula (7)
The fusion rule for high-frequency sub-band coefficients
Generally, the high-frequency sub-bands obtained by QWT transformation reflect the detailed texture information of image. These detail information should be transmitted as much as possible to the fused image. In this section, we introduce an amplitude and phase-based clarity evaluation index, then the high-frequency sub-bands fusion rule based on this index and the contextual relationship of coefficients.
The clarity evaluation index based on amplitude and phase
To preserve the texture details in the high-frequency sub-bands as much as possible and identify the clarity of image, a clarity metric based on phase and amplitude is proposed. First, the gradient of the amplitude of the low-frequency sub-band in the horizontal, vertical, and diagonal directions is calculated, respectively. The gradient indicates the texture change of image in three directions. The horizontal, vertical, and diagonal texture changes are measured by the horizontal phase of LH sub-band, the vertical phase of HL sub-band, and the diagonal phase of HH sub-band. For fully expressing the texture feature of image, a clarity evaluation index based on the low-frequency amplitude and three directional phase information from high frequency and low frequency is designed as follows
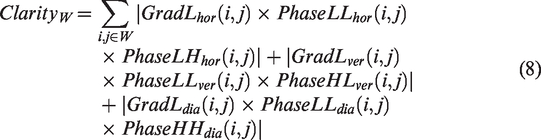
Let

The calculation process of
The contextual activity measure of high-frequency sub-band coefficient
The MSD coefficients are related with the adjacent scale and direction.10,12 The contextual relationship of QWT coefficients is shown in Figure 5. The left part is the coarser scale, and the right part is the finer scale in three directions. Let X be the current coefficient, NA and NB are the eight nearest adjacent coefficients, PX is the parent coefficient, and CX is the cousin. X and PX, X and NA, NB, X and CX describe the correlations between scales, within scales, and in directions, respectively.

The context relationship schematic diagram of QWT coefficients.
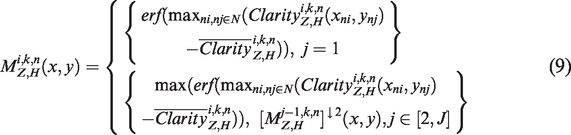
For simplicity, we only consider the neighborhood relationship and parent–child relationship in the QWT. The activity measure of high-frequency coefficient is given as formula (9), which is designed based on the contextual relationship and the clarity index


Curve graph of the erf function.
For the high-frequency coefficient with decomposition scale of 1, the contextual activity measure is calculated directly in combination with the clarity of its neighborhood coefficient. Otherwise, the calculation of activity measure should be considered the clarity of corresponding coefficient in the previous scale. Because the size of previous scale is different with the current scale, so a down-sampling operation is necessary. Then, compare the activity measure value of current coefficient with the parent coefficient, the larger clarity value is taken as the activity measure for fusion rule. Figure 7 describes the process in detail.

The calculation of active measure for high-frequency coefficient. QWT: quaternion wavelet transform.
After obtaining the activity measure of high-frequency coefficient, the fusion rule can be made as formula (11). The coefficient with the bigger activity measure value is taken as the fused high-frequency sub-band coefficient

Experimental results and analyses
In this section, the proposed fusion method is evaluated on four groups of medical images. All experiments are run on MATLAB R2015b of a PC (Pentium 3.5 GHz CPU, 8 GB RAM). Comparison of fusion methods include weighted average, 13 principal component analysis, 14 DWT, 3 gradient pyramid transformation, 15 contrast pyramid (CON), 16 Q-CHMM, 10 and QWT-Avg-Max. 17 The parameters of the comparison method are set according to the corresponding references. In addition, the objective evaluation metrics include standard deviation, entropy, average gradient (AG), spatial frequency (SF), mutual information (MI), and edge information evaluation factor (Qabf). 18
Medical image fusion experiments on MRI–CT
Figure 8(a) and (b) shows a pair of pre-registered MRI and CT brain images. Their fusion results are shown in Figure 8(c) to (j) and the objective evaluation indexes are listed in Table 1, where the bold value indicates the best winner. As can be seen from Table 1, our proposed method wins on most metrics except on SF and MI. Figure 8(g) obtained by the CON method wins on SF metric; the reason is that the missing brightness information of MRI image leads to large grayscale variation. Figure 8(d) is almost completely similar to MRI images; few components of CT image are introduced into the fused image. Figure 8(c) and (i) loses many important detail information of the original image. Figure 8(e) and (f) loses some texture of the MRI image and results in the dark fused images. Many details of MRI image are lost in Figure 8(h). Figure 8(j) shows the fusion result of the proposed method. The fused image holds most information of the original images; the brightness and the contrast of original images are well preserved. Thus, the proposed method achieves better result in both subjective effect and objective evaluation.
(a) and (b) MRI–CT medical images and their fusion results: (c) AVG, (d) PCA, (e) DWT, (f) GRA, (g) CON, (h) Q-CHMM, (i) QWT-Avg-Max, and (j) proposed.
The objective evaluation indexes of fusion results of the MRI-CT medical image.

AG: average gradient; AVG: weighted average; CON: contrast pyramid; EN: entropy; GRA: gradient pyramid transformation; MI: mutual information; PCA: principal component analysis; Q-CHMM: quaternion wavelet contextual hidden Markov model; QWT: quaternion wavelet transform; SF: spatial frequency; STD: standard deviation. The bold value indicates the best result.
Medical image fusion experiments on the first group of T1-MR and MRA
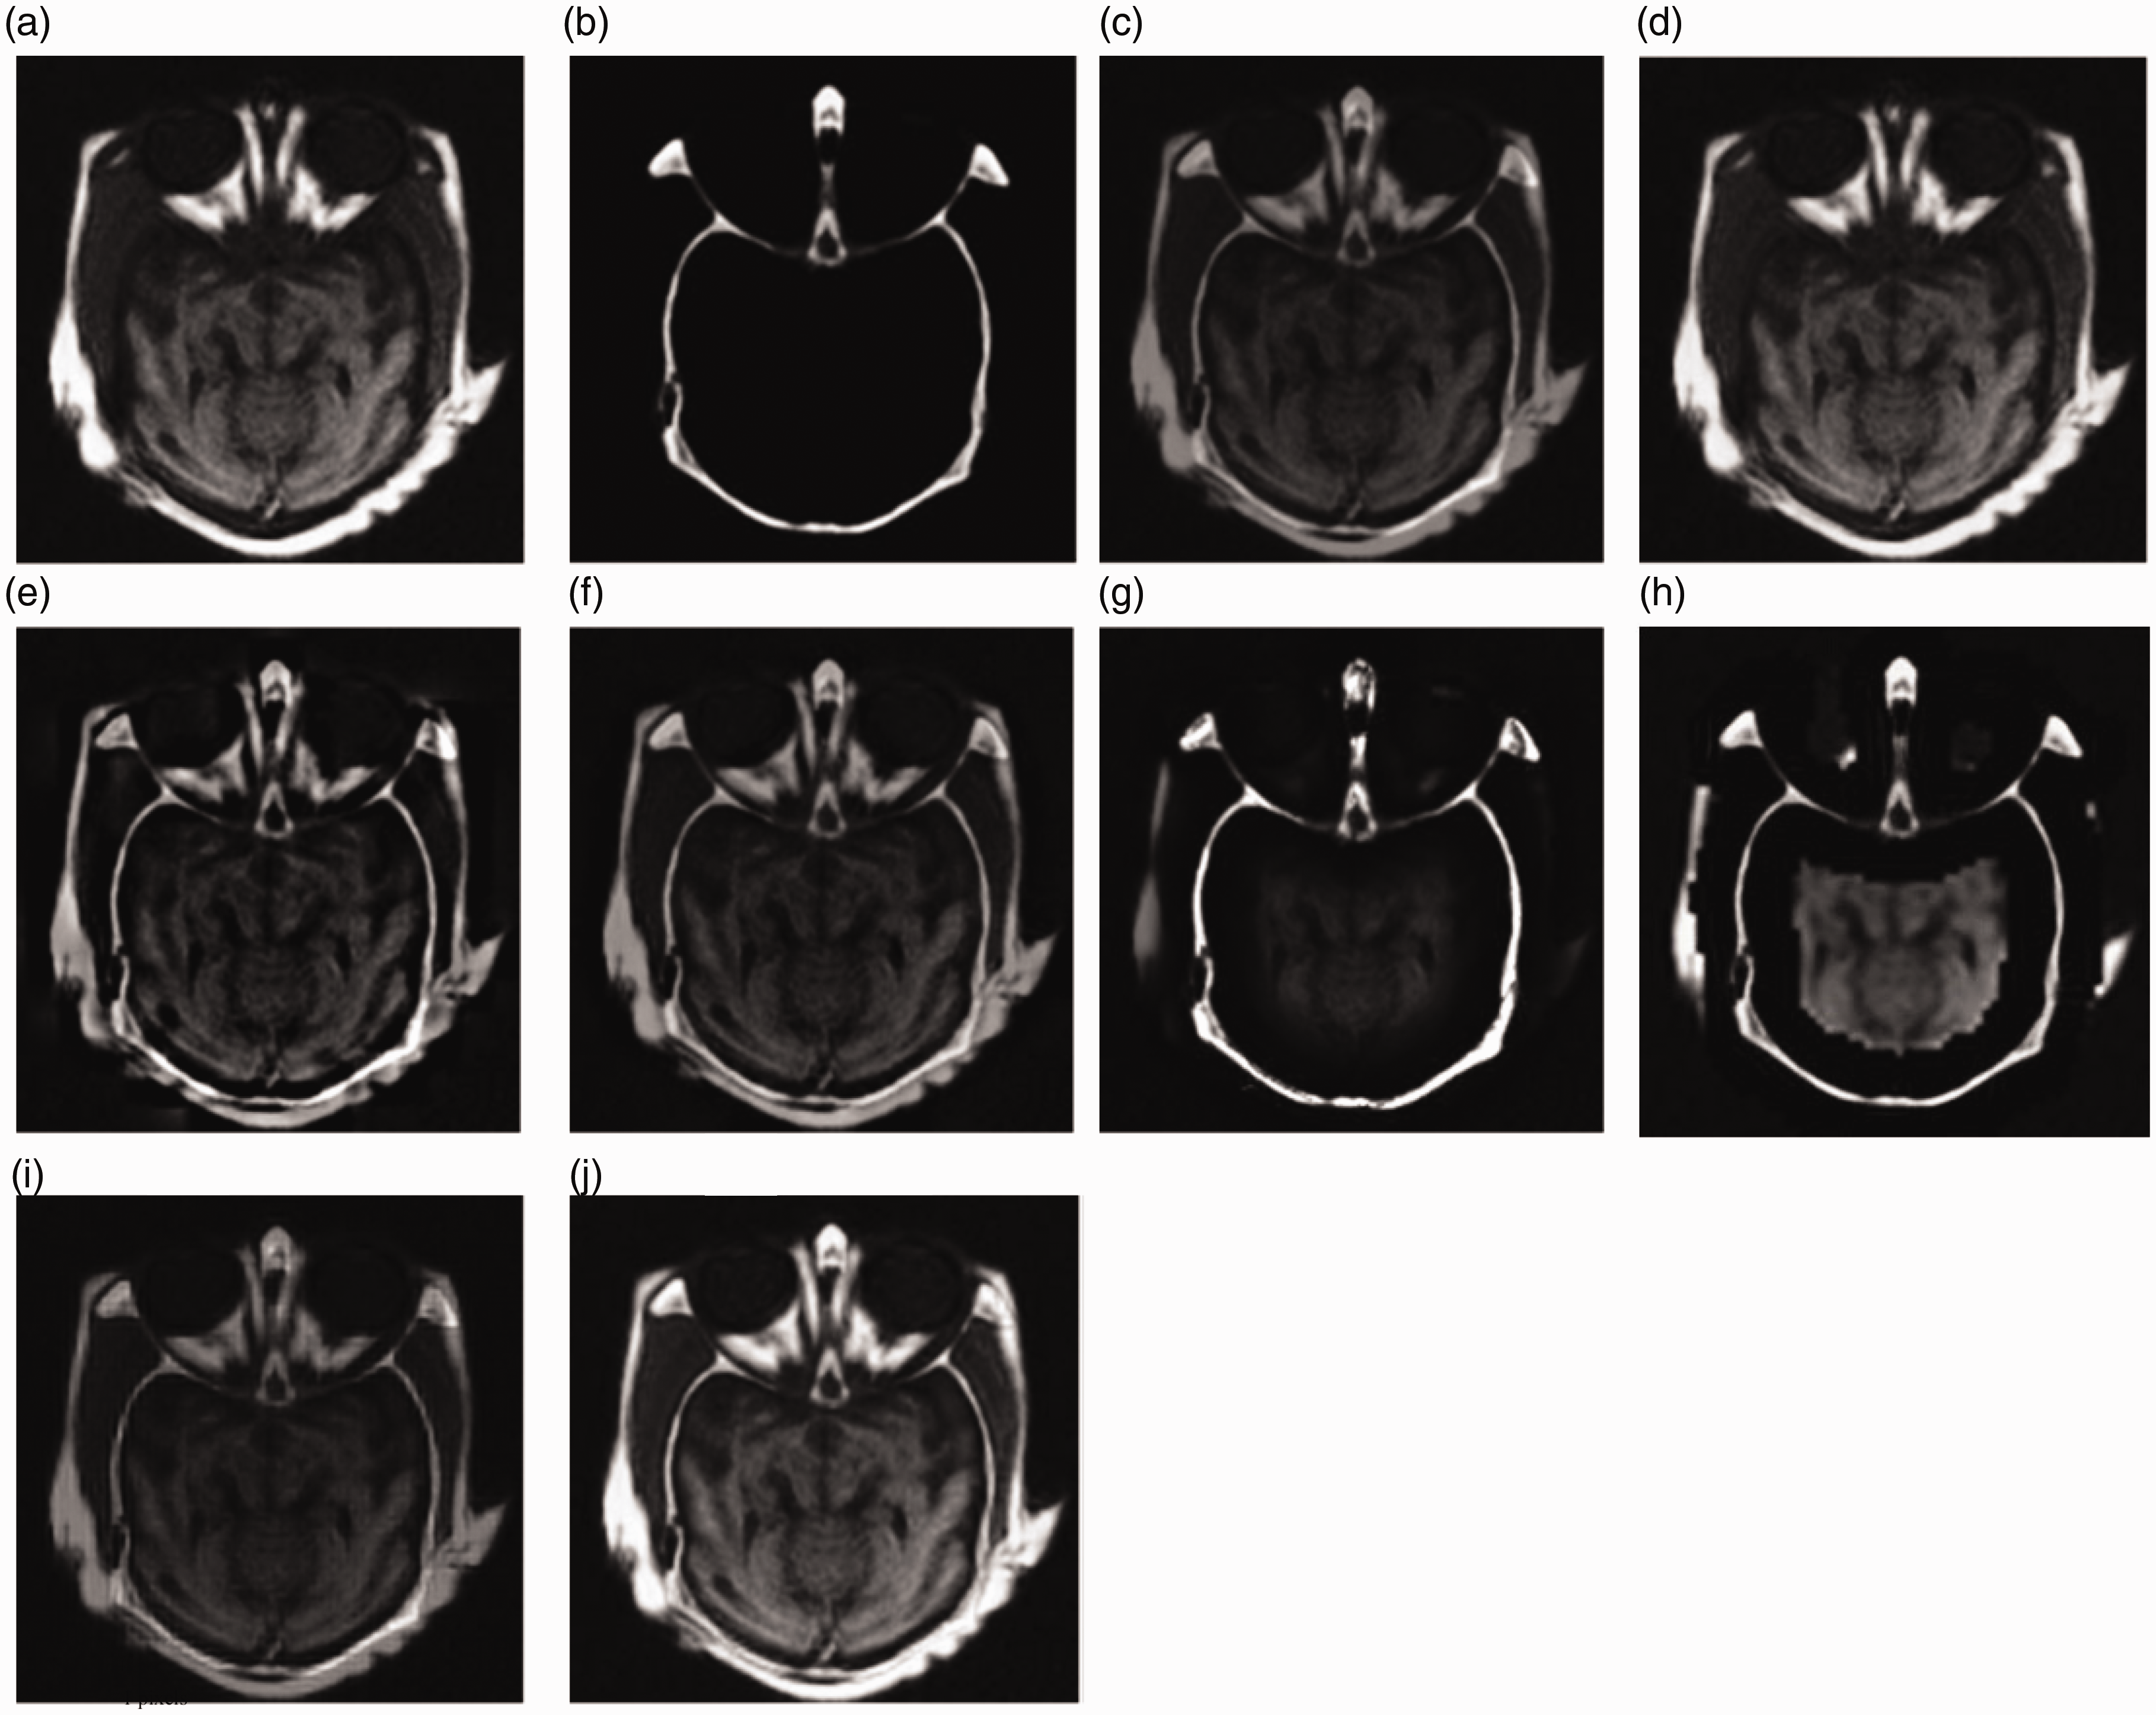
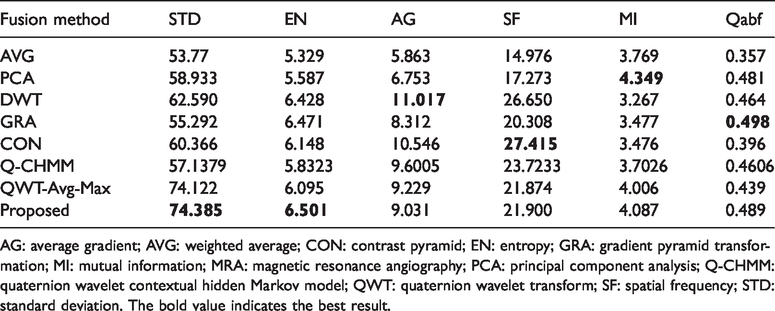
T1-MR and MRA images are shown in Figure 9(a) and (b). Figure 9(c) to (i) shows the fused image obtained by the comparison methods and the proposed method. Table 2 lists the objective evaluation indexes. It is obvious that Figure 9(c) has a low contrast. MI and Qabf represent the correlation between the fusion image and the original image. These two indexes get the best values because Figure 9(d) biases toward T1-MR image. Figure 9(e) preserves lots of useful information from source images, but some detail information within the T1-MR image outline is lost. In addition, Figure 9(e) to (g) is dark and has low contrast. The visual effect of Figure 9(h) is poor. Lots of detail information are lost such as the crooked outlines in the left part of the MRA image in Figure 9(i). Figure 9(j) obtained by the proposed method has the best subjective effect and optimal object indexes.

The fusion results of medical image (a) T1-MR and (b) MRA and the fused results based on various methods: (c) AVG, (d) PCA, (e) DWT, (f) GRA, (g) CON, (h) Q-CHMM, (i) QWT-Avg-Max, and (j) proposed.
The objective evaluation indexes of fusion results of the first group of T1-MR and MRA medical image.

AG: average gradient; AVG: weighted average; CON: contrast pyramid; EN: entropy; GRA: gradient pyramid transformation; MI: mutual information; MRA: magnetic resonance angiography; PCA: principal component analysis; Q-CHMM: quaternion wavelet contextual hidden Markov model; QWT: quaternion wavelet transform; SF: spatial frequency; STD: standard deviation. The bold value indicates the best result.
Medical image fusion experiments on the second group of T1-MR and MRA
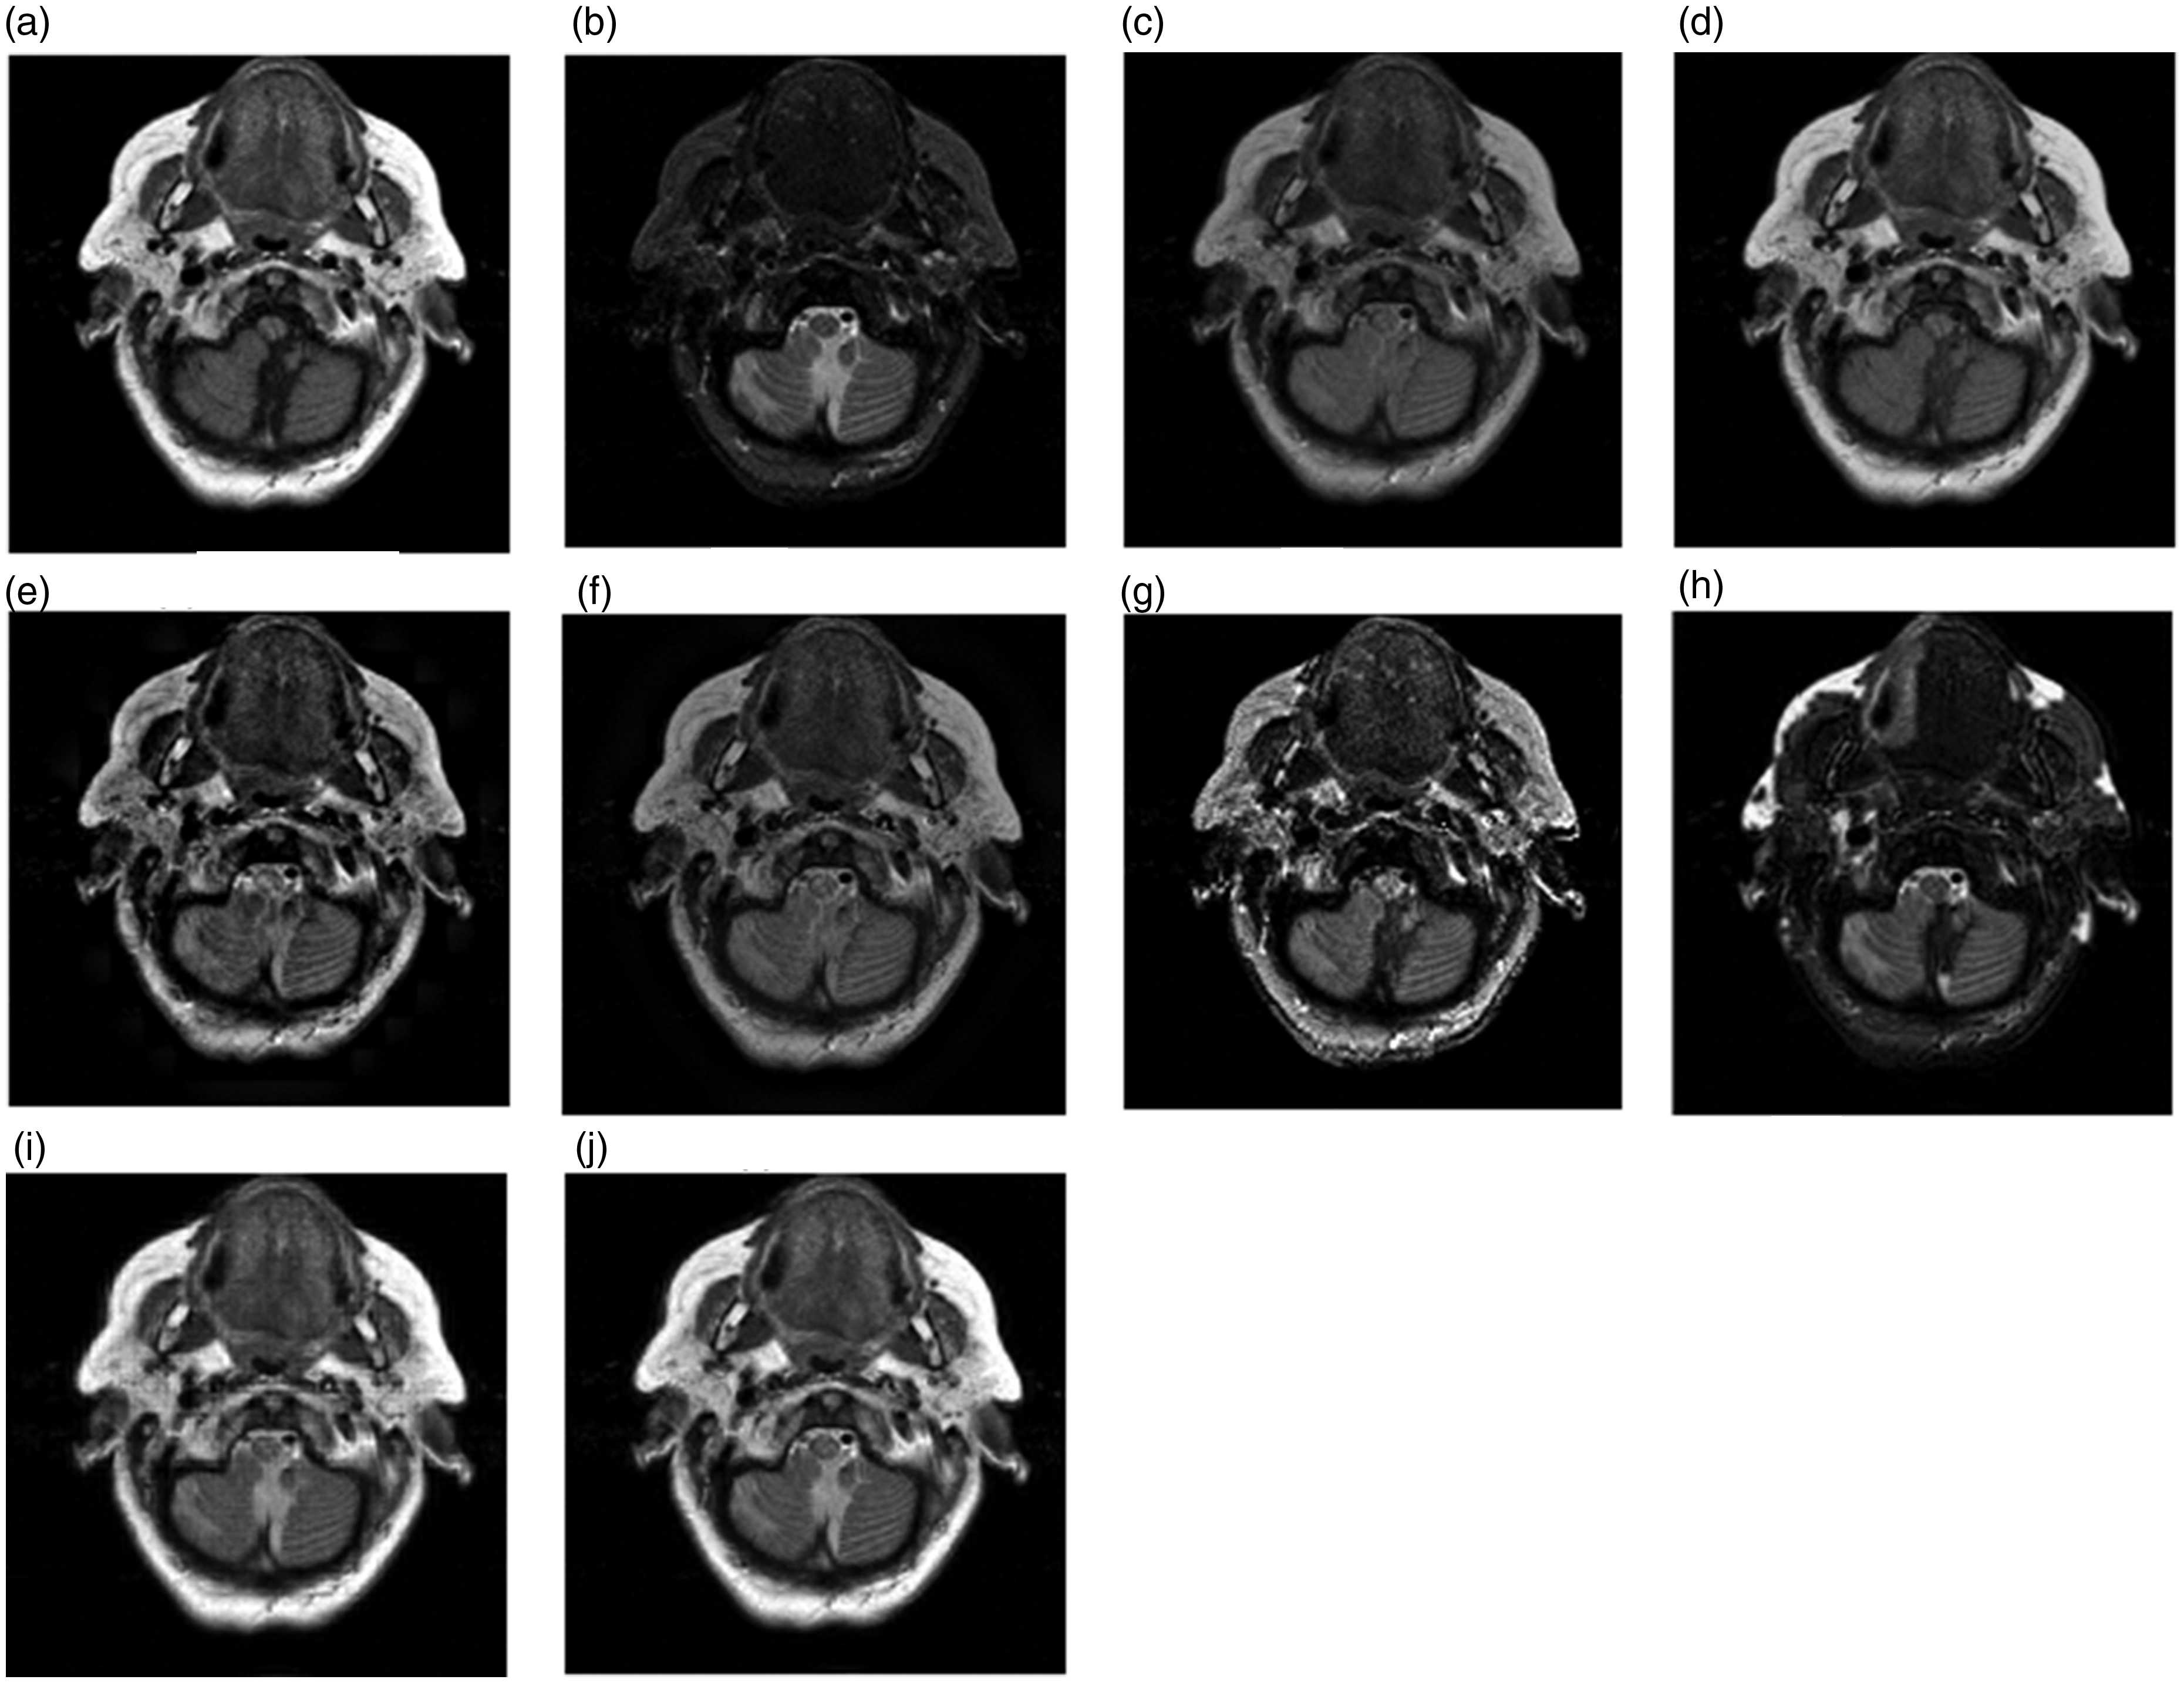
Figure 10(a) and (b) shows the second group T1-MR and MRA medical images, which contain more complex tissues. Their fusion results are shown in Figure 10(c) to (i) and their corresponding objective evaluation indexes are listed in Table 3. As can be seen from Figure 10, Figure 10(c) and (d) loses many texture details. Figure 10(e) is not as smooth and clear as the T1-MR image. Figure 10(f) loses some outline information of T1-MR image and the brightness information of MRA image. The outline information in Figure 10(g) is almost lost, such as the white line in the right side of the T1-MR image and the outline in the left side of MRA image. The grayscale of Figure 10(h) is unbalanced. Figure 10(i) contains some of useful information of two original images, but some details of MRA image are lost. Figure 10(j) preserves the outline, details, and useful features of the original images, as well as brightness and contrast, without information loss or false information. The object indexes of Figure 10(j) are consistent with subjective perception.

The fusion results of the second group of (a) T1-MR and (b) MRA medical image and the fused results based on various methods: (c) AVG, (d) PCA, (e) DWT, (f) GRA, (g) CON, (h) Q-CHMM, (i) QWT-Avg-Max and (j) proposed.
The objective evaluation indexes of fusion results of the second group of T1-MR and MRA medical image.
AG: average gradient; AVG: weighted average; CON: contrast pyramid; EN: entropy; GRA: gradient pyramid transformation; MI: mutual information; MRA: magnetic resonance angiography; PCA: principal component analysis; Q-CHMM: quaternion wavelet contextual hidden Markov model; QWT: quaternion wavelet transform; SF: spatial frequency; STD: standard deviation. The bold value indicates the best result.
Medical image fusion experiments on the third group of T1-MR and MRA
Figure 11(a) and (b) holds more complex tissue structure and texture. Their fused results are shown in Figure 11(c) to (i) and their objective evaluation indexes are listed in Table 4. Figure 11(c) seriously loses the texture details information and outline information of the original images and has low contrast, as a result, its all objective indexes are small. Figure 11(d) is excessively biased toward T1-MR images and the MI and Qabf indexes of Figure 11(d) achieve the maximum values. Figure 11(e) not only has low contrast but also loses some details information, such as the two circular areas in the MRA image. Figure 11(f) is dark and blurred, and the objective evaluation indexes conform to the subjective perception. Figure 11(g) is unsmooth because of noise, which causes the AG and SF indexes win the best values. Figure 11(h) loses lots of useful information existing in source images. Figure 11(i) is blurred because it loses some small details. Due to adopting the QWT transform tool and considering the correlation between QWT coefficients, the proposed method gets the best subject perception and objective evaluation values.
The fusion results of the third group of (a) T1-MR and (b) MRA medical image and the fused results based on various methods: (c) AVG, (d) PCA, (e) DWT, (f) GRA, (g) CON, (h) Q-CHMM, (i) QWT-Avg-Max and (j) proposed.
The objective evaluation indexes of fusion results of the third group of T1-MR and MRA medical image.

AG: average gradient; AVG: weighted average; CON: contrast pyramid; EN: entropy; GRA: gradient pyramid transformation; MI: mutual information; MRA: magnetic resonance angiography; PCA: principal component analysis; Q-CHMM: quaternion wavelet contextual hidden Markov model; QWT: quaternion wavelet transform; SF: spatial frequency; STD: standard deviation. The bold value indicates the best result.
Conclusion
A novel medical image fusion method based on QWT has been proposed. The QWT can decompose a medical image into richer low-frequency coefficients and high-frequency coefficients. The absolute value choose-max fusion rule was adopted to fuse the low-frequency coefficients. In addition, a clarity metric based on amplitude and phase was proposed. We have also built a novel activity measure based on the proposed clarity metric and the correlation between QWT coefficients for the high-frequency coefficients. Experimental results demonstrate that the fused medical images obtained by the proposed method preserve the important contour and texture details of the original images. Four groups of experiments on various multi-modal medical images show that the proposed method can achieve superior fusion quality in terms of both visual perception and objective evaluation.
Declaration of Conflicting Interests
The author(s) declared no potential conflicts of interest with respect to the research, authorship, and/or publication of this article.
Funding
The author(s) disclosed receipt of the following financial support for the research, authorship, and/or publication of this article: This work was supported in part by the National Natural Science Foundation of China under Grant 61772237, in part by the Six Talent Peaks Project in Jiangsu Province under grant XYDXX-030 and in part by the Foundation for basic research of central universities under Grant JUSRP51618B.