
Abstract
The energy shortage problem cannot be ignored in the development of economics. A demand-side smart energy network is introduced in this paper, which integrates renewable energy resources, energy storage devices, and various types of load into an autonomous distributed architecture. Our approach employs the internet, Internet of Things (IoT), data mining, and other advanced technologies. The network aims to share energy information to realize distributed smart energy management, which can, for example, save energy while ensuring the reliability and quality of electricity for customers. Based on the network, a series of smart energy management theories are proposed to support the smart energy network. The core idea of these theories is to allow the network to teach itself in order to learn from the massive amounts of collected energy data, by using machine learning algorithms. The concept of power utility is proposed to quantitatively assess load energy efficiency. Then, a data-driven consumer energy activity recognition method is proposed based on a hidden Markov model (HMM). A test system is generated using field data from a pilot project in Guangdong Province, China. The energy saving rate in our test is 37.9%, which means that the smart energy network and the proposed algorithms perform well for automatic and intelligent energy efficiency management.
Introduction
Energy is the foundation of the modern society. In recent years, conventional fossil fuel resources have become more and more scarce, and the increasing carbon emissions have caused the greenhouse effect and other environmental issues. As a result, there is a larger call to push forward research into renewable energy generation and energy saving technologies.1–3 However, renewable energy generation is geographically dispersed, intermittent, random, and uncontrollable. 4 From the view of electric power systems, it is very difficult to integrate significant renewables without any controllable fossil fuel. 5 Thus, in solving the potential problem of energy shortages in the future, one cannot only rely on renewables. The energy management technique is an effective approach to reduce total energy consumption while ensuring demand. For example, in a smart grid, optimization approaches, such as the unit commitment schedule 6 and optimal power flow dispatching, 7 are widely used to minimize electricity consumption under the grid’s physical and customer-demand constraints. Accordingly, intelligently managing and saving energy are not only cost-efficient but also environmentally friendly. 8
In current academic research and industrial implementations, the supply-side of the energy system is focused upon. The energy nodes on the demand-side are much more numerous than on the supply-side and are geographically dispersed, so they are hard to optimally manage and coordinate to save energy. However, with the development of information technologies and data mining methods, it has become possible to help demand-side consumers to automatically save energy, based on some optimal energy management approaches.9,10 Note that in the current energy system, electricity plays the most important role, and this paper thus focuses on the energy management techniques for electricity. 11
In order to realize demand-side energy management, two basic problems should be solved. The first one is the architecture design of the energy management system. Europe has made many attempts in this area; 12 for example, the eTelligence project in Cuxhaven, Germany, which aims to build internet-based regional energy market. All of the energy producers, distributors, consumers, and service providers in the region communicate and trade online. The instant output of various power equipment, as well as instant energy consumption data of loads, are openly available on the internet. As a second example, the purpose of the E-DeMa project in Rhine-Ruhr is to build an intelligent, interconnected, and distributed energy community. Electricity consumers in this project can also produce electricity using their own distributed generators and sell electricity to others. A third example, the “Mannheim model city” in the Rhine-Neckar City Circle, enables distributed energy and other utilities (water, heat, and gas) to be organically integrated into the city's existing distribution network. However, these projects all focus on the generation and transmission of electric power, while the customers’ electricity schedule cannot be optimized. Roughly speaking, these energy management systems are designed and deployed more for the supply-side. In our previous works, an MQTT/MQTT-SN-based user energy management system (UEMS) was established and verified.13–15 In the UEMS, all the end-user’s electric appliances can be integrated into the system, such as air conditioners and water heaters. Based on these works, it is possible to realize appliance-level energy management and optimization. In this paper, we extend the UEMS to a general smart energy system incorporating distributed generators and electric vehicles. Characteristics, functions, and architectures are also developed in this paper based our previous work. More intelligent energy management approaches are also studied.
Besides the system or platform of energy management, analyzing and optimizing electricity consumption is another crucial problem 16 . First, the accurate identification of residential power consumption patterns is beneficial to energy saving and management. Based on the identification results, we can optimize electric appliance usage without a customer’s supervision. In previous research, many scholars have solved this problem from the view of optimization. For instance, in Kashimoto et al., 17 energy savings for household energy systems are investigated on the premise of maximizing user comfort. This study simulates the power consumption of air conditioning and refrigerators varying with temperature, and the results show that, under the condition of reducing the degree of user comfort, a remarkable energy saving effect can be achieved. In Pallotti et al., 18 the optimization of power and energy savings are studied in 264 residential areas. This research employs a multi-objective optimization problem based on the genetic optimization algorithm (GOA). This approach can realize notable energy savings for domestic electricity consumption on the premise of ensuring user satisfaction. In Yu et al., 19 based on the stochastic optimization method, the modeling and simulation of electric vehicles, air conditioning systems, washing machines, dryers, and other high-power electrical appliances in families were studied. An energy saving optimization strategy was given, by predicting the power consumption based on the historical load curve. However, evaluating whether an electrical appliance should be used or not and automatically identifying the appliance’s operation status have not been solved in the current research. The biggest challenge of these problems is in developing robust models of the demand-side resources that consider the stochastic behavior of customers. Roughly speaking, it is not easy to solve these problems based on the conventional model-based methods.
To bridge the gap between demand-side energy management and the current approaches, this paper makes three contributions, as follows:
The demand-side energy management system leveraged in our previous works is extended to incorporate more distributed resources. Characteristics, functions, and architectures of the demand-side energy management system are described in this paper. The customer’s power utility function is proposed in this paper to quantitatively evaluate the appliances’ operation statuses. Based on the proposed index, automatic energy saving programs can be performed without large-scale optimization models, leading to a more computationally efficient approach. In order to realize online energy saving, a data-driven electric appliance operation and customer activity recognition approach is proposed, based on a hidden Markov model (HMM). Employing the recognition approach, an energy saving program can be performed which is completely automatic and runs in real-time.
The remainder of the paper is organized as follows. The next section gives the overall characteristics and architecture of the demand-side energy management system. The subsequent section introduces the proposed energy management approaches, including the electric appliance utility functions and the data-driven recognition method, followed by some case studies using our approach, and the conclusion is given in the last section.
Demand-side smart energy network
Function overview
The smart energy management system integrates the internet of things (IoT), the internet, smart grid technologies, and microgrids.20,21 Since it is also formulated as a network, we define the demand-side energy management system as a smart energy network throughout the rest of the paper.
The structure of the smart energy network has the following characteristics:
An autonomous decentralized architecture. This overall architecture makes the smart energy network self-controlled and self-coordinated. Under this framework, not only are renewable energy generation units, energy storage devices, and loads independent and equal, but also the subsystems (such as industrial parks, residential areas, etc.) are divided by geographical distance as well. There is no relationship between the subsystems, so that they can all independently complete their own energy management tasks without any intervention from other units. At the same time, each local unit is capable of coordinating with other one to help run the entire system.
In addition, since the energy network will continue to develop, the corresponding system cannot be built in the first place and needs to be continuously modified, improved, and expanded. An autonomous decentralized architecture brings the smart energy network the capabilities of online expansion, maintenance, and fault tolerance to meet a new energy unit’s access requirement.
2. Plug-and-play functionality and a low cost of renovation. The terminal system includes smart outlets, smart infrared controllers, and other plug and play devices, allowing direct access to all types of loads. 3. Combined functionality with internet technologies to achieve the integration of information flow and energy flow. The smart energy network collects terminal generation and load energy information in real time, via advanced metering equipment with controllable capability. All types of energy information can access the internet via Ethernet or Wi-Fi, which can allow the open flow of energy flow to the public through the web, mobile clients, and other paths. Cloud service centers can arrange scheduling based on real-time information to achieve optimal energy control.
The smart energy network has the following advantages:
Open energy information. The network allows the energy information of renewable energy generation, energy storage devices, and various types of loads to be openly available online. Power dispatching agencies and governments can arrange scheduling strategies, planning, or energy distribution based on the information. Consumers and ratepayers can submit energy inquiries based on information from the local energy management units, which helps them to be aware of their energy consumption activities and encourages energy saving in daily life. Automatic energy management. A large number of smart sockets, infrared controllers, and other advanced meters make the energy not only measurable but also controllable. Once the optimal strategies are made, the network can implement the control tasks itself, which will maximize energy efficiency improvements. Energy information data mining. With the large scale of user-side energy data, there are many possibilities for actions based on the assorted, tagged, and advanced information. For example, the information can be used to compare the energy efficiency difference among different brands in some specific applications such as air conditioning. Furthermore, regarding user-side load, historical information collected from the smart energy network could be meaningful analyzed to recognize consumers’ energy consumption activities by using data mining algorithms. Based on the analysis, the network can teach itself to create optimal energy saving strategies. The network will learn and understand consumers’ activities better than they themselves understand, and thus highly improve the energy efficiency.
Network architecture
There is a tertiary structure for the smart energy network: total network → subsystems → local energy management units, which is shown in Figure 1. The total network consists of various subsystems, which can be residential areas or industrial parks, for example. Furthermore, each subsystem consists of a large number of local energy management units, which are likely single dwellings or floors.

The structure of the smart energy network.
There is a control center in every subsystem to exchange information with the total system or with the local energy management units. Each local energy management unit has an energy information gateway that can communicate with the upper subsystem through the internet, and also with all kinds of advanced metering devices (such as smart sockets, infrared controllers, etc.) through ZigBee. 22
Each local energy management unit’s hardware system consists of an energy information gateway, several intelligent terminals, and interactive terminals. A simple system is shown in Figure 2 and we describe the various components in the following paragraphs.

A simple example of a local energy management unit.
The energy information gateway: based on the Android platform, the energy information gateway is an information transmission, control, and computing center. It can exchange information via the serial port with the ZigBee communication module and communicate with the subsystem via Ethernet or Wi-Fi. The ZigBee module plugged into the energy information gateway can communicate with advanced metering devices; collect data regarding power, voltage, current, etc.; and also control the load or generation.
Intelligent terminals and smart infrared controllers: ZigBee chips are built into the intelligent terminals and infrared controllers, enabling them to communicate with the gateway and to be controlled. Examples of intelligent terminals include smart sockets that are plug-and-play or embedded in the wall, central air-conditioning intelligent control panels, and a variety of controllable loads and distributed generation resources under 10 kV. Smart infrared controllers can remotely control some of the infrared supported loads (such as infrared remote-control air conditioning, etc.). The ZigBee chips in the intelligent terminals and infrared controllers are programmable, making it possible to add or modify functionality according to a consumer’s or system’s requirements. In addition, it is also feasible to integrate temperature, humidity, light, and other sensors into the intelligent terminals or infrared controllers to provide accessorial decision support for energy management.
Interactive terminals: there are diverse types of interactive terminals in the smart energy network, such as the web, mobile applications, and so on. For industrial parks and other subsystems, a large visual monitoring platform can be built to help keep energy invisible and controllable. For general users, they can view their energy consumption status or remotely control their load via mobile applications anytime and anywhere.
Data-driven smart energy management technologies
Based on the proposed smart energy system, we subsequently study the energy management technologies. Conventional methods usually operate the resources according to physical or mathematical models. However, when it comes to large-scale deployment, the model-based approaches will face many obstacles, such as inaccuracy and computational burden. To address this problem, this paper proposed a data-driven smart energy management approach, where modeling for lots of demand-side devices is avoided. The concept of power utility is proposed to assess load energy efficiency, along with consumer energy activity recognition.
Based on the massive amount of energy data collected from the smart energy network, a large number of possible applications have arisen, such as self-recognizing the load operating state, assessing the power utility of load and generation, and identifying consumer history or real energy activities. This analysis work will help the network to automatically save energy and perform demand response (DR).
User-side load power utility grading
Consumers want to receive a high-quality and reliable supply of electricity with the lowest cost and best service, and this is consistent with the utility theory in economics. In other words, consumers aim to obtain maximum satisfaction for their electricity consumption, under the constraints of limited energy and electricity costs. Therefore, we propose the concept of user-side load power utility. Different from the traditional assessment methods based on energy consumption or cost, the power utility method considers energy efficiency and satisfaction at the same time.
Based on the load characteristics and consumer requirements, power utility theory divides loads into different types. For each type, there is a utility function to describe the quantitative relationship between power utility and energy consumption. More importantly, we set three power utility grades for subsequent optimal algorithms.
Load classifications
Based on the load characteristics, we obtain three categories: thermal storage, battery storage, and non-storage. The thermal storage-type loads include air conditioners, electric water heaters, refrigerators, and other loads with thermal inertia. The battery-type loads include electric cars, laptops, and other equipment containing rechargeable batteries. Finally, the non-storage-type loads include TVs, desktop computers, set-top boxes, and other instant-powered devices. For the sake of simplicity, we only discuss the thermal storage type and non-storage type in this paper, while the battery storage type will be studied in the future.
Power utility functions
Load power utility functions are introduced to describe the quantitative relationship between load power utility and consumers’ energy consumption.
Temperature utility function for thermal storage-type loads
Thermal storage-type loads work to help consumers enjoy their desired temperature. For instance, air conditioning creates an appropriate indoor temperature, and a water heater creates the appropriate temperature for water. Thus, a temperature utility function is proposed for thermal storage-type loads.
The temperature utility function describes the consumers’ temperature satisfaction level according to the relationship between the desired temperature and the actual temperature. This is expressed as

Time utility function for non-storage-type load
The energy consumption purpose of non-storage-type load is diverse. Its non-storage characteristic indicates that consumers want to get the utility in a specific period by consuming energy. Thus, the time utility function is proposed for non-storage-type load.
The time utility function describes the consumers’ real-time energy consumption satisfaction level according to the relationship between the expected use period and the actual use period. This is expressed as

For the above two types of loads, we record the set of environmental parameters in room r at time t which may affect the utility level, including indoor and outdoor temperature, water heater temperature, electrical switch time, as V(r, t).

Before further studying, we hope to clarify that these utility functions defined above are not directly leveraged in our energy management algorithms, while they are the bases of the utility grades.
Power utility grades
We grade the power utility based on the temperature and time power utility functions. We divide power utility into three grades: high utility, low utility, and negative utility. Higher utility grades indicate a better satisfaction level and better energy efficiency. We use UTi(t) to represent the power utility grade of device i at time t. We assign the values of the load utility grades for high, low, and negative as 2, 1, and 0, respectively.
Load operational status can be simply divided into three categories: work, standby, and off. Work status means that the load is in the implementation of its job, such as air conditioning. Standby status means that the load is powered on, but without any substantive work. Off status means that the load is shut down and in a de-energized state. We use Si(t) to represent the operational status of device i at time t. The values for work, standby, and off are 2, 1, and 0, respectively.
We use the temperature power utility function to help grade thermal storage-type load power utility, and the assignment is summarized in Table 1. When the load is in work status and guarantees that the actual temperature falls within the expected threshold, the load is assigned a high utility grade. When the load is on work status but fails to guarantee that the actual temperature is within the expected threshold, the load is assigned a low utility grade. When the load is on standby status, it is considered to be at a negative utility grade. When the load is off, it is considered at a high utility grade.
Thermal storage-type load utility grading method.

We use the time power utility function to help grade non-storage-type load power utility, and the methods are shown in Table 2. When the load is in work status and consumers are using it, the load is assigned a high utility grade. When the load is in work status but consumers do not need to use it, the load is assigned a low utility grade. When the load is on standby status, it is considered to be at a negative utility grade. When the load is off, it is considered to be at a high utility grade.
Non-storage-type load utility grading method.

Consumer energy activity recognition
Consumer energy activities are conducted with a direct impact on the user-side energy consumption, and so it is helpful for energy management to accurately recognize and analyze consumer energy activities. In this paper, consumer energy activity recognition is based on a hidden Markov model (HMM). 23
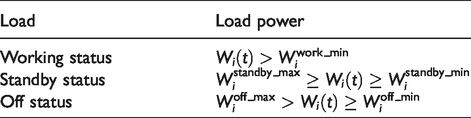
Dividing load operational status
We divide the load operational status based on load power Wi(t), as shown in Table 3. The lower limit for work status is represented as Wiwork_min. The lower limit for standby status is represented as Wistandby_min, and the upper limit for standby status is represented as Wistandby_max. The upper limit for off status is represented as Wioff_max.
Load operation state division methods.
Hidden Markov model for consumer energy activity recognition
The hidden Markov model for consumer energy activity recognition contains two sets of states (hidden status and observation status) and three sets of probability matrices (the initial, transition, and emission probability matrices). The hidden status represents the actual consumer energy activity, while the observation status represents the load operational state.
The initial probability matrix represents the probabilities of the consumers’ initial energy activities. The transition probability matrix represents the probabilities of changing from one activity to another. The emission probability matrix represents the probabilities that the activities affect the load operational state.
The specific mathematical definitions are given in Table 4.
Variables in the hidden Markov model for consumer energy activity recognition.

Furthermore, we denote the learning period as T, the set of all consumers as U, the number of consumers as L, the set of loads as Dr, and the number of loads as K.
Hidden status. We assign L nodes for the L consumers. The set defining the hidden status is the permutations from all consumers’ activity sets. For a user
where 
The hidden status X is expressed as
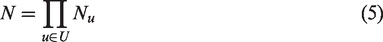
2. Observation status. We assign K nodes for the K loads. The set of observation statuses is the permutations from all load status sets, which is expressed as

where SDr represents a certain combination of the operational statuses of loads in the set Dr. The total number of observation status states is expressed as


The observation status Y is expressed as
3. Initial probability matrix. The initial probabilities of each energy activity in ACTU at time t = 1 (the initial time) is expressed as
4. The transition probability matrix is expressed as

where 

where 5. The emission probability matrix is expressed as

where
Parameter learning
We learn the parameters and obtain the associated probability matrix G. Given a load operational state set, we solve the optimal hidden Markov model. Firstly, we randomly generate the three matrices’ parameters. Then, we select an appropriate learning algorithm. In HMM, it is supposed that the observed symbols and model parameters are good to explain observations, but this is not true every time. So, the model parameters are adjusted to maximize the probability of the observation sequence. To optimize model parameters, the Baum–Welch algorithm, 24 an iterative method, is used in this paper. Baum–Welch algorithm was introduced by Baum et al. 24 in their study of statistical analysis of probabilistic functions of Markov chains. It is based on both forward and backward variables. The backward variable is the probability of the partial observation sequence from time step t + 1 to the end.
The associated probability matrix G is determined by the emission probability matrix. G is used to indicate the correlation between the load usage probabilities and activities, where gij represents the probability of using load j in energy activity i.
Decoding
We obtain the activity recognition results with a decoding algorithm such as the Viterbi algorithm. 25 Viterbi algorithm was conceived by Viterbi (1976) as a decoding algorithm for convolution codes over noisy digital communication links. It is used to compute probability of a state sequence, corresponding to a given observation sequence, iteratively. That is to say, given a load operational state set, we search for the most likely energy activity collection.
After accurately recognizing the consumers’ energy activity, we close the least-associated or the lowest utility grade appliances, thereby meeting the energy management targets, considering both customer satisfaction and load energy efficiency.
Automatic energy savings
Based on consumer energy activity recognition and utility grading, each local energy management unit is able to perform real-time assessment of the unit energy usage, and thus develop energy saving strategies. The specific implementation steps are as follows: Step 1: Consumers give their energy saving goals. Step 2: In the period t, perform real-time consumer energy activity recognition based on the load operation states s(d, t) and the environmental parameters V(r, t). Then perform load utility grading to achieve UT(s(d, t), V(r, t)) of load d at time t. Step 3: Develop strategies according to the utility grading results: (1) If the load is in a negative utility grade, turn off the load. (2) If the load is in a low utility grade for thermal storage-type load, adjust the operating state by changing its temperature setting; if this is the case for a non-storage-type load, turn it off. (3) If the load is in a high utility grade, keep its operating status unchanged. Step 4: Determine whether to continue saving energy. If continuing, jump to Step 2; otherwise, finish.
The overall framework of the smart energy management technologies is shown in Figure 3.

Overall framework of the smart energy management technologies.
Case study
Setup
In order to test the energy management system and verify the proposed algorithms, a test system was generated based on a pilot project in Guangdong province, China. In the pilot project, 200 residents were chosen to use our system. A family case is given to illustrate the energy savings optimization problem. The main electrical equipment used by this family included air conditioning (AC), an electric water heater (EWH), TV set-top box (STB), water dispenser, laptop, wireless router, desk lamp, etc. The 24 h power curve of the electrical appliances measured on a certain day in winter was selected. The main electrical activities of this family (including types of activities, starting time, and related appliances), the set temperature of the AC and the measured indoor temperature, as well as the set temperature of the EWH and the measured temperature of the effluent water, were recorded.
Energy savings analysis for the case study
By solving the control results, the energy consumption of each electrical appliance and total energy consumption before and after energy saving are compared, as shown in Table 5. Before energy saving, the total energy consumption of the family in 24 h was 26.81 kWh. After energy saving, the total energy consumption decreased to 16.85 kWh. Thus, the energy saving is 9.96 kWh, and the energy saving rate reaches 37.2%. The comparison of real-time total power in 24 h before and after optimization is shown in Figure 4. The dotted line is the original real-time total power and the solid line is the optimized real-time total power (the same holds in the Figure 5).
Energy consumption comparison of electrical appliances before and after energy saving.

AC: air conditioner; EWH: electric water heater.
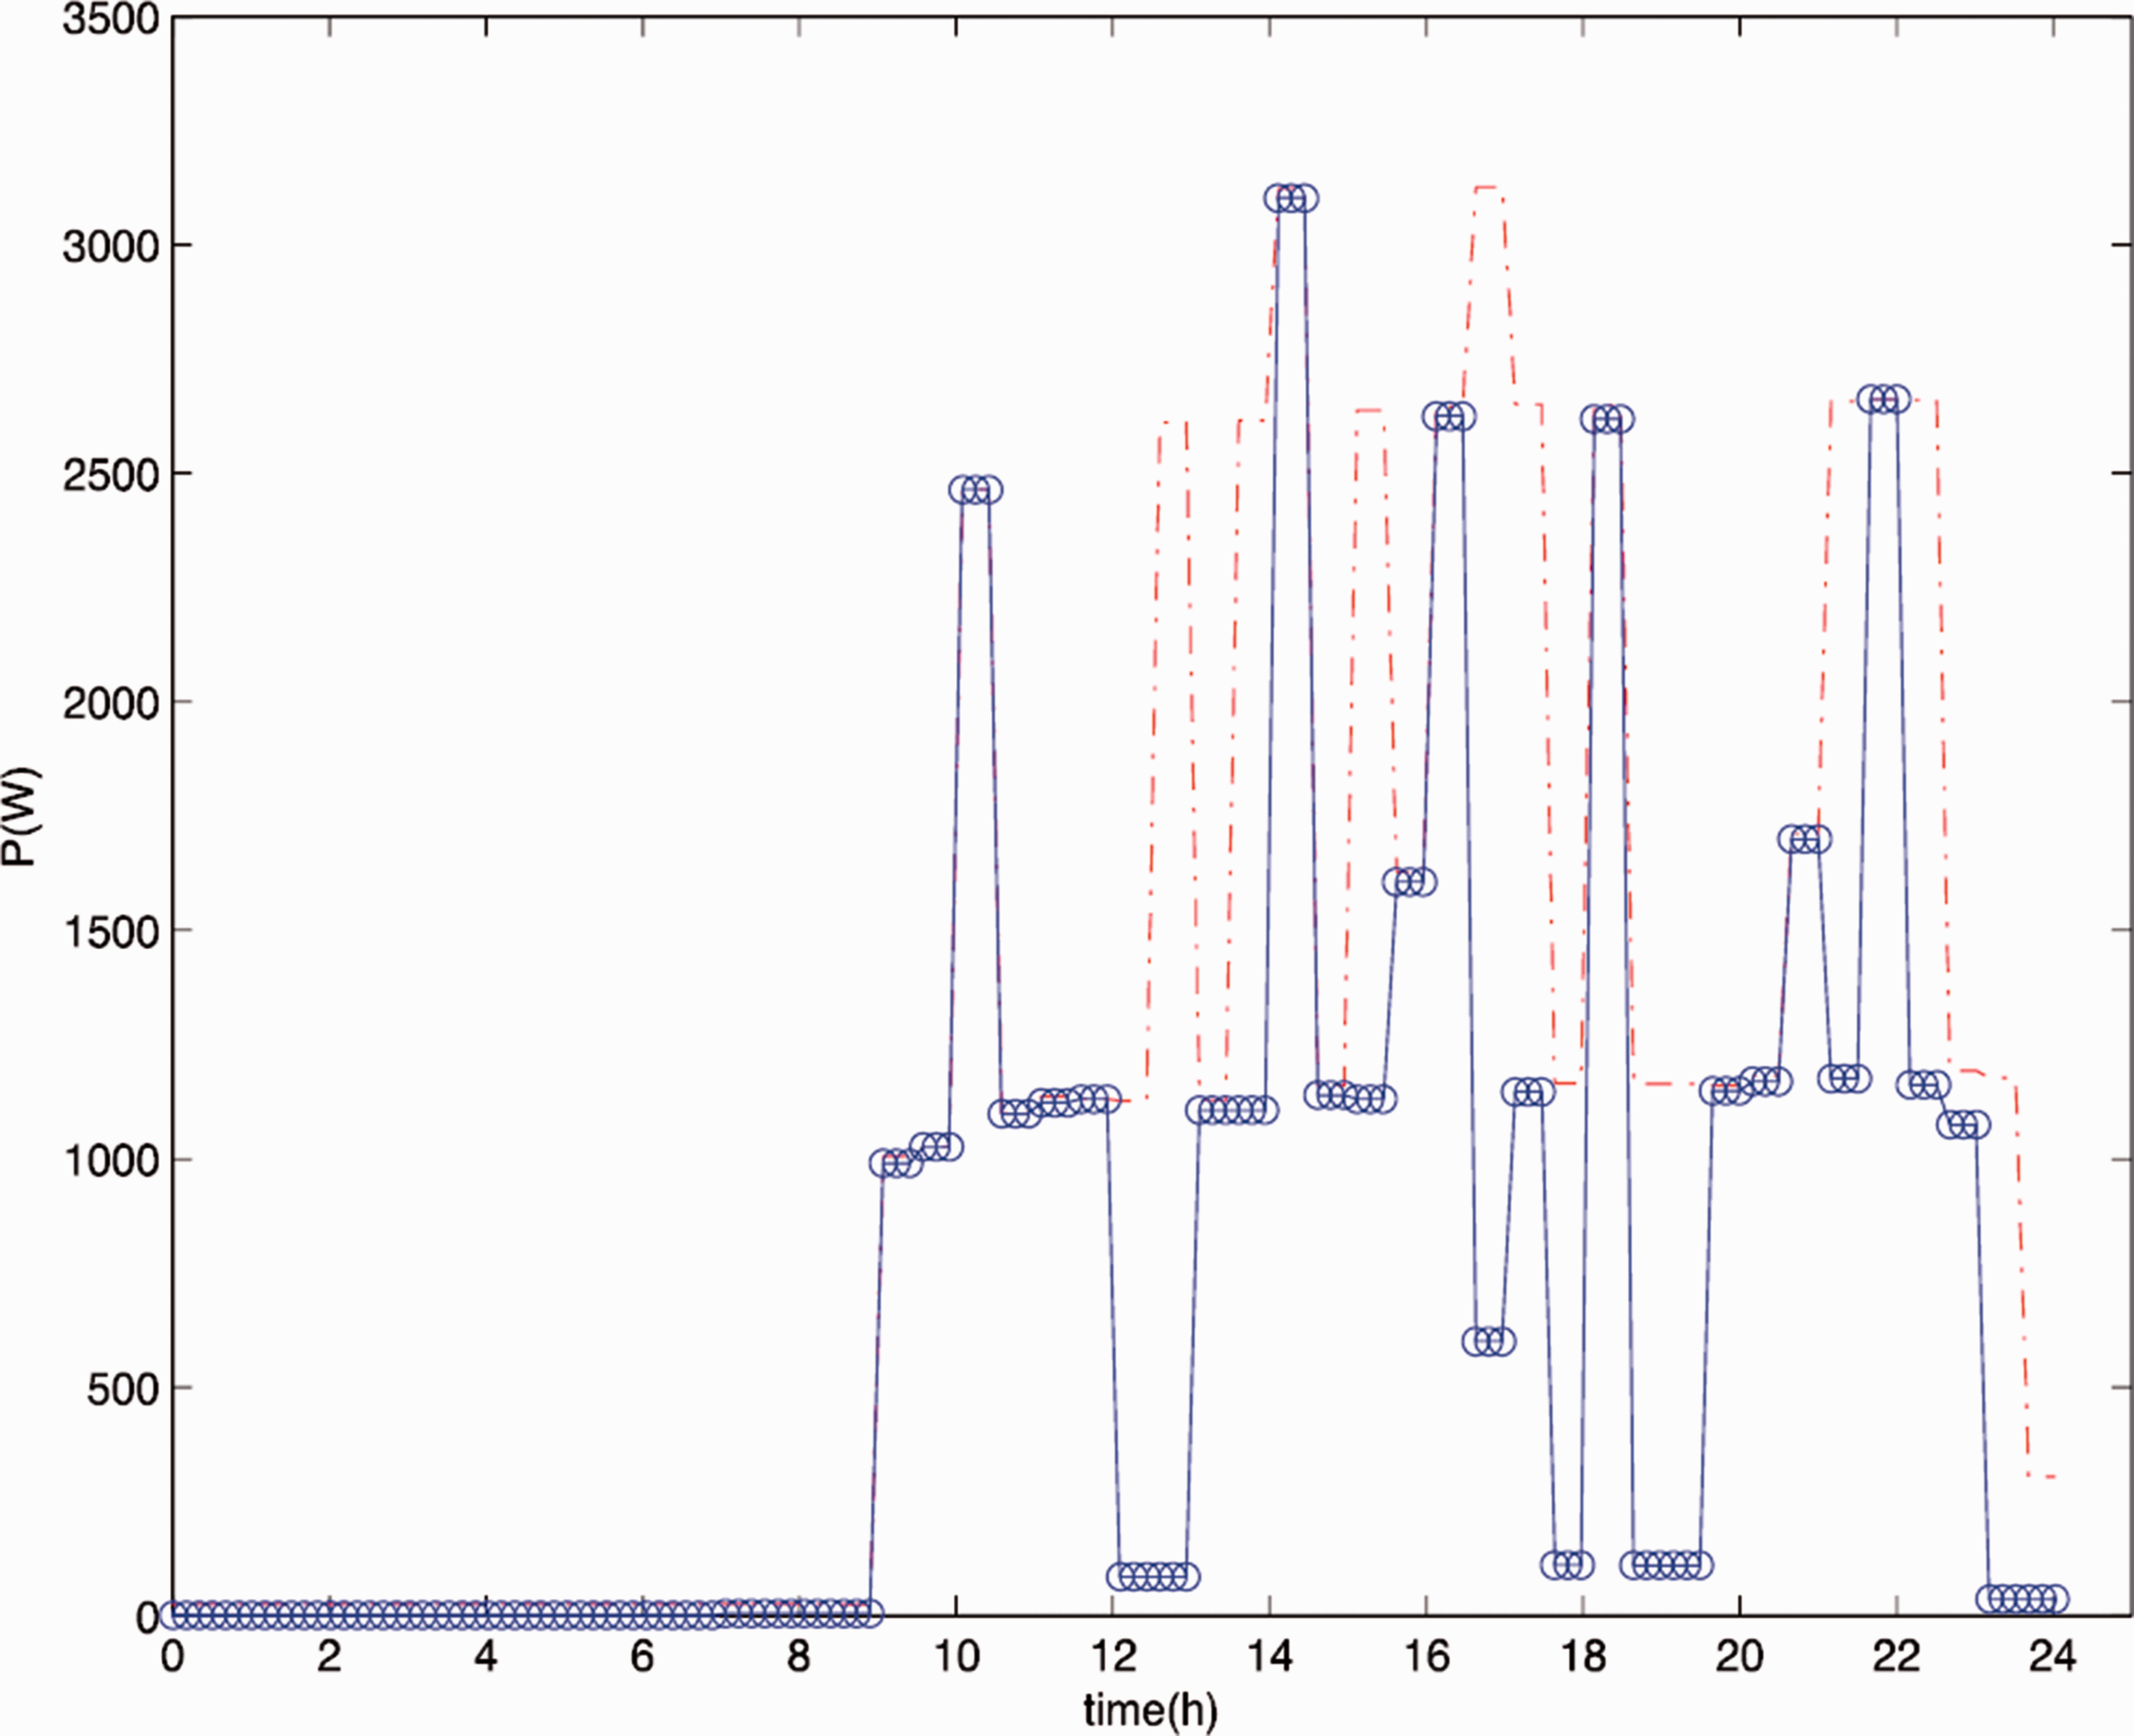
Total power comparison before and after energy saving optimization (blue solid line: after optimization; red dash line: before optimization).
Furthermore, we solve and analyze the energy saving rate of each electrical appliance, as shown in Table 5 and Figure 5. From these results, we can see that the energy saving rate of each electrical appliance is higher. Further calculation of the energy saving proportion for the electrical appliances shows that the energy savings of the EWH are the largest, followed by the AC. This is because their characteristics of energy storage and high power create a large energy saving space. The real-time power comparisons for each electrical appliance within 24 h before and after energy saving optimization are shown in Figure 5.

Energy consumption comparison of electrical appliances before and after energy conservation optimization (blue solid line: after optimization; red dash line: before optimization). (a) Air conditioning, (b) electric water heater, (c) lamp, (d) laptop computer, (e) router, (f) water dispenser, (g) television, and (h) digital converter box for televisions.
The proportion of appliances reaching a high efficiency level is shown in Table 6. The overall high efficiency of electrical appliances increased from 53.9% to 89.1%. The improvement of the utility level reflects energy savings, so the optimization of the user-side power consumption mode based on the efficiency utility level can achieve an excellent energy saving effect on the premise of guaranteeing user satisfaction.
The proportion of the high efficiency level for various electrical appliances before and after energy saving.

Conclusions and outlooks
The smart energy network integrates renewable energy resources, energy storage devices, and various types of loads in an autonomous distributed architecture. Based on the network, this paper presented a series of smart energy management theories, including user-side load power utility grading, consumer energy activity recognition for large-scale cooperative demand response, and automatic energy saving. Modeling, simulation, and practice results of these theories will be further detailed in future papers. Follow-up research work will be conducted in two aspects: (1) power utility function and grading for battery storage-type loads; (2) leveraging some techniques in artificial intelligence to advocate more accurate energy saving strategies, and (3) considering renewable energy generation in response to cooperative demand.
Footnotes
Declaration of conflicting interests
The author(s) declared no potential conflicts of interest with respect to the research, authorship, and/or publication of this article.
Funding
The author(s) disclosed receipt of the following financial support for the research, authorship, and/or publication of this article: The authors would like to give their sincere appreciation to the support of Science and Technology Project of China Southern Power Grid Co., Ltd (GDKJXM20161607).