
Abstract
In the clustering validity analysis, three main methods including intra-class cohesion, inter-class separation, and artificial judgment index can be used to evaluate the clustering results. If the clustering result is efficient, it means that the clustering stability is better. However, when those methods are used, it is essential to provide the sample data or clustering algorithms in advance. This paper proposes a clustering stability evaluation method based on the Elliptic Fourier Descriptor structural similarity index (EFD-SSIM), which can evaluate the clustering stability only when the clustering result is available. Its mechanism is that cluster is mapped into 2D graphics, and the degree of intra-class cohesion is measured based on the structural similarity (SSIM) on the graphics. As shown by the experimental results, EFD-SSIM has a good evaluation effect and it is consistent with the existing effectiveness evaluation indices of the clustering algorithm.
Introduction
Clustering is the process of dividing physical or abstract sets into multiple clusters of similar objects, which are different from each other. Apart from that, the aim is to discover the potential distribution patterns, intrinsic structure of datasets, and the knowledge hidden in the dataset. The clustering algorithms, such as k-means, 1 BIRCH, 2 EM, 3 DBSCAN, 4 CLARANS, 5 etc. are widely used in machine learning. As an unsupervised learning, clustering does not require the prior definition of classes or training data samples to indicate how the data should be related. Besides, it is difficult to find a perfect clustering algorithm, and the deviation is unavoidable in practice. Therefore, we need to design a comprehensive evaluation index of clustering results to measure the effectiveness of clustering algorithms.
The process of evaluating clustering results is also called clustering stability evaluation. The existing clustering stability evaluation indices can be classified into external evaluation index and internal evaluation index. The external evaluation index evaluates the clustering results by comparing these with the real distribution of datasets. Furthermore, its division is based on the contingency table, sample pair, and information entropy.6–8 The Jaccard coefficient and Rand index (RI) calculate the similarity between the two clusters. RI is used to evaluate the degree of dissimilarity between the two sets. It is effective for random clustering but requires real labeling. In addition, the Jaccard coefficient is used to measure the importance of data for different clusters. 9 Adjusted rand index (ARI) is used to compare cluster with the original classification of datasets and normalize the results. If the difference is smaller, the clustering effectiveness is better. Therefore, ARI can evaluate whether an algorithm is suitable for a dataset. Normalized Mutual Information (NMI), 10 as a classic clustering evaluation index, measures the similarity degree of two clusters based on their mutual information. If the valuation of mutual information is larger, the clustering effectiveness is better. Normalizing the NMI is called Adjusted Mutual Information (AMI). Entropy index indicates the degree to which the data onto each cluster is composed of data onto a single class. 11 The total entropy is equal to the sum of the entropy of every cluster. If the entropy is smaller, the clustering effectiveness is good. At the same time, different external evaluation indices have different emphasis. Amigó et al. 12 proposed four formal constraints (cluster homogeneity, cluster completeness, ragbag, and cluster size vs. quantity) to compare the existing external evaluation indices. As pointed out by He and Yu, 13 ARI is one of the best external evaluation indices at present. Clustering result deviation is a common phenomenon in data analysis. Although many clustering evaluation indices are proposed to cope with imbalance data and different cluster density,6,14 the external evaluation indices for clustering results deviation have not been fully considered.
The internal evaluation indices, as the common method of discovering the best number of cluster, do not use the prior information on original datasets but discover the internal structure of datasets and distribution by evaluating clustering results. The internal evaluation indices consist of two categories: based on statistical information and based on geometric structure. ICP 15 is an index based on statistical information, and it evaluates clustering result by measuring whether the points have the nearest distance into the same cluster. The internal evaluation indices are based on the geometric structure of the dataset; Davies-Bouldin (DB) index, as a commonly used, takes the largest quotient of the intra-class average distance of two clusters and distance of center of two clusters as the valuation index. DB is not fit for evaluating the ring distribution because it is calculated by Euclidean distance. (Xie-Beni (XB) index 15 considers both the fuzzy membership and dataset structure. The degree of cohesion and separation are related to each other. When the degree of cohesion is larger, the degree of separation is smaller, and vice versa. Furthermore, Silhouette coefficient (SC) is proposed for this phenomenon. It not only quantifies the similarity of intra-class data and similarity of inter-class data but also combines them in some ways. It is fit for the dataset with unknown actual information. The larger the value of SC, the more stable the clustering result. 16 Dunn Validity Index (DVI) index uses the shortest distance between two clusters to calculate the degree of separation of inter-class. The maximum diameter in cluster is used to calculate the intra-class cohesion and the ratio of resolution to cohesion as an indicator, the larger the ratio means the better the clustering effect. The larger DVI means, the better the clustering result. DVI is more effective on discrete dataset, which is not fit for the ring distribution datasets. 17 Due to the defects of some internal evaluation indices, it is difficult to judge the structure of clusters, resulting in poor clustering effectiveness valuation. Hence, it is hard to attain clustering results and find the best cluster numbers.
Although these evaluation methods have been successfully applied to different fields, their basic idea is based on statistical testing or seeks the best result of a clustering algorithm under certain hypothesis and parameters. The prerequisite is to get the knowledge of dataset or assume clustering algorithm. If the dataset or assuming clustering algorithm is not known in advance, then how to evaluate the clustering effectiveness?
It is important to solve the above problems. After analysing the intra-class cohesion, we think that when a stable clustering result is mapped into 2D graphics description, the boundary contour of graphics will not be easily changed because the center point of cluster has strong attraction to other points in the cluster. That is to say, when we randomly extract or add any similar points in a stable cluster, the boundary contour of the mapping graph is only slightly changed or unchanged. It can be concluded that the stability of clustering results is related to the changing of boundary contour of mapping graph. According to the above characteristics, we propose an structural similarity index based on Elliptic Fourier Descriptor (EFD) to evaluate the stability of clustering algorithm. The method takes EFD to describe the boundary contour of mapping graph and combines with the measurement of structural similarity index (SSIM) to evaluate the stability of clustering result. By using the image recognition method, this research aims to evaluate the stability of clustering algorithm, when the actual label of datasets or the assuming clustering algorithm is unknown.
The rest of the paper can be organized as follows: In SSIM based on EFD section, EFD-SSIM for clustering stability valuation is derived. In Experimental results and discussion section, the experimental process and results in instance data are given, including how to map cluster into Voronoi diagram, how todescribe the boundary contour of mapping graph, and how to calculate EFD-SSIM. At the same time,the EFD-SSIM will be compared with other clusteringstability evaluation methods.
SSIM based on EFD
Fourier expansion
First, we define a continuous curve c(t) in order to explain a Fourier expansion (Figure 1), which can be expressed by

A continuous curve.

Time serial graphic of DE.
According to the Euler’s formula

If we define
Then, equation (2) can be derived as

Then,

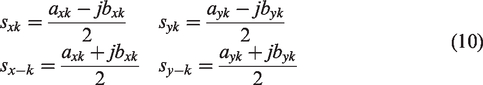
The coefficients in equation (3) can be obtained by considering the orthogonal property. Thus, one way to compute values for the descriptors is

EFD
Shape is one of the most important visual features to describe a target. The existing shape representation methods are classified into two categories: shape representation methods based on regional features and shape presentation based on contour features. The latter uses pixel information on boundary of target coverage area to describe the shape.18,19
FD is a classic contour-based shape representation that is originally proposed in 1960. The main idea is to use a set of data representing the overall frequency of the shape to describe the contour features and to have invariance to operations such as rotation and translation. It is a hot topic of the shape representation research. In terms of algorithm research, many researchers have done a lot of work to improve shape representation algorithm based on Fourier operator in order to enhance the ability of shape representation. Zhang and Lu proposed an enhanced universal FD to extract the key content of graph, which resolves the shortcoming that most of descriptors are not suitable for generic shape representation. 20 Li et al. 21 proposed a region-based affine invariant ring FD for affine invariant feature extraction, which can be used to extract contour feature of the object with multiple components. Kasaudhan and Son proposed an enhanced version of the grid distance FD to calculate image similarity and improve the image matching ratio. Belkhaoui et al. combined FD with watershed algorithm, a process and method for auto target recognition based on inverse synthetic aperture radar image to solve the target recognition of the radar image. 22 The principle and related work of FD will be described in detail below.
Let

For obtaining EFDs of boundary, we need to obtain Fourier expansion of boundary as shown in equation (2).

According to equation (6)

Then

According to equation (4)
Then, according to equation (5)

Because curve s(t) is non-continuous, we use the most direct Riemann summation method to approximate the integral value to obtain the discrete approximation of equation (11)

According to equations (8) and (10),

We assume that

Equation (6) can be expressed by equation (2) as follows

We assume that s(t) shifts Δx and Δy along the XY-coordinate, respectively. Rotating angle is φ in anti-clockwise direction. Then, we can obtain a new curve

The coefficients in equation (16) are computed by
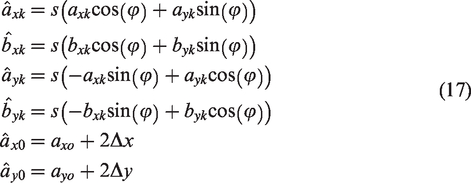
The following conclusion can be proved

Thus, EFD with translation rotation and scale transformation invariant can be expressed as

EFD-SSIM
Structural similarity index (SSIM) is an index of the similarity of two images,
23
which measure similarity of brightness, contrast, and structure of the two images. Its calculation only requires mean, variance, and covariance and does not require complex image feature extraction process, so it has been widely applied in image and video processing applications.24–27 SSIM is expressed by
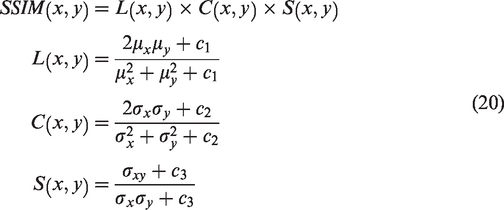

We believe that the stability evaluation of clustering algorithm can be transformed into the image similarity calculate structural similarity calculation when the cluster is mapped into 2D graphics. This is because in a stable cluster, its center point will have strong attraction to other points in the cluster, that is, any point belonging to the cluster will be as close as possible to the center point and stay away from the boundary point. This characteristic is reflected in the mapping graph of the stable clustering result, when any similar points are added or removed, and the boundary contour of mapping graph will be unchanged or slightly changed. According to this characteristic, we take image structural similarity as clustering algorithm evaluation index, but the boundary contour features are considered as one of the elements of the image structural similarity comparison. In this way, the stability of clustering algorithm is measured. If the structural similarity of two mapping images is higher, then the stability of clustering algorithm is better. Otherwise, the effectiveness of the clustering algorithm is not good.
According to the above ideas, we propose a clustering algorithm stability evaluation method (EFD-SSIM), which evaluates stability by combining SSIM with FD. EFD-SSIM is defined by equations (22) and (23). A value of EFD-SSIM closer 1 indicates that clustering stability is good.


Experimental results and discussion
In this section, the effectiveness of EFD-SSIM will be proved on four of different datasets.
Bearing fault data come from a motor performance database which can be used to validate and/or improve a host of motor condition assessment techniques, with a motor bearing condition assessment system developed at Rockwell. Motor performance database includes normal bearings data, single-point drive end and fan end defects data. All data files are in Matlab format. Each file contains fan and drive end vibration data as well as motor rotational speed.
Experiment 1
In this section, we will use dataset 1 to verify EFD-SSIM. The dataset includes the following variables:
DE – drive end accelerometer data
FE – fan end accelerometer data
BA – base accelerometer data
time – time series data
RPM – r/min during testing
We select three clustering algorithms(Clarans, Kmeans, Dbscan) to make fault diagnosis based on feature clustering at the only DE (see Table 1) is used for testing EFD-SSIM. DE is time series data, and its graphic is shown in Figure 2.
Partial data of motor bearings.

DE: drive end; FE: fan end.
In the process of motor bearing fault diagnosis, the effect of fault feature extraction determines the final diagnostic rate. Peak average rectified (PAR), KURTOSIS and SKEWNESS cover the distribution characteristics, the statistical characteristics, and the linear characteristics of vibration, which effectively reflect the major characteristics of vibration events. Therefore, those characteristics are seen as the basis of fault diagnosis. Calculation method is shown as follows


Because some of the eigenvectors of the vibration may have a certain correlation, it will effect the stability of the clustering fault diagnosis model. To overcome the effect, relevant eigenvectors must be first removed. According to the result of principal component analysis (PCA), PAR and KURTOSIS are irrelevant. They denote DE. Feature sets (F) are built by merging PAR with KURTOSIS (see Table 2).
Feature sets of DE.

PAR: peak average rectified.
Step 1: the best number of clusters is estimated in advance by existing clustering valuation indices such as DB, DVI, SC; the best number of clusters is 2. Test sets (T) are randomly extracted from feature sets (F) by the proportion of 3:1. F and T are classified into two classes as a result of prediction (see Figure 3).

Results of clustering of F sets and T sets.
To evaluate the stability of clustering results using image evaluation techniques, the result of clustering must be mapped into 2D graphic. We will use Delaunay Triangulation algorithm to map a certain cluster (called class I) of F sets and T sets; mapped cluster in two sets are in a containment relationship. Mapped graphic is called Voronoi diagram; it is the structure of computational geometry, which can be used to qualitative analysis, statistical analysis and the nearest neighboring analysis.32 In this section, Euclidean distance of arbitrary two points of the class I is computed; take any point as the vertex of a triangle and join it with the nearest two points of Euclidean distance; a Delaunay triangular net is obtained after N-iterations are executed. Triangle with common vertex is recorded; their center of the circumcircle is computed and then connected with the center of those circle in clockwise direction. Then, a Voronoi diagram can be drawn; its time complexity is
Hypotheses:
Step 1: the N points are sorted by mainly based on X coordinates.
Step 2: structural process:
If N = 2, Return If N = 3, three points are connected to construct a triangulation net and return The N points are divided into subsets Construct triangular net Construct triangular net merge
Step 3: merging process
For given Obtain the top tangent UCT and the bottom tangent BCT Start from the BCT, according to left endpoint, right endpoint and their adjacent points to complete
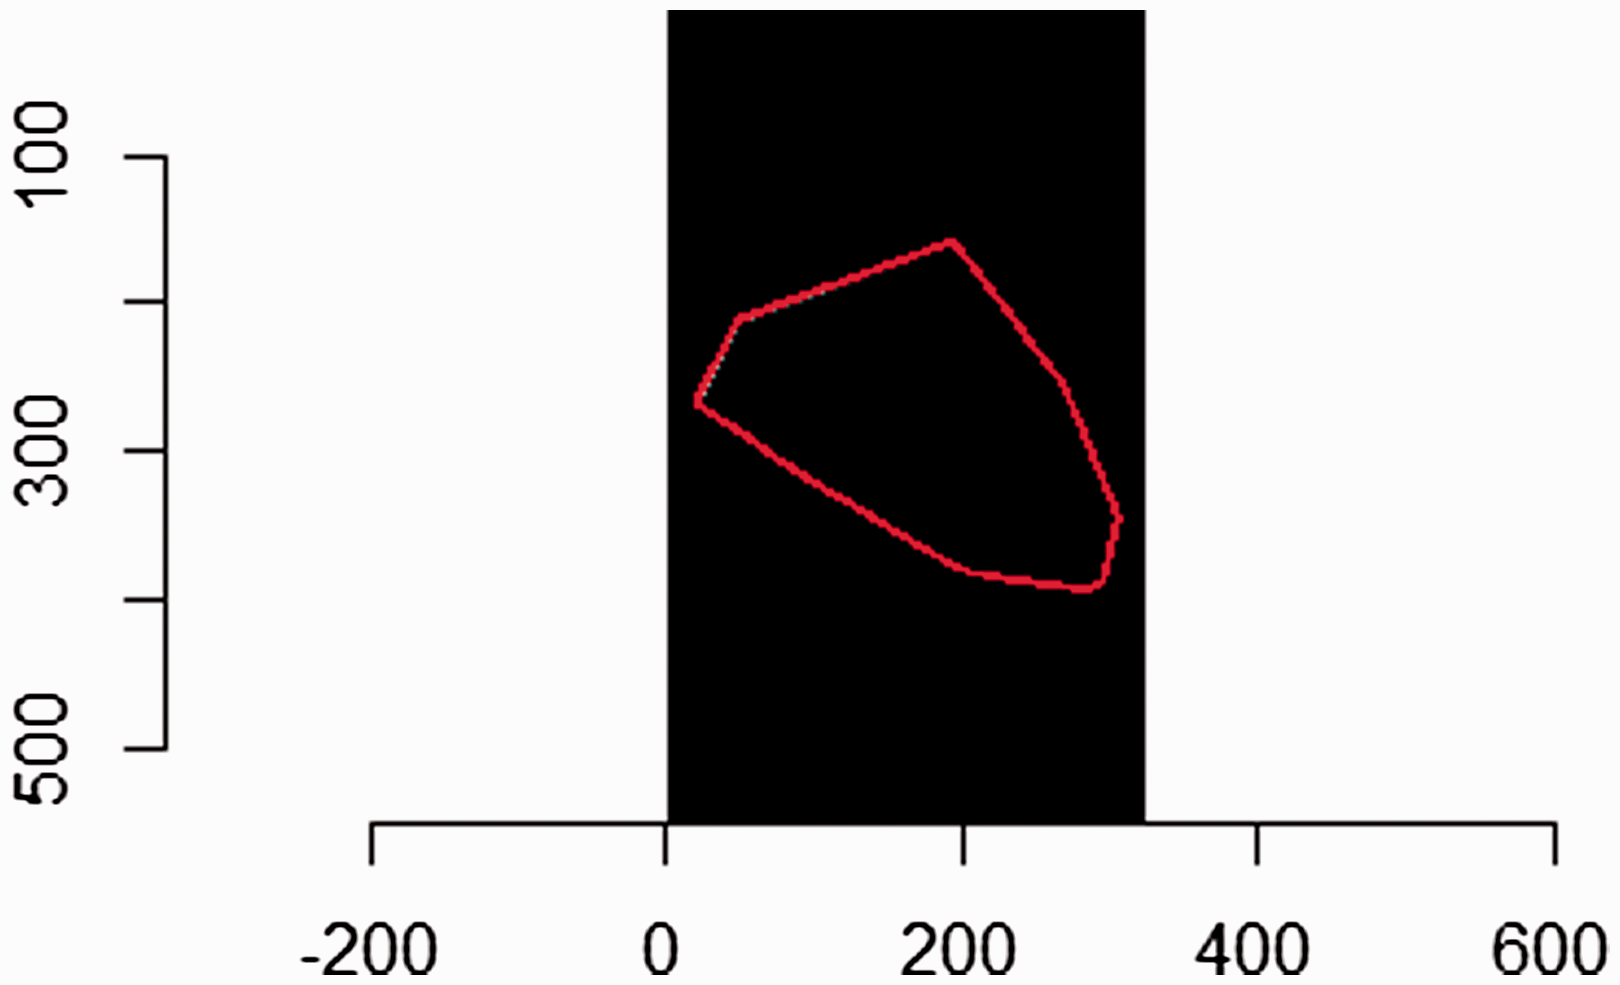
The Voronoi diagram of class I of F sets and T sets is shown in Figure 4, respectively. Canny edge detection operator is used to recognize the boundary shape of the Voronoi diagram.

Voronoi diagram of cluster.
Canny algorithm utilizes four operators to detect the edges of horizontal, vertical, and diagonal direction in an image. Derivatives are computed in horizontal θ and vertical 
G of the current pixel is compared with two pixels in positive and negative gradient direction. This pixel will be regarded as an edge point if G of the current pixel is greater than the other pixels; if not, it will be restrained and called as maximum restrain value. Some pixels of edge still exist which are caused by noise and color changing after restraining is imposed on the maximum value. By setting up a choice of high and low thresholds to resolve this defect, this pixel will be seen as strong pixel if G is greater than the high threshold. This pixel will be seen as a weak pixel if G is lower than the high threshold and greater than low threshold. As long as there is a strong edge pixel in eight adjacent pixels of the weak edge pixels, it can be preserved as edge points. This pixel will be restrained if G lower is than the low threshold. Contour of mapping graphs is shown (see Figure 5) after Canny Algorithm is executed.

Contour of mapped graphic.
EFD of contour of class I of cluster of F set and T set are computed by equations (7) to (19) (see Table 3).
EFD of contour of result of fault classes.

EFD-SSIM of three clustering algorithms (Clarans, Kmeans, Dbscan) by equations (22) and (23) are 0.816237, 0.993007, 0.674093, respectively.
Experiment 2
In this experiment, dataset 2 is used. Figure 6 shows the inlet and outlet flow readings (normal and leak, respectively).
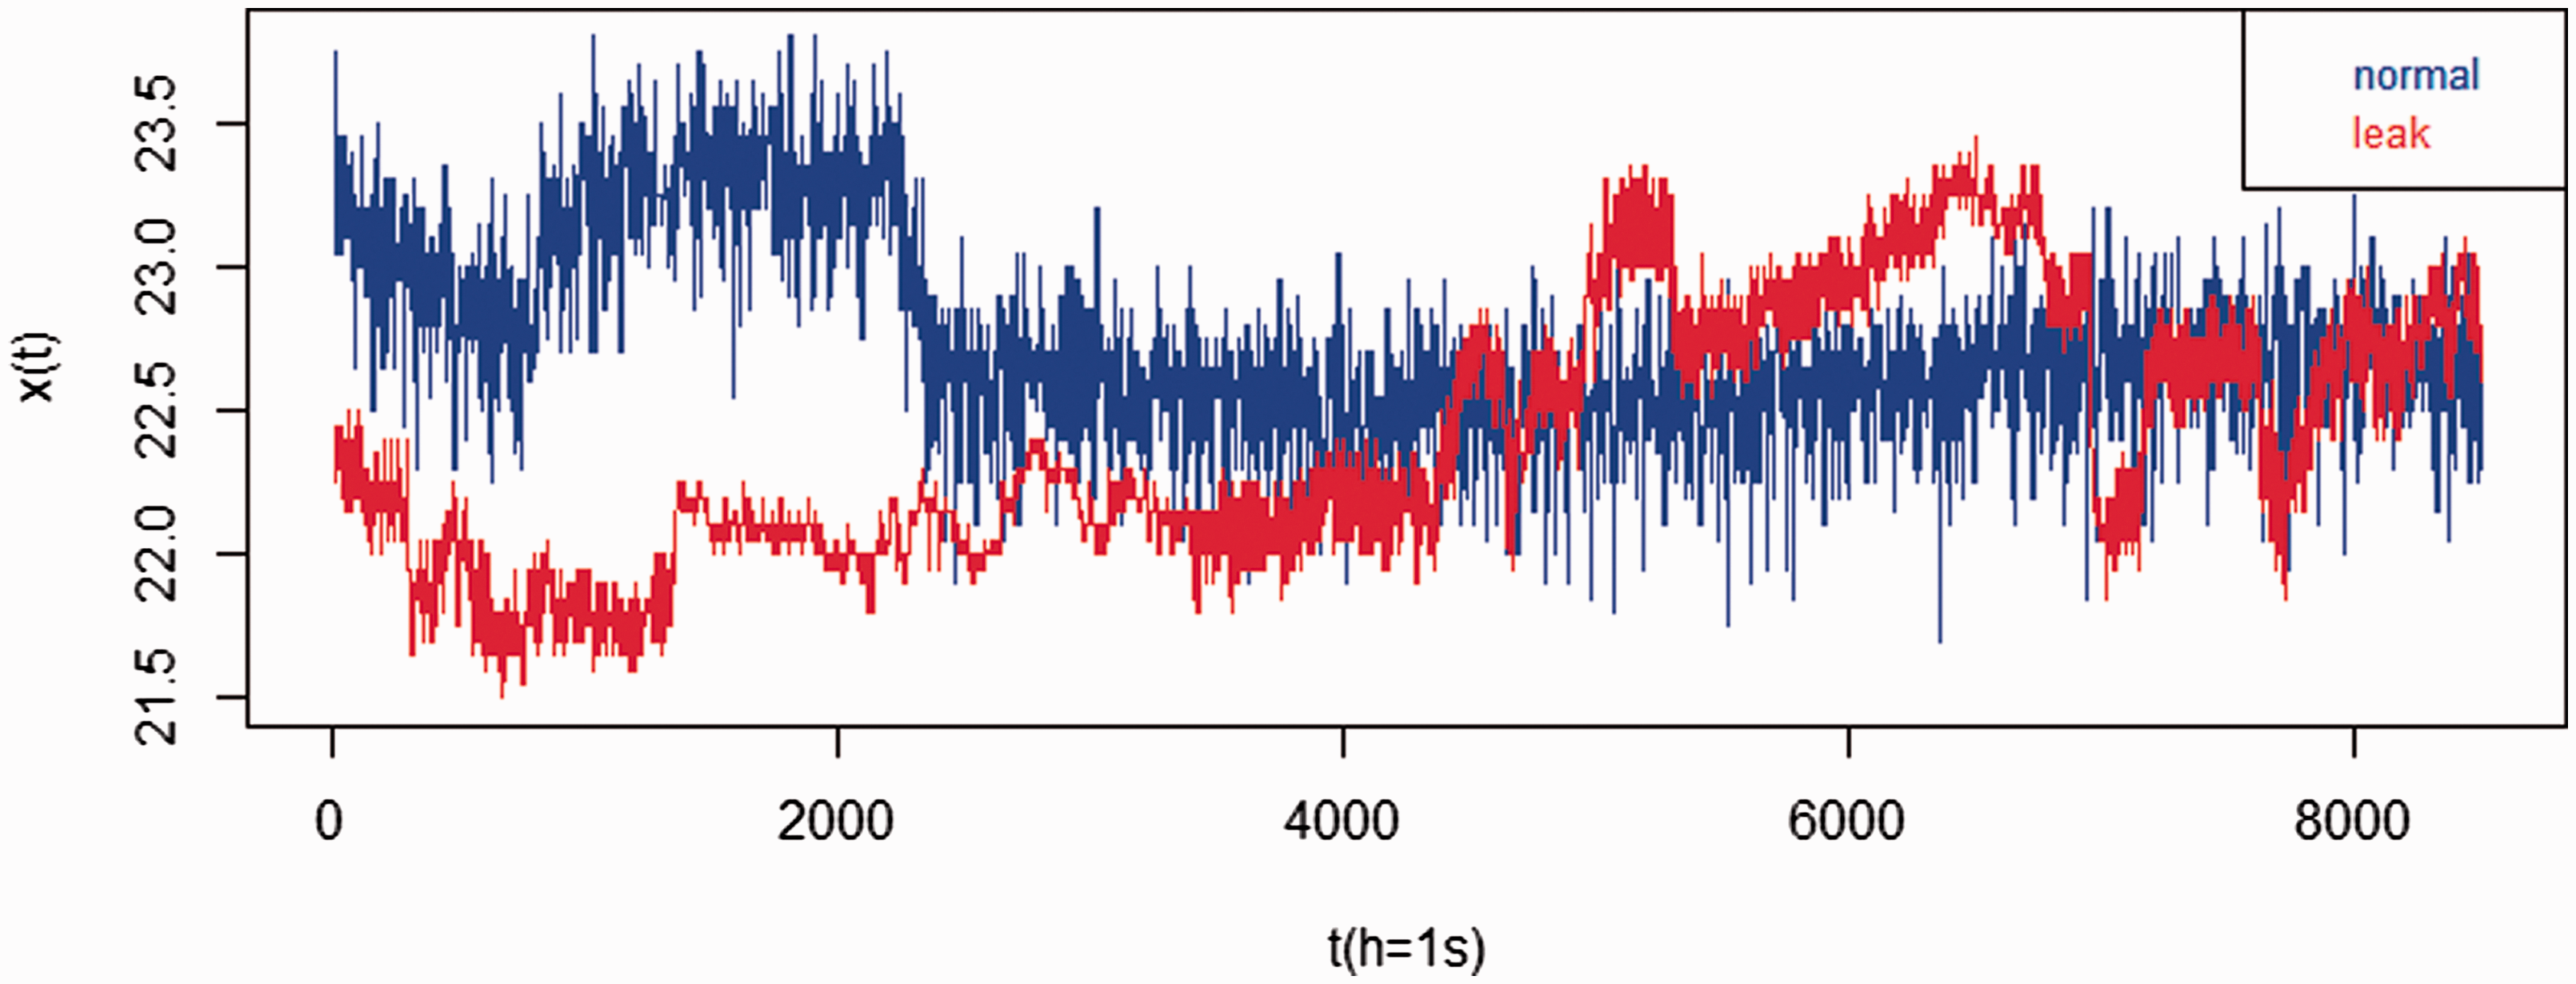
Data of LPG.
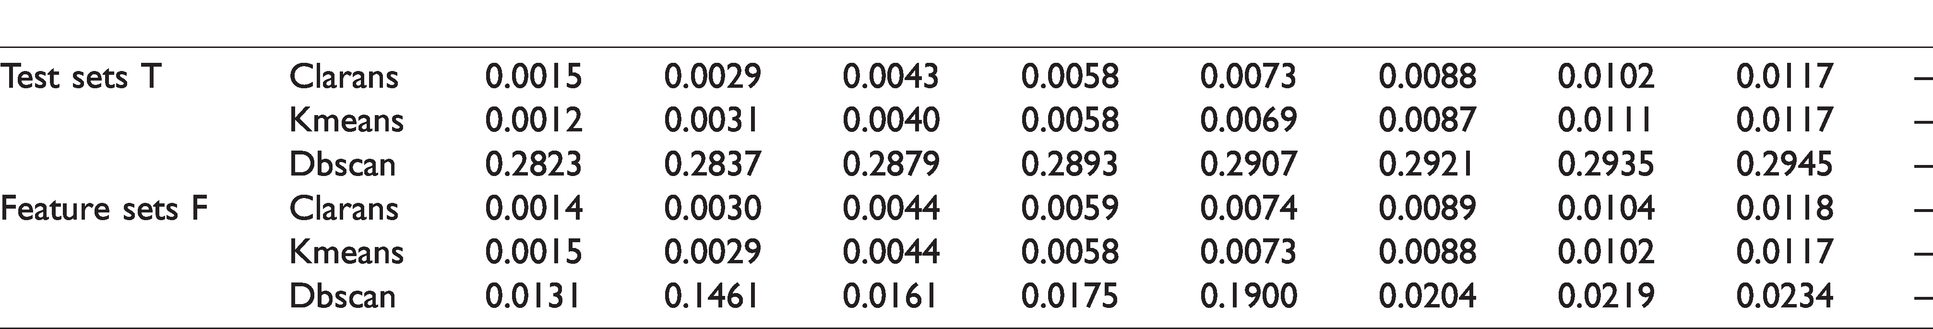
In this section, we will use the same method as experiment 1 to 2D graphic mapping, detect edge, and calculate EFD. They will not be described again in here. Table 4 shows EFD of mapped graphic of LPG leak state diagnosis. The values in Table 4 are computed from equations (7) to (19). EFD-SSIM of three clustering algorithms (Clarans, Kmeans, Dbscan) by equations (22) and (23) are 0.888282, 0.999994, 0.180958, respectively.
EFD of mapped graphic of leak diagnosis.

Experiment 3
Dataset 3 HTRU2 is used in this experiment. The partial data of dataset HTRU2 are shown in Table 5.
The partial data of HTRU2.

MIP: mean of the integrated profile; SDIP: standard deviation of the integrated profile; EKIP: excess kurtosis of the integrated profile; SIP: Skewness of the integrated profile; MDSC: mean of the DM-SNR curve; SDDSC: standard deviation of the DM-SNR curve; EKDSC: excess kurtosis of the DM-SNR curve; SDSC: Skewness of the DM-SNR curve.
In this section, we will use the same method as experiment 1 to 2D graphic mapping, edge detection, and EFD calculated. They will not be described again in here. According to the real label of HTRU2, we let the number of clusters to be 2. Table 6 shows EFD mapping graph of the clusters of dataset HTRU2. The values in Table 6 are computed by equations (7) to (19). EFD-SSIM of three clustering algorithms (Clarans, Kmeans, Dbscan) by equations (22) and (23) are 0.999989, 0.999993, 0.994068, respectively.
EFD of mapped graphic of HTRU2.
Experiment 4
Dataset 4 MFCCs is used in this experiment. The partial data of dataset MFCCs are shown in Tables 5 and 7. Mel-frequency cepstral coefficients (MFCCs) are coefficients that collectively make up a mel-frequency cepstrum (MFC). Since each syllable has different length, every row (i) was normalized according to MFCCs_i/(max(abs(MFCCs_i))).
EFD of mapped graphic of MFCCs.

In this section, we will use the same method as experiment 1 to 2 D graphic mapping, edge detection, and EFD calculated. They will not be described again in here. According to the real label of MFCCs, we let the number of clusters to be 3. Table 8 shows EFD mapping graph of the clusters of dataset MFFCs. The values in Table 8 are computed by equations (7) to (19). EFD-SSIM of three clustering algorithms (Clarans, Kmeans, Dbscan) by equations (22) and (23) are 0.888282, 0.999963, 0.180951, respectively.
EFD of mapped graphic of MFCCs.

Discussion
Generally speaking, the method of effectiveness evaluation of clustering includes two categories. To be specific, one is within cluster distance (e.g. within.cluster.ss index, which is the square of distance of elements in every cluster) and the other is inter-cluster distance (e.g. avg.silwidth index). If the value of within.cluster.ss is lower and the value of avg.siwidth is greater, it denotes that the effectiveness of clustering is good. In this section, EFD-SSIM from experiments 1, 2, 3, 4 is compared with avg.silwidth and within.cluster.ss that are computed on the same data (see Tables 9 to 12). We can observe from the tables that the results of EFD-SSIM index are in accordance with the results of within.cluster.ss and avg.silwidth. Meanwhile, the effectiveness of EFD-SSIM is proved. Since EFD-SSIM is only verified on Kmeans, Clarans, Dbscan, the adaptability of EFD-SSIM to other clustering algorithms is our future research direction.
Results of experiment 1.

Results of experiment 2.

Results of experiment 3.

Results of experiment 4.

Conclusions
EFD-SSIM is a new clustering algorithm for stability evaluation index. According to the graphical representation of clusters, the stability of clustering results is evaluated by the SSIM based on FD. This method can quantitatively evaluate the stability of the clustering effect based on visual graph of the clustering result without supervision. From the experimental methods and principles, the EFD-SSIM is effective.
Footnotes
Acknowledgements
We would like to thank Professor Yan Zhu Hu and Professor Xin Bo Ai for inspiring discussions about clustering algorithm. Thanks to Hui Yang and Zhen Meng for their assistance in the experiment. We thank the anonymous reviewers for their valuable comments and suggestions to improve the quality of the paper.
Declaration of conflicting interests
The author(s) declared no potential conflicts of interest with respect to the research, authorship, and/or publication of this article.
Funding
The author(s) disclosed receipt of the following financial support for the research, authorship, and/or publication of this article: This paper is supported by Science and Technology Plan Project of Beijing (Z181100000618006), by the National Natural Science Foundation of China (61627816), by Science and Technology Plan Project of Beijing (D161100004916002).