
Abstract
As partition method of set, granular computing clustering is applied to image segmentation evaluated by global consistency error, variation of Information, and Rand index from the view of set. Firstly, quantitative assessment of clustering is evaluated from the view of set. Secondly, granular computing clustering algorithms are induced by the distance formulas, the granules with different shapes are defined as the forms of vectors by different distance norms, especially, the atomic granule is induced by a point of space, the union operator realizes the transformation between two granule spaces and is used to form granular computing clustering algorithms. Thirdly, the image segmentations by granular computing clustering are evaluated from the view of set, such as global consistency error, variation of Information, and Rand index. Segmentations of the color images selected from BSD300 are used to show the superiority and feasibility for image segmentation by granular computing clustering compared with Kmeans and fuzzy c-means by experiments.
Introduction
In computer vision, image segmentation is the process of partitioning a digital image into multiple segments. The goal of segmentation is to simplify and/or change the representation of an image into something that is more meaningful and easier to analyze. 1 Image segmentation is typically used to locate objects and boundaries in images. More precisely, image segmentation is the process of assigning a label to every pixel in an image such that pixels with the same label share certain visual characteristics. The result of image segmentation is a set of segments that collectively cover the entire image, or a set of contours extracted from the image. Each of the pixels in a region is similar with respect to some characteristic or computed property, such as color, intensity, or texture. Adjacent regions are significantly different with respect to the same characteristic. 1 From the viewpoint of the set theory, image segmentation is based on the pixels, and the pixel set is divided into several subsets according to the features of the pixels, such as the RGB feature, YUV feature, and gradient feature. When applied to a stack of images, the resulting contours after image segmentation can be used to create 3D reconstructions with the help of interpolation algorithms. The practical applications of image segmentation included content-based image retrieval, 2 machine vision, 3 medical imaging, 4 and object detection. 5
Clustering for image segmentation is a popular method by which an image is partitioned into multiple segments. Clustering can be considered the most important unsupervised learning problem, which deals with finding a structure in a collection of unlabeled data. Kmeans clustering and fuzzy c-means (FCM) clustering are two important unsupervised algorithms. The K-means algorithm, which is computationally difficult Non-deterministic Polynomial hard (NP-hard), is an iterative technique that is used to partition an image into K clusters. 6 FCM is a data clustering technique where in each data point belongs to a cluster to some degree that is specified by a membership grade. This technique was originally introduced by Jim Bezdek et al. 7 as an improvement on earlier clustering methods. It provides a method that shows how to group data points that populate some multidimensional space into a specific number of different clusters. FCM algorithm incorporates spatial information into the membership function for clustering. The spatial function is the summation of the membership function in the neighborhood of each pixel under consideration. 8
Granular computing (GrC) is a computational model for studying the law of transformation between the micro world and the macro world. From the view of set theory, the transformation from the micro world and the macro world means the GrC from the small granularity to large granularity. As a clustering method, GrC can be used to image segmentation.9–11 Image segmentation is the process of partitioning a digital image into multiple segments. A segment is regarded as a granule. The pixels with the similar features are clustered in the same image segments, such as the semantic image segmentation, atrous spatial pyramid pooling (ASPP) is proposed to robustly segment objects at multiple scales. ASPP probes an incoming convolutional feature layer with filters at multiple sampling rates and effective fields-of-views, thus capturing objects as well as image context at multiple scales. 9 The multi-scale is related to multiple granularity, the decision makers perform their exploration and analysis across a range of data scales from local to global, while maintaining a cohesive thematic context of the transition between the different granularity levels. 12 From the view of granular computing, the pixel has the smallest granularity, and the image segment has the larger granularity compared with the granule induced by the pixel.
Granular computing for clustering is an unsupervised clustering method, in which the vector is represented as a granule and the operation between granules is used to realize the transformation between the granules with different granularities. In this paper, image segmentation is implemented by granular computing. Firstly, the granule with the smallest granularity is induced by the vector represented by the features of pixel, the union operator between granules is designed to unite smaller granules into larger granule, and smaller granules contain less pixels than larger granules, the granularity threshold is set to control the union process. Secondly, image segmentation is evaluated by global consistency error (GCE), variation of information (VI), and Rand index (RI) from the view of set.
The rest of this paper is presented as follows: Quantitative assessment of clustering from the view of set section describes quantitative assessment of clustering from the view of set. granular computing clustering (GrCC) are described in Granular computing clustering algorithm section. Experiments section demonstrates the segmentation results of color image selected from BSD300. Conclusions section summarizes the contribution of our work and presents future work plans.
Quantitative assessment of clustering from the view of set
As the partition method, the data set


For the two partitions


where
Secondly, computing the mutual information between partitions
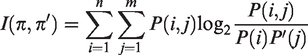
Thirdly, computing the VI


We explain the evaluation of partitions, such as GCE, VI, and RI, taking the segmentation of image I with the size 6 × 6. The segmentation labels of the pixels are shown in Figure 1 for the image I. Suppose the segmentation by human is shown in Figure 1(a), the segmentation by algorithm A is shown in Figure 1(b), and the segmentation by algorithm B is shown in Figure 1(c).

The segmentations by different methods (for example).
From the view of set, the segmentation by human shown in Figure 1(a) is transformed into the set


We can calculate the evaluation value of partitions


From the evaluation value of GCE, VI, and RI, we can see the segmentation by algorithm A is better than that by algorithm B, because
Granular computing clustering algorithm
GrCC algorithm is the method by which the granules are clusters. For the data set
GrCC
The idea of GrCC is described as follows. Firstly, the granule set (or the clustering set)(GS) is empty. Secondly, for the first datum
Algorithm 1. GrCC Input: the data set
Output: the granule set (GS)
S1. Initialize the granule set
S2. For the 1st sample
S3.
S4. Compute the distance metric
S5. Find samples in data set
S6.
S7. If the data set
Representation of granule and granularity
In reality, the shapes of granules are irregular, the distance between two granules is not easy to be measured, the union granule and the meet granule are related to the shapes of granules. In order to study granular computing, the granule is represented as regular shapes, such as hyperdiamond, hypersphere, hypercube in N-dimensional space. These three shape granules can be represented as the following normal form in the paper.

In Figure 2, the normal form granule

Granules with different shapes in R2 space.
Distance measure between granules
The distance between granules refers to the minimal distance between two points which belong to different granules.
For two hyperdiamond granules


For two hypersphere granule


For hypercube granules

where

According to the distance between two granules mentioned above, the distance between two granules is the arbitrary real number. There is margin between two granules when d > 0, there is a same point between two granules when d = 0, and there is an overlap between two granules when d < 0. When d > 0, the greater d means the greater margin between two granules, and when d < 0, the greater d means the smaller overlap. Figure 3 shows the distance between two granules, including d < 0, d = 0, and d > 0.

Distances between two granules in R2 space.
Operations between two granules
The operations between two granules reflect the transformation between macroscopic and microcosmic of human cognitions. When a person want to observe the object more carefully, the object is partitioned into some suitable sub-objects, namely the universe is transformed into some parts in order to study the object in detail in the view of microscopic. Conversely, there is the same attributes of some objects, we regard the objects as a universe to simple the process in the view of macroscopic. The operations between two granules are designed to realize the transformation between macroscopic and microscopic. Set-based models of granular structures are special cases of lattice-based models, where the lattice union operation ∨ coincides with set union operation ∪ and lattice meet operation ∧ coincides with set intersection operation ∩.
Union operation ∨ and meet operation ∧ are used to realize the transformation between macroscopic and microcosmic. Operation ∨ unites the granules with small granularities to the granules with the large granularities. Inversely, Operation ∧ divides the granules with large granularities into the granules with small granularities. Union operation ∨ and meet operation ∧ are designed as follows.
Any points are regarded as atomic granules which are indivisible, the union process is the key to obtain the larger granules compared with atomic granules. Likewise, the whole space is a granule with the maximal granularity, the meet process produces the smaller granules compared with original granules. Union operator is used to form GrCC. We explain the union process between two granules by taking hyperdiamond granule as an example.
For two hyperdiamond granules

The center
Firstly, the vector from
Secondly, the crosspoints of
Thirdly, the center C and granularity R of the union hyperdiamond granule
Algorithm 2. Computing
Output:
if
if
else
end
else
if
else
end
end
Figure 4 shows the union process of the hyperdiamond granule

The union hyperdiamond granule of two hyperdiamond granules.
Image segmentations by GrCC
RGB is an additive color model in which red, green, and blue light is added together in various ways to reproduce a broad array of colors. Given a color image represented by RGB, image segmentation by GrCC includes the following steps.
Firstly, the data set
Algorithm 3. Image segmentation by GrCC Input: the image
Output: the segmented image
S1. for
S2. for
S3. form the data set
S4. perform algorithm1, and achieve the center of GrCC
S5. the color vector of the pixel
S6. end for
S7. end for
Experiments
In order to verify the superiority of image segmentation by GrCC, we compared the proposed segmentation by GrCC with segmentations by Kmeans and FCM, and all the experiments are performed in the same environment, such as Intel PIV PC with 3.2 GHz CPU and 8 GB memory, Microsoft Windows7 and Matlab2008. The performance includes GCE, VI, and RI between the segmentation by human and the segmentation by algorithm. GrCC induced by the distance formula (1) is called as GrCC1, GrCC induced by the distance formula (2) is called as GrCC2, and GrCC induced by the distance formula (3) is called as GrCC3.
Firstly, we select an image (#135069) to compare the segmentation by GrCC with the segmentation by human. For the selection of parameter ρ, we set ρ from 200 to 50 with step 1. The best quantitative assessment values of GCE, VI, and RI and the parameters performed the best quantitative assessment values are listed in Table 1. In the table, ρ represents the parameter of GrCC, K is the clustering number of FCM and Kmeans. From the table, we can see, the segmentation images obtained by GrCC are closer to the artificial segmentation images than these obtained by FCM and Kmeans because the segmentation images by GrCC have the small GCE, the small VI, and large RI compared with the segmentation images by FCM and Kmeans. For the GrCC algorithms, the GrCC3 is better than GrCC1 and GrCC2.
Comparison of segmentations for image (#135069) selected from BSD300.

FCM: fuzzy c-means; GrCC: granular computing clustering.
Figure 5 shows the curve of the evaluation index along with the parameters for GrCC3. From the figure, we can see, there is a mutation point making the evaluation performance of segmented images optimal. The mutation point is the selected granularity threshold ρ. Figure 6 shows the optimal segmented images by GrCC3 evaluated by GCE, VI, and RI. Figure 6(a) shows the segmented image by human, Figure 6(b) shows the segmented image with the minimal GCE by GrCC3, Figure 6(c) shows the segmented image with the minimal VI by GrCC3, and Figure 6(d) shows the segmented image with the maximal RI by GrCC3.

GCE, VI, and RI of image #135069 selected from BSD300 for different parameter ρ.

Segmentations of image #135069 by GrCC3 under different evaluations.

Segmentations of image #3096 by GrCC3 under different evaluations.

Segmentations of image #55067 by GrCC3 under different evaluations.

Segmentations of image #108073 by GrCC3 under different evaluations.
Secondly, images in BSD300 (www.eecs.berkeley.edu/Research/Projects/CS/vision/bsds/), which includes original color images and their human segmentations, is selected to perform segmentations by GrCC. images, such Figure 7, Figure 8, Figure 9, Figure 10, Figure 11, are used to evaluate the performance of GrCC3 because segmentation by GrCC3 is better than GrCC1, GrCC2, FCM, and Kmeans.
Conclusions
A new evaluation of segmentation of color image is used to evaluate the segmentation from the view of set, and the images selected from BSD300 are used to demonstrate the feasibility and superiority of the evaluations. The segmentation experimental results shown that (1) GrCC segmentation is better than Kmeans and FCM from the aspects of GCE, VI, and RI. (2) GrCC with the distance formula (3) is better than GrCC with the distance formulas (1) and (2). Some issues still need further study, such as the adaptive selection of granularity threshold ρ. In this paper, the benchmark image segmentation set, BSD300, is used to verify the feasibility and superiority of GrCC, image target detected by GrCC will be the future research field.
Footnotes
Declaration of conflicting interests
The author(s) declared no potential conflicts of interest with respect to the research, authorship, and/or publication of this article.
Funding
The author(s) disclosed receipt of the following financial support for the research, authorship, and/or publication of this article: This work was supported in part by the Natural Science Foundation of Henan Province of China (182300410145, 182102210132).