
Abstract
Accurate segmentation of leukocytes is a primary and very difficult problem because of the non-uniform color, uneven illumination of blood smear image. An improved algorithm based on feature weight adaptive K-means clustering for extracting complex leukocytes is proposed. In this paper, the initial clustering center is chosen according to the histogram distribution of a cell image; this approach not only improves the clustering effect but also reduces the time complexity of the algorithm from O (n) to O (1). Prior to white blood cell extraction, the color space is decomposed. Then, color space decomposition and K-means clustering are combined for image segmentation. And then adherent complex white blood cells are separated again based on watershed algorithm. Finally, classification experiments based on convolutional neural network were performed and compared with other methods; 368 representative images were used to evaluate the performance of our method. The proposed segmentation method achieves 95.81% segmentation accuracy. The classification accuracy reached a maximum of 98.96%, and the average classification time is 0.39 s. Compared with those in the existing algorithms for WBC, convolutional neural network classification method not only presents obvious advantages but can also be easily improved.
Introduction
White blood cells (WBCs, also known as leukocytes) in peripheral blood and bone marrow cell images are important in auxiliary diagnosis of various diseases, such as AIDS, leukemia, and other blood-related diseases. A certain amount of WBCs is maintained in the human body. If the number of WBCs exceeds the normal range, then health problems may occur. Five main types of leukocytes exist: monocytes, basophils, lymphocytes, eosinophils, and neutrophils (Figure 1). In routine blood tests, traditional counting and morphological analysis of WBCs rely on manual counting and expert analysis, which display low efficiency and strongly involve subjectivity. Therefore, an automated blood cell analyzer for automated classification and morphological analysis of WBCs must be developed. Among the automated methods, flow cytometry is currently the most commonly used technique. However, flow cytometry is costly and cannot automate WBC classification; thus, its clinical applications are limited. In recent years, image processing and pattern recognition, which are low-cost processes, have been gradually improved for morphological analysis and classification recognition of WBCs; additionally, these processes offer a wide range of applications. In an automated classification and recognition system, the primary problems in accurate image segmentation of cytoplasm and nucleus are non-uniform color and uneven illumination, as well as the similarity in color between the cytoplasm and the nucleus.
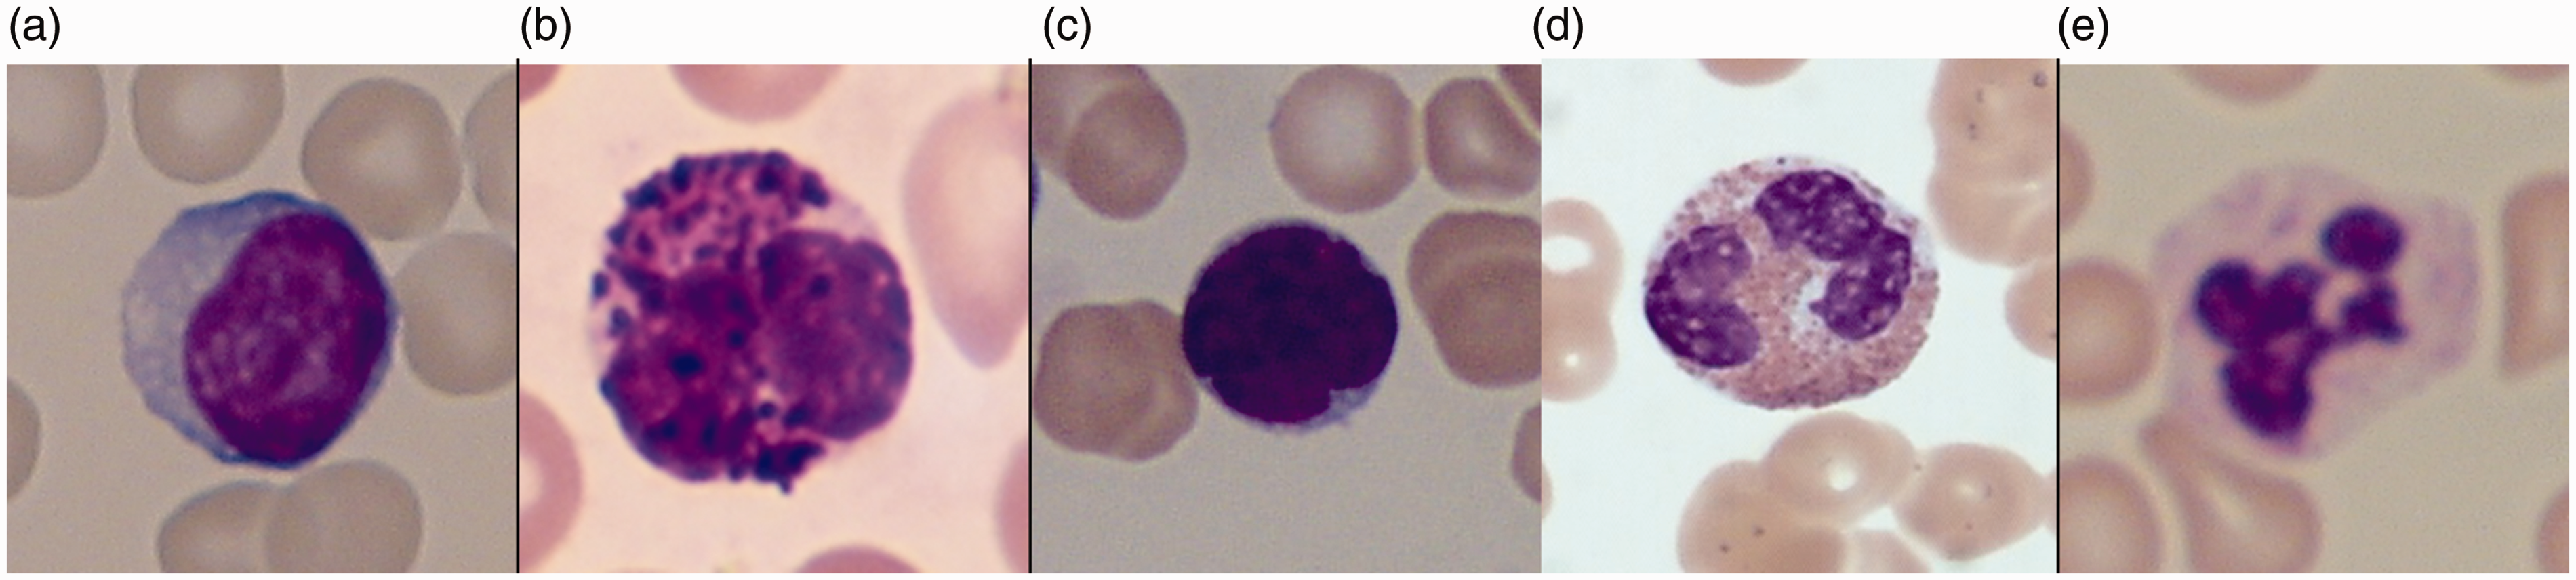
Five types of leukocytes: monocytes, basophils, lymphocytes, eosinophils, and neutrophils.
To improve WBC segmentation and identification, researchers have recently proposed a series of algorithms for accurate segmentation and classification of WBCs. For example, in Dorini et al., 1 Huang and Hung 2 and Duan and Yu, 3 the nucleus enhancer is proposed to segment the interested region by enhancing the region of the nucleus and suppressing the other region of the blood smear images. Putzu and Ruberto 4 studied a method by combining the thresholding algorithm with the SVM classification algorithm based on CMYK color space. The method demonstrates high speed and precision but poor robustness. Zheng et al. 5 combined expectation maximization clustering algorithm and SVM for leukocyte split and classification, and this approach relies on a selected color feature vector. Wang and Su 6 , Syed et al. 7 and Ko et al. 8 used the GVF snake algorithm and SVM algorithm to delineate and classify WBCs, but the GVF snake algorithm is limited by initial contour selection, and overlapping structures influence the performance of the algorithms. In Liu et al., 9 the author suggested a method that employs a clustering algorithm, color space conversion, and labeling watershed algorithm to segment peripheral blood and bone marrow WBCs. Researchers have established a K-means shift clustering algorithm in the color space to study the cell image segmentation.10–12 This method considerably relies on initialization data and other parameters. The clustering results are closely linked to the number and shape of the target data. When the color of the cytoplasm obviously differs from that of the nucleus, the algorithm cannot accurately detect all WBCs under certain conditions. Jianwei et al., 13 Arslan et al., 14 Qing et al. 15 and Zhang et al. 16 used a color space and a morphological algorithm to extract WBCs and then applied convolutional neural network (CNN) for WBC classification. The experimental results showed that CNN presents obvious advantages compared with the existing WBC classification algorithms.
Although many methods have been suggested, problems on WBC segmentation still exist. These problems are mainly due to different color brightness of cell images, presence of impurities, various shapes of WBC, and analogous color between stained cytoplasm and red blood cells. By far, the segmentation accuracy of the existing methods cannot meet the actual clinical needs, so a considerable amount of work in the field of WBC segmentation is warranted. To address this problem, we propose an improved K-means image segmentation algorithm that effectively splits the densely adhered WBCs, and this algorithm is highly accurate. Finally, CNN is utilized for WBC classification.
Related theoretical research
Improved FWSA-KM clustering algorithm
To achieve a low anti-noise performance of the clustering algorithm, Tsai and Chiu
17
proposed the use of feature weight adaptive computing (referred to as FWSA-KM algorithm) to improve the K-means clustering algorithm. The algorithm requires fewer parameters without reducing the efficiency of the algorithm, and to improve the robustness of the algorithm, they improve the K-means clustering algorithm based on non-Euclidean distance and transform the Euclidean distance
In FWSA-KM algorithm, the initial clustering center is randomly assigned, influencing the clustering effect. Numerous researchers (e.g. Fu et al.
18
and Li and Tian
19
) have improved this algorithm. For a gray level image, the classification number is m, and the selected gray level (normalized) is generally

Improved K-means algorithm. (a) Gray level image (b) gray level histogram (c) clustering result.
In this study, the initial clustering center is selected according to the gray-level histogram distribution of the cell image, and the initial clustering of all pixels in the image is performed according to the nearest neighbor principle. Prior to the iteration, we only need to create a histogram statistics of the cell image and then use the information provided by the histogram to shift from processing each point to processing each gray level, greatly reducing the complexity of the algorithm. The time complexity is O (1).
In Figure 2(a), when m = 3, the initialization points are 0.33, 0.66, and 1. The initial clustering center points are chosen according to the gray-level histogram: 0.25, 0.5, and 0.75. As shown in Figure 2(b), the initial clustering center of the improved algorithm is close to the gray-level distribution. The gray level of each class of pixels is taken as the cluster center of the class point, and the image segmentation result is shown in Figure 2(c).
CNN
CNN is an efficient recognition method that is recently developed and being intensively studied in many scientific fields now, especially in pattern recognition, because the network avoids complicated image preprocessing. Moreover, the original image can be directly used as input. For these reasons, CNN has been widely used.
CNN structure mainly consists of an input layer, a convolution layer, a sampling layer, a connection layer, and an output layer. In the input layer, an image is classified, and then the corresponding features are extracted from the volume. To accelerate the learning speed, we must reduce the number of neurons and keep useful information in the sampling layer. The connection layer inputs the classification result to the output layer through the activation function (such as sigmoid function). The dimension of the output layer is equal to the number of categories. Figure 3 shows the CNN structure.

CNN structure. CNN: convolutional neural network.
Extraction of leukocytes
Two sets of data were used in this experiment. The first group of data was obtained from the First Affiliated Hospital of Fujian Medical University. Our database consisted of 350 stained blood smear images. Experimental smears were prepared in the hospital by using conventional methods and then stained with Wright stain. All WBCs collected from the peripheral blood and bone marrow cell images were identified and classified by laboratory specialists. In cell image acquisition, an OLYMPUS BX51 microscope and a Nikon high-performance color digital camera were used. The blood smears were observed under a microscope at 100× magnification. The field of view was first set in an area where WBCs were concentrated and then the microscope was shifted to the camera mode. The microscope was used in fine-tuning to obtain a better view of the WBCs. Finally, a digital camera was used to capture cell images. Collected images of peripheral blood and bone marrow cells are RGB color images with a resolution of 2080 × 1542. In the second set of data, 368 images were downloaded from the ALL-IDB datasets. 20 The JPEG images are available in RGB format with three resolutions: 2592 × 1944, 1712 × 1368, 1226 × 652.
To verify the practicability of this algorithm, we tested different types of peripheral blood and bone marrow cells, and extracted some representative images for further analysis. Every WBC image has at least one WBC, and a number of them may have several WBCs.
Selection of color model
Figure 4 shows the color cell images of peripheral blood cells and bone marrow. The figure shows that the nuclei of WBCs display a darker shade of purple or dark blue compared with the surrounding blood cells and cytoplasm, which stained red.

Color peripheral blood cells and bone marrow cell images.
Figure 5 shows that the cytoplasmic and WBC regions of the hue component (H) and the saturated component (S) of the treated WBCs display a strong contrast with the background. Based on the above characteristics, a suitable threshold value in the subsequent image segmentation can be set in S and H components to roughly extract the nuclear and leukocyte regions from the cell image.

HSI component of blood cell image. (a) H component (b) S component (c) I component.
WBC extraction
The selection of color model is similar to the selection of nucleus; a color model is selected by observing the different components of different color models. In Figure 5(c), the H component of HSI color model can distinguish the location of WBCs, and the effect of clustering is greatly improved.
As Figure 6 shows, after image segmentation of the improved K-means cluster, the small area of WBCs is extracted and the existing small noise particles are corrected by using the de-noising algorithm again. Moreover, the extracted WBCs display holes and some missing edges; thus, we use hole-filling and expansion to restore the morphological structure of the WBCs.
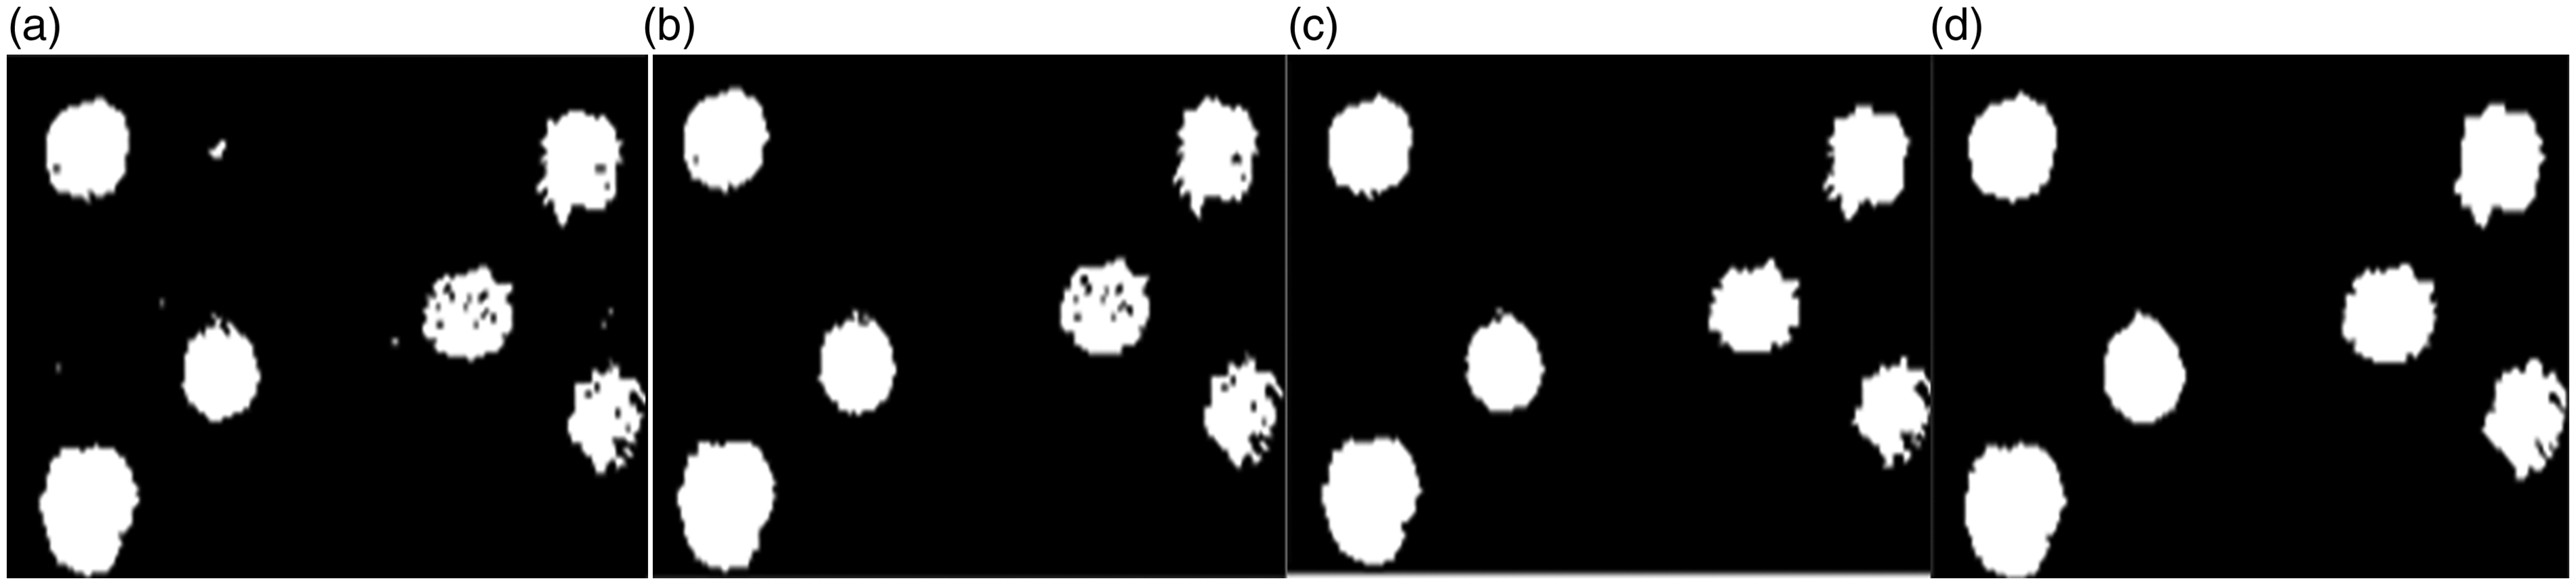
WBCs extraction process. (a) Proposed algorithm (b) de-noising (c) hole filling (d) expansion repair. WBCs: white blood cells.
For the WBCs adhered together, as shown in Figure 7, we first perform image segmentation by using the proposed algorithm, and then the adhesion parts were divided by using watershed algorithm again.

Touching WBCs separation. (a) Original image (b) proposed algorithm (c) de-noising (d) watershed. WBCs: white blood cells.
Classification of WBCs based on CNN
Input image preprocessing
Traditional CNN as object detection and recognition needs to use a variety of scales and a large number of sliding windows to confirm the location of the object, and then classify it, which will increase the computational complexity. In view of this shortcoming, the improved K-means clustering is used to separate the leukocytes from the background, then each leukocyte is extracted as input to CNN, as shown in Figure 8.

CNN input. CNN: convolutional neural network.
CNN parameter setting
The first layer: input layer, single channel input, the color image is converted to grayscale image as input (taking neutrophils as an example).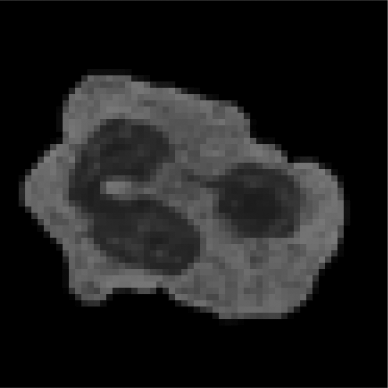
The second layer: convolution layer, convolution kernel size is 7, convolution kernel number is 6, and the output is 6 feature diagrams.
The third layer: sampling layer, using the step value of 2, subsampling 6 feature maps.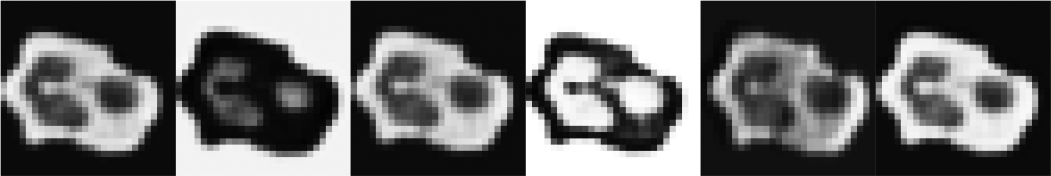
The fourth layer: convolution layer, convolution kernel size is 5, convolution kernel number is 12, and the output is 12 feature diagrams.
The fifth layer: sampling layer, using the step value of 2, subsampling 12 feature maps.
The sixth layer: convolution layer, convolution kernel size is 5, convolution kernel number is 18, and the output is 18 feature diagrams.
The seventh layer: sampling layer, using the step value of 2, subsampling 18 feature maps.
The eighth layer: the connection layer, using a full connection method, each feature map is converted to row vector (length is 4 × 4×18 = 288).
The ninth layer: the output layer, through the Sigmoid activation function, converts the characteristic row vector to the output of 5 rows and 1 column.
0.0001
0.0001
8.67e-07
0.0349
0.9985
Experimental result and analysis
To quantitatively analyze the algorithm performance in WBC classification, 368 microscope images of ALL-IDB database were used as the testing data. They contain one or more of the five types of WBCs. The performance of the algorithm is shown in Tables 1 and 2.
Objective evaluation of classification results.

Cost time (unit: s) comparison for classification.

CNN demonstrated an obvious effect on WBC classification (Tables 1 and 2), and such classification effect is better than that in other samples. CNN easily demonstrates the phenomenon of over fitting, especially in the treatment of basophils, eosinophils, and mononuclears, which is one of the reasons that in this work, CNN is constructed using nine layers, and many parameters are considered; moreover, CNN demonstrates the strong classification ability, although only five of WBCs exist. In the training process, no improvements were made regarding overfitting, such as dropout 21 ; another reason is that the number of samples is too small, and the most effective method to prevent network overfitting is to increase the number of samples. 22 Therefore, compared with the existing classification algorithm, CNN classification method not only presents obvious advantages but also presents a considerable room for improvement.
Conclusion
This study used the improved K-means clustering algorithm and watershed algorithm to extract WBCs, and then CNN was used to classify WBCs. The precision and cost time of CNN make it obviously advantageous over other methods. Compared with other classification algorithms, CNN does not require too much preprocessing. It can independently determine the characteristics of a filter compared with other algorithms, which require manual determination of features. Therefore, CNN does not rely on a priori knowledge and artificial features, which are a major advantage of CNN. Moreover, CNN can be easily improved.
Footnotes
Authors’ contributions
Liqun Lin worked on the design of the study, carried out the laboratory experiments, analyzed the data, interpreted the results, and wrote the manuscript. Bolin Chen participated in consulting literature, data preparation, analysis and collation. Weixing Wang is my doctoral tutor. All authors approved the final version of the manuscript.
Declaration of Conflicting Interests
The author(s) declared no potential conflicts of interest with respect to the research, authorship, and/or publication of this article.
Funding
The author(s) disclosed receipt of the following financial support for the research, authorship, and/or publication of this article: This work was supported in part by the National Natural Science Foundation of China (No. 61170147) and Fujian Provincial Education Department (No. JAT160075). The authors also acknowledge the support from Educational Commission of Fujian Province through Grant No. JT180055.