
Abstract
The safety of Automated Driving Systems (ADS) operating as Mobility as a Service (MaaS) depends on multiple factors in addition to the vehicle’s functionality, reliability, and performance. Currently, no comprehensive approach has been formally developed to identify operational safety hazards and define the operational safety responsibilities of the key agents involved in Level 4 (L4) ADS MaaS operations. This work develops and applies a structured hazard identification methodology for this operation. The methodology leverages and complements the strengths of various hazard identification and modeling methods, including Event Sequence Diagram (ESD), Concurrent Task Analysis (CoTA), System-Theoretic Process Analysis (STPA), and Fault Tree Analysis (FTA). The methodology is applied to analyze the operation of a fleet of L4 ADS vehicle fleets without a safety driver, monitored and supervised by remote operators. The results highlight the fleet operator’s role in ensuring the correct vehicle operation and preventing and mitigating incidents. The analysis demonstrates the developed methodology’s strengths and suitability for operational safety analysis of complex systems’ operations, considering the inherent complexity of the interactions between multiple human and machine agents.
Keywords
Introduction
Autonomy can be defined as a system’s ability to make independent decisions and to adapt to new circumstances to achieve an overall goal. 1 Multiple research and industry efforts have focused on developing Automated Driving Systems (ADS), resulting in a rapidly increasing number of commercial enterprises testing and deploying ADS-equipped vehicles worldwide for passenger and goods transport. Reducing human error in traffic incidents is often cited as one of the most important factors for developing ADS, as well as more accessible and environmentally friendly transport systems.2–4 Currently, vehicle automation capabilities are categorized by the Society of Automotive Engineers (SAE) under six levels, from Level 0 to Level 5, depending on the extent of driving support and automated driving features capabilities. 5 As the Level of Autonomy or Automation (LoA) increases, so does the complexity of the functions the system should perform, for example, situational assessment and risk-informed decision-making.
At the current stage of development, shorter-time goals include deploying Level 4 (L4) vehicles at a commercial scale for Mobility as a Service (MaaS) applications.6,7 By SAE definition, L4 ADS are capable of performing all Dynamic Driving Tasks (DDT) – defined as the real-time operational and tactical functions required to operate a vehicle in on-road traffic 5 – under certain conditions and locations specified in their Operational Design Domain (ODD)8,9 and implementing fallback strategies in the event of emergencies. The safety of ADS operations depends on many factors, including appropriate road infrastructure, wireless connectivity, and interaction with other road users.10,11 The main safety-related tasks L4 ADS vehicles must perform are: (a) operate within and enforce the ODD, (b) perform safety-adequate DDTs relying on real-time conditions, and (c) implement DDT-fallback strategies to achieve Minimal Risk Conditions (MRC) when required. However, the implications of enforcing SAE level definitions, ODD requirements, fallback strategies, and MRC mechanisms on operational safety are still unclear, particularly in the case of driverless operations.12–14 Recent incidents involving L4 ADS vehicles blocking fire trucks and buses, causing traffic disruptions, unfortunate interactions with law enforcement and first responders, and recent severe incidents with pedestrians continue to highlight the need to approach safety from an operational perspective.15–17
The safety of autonomous systems has been discussed from several perspectives other than the technological and engineering challenges their deployment carries, including ethical, social, and legal aspects.18–21 Yet, ADS’s system risk and safety research has mostly focused on demonstrating functional safety, system reliability, or potential increases in traffic safety.22,23 In an evolving technological and regulatory environment, scenario-based simulation and drive testing have also become essential tools to provide system-specific empirical safety evidence.24–26 Related research has focused on modeling ADS vehicle interactions with other road users and risk-related aspects through game-theoretic approaches or data-based methods.27,28 While those aspects are undoubtedly important for a safe operation, organizational safety and human-related issues will also play a significant role in ensuring the operational safety of L4 ADS vehicles.29–32 Yet, operational aspects of the fleet concerning how it should be designed to reduce risks, prevent hazards from happening, and mitigate possible consequences have not yet been fully addressed.
Risk management frameworks play a significant role in guiding and informing the design of safety-critical systems, operating procedures, and safety policies. Multiple traditional hazard identification and scenario modeling approaches serve as the foundations of probabilistic risk assessments (PRA) of complex systems. 33 The importance of comprehensive hazard identification and scenario-based analysis in risk management cannot be understated, particularly in the case of new and innovative technologies with limited operational experience and field data. The emergence of autonomous and highly automated systems with limited explainability and transparency introduces additional challenges to analyze their functions, behavior, and failures, and their implication on risk and safety. Hence, it is highly relevant to explore methodological improvements that allow system developers and operators to identify potential hazards and improve their systems’ safety at different levels– fleet, system, or functional levels. Traditional approaches employed in research and industry to identify, analyze, and model potential hazardous scenarios include tools such as conventional hazard analysis and risk assessment (HARA) and hazard identification (HAZID), fault tree analysis (FTA), event trees analysis (ETA), Event Sequence Diagrams (ESD), failure mode and effect analysis (FMEA), hazard and operability studies (HAZOP), and, more recently, Bayesian networks (BNs).34,35 These methods are confronted with an increasingly complex landscape with the growing adoption of autonomous functions, capacities, and technologies, which can exhibit intricate subsystem interactions, evolving feedback loops, and unexpected emerging properties. Conventional methods usually focus on multiple aspects of complex systems from isolated perspectives, for example, human reliability, software failures, and hardware reliability. Therefore, these methods may not be capable of adequately modeling autonomous systems and their interactions with open-world environments. 36
Techniques such as Concurrent Task Analysis (CoTA) and System-Theoretic Process Analysis (STPA) have been recently proposed to identify and model interactions and emerging behaviors between subsystems and complex operational environments.36,37 STPA is based on system theory and is increasingly employed in complex systems, including automated driving, software engineering, maritime and aviation industry, and nuclear power plants (NPPs).34,38–44 When compared to other traditional methods, the advantages of STPA lie in its potential to identify unsafe or unintended interactions even when no explicit failures have occurred in the system.45,46 The CoTA method was developed to specifically model human-system interactions from a task analysis perspective.36,47 This process involves a functional decomposition of tasks each agent must perform to achieve common goals, following an extension of the cognitive model IDA (Information, Decision, and Action). 32 These methods can be employed to conduct a detailed analysis of system interactions, dependencies, and potential undesired behaviors, additionally introducing elements of causal relationships and providing a pathway to design safety countermeasures.
It has long been recognized that to achieve an adequate level of completeness, hazard identification, and scenario modeling processes should employ various techniques, leveraging and complementing the strengths and limitations of each method.48–50 This is particularly relevant for high-risk industries incorporating autonomous functionalities, where interactions between hardware, software, and human elements require profound analysis. For instance, hazard identification approaches integrating STPA with FMEA have been developed to elicit safety requirements in modern software-intensive systems. 51 Similarly, a combination of STPA with Goal Structuring Notation (GSN) was used to derive safety arguments for assurance cases. 52 As STPA provides limited information about consequences, it can benefit from combinations that allow risk quantification. For instance, combinations of STPA and BN have been explored to develop supervisory risk control frameworks for autonomous systems53,54 and remote pilotage operations in maritime applications, 55 as well as for reliability assessment applications in autonomous vehicles. 56 Likewise, STPA and FTA have been combined to identify common cause failures of digital safety systems 57 and for digitalization efforts in NPP contexts. 58 A system-oriented approach through STPA can also analyze causal factors for scenario-based analysis 59 ; however, other methods focus on hazard scenario modeling as a base for risk quantification efforts. For example, frameworks integrating FTA and BN have been used for collision risk analysis in maritime operations 60 and dynamic risk analysis in NPPs. 61 Alternatively, ESDs, FTA, and BNs have been integrated into the Hybrid Causal Logic methodology 62 and applied to autonomous vehicles 63 or oriented toward human reliability analysis in NPPs. 64 Similar approaches have also been applied to dynamic risk assessment of third-party damages in natural gas pipelines. 65 Additionally, ESDs have been combined with FTA, BN, and CoTA to represent interactions between hardware and software failures,63,66,67 as well as human errors.47,68 Indeed, ESDs and the natural integration to success- and failure- oriented analysis through CoTA and FTA can help set the overall context and elicit root causes other than those related to the correctness of control actions in the system provided by STPA.
Hazard identification provides a critical foundation upon which risk assessment tools are employed to estimate the risk a certain technology, system, or operation poses for users, operators, and society. Effective hazard identification methodologies are key in defining safety expectations and providing a robust basis for future risk quantification efforts. The importance of this increases when these systems are expected to operate in open-world environments, subject to multiple interactions with other human and machine agents. Currently, there is no clear or comprehensive approach to define the risk reduction measures or operational safety responsibilities of the key organizations involved in the deployment of L4 ADS-equipped vehicles. Fleet operators play a central role in MaaS operations, and it is expected that their operational safety responsibilities will be determined by their relationship with ADS developers, vehicle manufacturers, and regulatory entities. The first step in defining these safety responsibilities is, thus, identifying the hazards associated with the system’s operation.
This work presents a structured hazard identification methodology developed to study the operation of complex systems. This approach combines traditional and modern risk assessment techniques to model system functions and interactions, including ESDs, FTs, CoTA, and STPA. The methodology leverages and complements the strengths of these methods to address the inherent complexity of multiple human-machine interactions present in complex socio-technical system operations. Combining scenario- and control theory-based methodologies allows tracking the evolution of hardware, software, and human interactions, the development of latent failures, and a link toward safety countermeasure design and task allocation strategies. The main goals of the methodology are to identify hazards within high-level operational scenarios, associate them with risk contributors to provide a link between key safety-related tasks and agents, and provide a foundation for the development of risk assessments and layered-safety operational policies. This approach provides practical insight for organizations operating, managing, and designing complex systems aiming to conduct risk assessments and identify key risk mitigation measures. In this work, the methodology is applied to derive operational safety responsibilities of fleet operators involved in L4 ADS MaaS operations. This work focuses on the safety implications of human-machine agent interactions and the role of the fleet operator in ensuring operational safety. The implementation of the methodology is exemplified through the analysis of the ADS vehicle operation during a trip with passengers.
The structure of the paper is as follows. Section 2 presents the proposed hazard identification methodology, divided into system modeling, scenario modeling, and hazard identification phases. Section 3 demonstrates the use of this methodology for L4 ADS fleets for MaaS providers. The case study focuses on the operational phase when the vehicle drives on-route to its destination with onboard passengers. Section 4 discusses the proposed methodology’s main results, advantages, and limitations. Finally, Section 5 presents the main conclusions of this work.
Hazard identification methodology
The use of risk assessment frameworks to guide and inform safety and policy requirements has been thoroughly explored in the past decades.69–71 Risk management is an iterative process, where the identification of hazards, hazard scenario modeling, quantification of risk, and assessment of risk criteria compliance can be continuously updated based on new information, operational experience, and developing technologies. A general risk management framework is presented in Figure 1, highlighting the hazard identification and scenario modeling stages. 70 These are the focus of this work and are crucial to developing comprehensive qualitative and quantitative risk assessments.
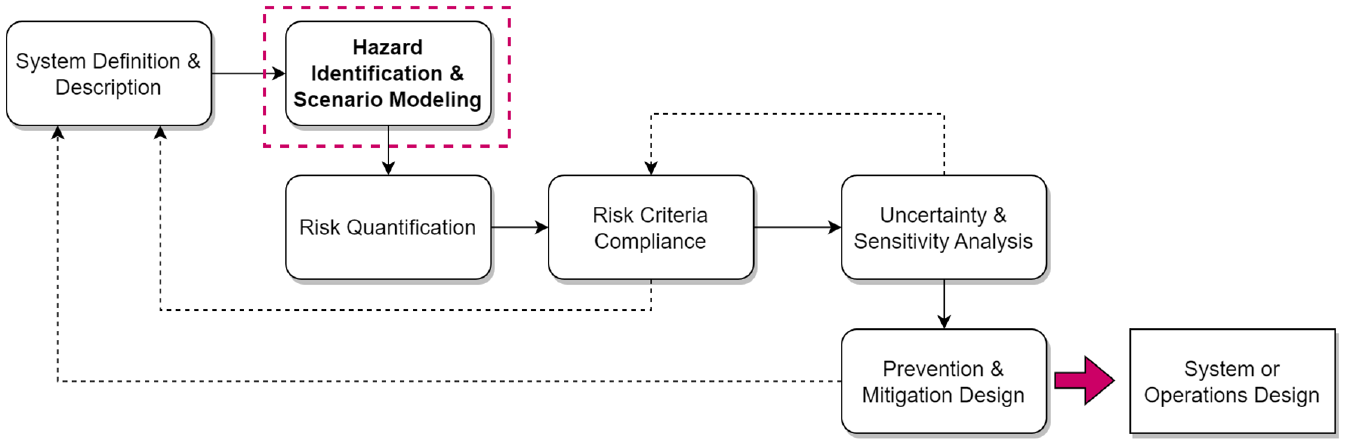
General risk management framework outline.
Identifying hazards and the risk scenarios that develop from them during operation is critical to determine if the system’s safety barriers are sufficient to prevent or mitigate potential undesired consequences. Using Kaplan and Garrick’s definition, risk scenarios are uniquely characterized by sequences of hazardous event or chain of hazardous events that occur within a specific context leading to an undesired consequence. 72
In this work, hazards are defined at a sub-system level, that is, the underlying source of risk stems from a function or task that was not performed as expected (e.g. an undetected sensor failure) which in a certain context can lead to an undesired consequence (e.g. collision with an object on the road or other road user). Therefore, a risk scenario is constructed from a sequential combination of hazard scenarios that represent the failure path of a key event (e.g. detecting a sensor failure and implementing adequate failure mitigation strategies). 73 For instance, the hazard scenario“the ADS fails to detect that a fallback is required” includes a breadth of specific situations with different aggravating elements with distinct likelihoods (weather conditions, other road users, conditioning system failures, etc.) that lead to consequences with varying severity, such as an interrupted trip or a collision with other road users. These hazard scenarios can play a role in multiple risk scenarios and may develop either from explicit system failures or from unsafe subsystem interactions, which in other contexts may not have led to undesired consequences.
As the system’s complexity or the environment in which it operates increases, so does the number of potential hazard and risk scenarios. In this regard, achieving scenario completeness is a long-desired goal, subject to the sophistication of the available modeling tools. 71 However, conventional hazard identification and modeling methods frequently focus on specific aspects of the system, isolating each element for in-depth analysis and, therefore, neglecting the importance of hardware, software, and human interactions.71,74 The methodology proposed in this work aims to leverage the benefits of different methods used for hazard identification and scenario modeling. The following sections describe the main characteristics of these methods and present the strategy to combine these for a structured analysis of a complex system.
Methods employed
A frequent approach to model risk scenarios is to employ ESD. This traditional hazard analysis method can be defined as generalized event trees (ETs), allowing better representation of dynamic systems. 35 ESDs depict a sequence of pivotal events stemming from a common initiating event and leading to different end-states through success or failure paths. The level of detail ESDs provide depends on system breakdown and how hazardous scenarios propagate local effects into system-level events. The quantification of ESDs estimates each outcome’s frequency based on the initiating event’s frequency and the intermediary events’ probabilities. 47 Figure 2(a) presents a simple ESD, depicting how the success or failure of events A and B may lead to different end-states, representing either a successful or failed scenario.
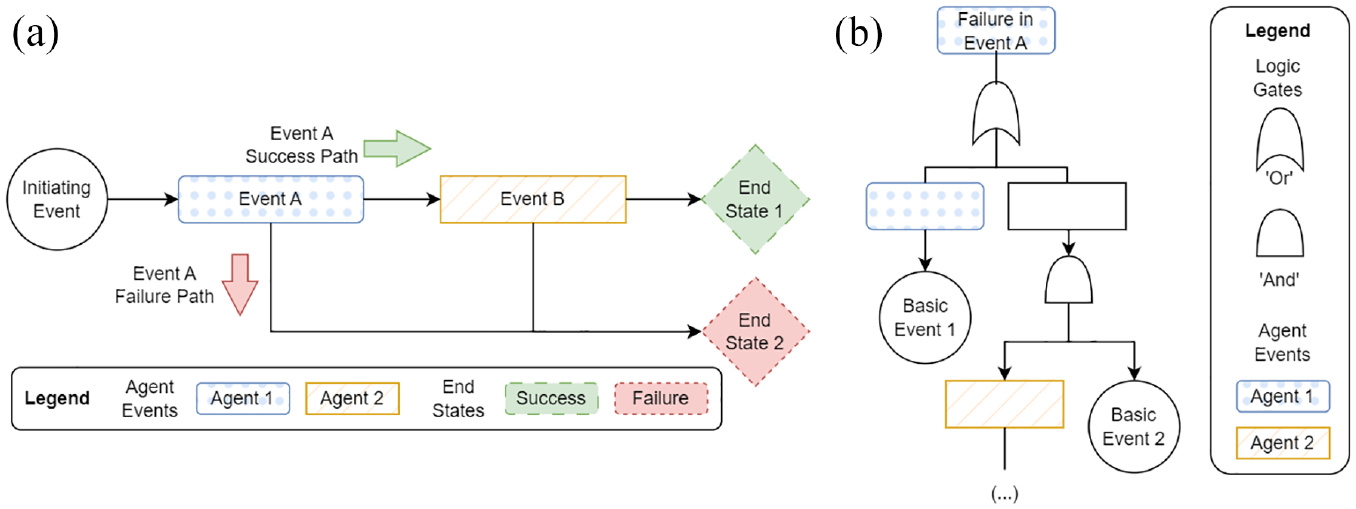
Traditional scenario modeling tools: (a) example ESD and (b) example FT.
The intermediary event probabilities are often expressed through FTA. Fault trees (FTs) represent the logical hierarchy of a system-level failure based on the functional decomposition of failure events. The assessments may be qualitative or quantitative, depending on the availability of data to characterize the probability of occurrence of each sub-event. The primary outcomes of an FTA are systematically identifying causes (i.e. a combination of events) that lead to an undesirable event (denominated as the Top Event), obtaining the probability of occurrence for the events based on Boolean algebra, and identifying critical combinations of events that lead to the Top Event. 75 As discussed in, 34 modeling the functionality of an ADS relying only on classical FTs is untenable, as faults may be triggered or propagated by external environmental conditions as opposed to internal faults at lower levels of description. However, the strengths of the hierarchical structure may still be employed when addressing subsystem or component-level faults. In Figure 2(b), the “Top Event: Failure in Event A” is expanded so that lower-level failure events (of the same agent or not) can be identified through logic gates.
The success of each ESD event may also be expressed as a function of the series of tasks that need to be completed in sequence or concurrently. CoTA is a novel method developed to model the tasks this in the context of the Human-System Interaction in Autonomy (H-SIA) framework.36,47 It is a flexible method for complex system analysis based on Task Analysis (TA) that models the interactions between subsystems or agents working toward a common goal. The decomposition of system-level goals into sub-goals analyzes each agent’s expected behavior and performance. These sub-goals are hierarchically organized through plans, indicating the order in which the tasks must be performed to achieve the system-level goals. The underlying methodology extends the cognitive model IDA (I-Information, D-Decision, A-Action) to human and autonomous systems.32,36 This division of tasks into phases is fundamental to identifying different failure modes for each agent and emergent failures and/or failures arising from unsafe interactions. The tasks can be categorized as sequential, parallel, interface, and the newly introduced trigger tasks, as follows:
Sequential tasks: Tasks that must be performed sequentially to achieve the specified goals.
Parallel tasks: Groups of tasks that must be performed concurrently to achieve the specified goals. These frequently refer to supporting tasks, that is, they are not directly related to the events in the ESD but are necessary for executing the other tasks and the interaction between the agents.
Trigger tasks: Specific tasks at the lowest level of redescription that, when completed, provide the necessary input for other tasks to be performed during the same operational phase. The triggered tasks can be located at higher redescription levels and belong to different agents. Note that the triggered tasks only take place depending on the outcome of the trigger task.
Interface tasks: Specific tasks at the lowest level of redescription that, when completed, provide the necessary input for other tasks from different agents during the same operational phase to be performed adequately.
The CoTA analyzes the tasks involved in all the ESD events associated with the participating agents to: (a) identify the specific subsystem/component required for the task’s success, (b) identify interface and trigger tasks, and (c) analyze the propagation of failure. The granularity of task descriptions depends on system knowledge as well as a series of stop rules related to IDA. 47 This task decomposition approach is key to identifying each agent’s role in ensuring system safety, as well as potential sources of errors or failures arising from the interactions between multiple agents. Figure 3(a) shows an example of CoTA models built for the agents participating in the example ESD (Figure 2(a)). Interface and trigger tasks are depicted by distinct figures, while sequential (B.1 –> B.2) and parallel (A.1 // A.2) tasks are shown in the agents’ plans.
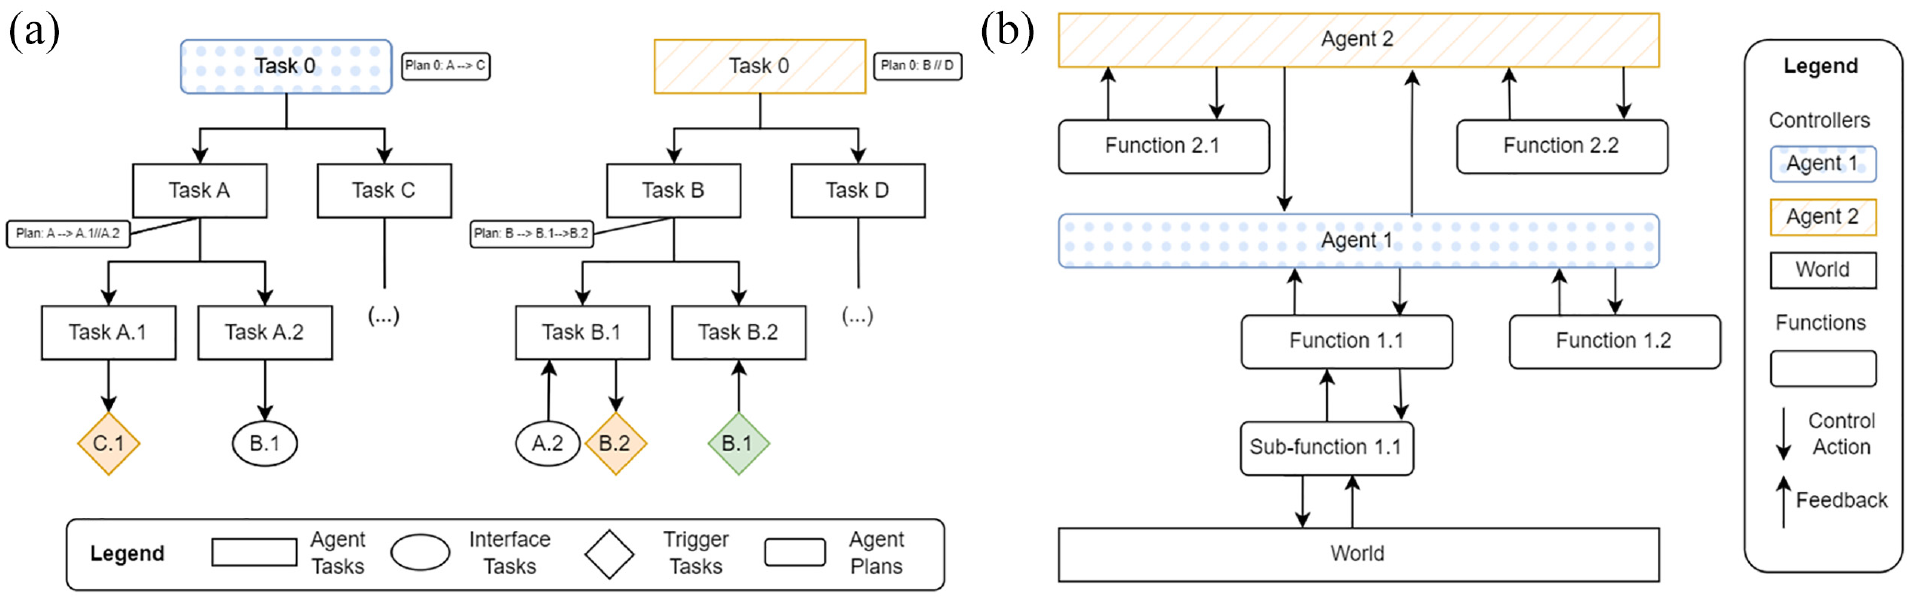
Novel hazard identification methods: (a) example CoTA diagram and (b) example STPA diagram.
Another approach that has gained popularity to identify hazards and corresponding mitigation measures in complex systems is STPA. STPA is a method based on the STAMP (System Theoretic Accident Model and Processes) model, 76 as well as systems and control theory. It considers that hazards arise from uncontrolled or unsafe interactions between components, subsystems, and the environment. 37 In this context, hazards arise from failure mechanisms describing (i) required control actions not provided; (ii) an incorrect control action provided; (iii) a control action provided in an incorrect time or sequence (too early or too late); or (iv) a control action applied for an incorrect duration (too short or too long). The flexibility of the STPA framework allows for defining the system at varying levels of complexity and detail depending on the study’s objective.
A central element of the STPA model is the development of a control structure diagram that illustrates the functional interactions between subcomponents and feedback control loops. This diagram is key to identify unsafe control actions (UCA) that may breach the system-level constraints and lead to loss scenarios. As a hazard identification methodology, STPA is founded on the concept that an effective control structure can enforce the system-level constraints to avoid system-level hazards. STPA provides insight into causal factors leading to the UCAs (e.g. a control action provided in the wrong context). Determining how hazards may originate and propagate through the system, challenging the safety barriers that constrain unwanted behaviors, is used to identify preventive or mitigative countermeasures. Thus, identifying and documenting the UCA may lead to safer designs and system modifications.49,53 An example of a hierarchical control structure is shown in Figure 3(b) showing how two agents interact with the environment (world).
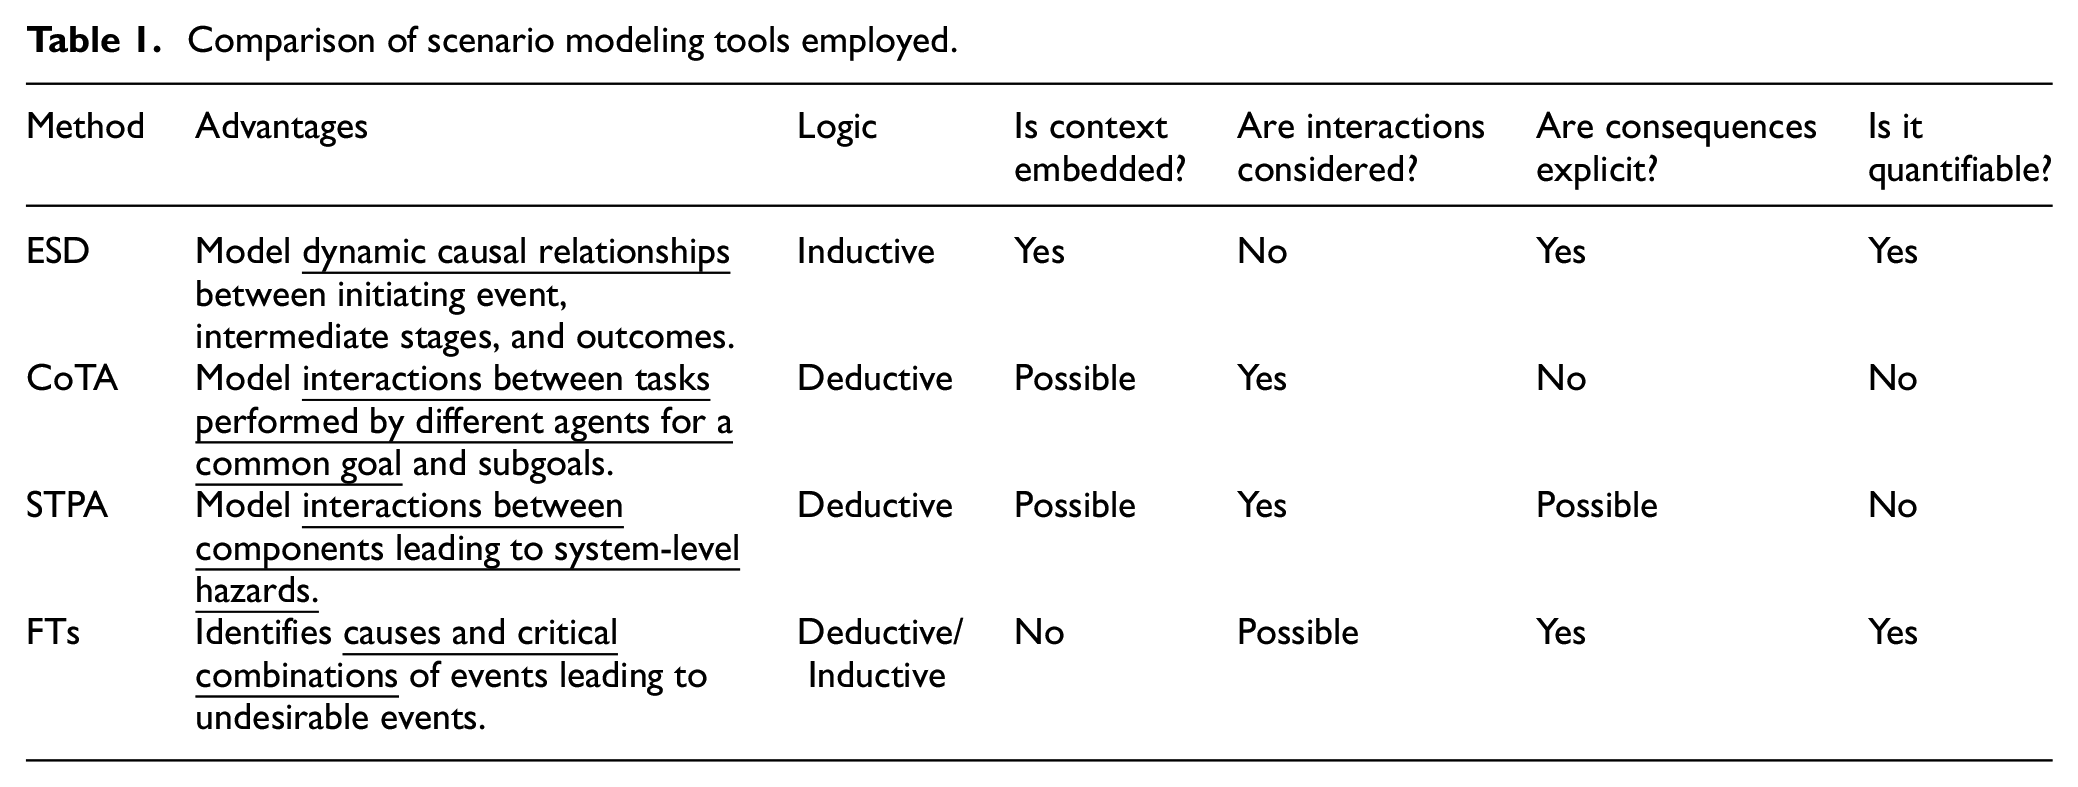
Table 1 summarizes the methods used, their main advantages, and their characteristics. These methods can be applied to analyze different qualitative and quantitative aspects of failures arising from software, hardware, procedures, and human elements. While integrations between ESDs and FTs have played a significant role in risk modeling and quantification, these may struggle to represent function interactions or dependencies efficiently. Thus, CoTA and STPA approaches provide an alternative to elicit the nature of functional interactions even if quantification (e.g. event probability or frequency) is not directly embedded in them.
Comparison of scenario modeling tools employed.
Proposed methodology
The proposed methodology for complex systems’ operations hazard identification consists of 10 steps, organized into three overall stages:
I.
II.
III.
Hazard modeling techniques and framework integration.
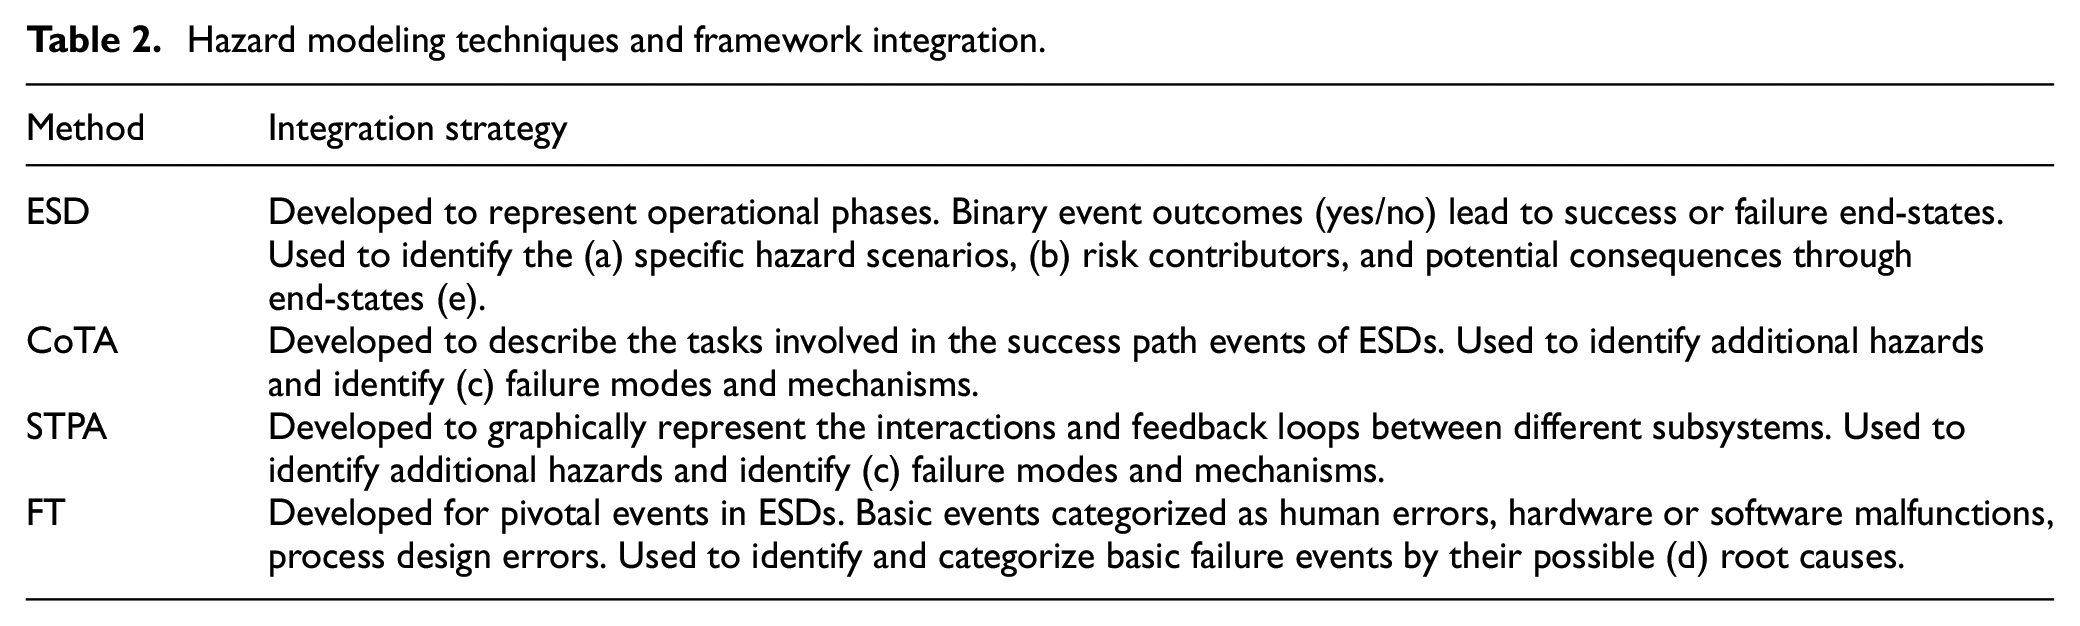
Figure 4 presents an overview of the hazard identification methodology and the main outputs of each stage. Each stage consists of interdependent steps that are designed to be implemented in order (as read vertically from top to bottom). These steps and the implementation approach are described in the following sections. Note that some steps may be performed concurrently (shown at the same horizontal level). For example, Steps 3 and 6 may be developed in parallel, but Steps 4 and 5 must be implemented after Step 3.
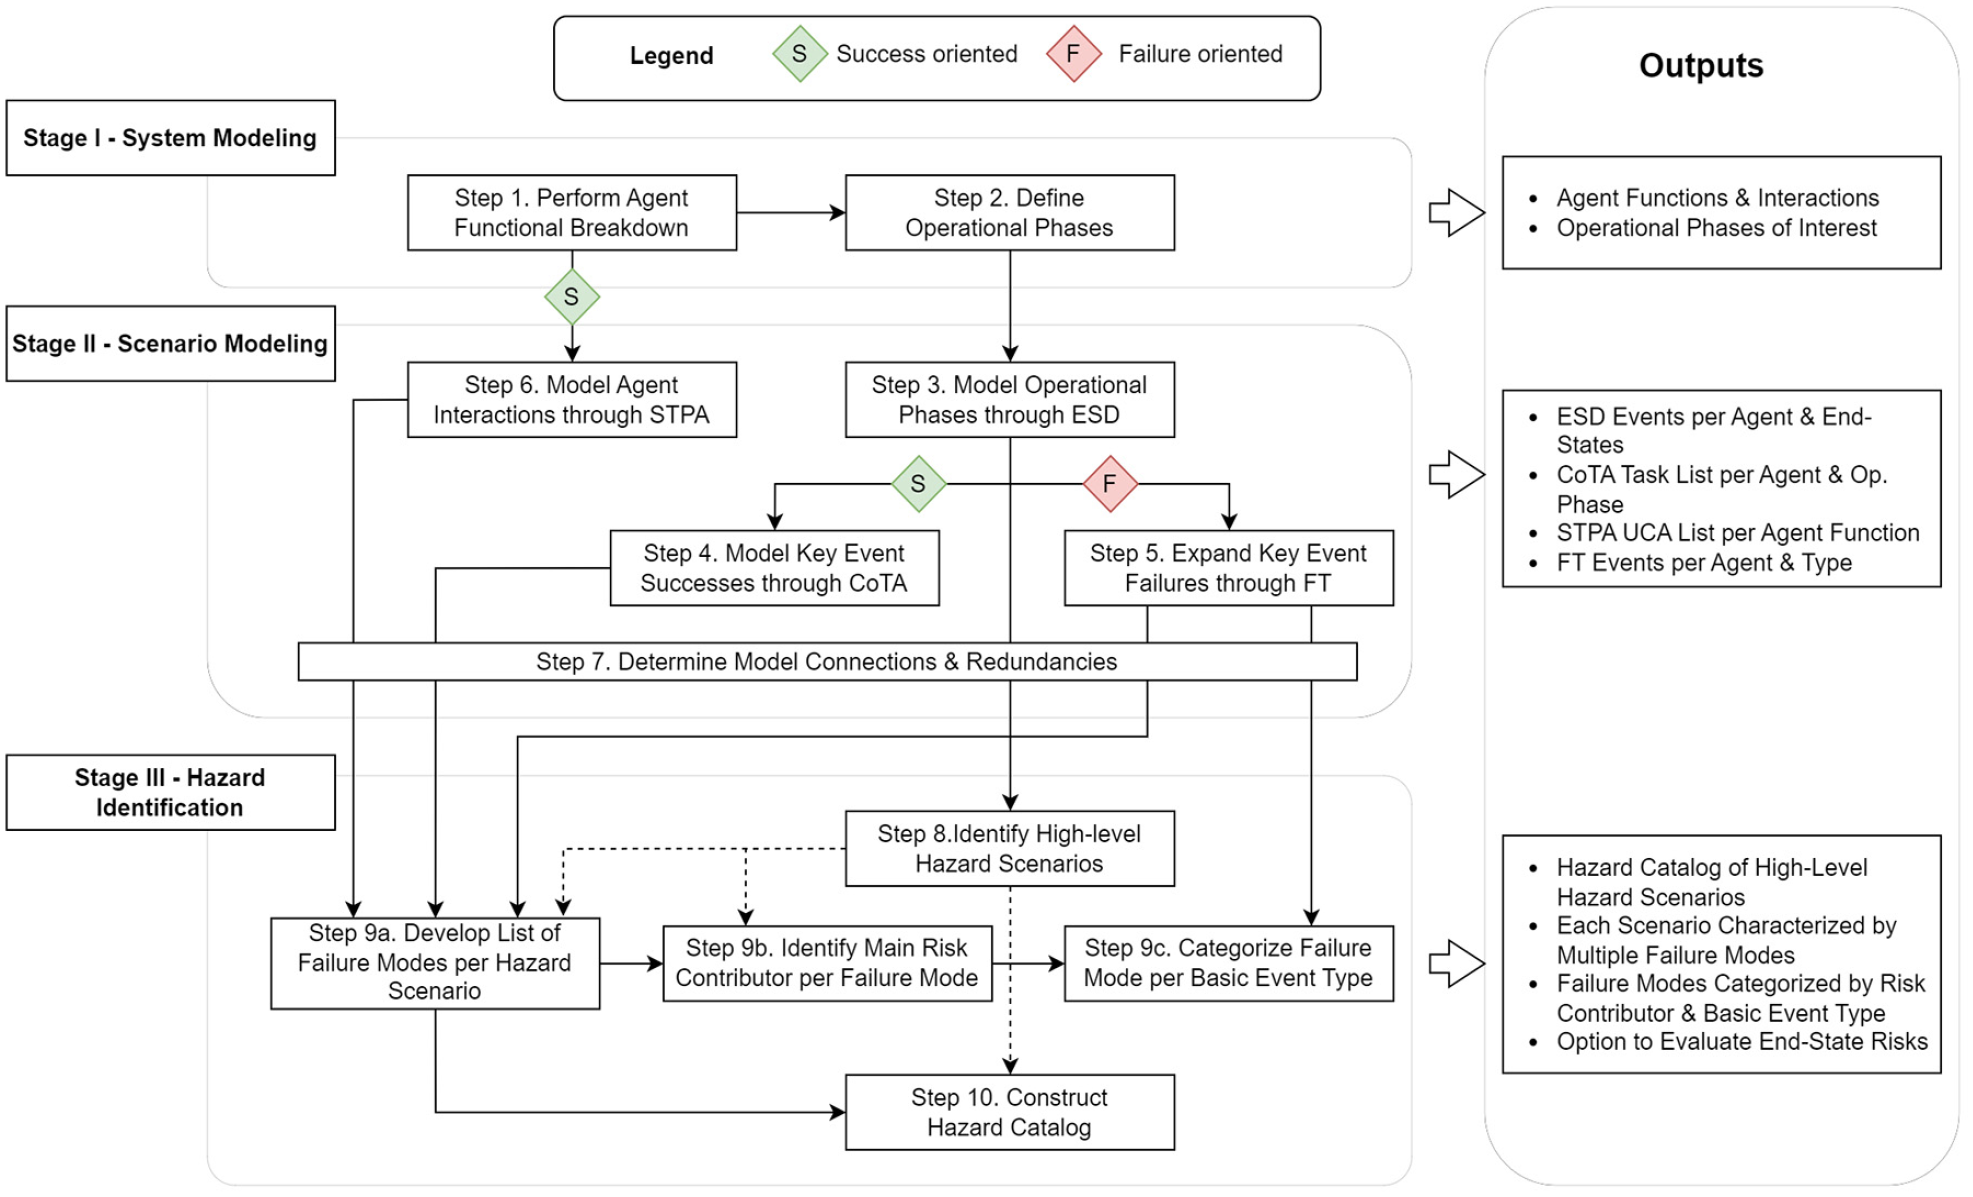
Overview of hazard identification methodology.
Stage I: System modeling
The first stage consists of a system familiarization process. This stage depends on the practitioners’ knowledge and the complexity of the system studied (i.e. the presence of interdependent hardware, software, and human elements). The level of system decomposition depends on the purpose of the risk assessment and the stage of the system or technology development, that is, design, testing, and operation. The level of analysis is also constrained by the availability of needed resources, including data sources. 77 The system’s modeling is divided into two steps, as described below.
Analysts identify the relevant agents participating in the system’s operation and the functions they must perform to ensure its adequate operation. An agent is a human, software, or machine subsystem with the agency, that is, it can act or exert power – in this case, decision-making power over its own state and that of the system’s entire operation. Agents can be composed of multiple elements, each expected to perform specific functions.
The output of this step is a list of the most relevant elements and functions of each agent and any critical interactions between them. A scheme of this functional breakdown is depicted in Figure 5(a), in which each agent’s main functions and sub-functions are developed. The level of function decomposition at this point may be high-level. For instance, for an L4 ADS vehicle fleet one of its main functions is to perform passenger transport, while relevant subtasks include passenger verification and customer support.
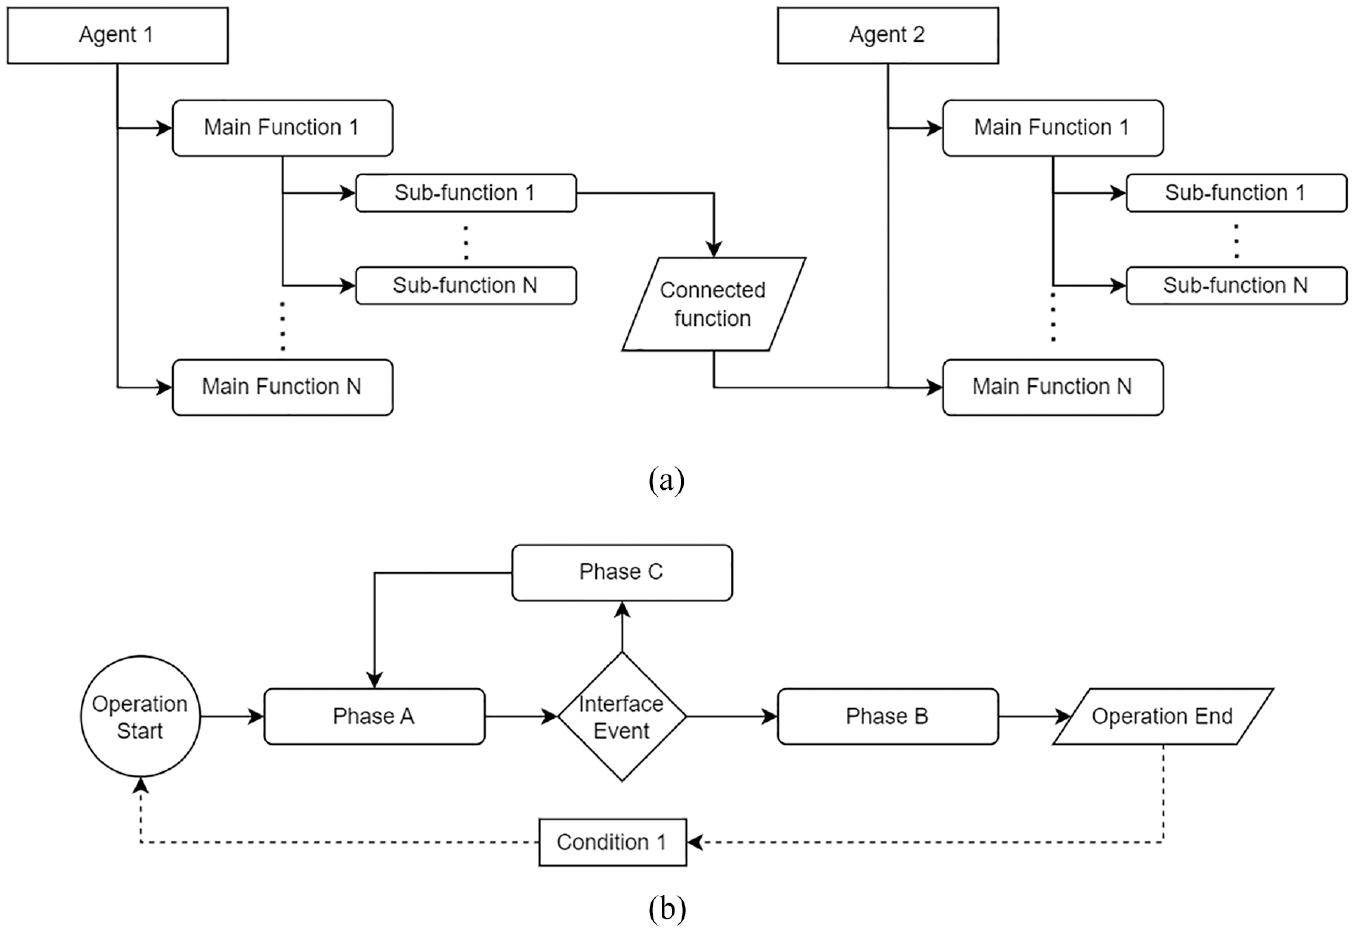
Stage 1 – system modeling: (a) step 1 – agent functional breakdown and (b) step 2 – operational phase definition.
Analysts determine if the functions the agents must perform differ during different operational stages of the system. For instance, an ADS vehicle is expected to perform different functions when picking up a passenger and when driving the passenger toward their destination. This step is system-dependent, and the scope of further analysis may be only some phases focused on a specific agent or the whole operation. Each operational phase is defined by boundary conditions, which may refer to a change in an agent’s state or the entry of an agent not active during another phase (e.g. the entrance of a passenger in a vehicle).
The output of this step is a list of operational phases of interest, the functions each agent performs during each phase, and the boundary conditions or events that trigger evolving from one phase to another. A scheme of this functional breakdown is depicted in Figure 5(b), exemplifying an operational sequence where certain interface events or conditions must be met for the system to evolve its state.
Stage II: Scenario modeling
The second stage involves modeling the system’s operational phases and critical events that may lead to hazard scenarios. The following sections briefly describe each technique and its application in the proposed hazard identification methodology.
The third step involves developing an ESD representing each operational phase. The ESD models the scenario representing an operational phase at a high level. The initiating event, thus, is related to the boundary conditions delimiting each phase. As the ESDs are employed to model the whole sequence of events that may occur in the operational phase, this will result in multiple end-states with varying levels of severity. When developing the ESDs, the analysis must ensure that each event is associated with one agent only (defined in Step 1), unless referring to an external event affecting the system’s operation. 47 In this regard, contextual aggravators (e.g. conditioning system failures) are assessed from the perspective of the system not reacting as expected (e.g. failure is not detected by the system and/or does not trigger an emergency response).
The output of this step is one or more ESDs depicting the chosen operational phases, events associated with each agent (with varying degrees of detail as determined by the analyst), and a list of end-states ranked by a qualitative assessment of their severity.
The fourth step consists of developing a CoTA for each agent involved in each operational phase, building on the ESD diagrams. 47 According to the extended IDA model, 78 human operators or autonomous systems can fail during:
Information gathering and pre-processing (I phase), for example: receiving information from sensors (ADS) or responding to an alarm (remote fleet supervisors).
Situation assessment and decision making (D phase), for example: deciding a new course for collision avoidance (ADS) or adequate situational awareness (remote fleet supervisors).
Action taking (A phase), for example: implementing context-specific DDTs (ADS); transmitting dispatch commands (remote fleet supervisors).
Therefore, all tasks an agent performs (i.e. humans or autonomous system) are decomposed into steps focusing on receiving information, selecting an appropriate action plan, and performing the chosen action path. The CoTA method can identify the tasks needed for the success of key ESD events, for example, if the information is correctly transmitted to and received by an agent, whether previous knowledge or parallel inputs were available to support the agent in selecting an adequate action plan, and if the mechanisms needed to perform the actions adequately were successful. The output of this step is a CoTA for each agent participating in the chosen operational phases modeled in step (3). The CoTA outputs a hierarchical list of tasks for each agent, the dependency between tasks (e.g. sequential, parallel, trigger), and the IDA stage each task represents (e.g. Information). For instance, this analysis provides insight into which task failures or errors are more relevant to system-level effects. The tasks must address all the events associated with the agent in the ESDs.
The fifth step consists of developing qualitative FTs whose “Top Events” are related to pivotal events defined in the ESDs. The events selected to be expanded through FTs correspond to those representing explicit safety-related functions of the system’s agents, for example, an L4 ADS vehicle detecting the need for a DDT fallback. The level of event decomposition is determined according to the goal of the analysis and data availability (e.g. hardware, software, human, or procedural errors or failures). Basic events are categorized as human-related errors, software and/or hardware malfunctions, process design errors, or external events. These categories can be adapted according to the level of analysis and the objectives. This decomposition aims to identify the type of failure, linking these back to the agent responsible for each event. Further details and decomposition levels may be achieved by selecting adequate tools based on the failure type (e.g. expanding hardware failures through FMEA, employing Human Reliability Analysis techniques for human errors or software reliability-specific tools, etc.).
The output of this step is one or more FTs developed for chosen ESD events developed in step (3). The FTs output a list of events decomposed into basic events, which in turn, are categorized by their potential source.
The sixth step employs the STPA method to develop a system-level description of agents’ functions and interactions. The system boundaries, high-level hazards, and constraints are developed based on the functional breakdown in step (1). System-level hazards are identified as a system state or a set of system conditions that will lead to a system loss. System-level constraints are defined as system conditions or behaviors expected to be satisfied to prevent system-level hazards and associated losses. The scope of the STPA model is defined by the analyst as a function of these hazards and constraints. In this work, the main focus of developing the hierarchical control diagram is identifying how inadequate inputs can alter downstream functions. In addition to identifying hazards not explicitly modeled by the ESD, the control diagram allows for identifying the key communication channel whose interruption or failure (on the transmitting or receiving end) can lead the UCA within the scenarios developed in step (3).
The output of this step is a list of UCA associated with the controller-actuator pair affected. Insight on potential causal factors is explored in Stage III of the methodology.
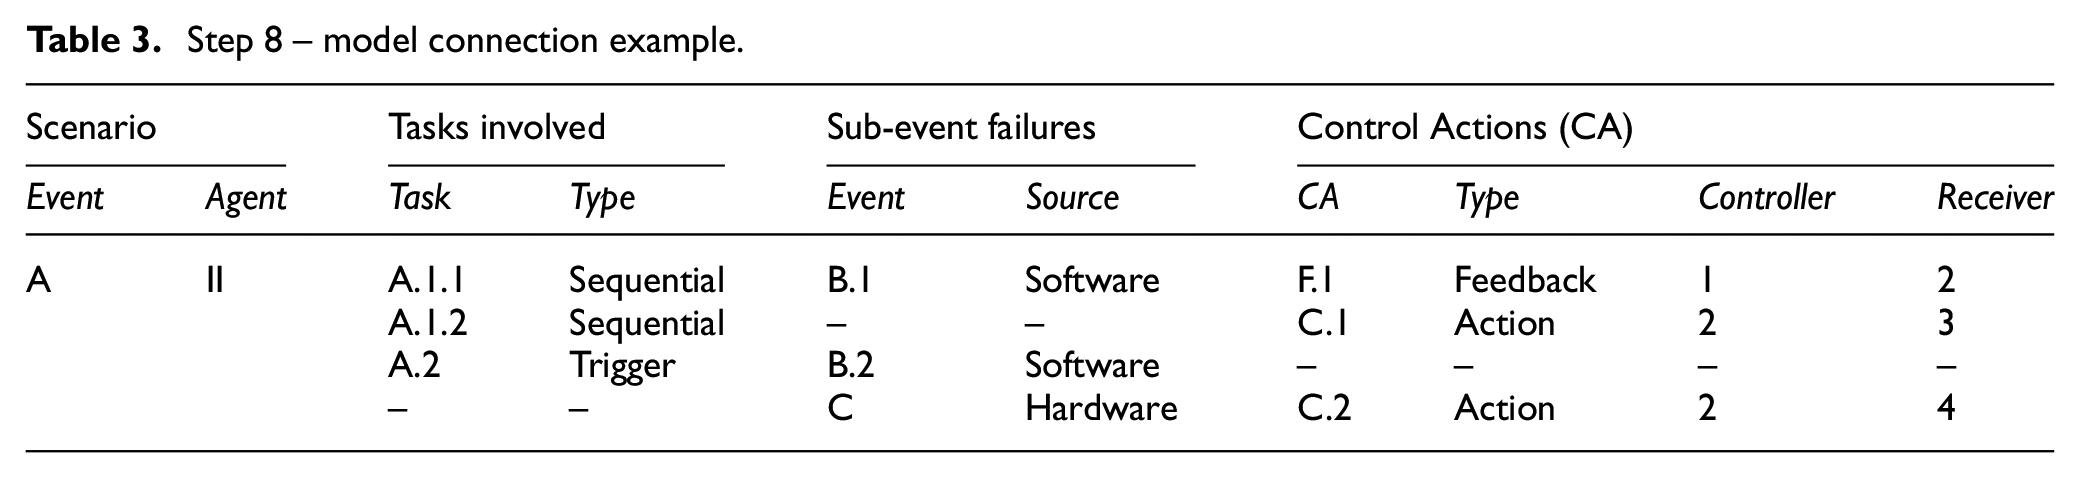
The purpose of this step is to establish a connection between the scenarios represented by ESD events and the STPA, CoTA, and FT models. The success and failure paths of an ESD event are linked to the success of tasks modeled in the CoTA or sub-events detailed in the FT. On the other hand, the sequence or dependencies of tasks in the CoTA plans are linked to issues in the transmission, content, or reception of specific control actions modeled through STPA. This may lead to a redundant description of a system function from two or three sources. The output of this step are equivalence tables, detailing these relationships (Table 3) and serve as input for Stage III.
Step 8 – model connection example.
Stage III: Hazard identification
The third stage leverages the models developed in Stage II. The stage consists of four steps, leading toward creating a hazard catalog. These are:
The identification of hazards is initially based on pivotal ESDs events, stemming from the failure paths of events associated with each agent (see Table 3). In this approach, hazards are defined at a sub-system level, that is, the underlying source of risk stems from a function or task that was not performed correctly or resulted in an undesired consequence. Therefore, a hazard scenario represents the failure path of an event, independently whether the event is related to a system failure or to an unsafe interaction resulting from an action which in other contexts may not have led to undesired consequences. Only ESD events associated with an agent are considered. This process allows the identification of (a) high-level hazard scenarios per operational phase. For example, the hazard associated with the ESD event “The ADS vehicle detects a DDT-fallback is required” is “The ADS vehicle fails to detect a DDT-fallback is required.” The output of this stage is a list of hazards by operational phase.
Each safety hazard listed in Step 8 is associated with multiple failure modes. This step consists of leveraging the equivalence tables developed in Step 7 to identify specific failure modes through the CoTA, STPA and FT models (Step 9a). This allows describing the hazard scenario in terms of (b) uncontrolled or failed feedback loops, key system-level interactions, and dependencies between agent tasks. Unsafe interactions leading to the identified hazards are determined by finding the explicit relations between tasks (CoTA) and errors in controlled feedback loops (STPA). Although UCAs do not necessarily stem from system failures or errors, the methodology focuses on the potential consequence of an UCA, for example, incorrect sensor data (not provided/provided out of sequence) can lead to detection failures (at a functional level) that leads to a hazard scenario. Given the detailed procedure to develop the CoTA and STPA diagrams, new hazards may also be identified from functional relationships not explicitly defined through the ESDs.
Each failure mode is associated with (c) a main risk contributor and/or the main agent responsible for preventing or mitigating the specific failure mode (Step 9b). For some failure modes, the risk contributor and the responsible agent may represent different functional modules of the same agent (e.g. ADS software affecting vehicle hardware), or from different agents (e.g. inspection crew procedural errors affecting vehicle operation). The FTs allow an alternative characterization of the failure mechanisms developed through the STPA (e.g. identifying the communication channel failures causing uncontrolled or failed feedback loops). Thus, this process allows the (d) identification of basic failure events by categories representing possible root causes (Step 9c).
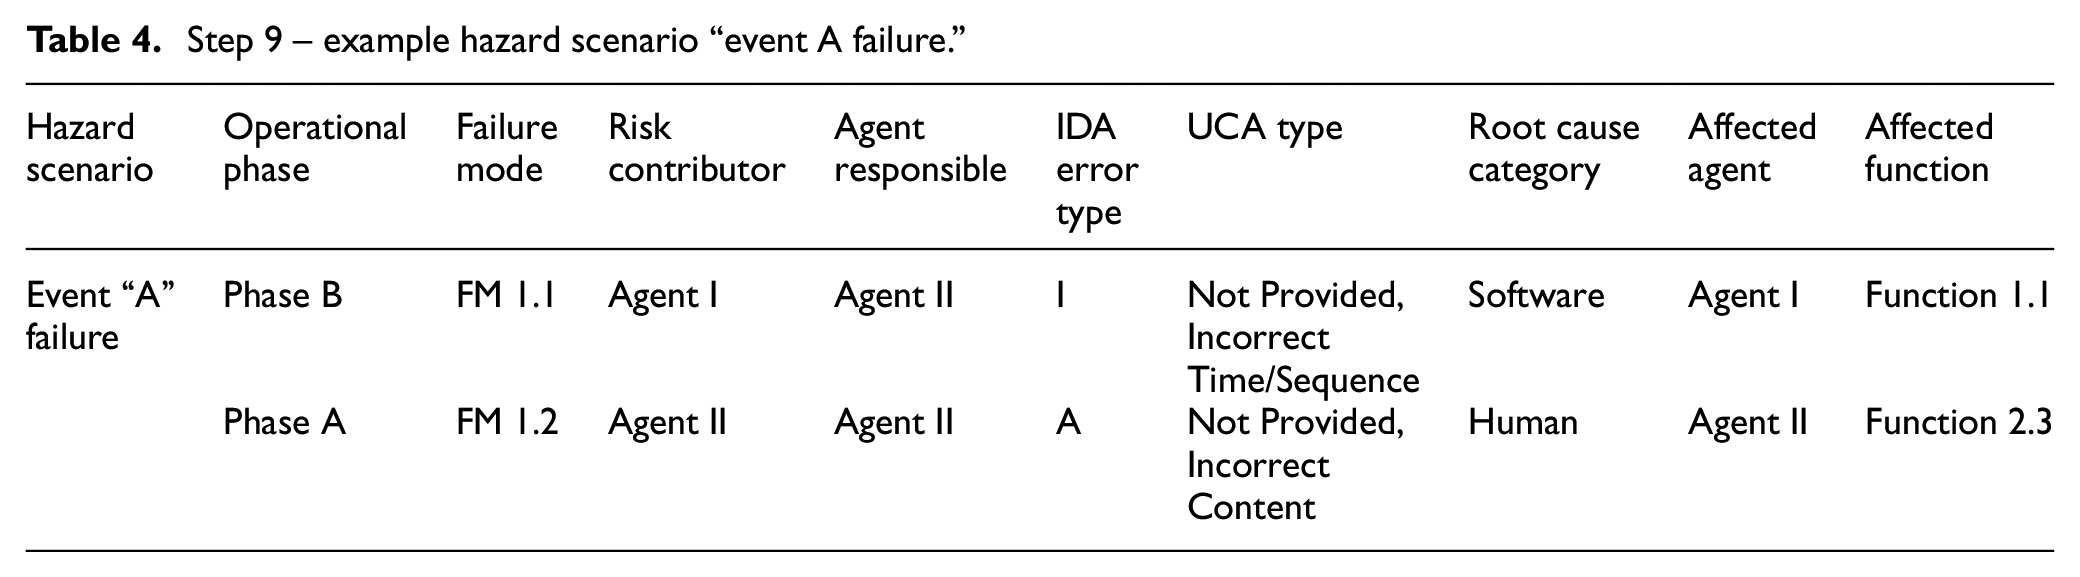
The last stage of the methodology is the consolidation of the results of Step 9. The output of this step is presented in the form of a tabular table, as shown in Table 4. Here, the hazard scenario is characterized by the operational phase where it may occur and the specific failure modes that lead to it, risk contributors, and responsible agents. Information such as the IDA error type (I – Information, D – Decision, A – Action), the UCA type (not provided, incorrect time/sequence, incorrect duration, or incorrect content), and the root cause category (e.g. human, software, hardware, procedural) provide additional details to enrich the hazard scenario’s description. Finally, information on the affected agent and function allows analysts to trace the effect of the contributing factors across multiple hazard scenarios.
Step 9 – example hazard scenario “event A failure.”
Methodology outcomes
The constructed hazard catalog can be used for multiple purposes depending on the system analyzed and the scope of the analyst’s investigation. On one hand, it can provide the foundation for risk quantification efforts, which would require (e) an analysis of event consequences and likelihoods. Each hazard scenario can lead to various consequences that can be expressed at a higher or lower level of analysis and depend on the scope and objectives. Through the CoTA and STPA models, specific failure modes are linked to effects at a local level (i.e. the affected function or agent) and a system level (i.e. the end-states from the ESD). For instance, a scenario end-state can be characterized as a “potential collision with a passenger onboard,” leading to a severe consequence of “possible harm to life.” On the other hand, a more detailed analysis characterizing the vehicle speed, location, and external conditions can lead to higher granularity when assessing the consequences: a collision with very low speed may lead to “possible injuries to passengers” rather than harm to life. These consequences can be evaluated through a semi-qualitative risk scale, for instance, based on ASIL in ISO 2626-2.33,79,80
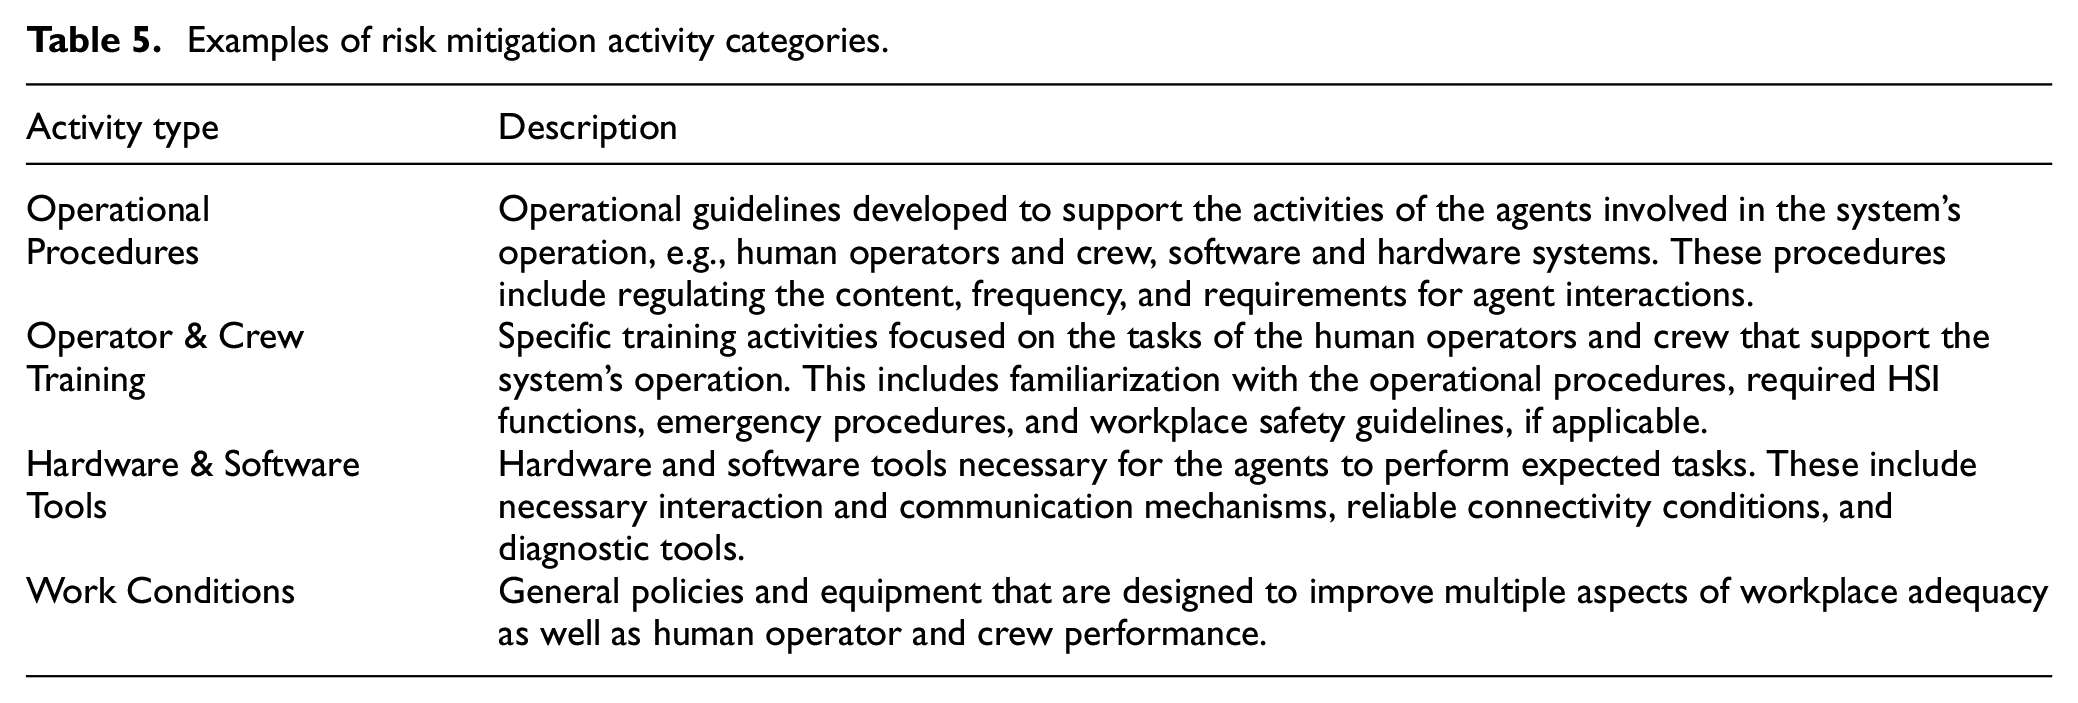
On the other hand, it can provide insight into (f) the design of risk reduction activities to prevent the hazard scenario’s failure modes or mitigate its potential consequences. For instance, preventive actions would be related to inspection, maintenance, and procedural elements, as these impact the system’s state before operation. Mitigation actions, in contrast, are mainly associated with operational teams or the system reacting to multiple hazard scenarios during the system’s operation. A further examination of the agent identified as responsible for a failure mode and the root cause category can lead to an analysis of the resources required by the system and operating crew for a safe operation. The nature of these resources depends on the high-level responsibilities of the organization operating the system and its relation to the system’s designers and regulators. At a high level, the resources to support risk reduction activities can refer to procedures, training, tools, and working conditions (Table 5).
Examples of risk mitigation activity categories.
Case study: Operational safety hazards of L4 ADS fleets in MaaS
This section presents a case study, applying the methodology to the operation of L4 ADS for MaaS to determine potential risk reduction activities. This section highlights the steps and key results for system modeling, scenario modeling and hazard characterization for the case of an ADS vehicle driving from origin to destination with passengers on board. In particular, results from modeling Steps 1 to 6, along with the hazard identification steps 9–10, are presented.
The case study’s scope consists of elements that are within the responsibilities of the fleet operator, and it is considered that the ADS vehicles have undergone the necessary testing to obtain license to operate in L4. Thus, events concerning hardware failures are developed under the perspective of inspection and maintenance activities (responsibility of the fleet operator), as opposed to system reliability (responsibility of the ADS developer and/or vehicle manufacturer). Finally, passengers and other road users are outside the scope of analysis and are considered to behave as expected.
Stage I: System modeling
The system analyzed (“reference fleet”) consists of light-duty passenger vehicles with L4 ADS capabilities operating without a safety driver. This reference fleet was validated with stakeholders representing different industry sectors and is considered a more complex and likely scenario for the future of L4 ADS. The fleet is managed by a fleet operator who has procured the vehicles from an ADS developer. The main role of the fleet operator is to ensure the correct and safe operation of the fleet, such as ensuring the safety of passengers and other road users (cyclists, pedestrians, drivers.)
The mobility services offered are ride-hailing services for passengers in limited geographic areas and under specific conditions. This ODD is limited to urban and suburban areas with adequate connectivity conditions for localization and communication purposes and relies on built-in HD maps available to the ADS developer. The fleet operator may also establish or operate within a more restrictive ODD to comply with connectivity and passenger communication needs.9,81
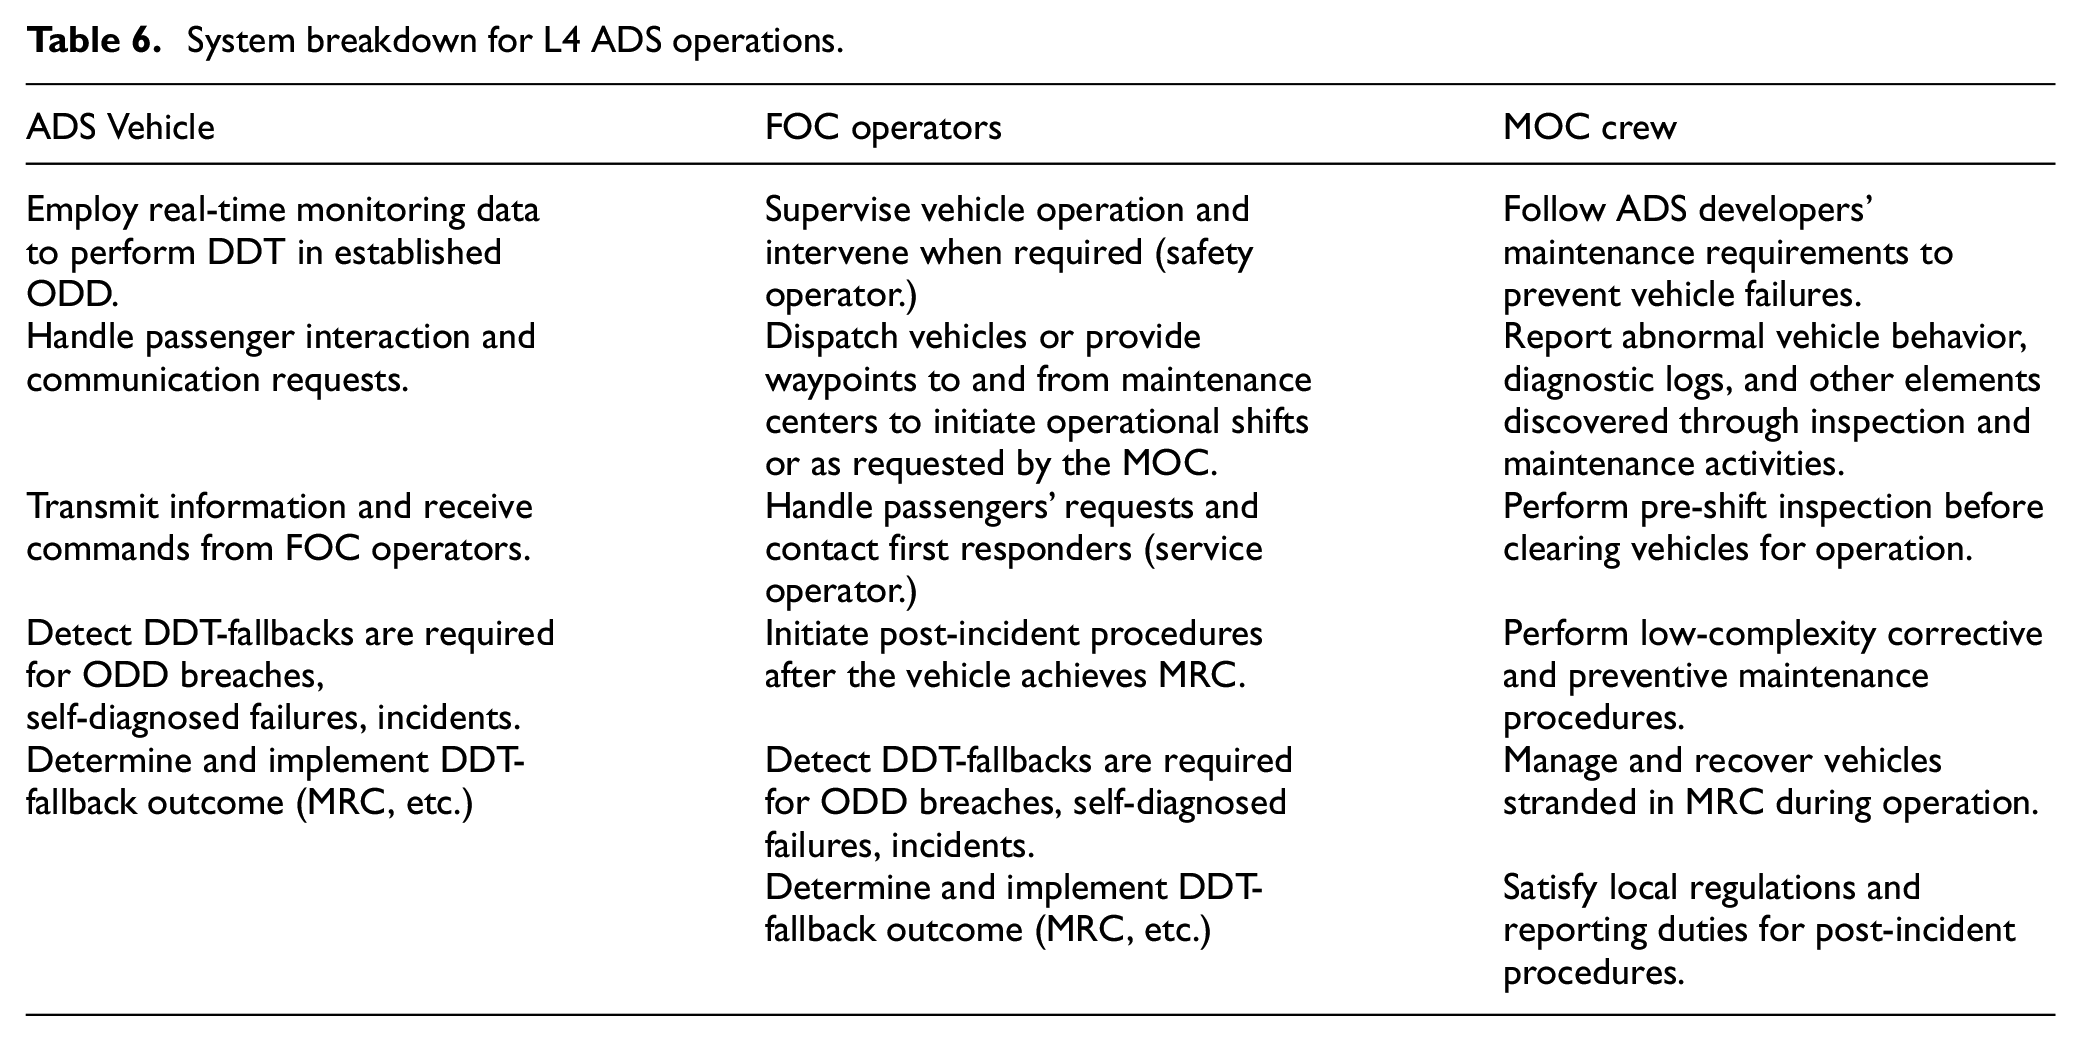
The operation of the L4 ADS fleet is broken down into three agents with distinct functions, as described below (Figure 6, Table 6). The ADS-equipped vehicles are supported by two distinct entities: the Fleet Operations Center (FOC) monitors and supervises the ADS vehicle’s operation, and the Maintenance Operations Center (MOC) inspects, maintains, and stores the vehicles.
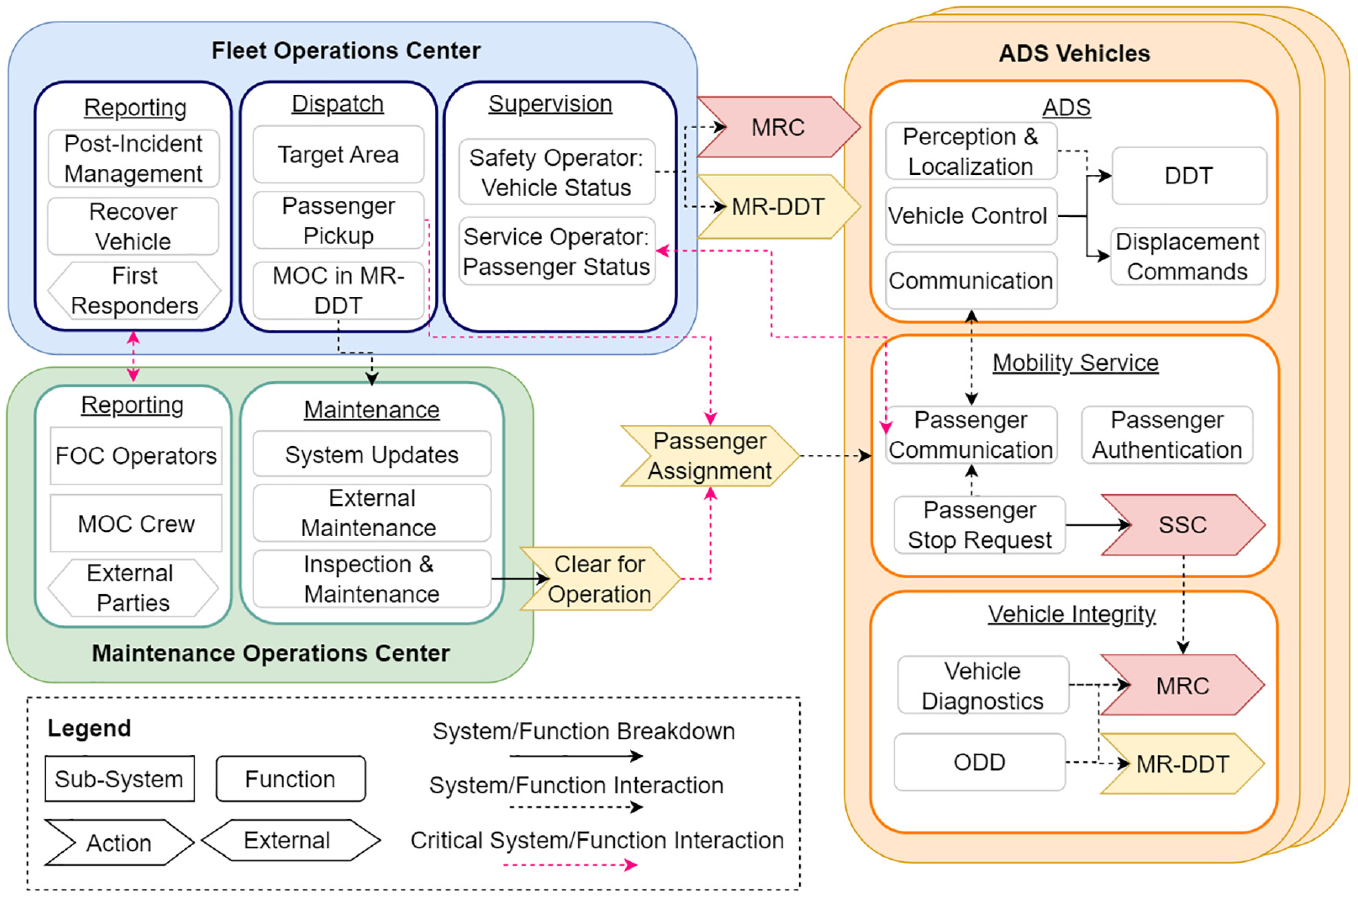
Fleet operator subsystems and functions.
System breakdown for L4 ADS operations.
○
Each ADS vehicle is expected to perform autonomous driving tasks that are coherent with the definition of L4 throughout its operation. This includes implementing context-specific DDT fallback strategies in response to DDT performance-relevant system failure(s) or upon an ODD exit. Identifying the need for and implementing a DDT fallback is the responsibility of the ADS vehicle, relying on onboard diagnostic capabilities and built-in ODD enforcement mechanisms. Yet, in case it fails, the FOC safety operators can support and send the command for a fallback.
Mobility service specific functionalities include key aspects of passenger-vehicle interaction, such as picking-up and dropping-off passengers assigned to it, enabling communication between the passenger and the FOC operators, and receiving commands from the FOC. Note that direct vehicle control is managed exclusively by the ADS software, which requires real-time monitoring data of the vehicle’s surroundings.
○
The primary role of the FOC operators is to support the operations of the ADS vehicle. These functions may be further divided into a control center (focused on functional safety aspects) and a service operator (focused on mobility service aspects). Without onboard safety drivers, remote fleet supervisors may play an active role in ensuring passenger and vehicle safety, including monitoring tasks and providing indirect assistance (e.g. waypoints or commands for achieving MRC).29,82
The FOC’s tasks include monitoring the vehicles’ overall operation, addressing the passengers’ requests, sending commands to the vehicle, and managing communication with the passenger. The FOC operators may dispatch the vehicle to specific locations or directly assign waypoints to the vehicle’s trajectory. In the event of an incident leading to a vehicle achieving MRC, the FOC operators are responsible for initiating post-incident procedures. Depending on the event’s severity, this may include contacting first responders and law enforcement, dispatching vehicle recovery teams or a secondary vehicle for the passenger, and reporting the incident for investigation, as expected to be required by local regulations or internal operational procedures. Depending on the context, whether the ODD is breached, a safety-critical failure, an incident, or an emergency stop request has occurred, the vehicle is expected to perform the DDT fallback actions necessary to return to the ODD, achieve MRC, or implement other mitigation strategies.
Two concepts have been introduced to describe potential DDT-fallback scenarios: Stopped stable condition (SSC) and Minimal Risk DDT (MR-DDT).83–85 The SSC corresponds to “A stable, stopped condition to which a user or an ADS may bring a vehicle after performing the DDT fallback triggered by a passenger or third-party request and when given trip may be continued.” In case the passenger’s request is due to their suspicion that the vehicle is acting unsafely, the FOC can command the vehicle to achieve MRC. If a third party triggers the SSC, the FOC operator communicates with the traffic agents, and depending on why the vehicle was stopped, they may command it to achieve MRC or to return to DDT. The MR-DDT is defined as a “limited” DDT and can be performed if a vehicle with no onboard passengers presents a non-safety-critical failure. It corresponds to “A mitigation strategy that addresses non-safety critical failures that do not require the vehicle to enter MRC but drive under restricted conditions.” The MR-DDT may refer to, for instance, driving at a lower speed or avoiding highways. The vehicle should perform MR-DDT to direct itself to the MOC and be scheduled for maintenance and repairs.
○
The ADS vehicle may arrive at the MOC under different scenarios: either recovered by a team, in MR-DDT, or under normal operational conditions. The ADS vehicle manufacturer is expected to establish minimum inspection and maintenance requirements that the MOC must enforce to minimize risks. In this case, the MOC’s responsibility is limited to performing low-complexity system inspections, maintenance, and general upkeep before vehicle operation. These procedures will likely be based on safety checklists developed by the ADS developer and updated based on operational experience.
Activities regarding system updates, sensor calibration, and more complex maintenance procedures are performed in coordination with or directly by the ADS developer. The MOC is expected to report to the FOC and external partners (ADS developer, vehicle manufacturer, authorities) for multiple purposes. For instance, the MOC is expected to communicate system or procedure upgrades to the FOC. The ADS developer may also require reports indicating high-level failures detected by the FOC operators or MOC crew. Further, the MOC is also expected to satisfy local regulations and reporting duties regarding post-incident procedures and investigations.
The approach selected for this case study is to define the operational phases focused on one of the agents and its relationship with the other agents. Figure 7 presents the operational profile based on the operational phases of the ADS-equipped vehicle. Note that an operational shift denotes the continuous operation of an ADS vehicle within a delimited time period. The distinct operational phases are briefly described below; further details can be found in. 84
(a)
(b)
(c)
(d)
(e)
(f)
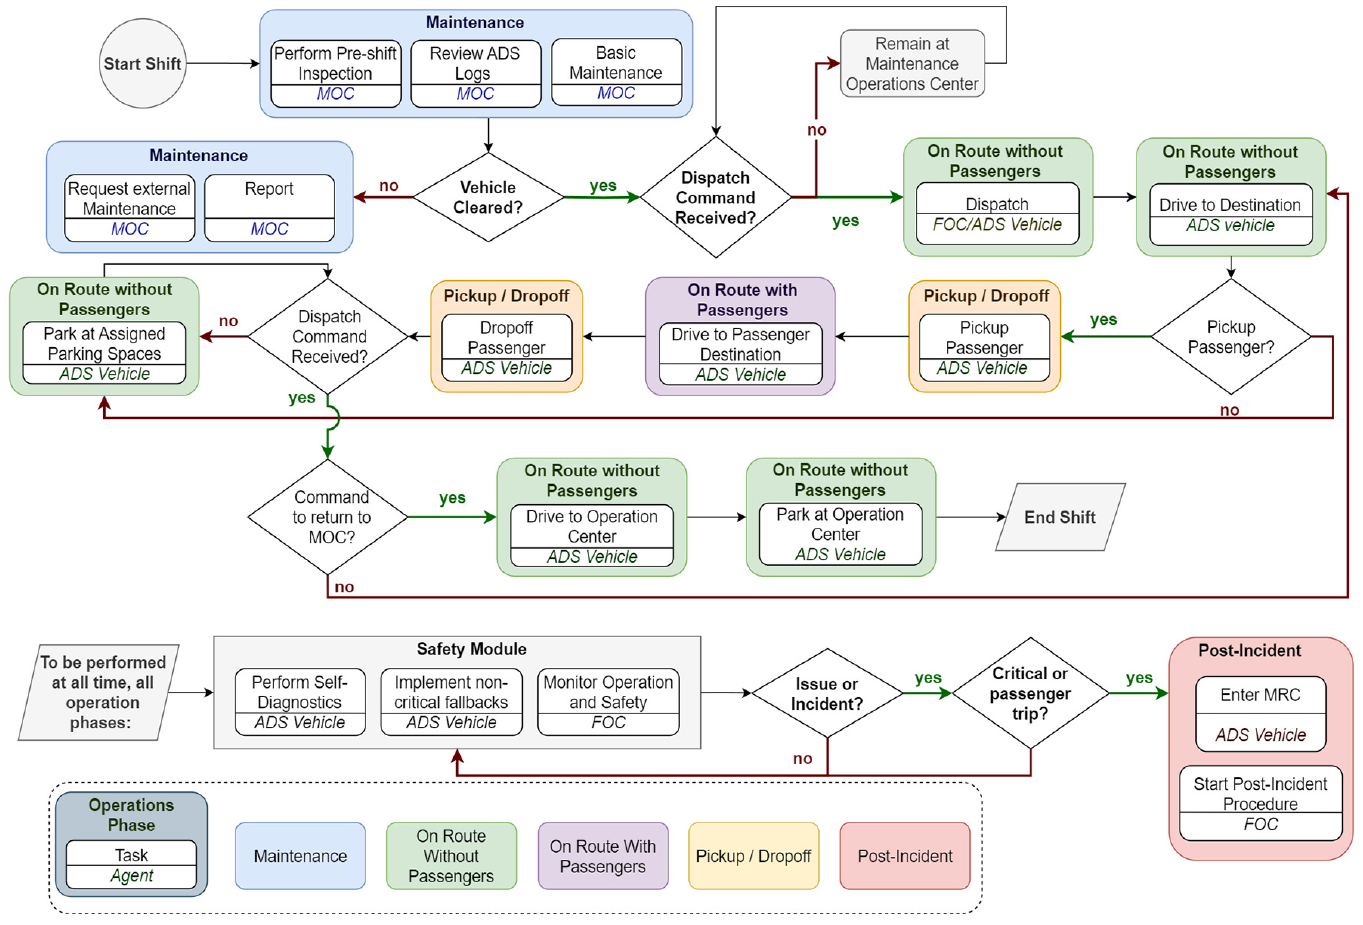
Operational phases of ADS vehicle for MaaS.
Stage II: Scenario modeling
This section presents selected results of the methodology’s scenario modeling stage, focusing on the role of the ADS vehicle and the FOC in ensuring safety during the operational phase “on-route with passengers.”
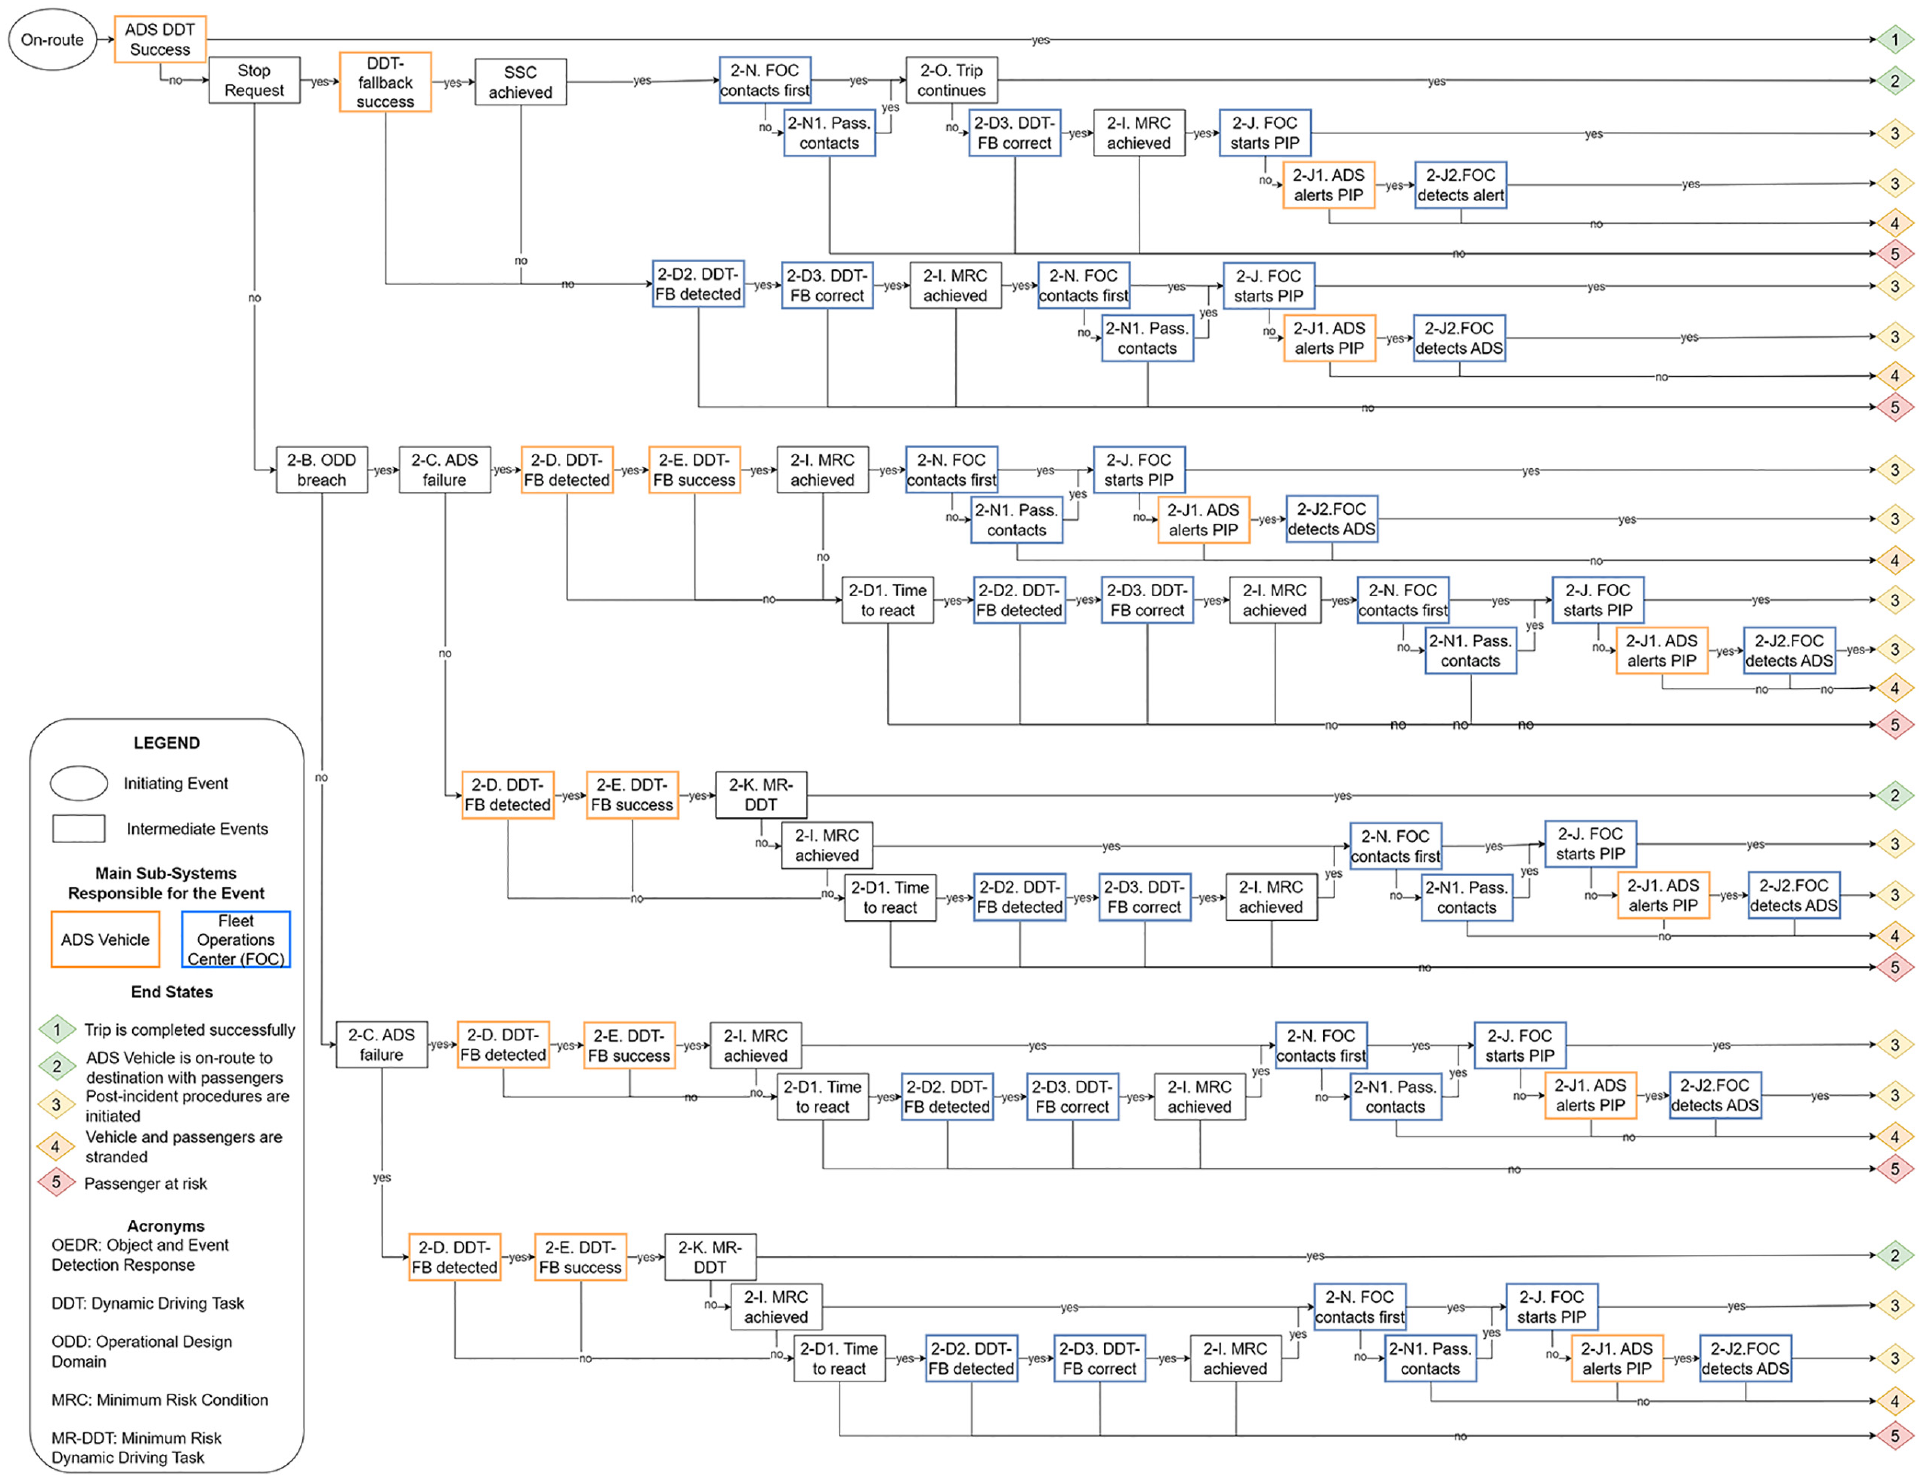
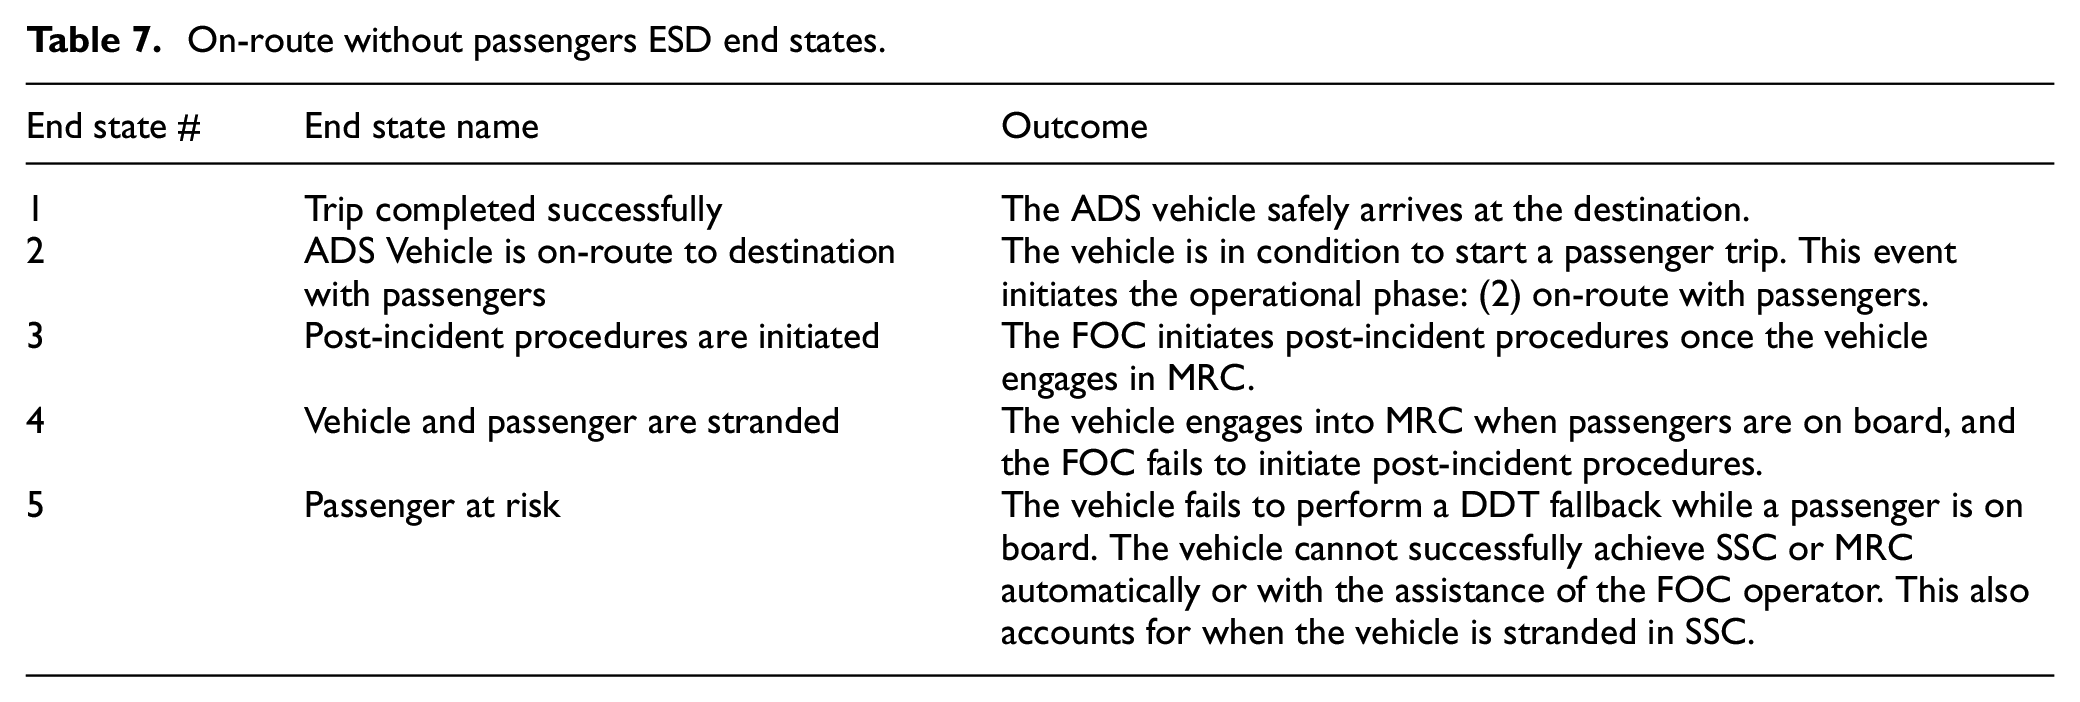
The ESDs and relevant end-states and intermediate events were developed for each operational phase. This section describes the modeling of the operational phase “on-route with passengers,” illustrated in Figure 8. The initiating event denominated “The vehicle is on-route to destination” refers to passenger trips after the pick-up phase has been completed (see Figure 7). Figure 8 shows the diverging paths based on the occurrence of key events (described in Appendix Table 1). The events related to the ADS vehicle and the remote operators at the FOC have been defined based on the IDA cognitive model (Information, Decision, Action). External events are also included for modeling purposes, providing the necessary context to assess the agents’ expected behavior outcome. The potential end-states of this operational phase are described in Table 7.
ESD for on-route with passenger operational phase.
On-route without passengers ESD end states.
A successful ADS vehicle’s trip may be interrupted by the vehicle breaching the ODD, presenting a failure, by wrongly executed DDTs, or an unavoidable external event. Additionally, passengers on board may request an emergency stop. Based on real-time perception and localization data, the ADS is expected to detect that fallback DDTs are required, plan and execute the DDT fallback. The fallback may lead to returning to nominal DDT, entering MR-DDT, or achieving MRC (Events 2-D, 2-E). The second safety barrier is the remote FOC operator. The role of the FOC is two-fold in this operational phase. The FOC safety operator may intervene if the ADS has either not detected DDT fallbacks were necessary or has wrongly executed the selected fallback strategy, or when alerted by the service operator. In this case, if there is sufficient time for the operator to intervene, they are expected to plan and transmit the correct DDT fallback strategy (Events 2-D2, 2-D3). The service operator is responsible for contacting the passengers if an emergency stop has been requested or the vehicle has achieved MRC (2 N). The vehicle can only resume driving if the passenger confirms that the trip can continue (2-O). Suppose communication with the passenger cannot be established or the passenger confirms the trip cannot continue. In that case, the FOC operator should command the vehicle to achieve MRC (2-D3) and initiate post-incident procedures (2 J).
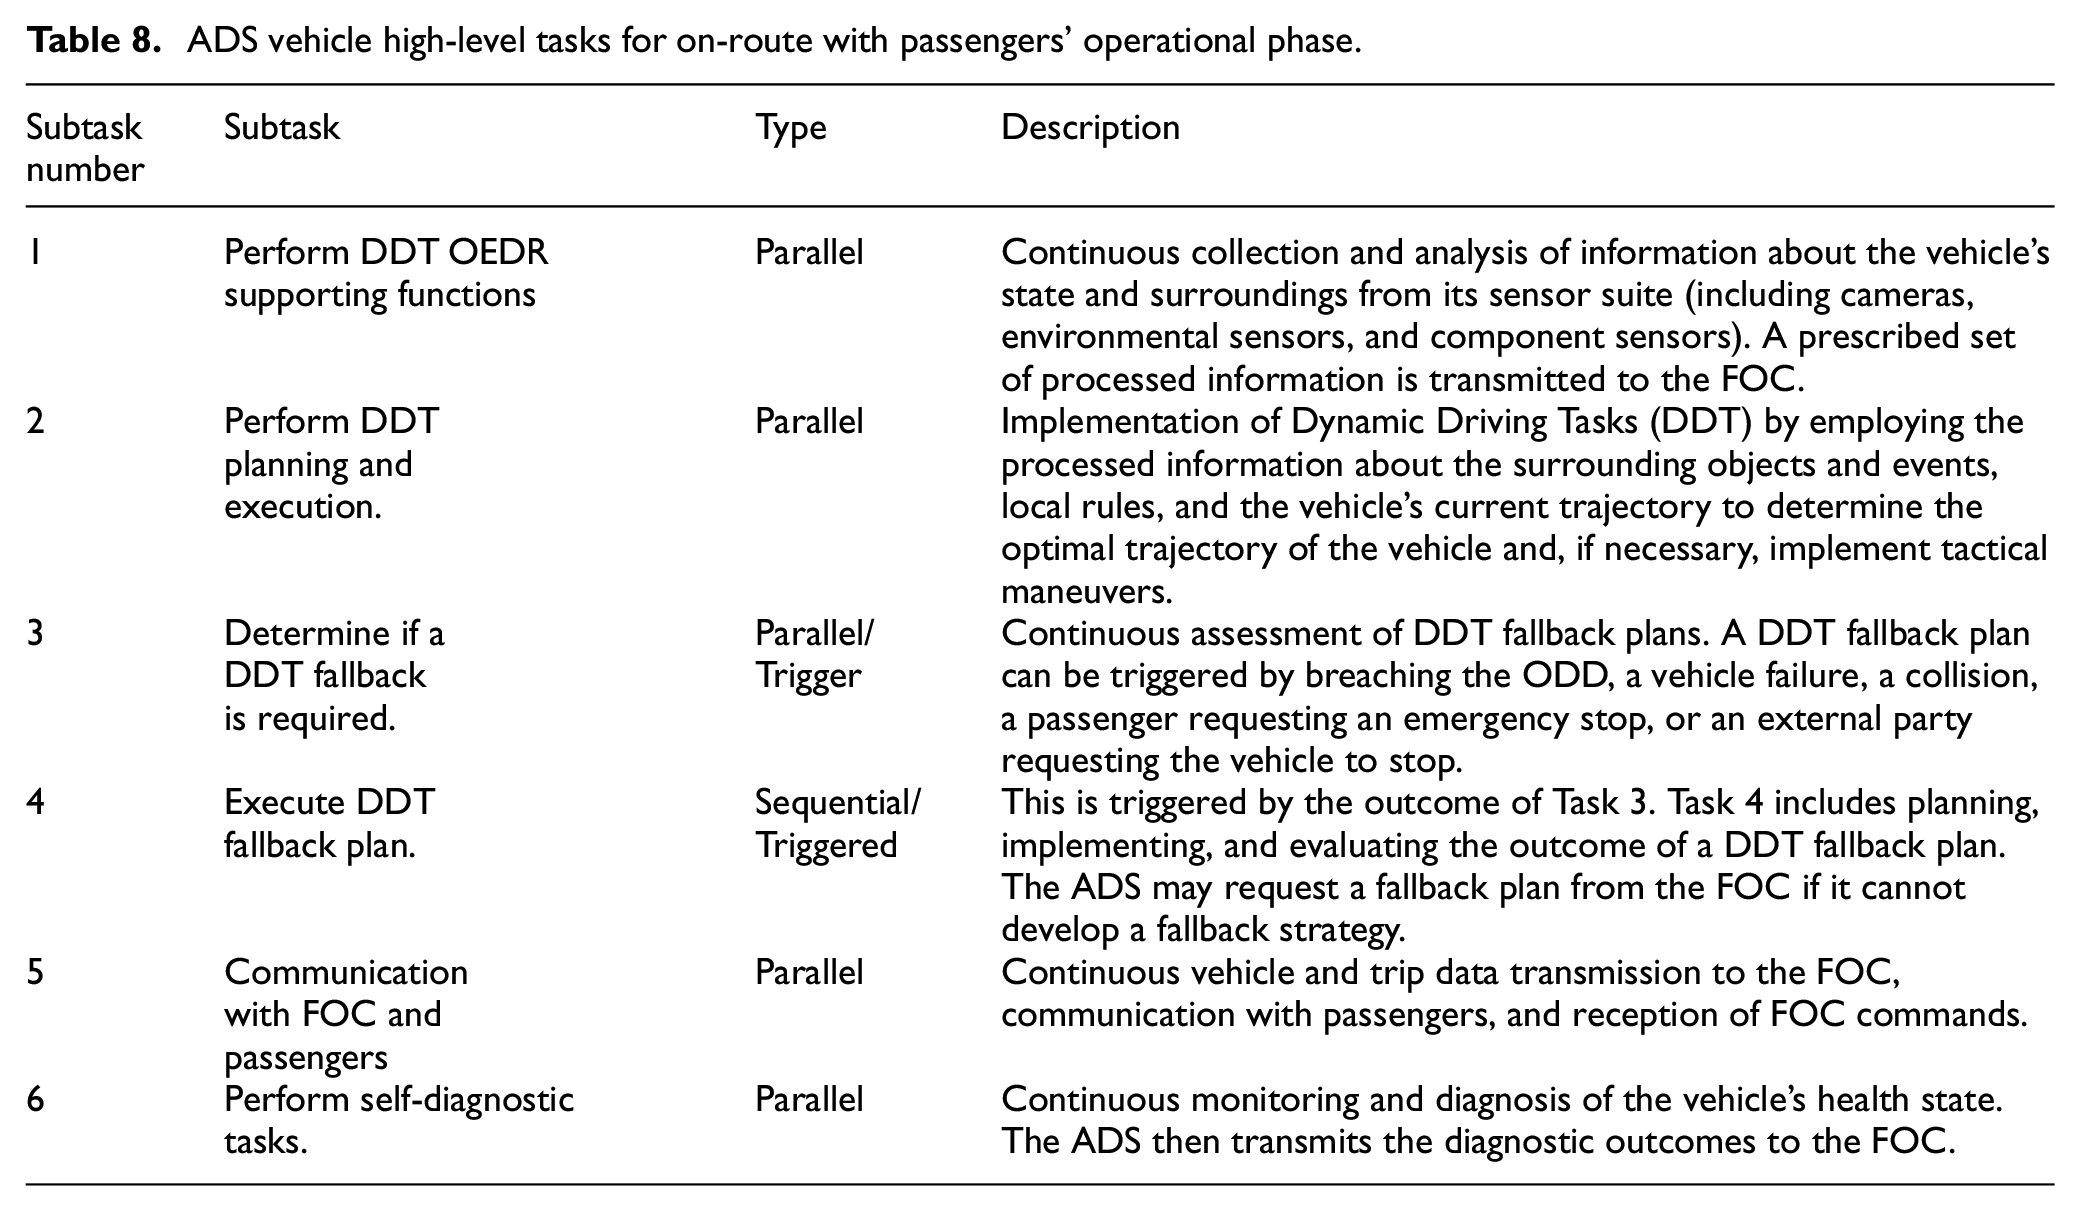
The events from the ESD are translated into the tasks each agent – ADS vehicle and FOC operators – must perform to ensure its success through the CoTA. The main goal of the ADS vehicle is to “Drive passengers to their destination.” To achieve this goal, the ADS vehicle is expected to perform the High-Level Tasks specified in Table 8. Note that all these tasks (except Task 4) are performed in parallel. Based on their definitions, Tasks 2, 3, and 6 depend on the success of Task 1, while Task 4, “Execute DDT fallback plan,” is only performed if triggered by the corresponding sub-levels of Task 3. As an example, a detailed redescription of Task 4 is provided in Appendix Table 2.
ADS vehicle high-level tasks for on-route with passengers’ operational phase.
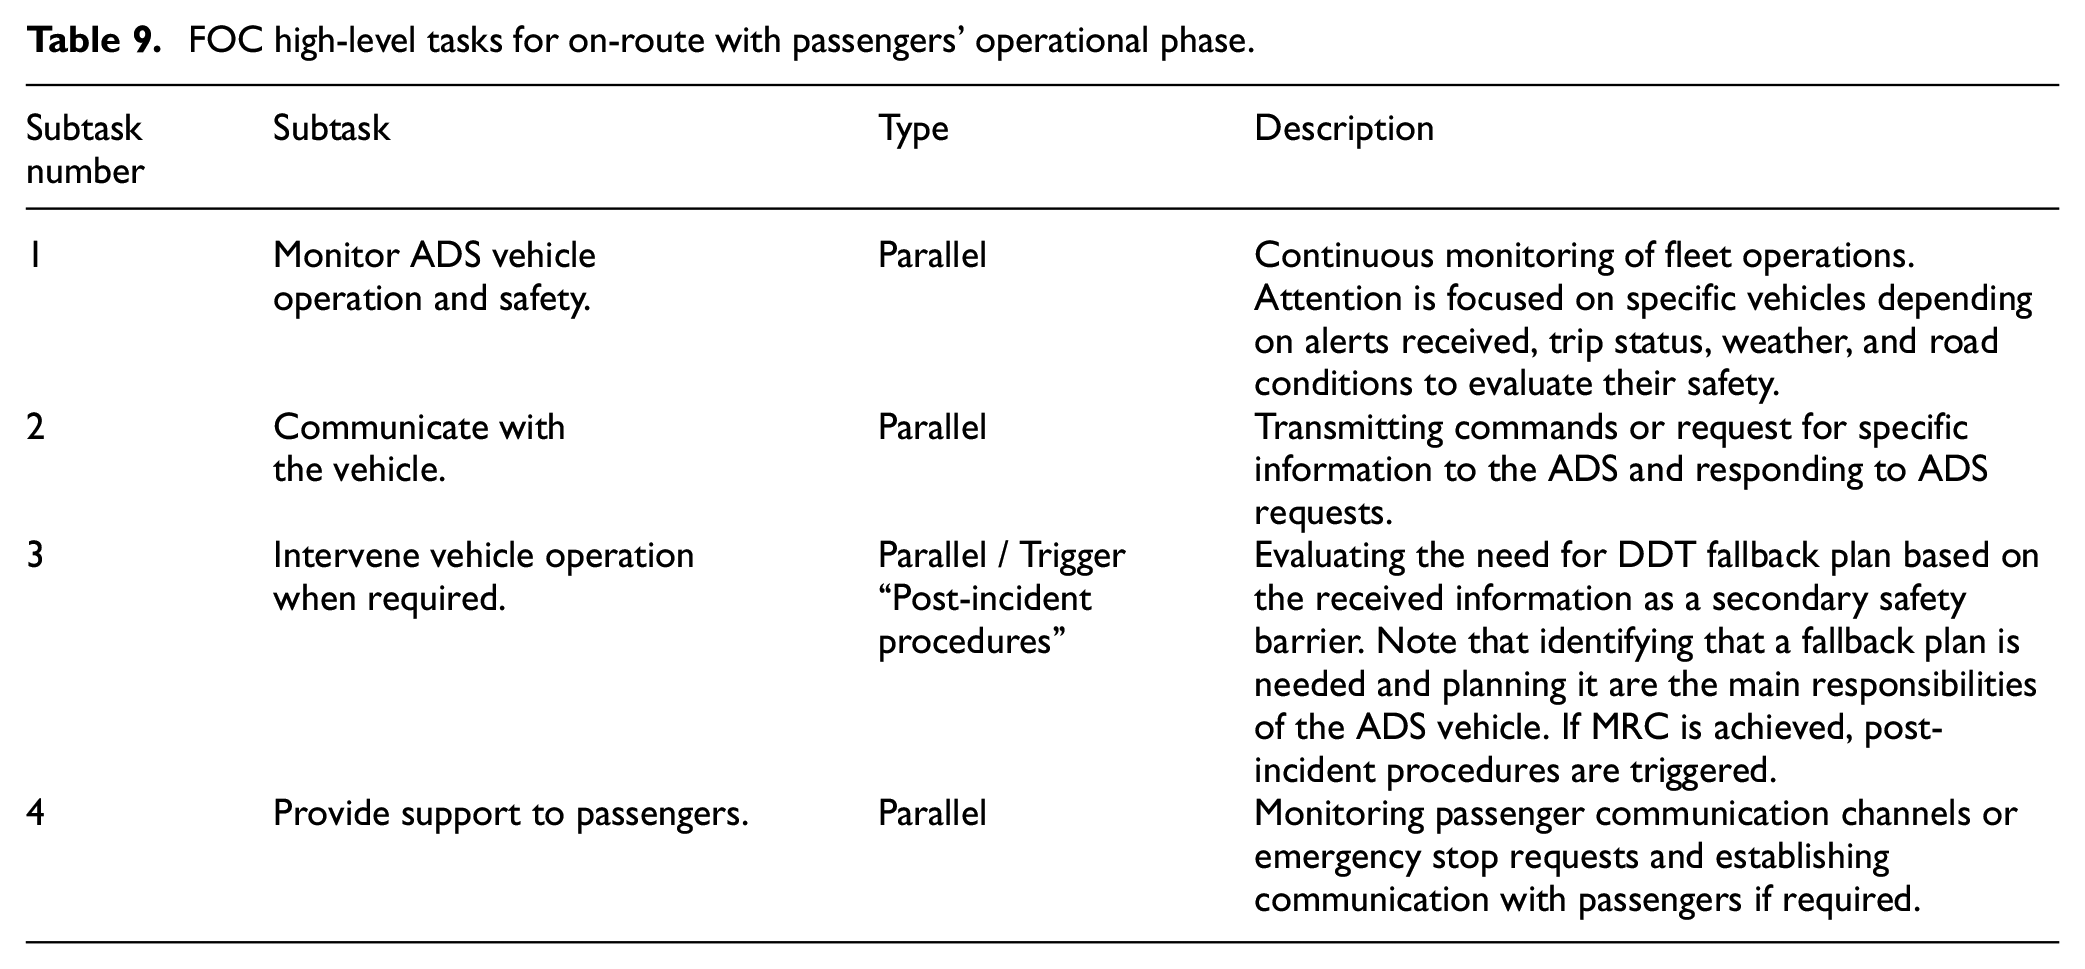
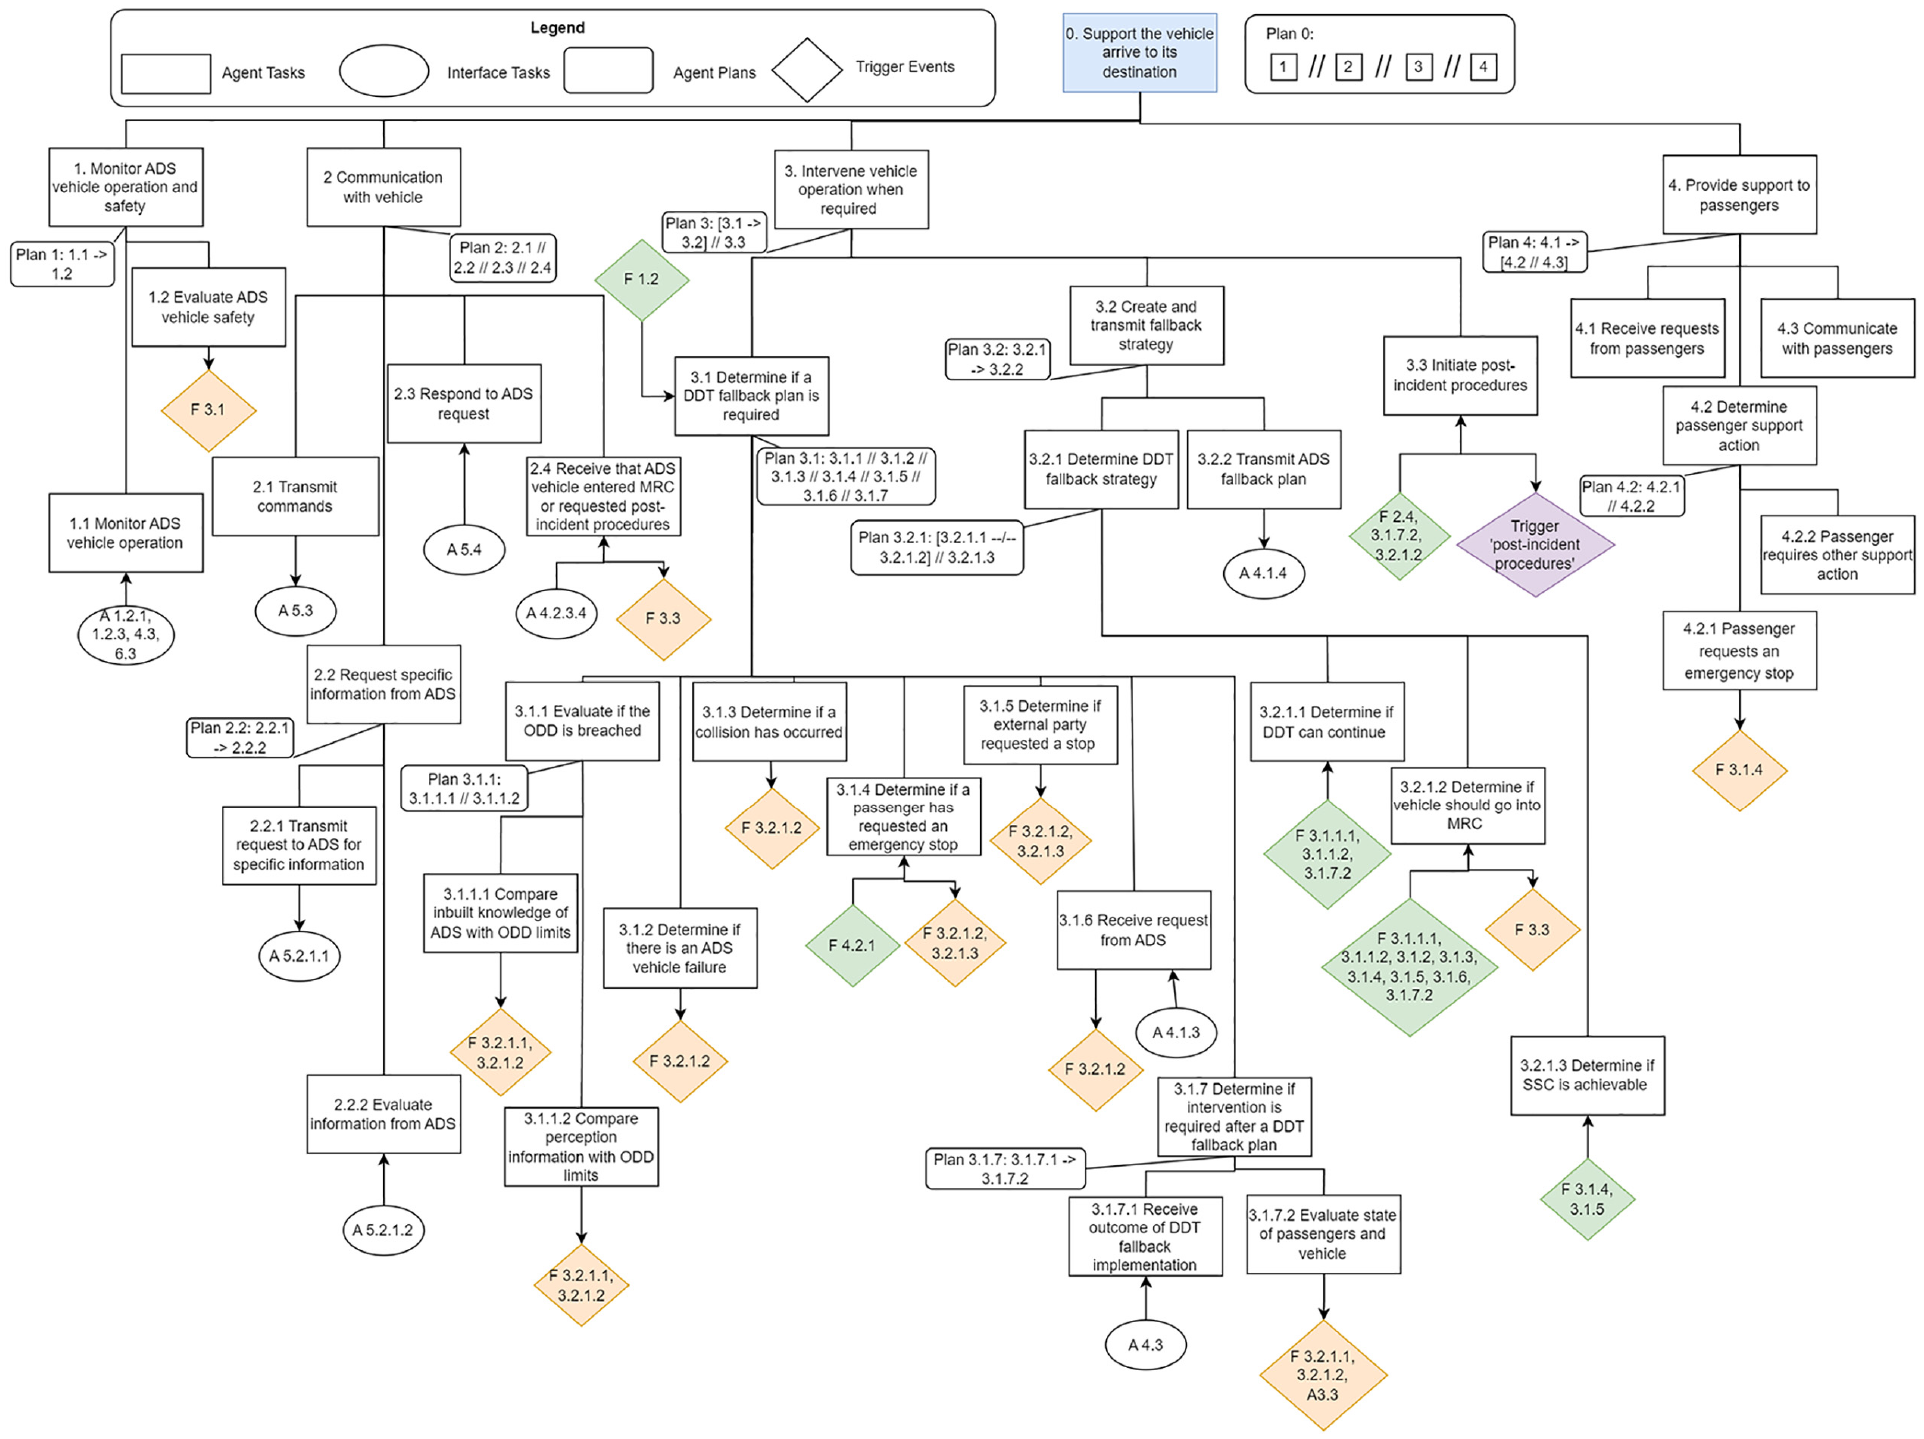
The main goal of the FOC operators is to “Support the vehicle to arrive at its destination.” To achieve this goal, the FOC operators must successfully perform the High-Level Tasks specified in Table 9. In this case, the four tasks are expected to be performed in parallel and may be further divided into safety and service operator tasks. Tasks 1, 2, and 3 may be performed by “safety operators,” while “service operators” may be focused on performing Task 4. Figure 9 provides a simplified version of the CoTA diagram developed for the FOC. Note that Task 3 may trigger “post-incident procedures” if the ADS vehicle alerts the MRC that it has been achieved. As an example, a detailed redescription of the FOC operator’s Task 3 is provided in the Appendix Table 3.
FOC high-level tasks for on-route with passengers’ operational phase.
FOC subtasks while the vehicle is on route without passengers.
Through the development of the CoTA diagrams, not only agent-specific tasks are explored in depth, but also the key interface tasks are identified. Dedicated trigger tasks are included to represent specific scenarios, for instance, the ADS Task 3, each triggering specific subtask responses within Task 4, “Execute DDT fallback plan.” The FOC tasks operate in response to the ADS vehicle’s trigger tasks, and their success is inherently limited to the time available for the FOC operator to achieve sufficient situational awareness. This may depend on the human-system interface (HSI) available to the operator, whose characteristics and requirements should be specified and/or provided to the fleet operator by the ADS developer. The time-sensitive nature of these interface tasks emphasizes the need for adequate communication channels and may lead to stricter ODD requirements for passenger trips. This aspect is further discussed in Section 3.3.
The failure path of some pivotal ESD events is expanded through FTs focused on each agent, functionally decomposed until selected “Basic Events” described in Table 10. The agents directly participating in the “On-route with passengers” phase are the ADS vehicle and the FOC operators. However, the passive role of the MOC is shown through expanding pivotal events from this ESD.
Selected basic events for developed FTs.
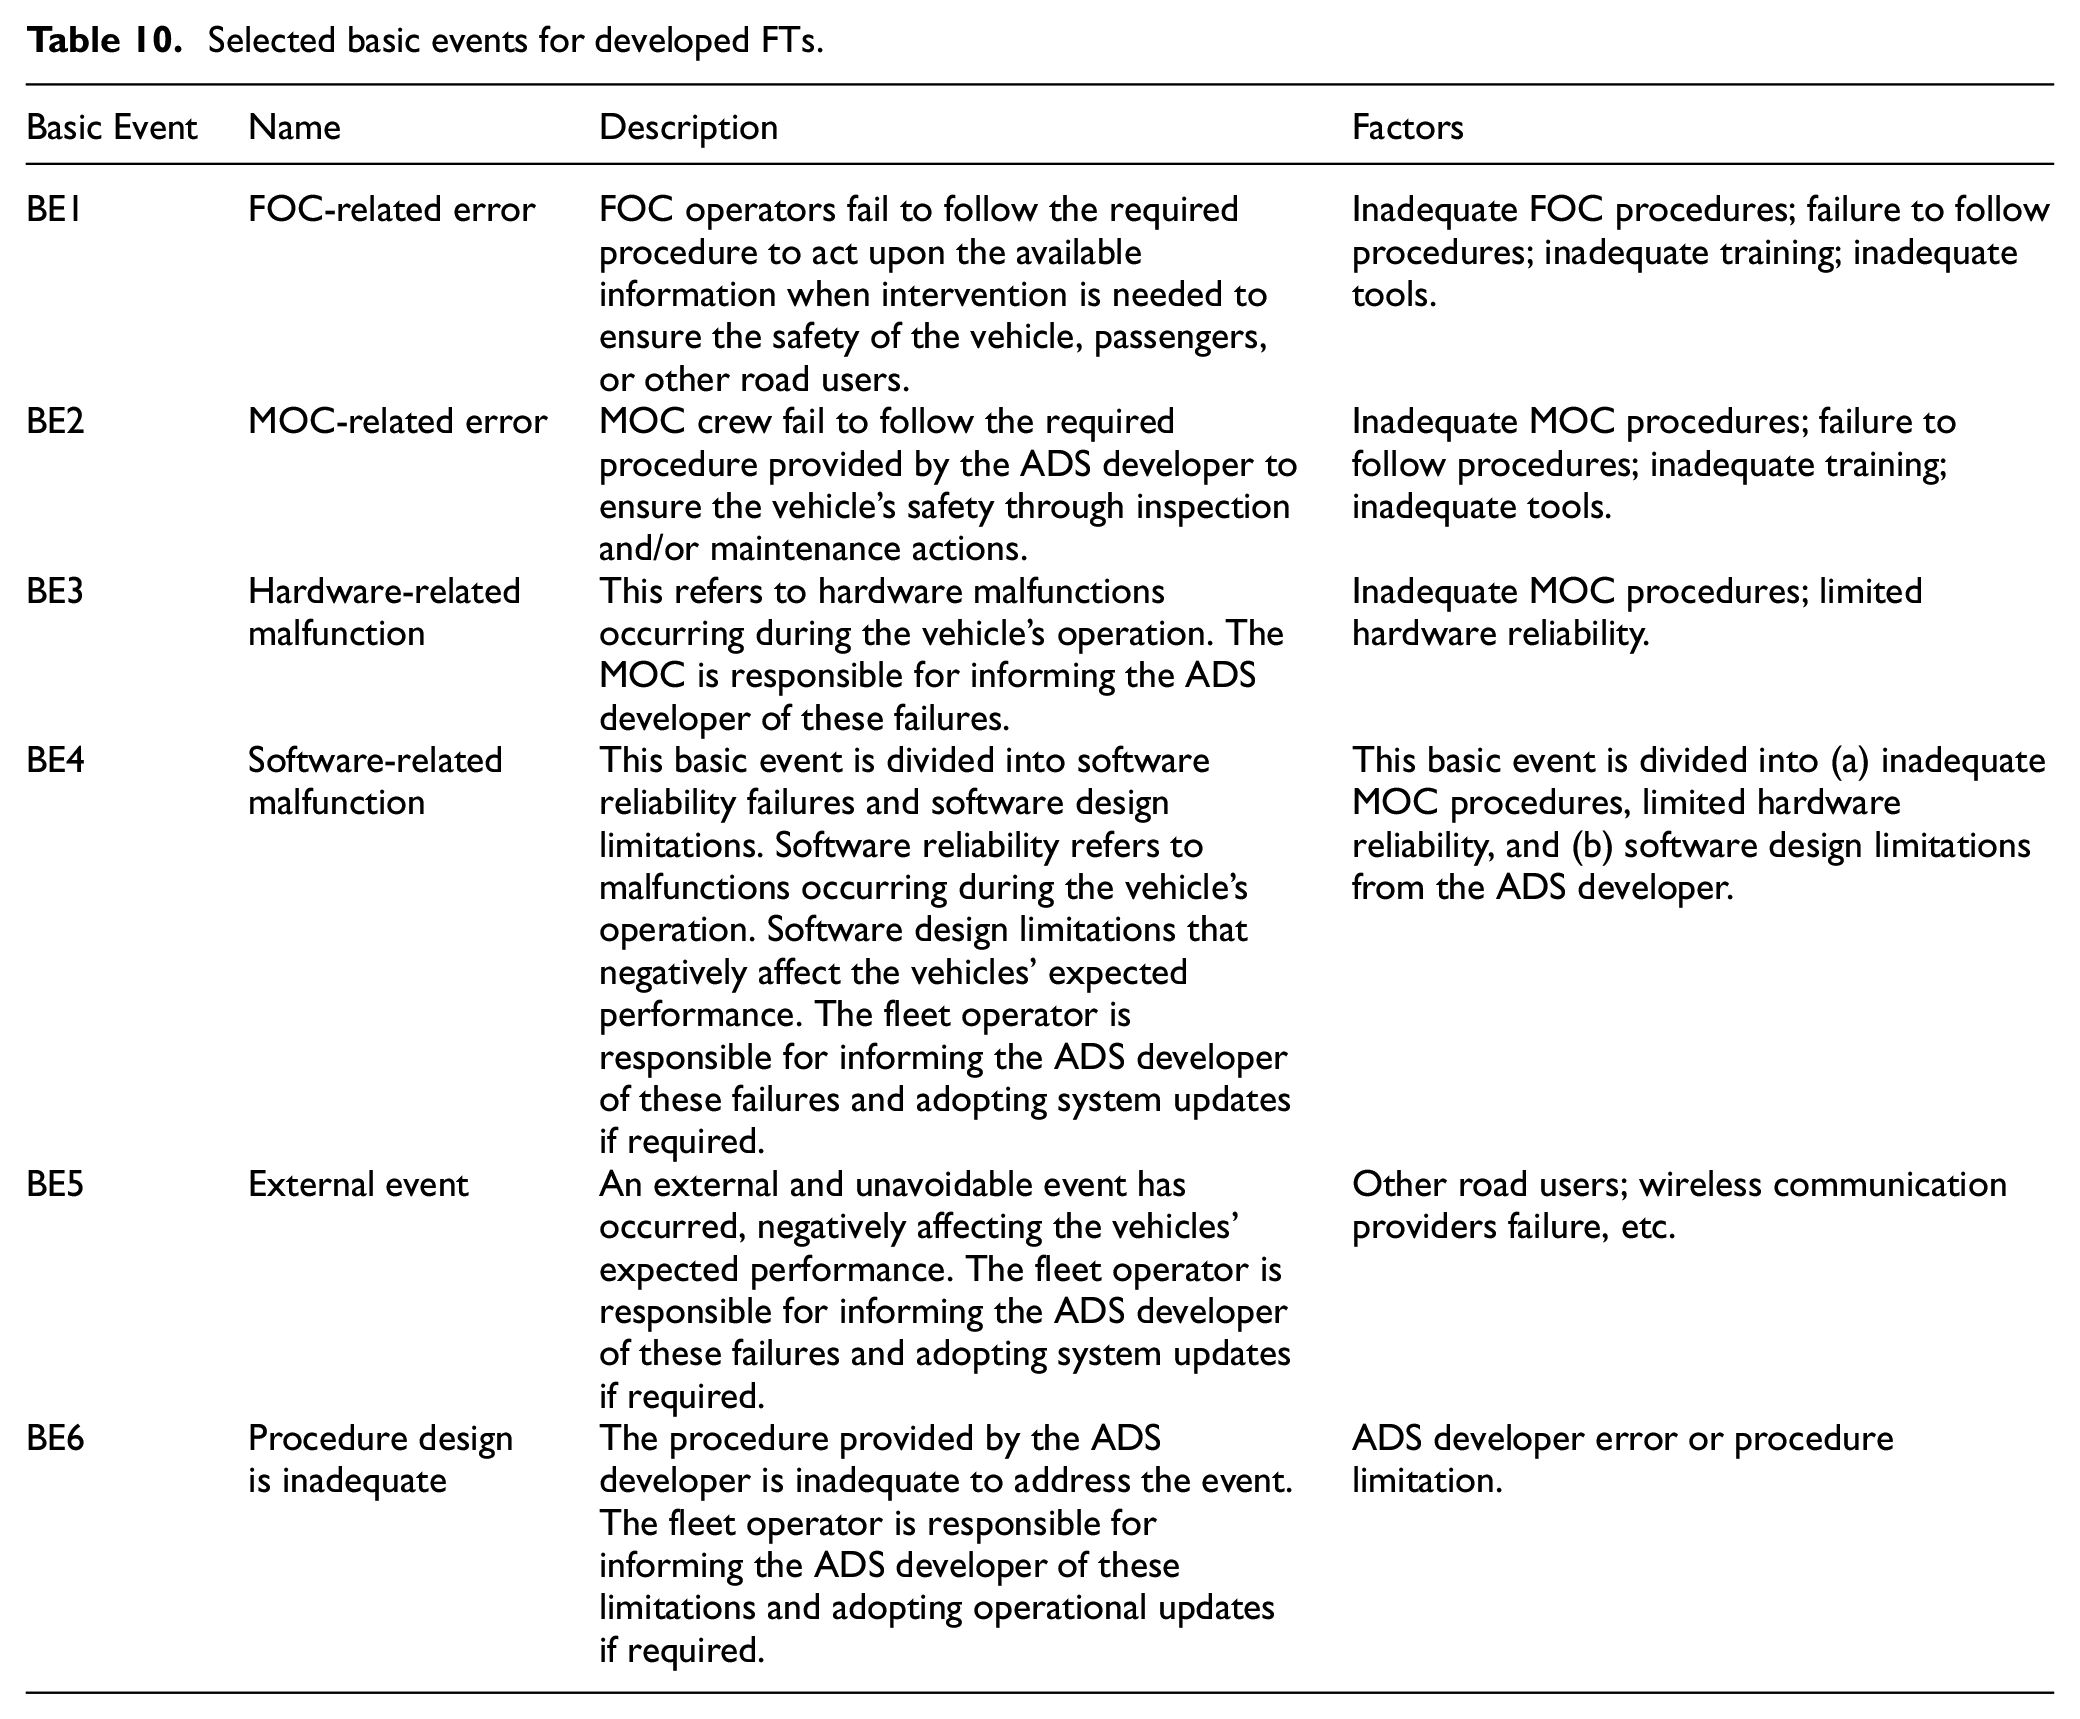
An example FT associated with the operational phase “on-route with passengers” is presented in this section. The top event, “II-1: FOC operator fails to detect DDT-fallback is required,” is related to the ESD event 2-D2 (Figure 10). This event is key to recovering from the failure of the ADS vehicle not detecting or implementing a DDT fallback correctly. In this case, the top event may be caused by communication errors between the FOC operator and the ADS vehicle or the FOC operator failing to follow established emergency procedures. The intermediate events are described in the Appendix Table 4 and Appendix Figure 1.
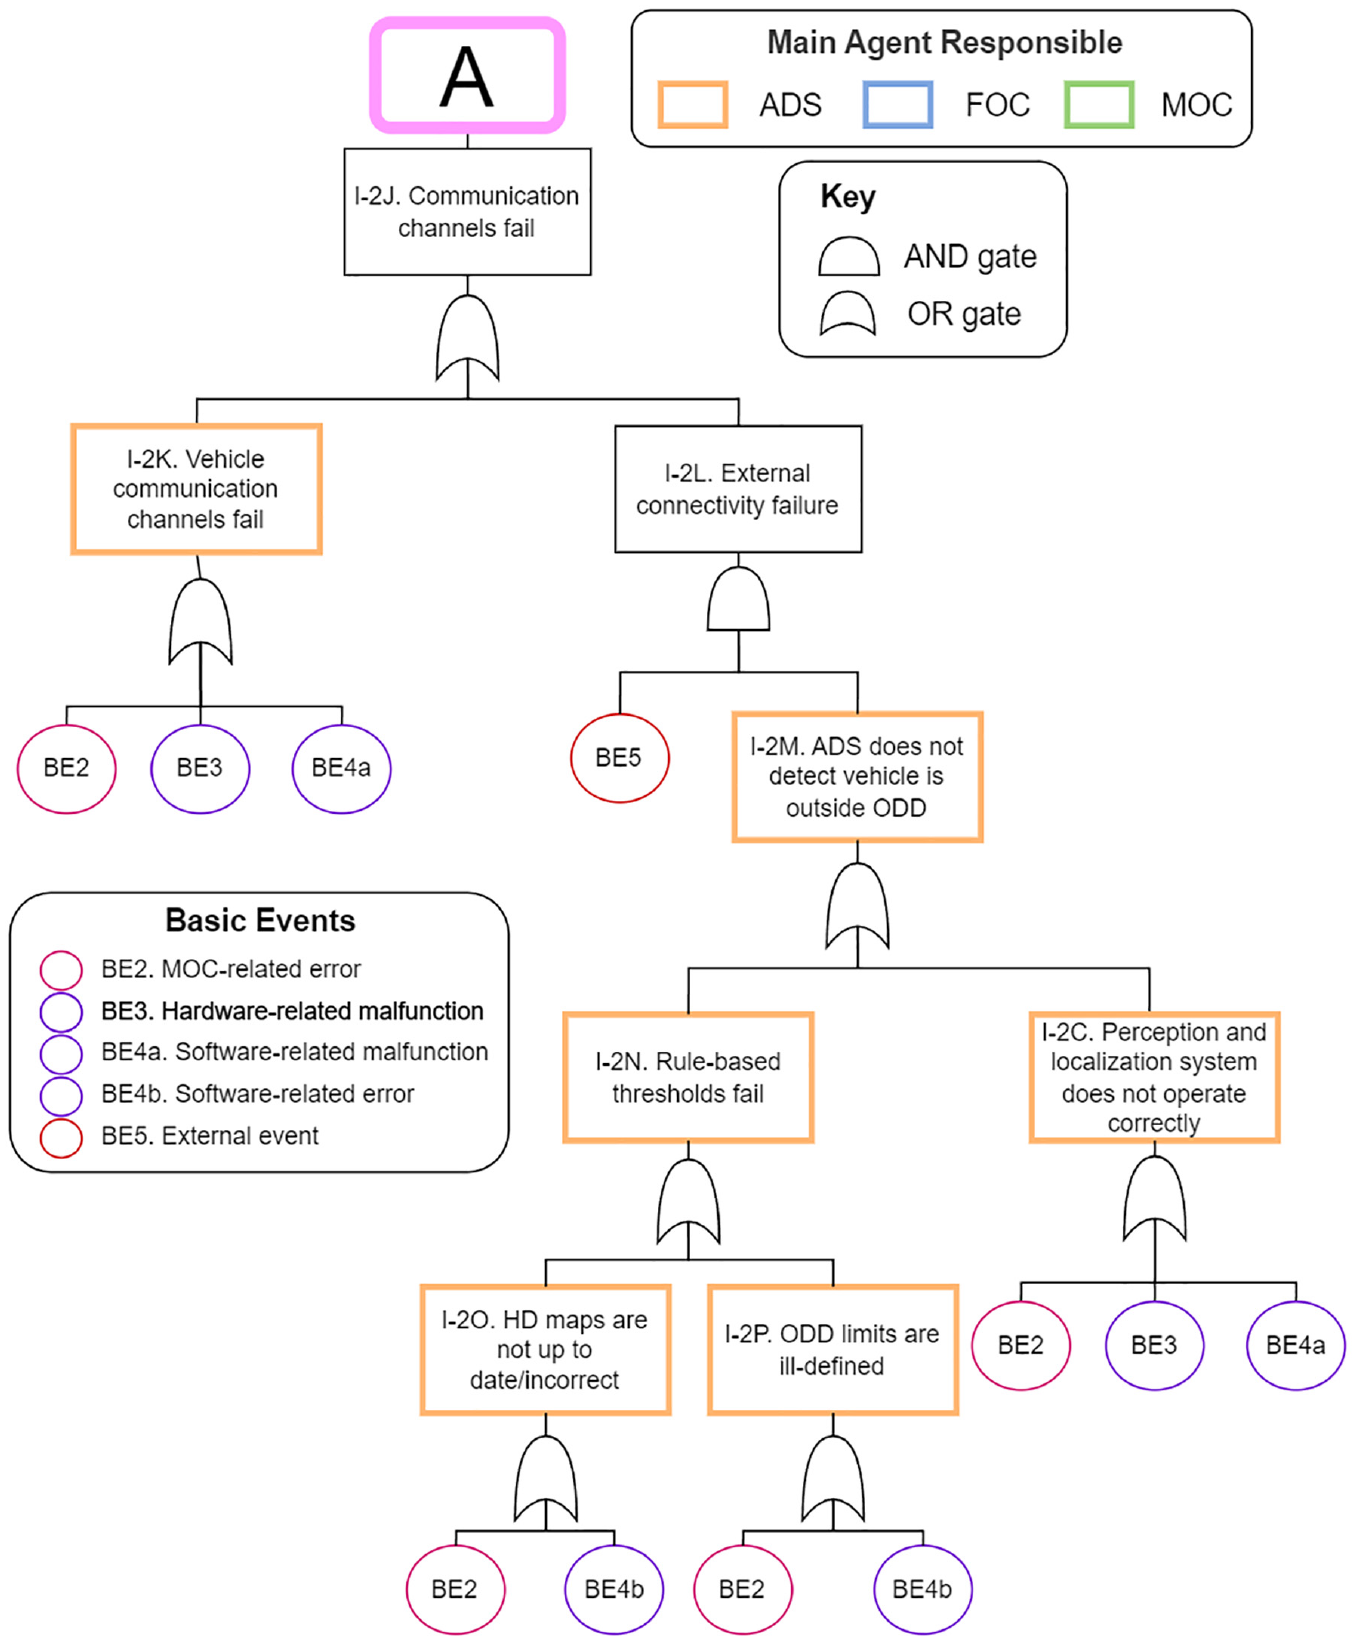
Top Event II-1 FOC operator fails to detect DDT-fallback is required.
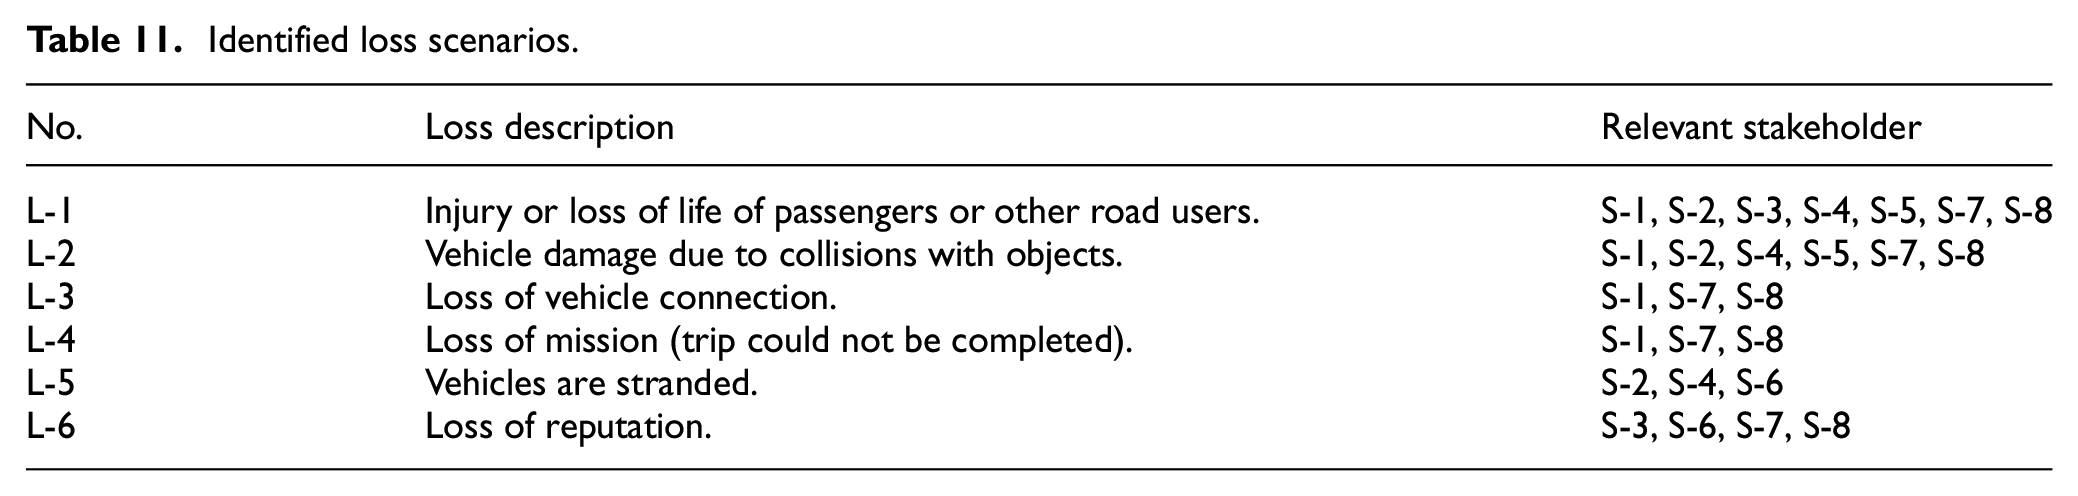
Following the procedure to apply STPA, the operation of the reference fleet of L4 ADS vehicles is considered within the broader MaaS context.86,87 The following stakeholders are considered: S-1 Passengers, S-2 Other Road users, S-3 Regulatory bodies, S-4 Law enforcement, S-5 First responders, S-6 Urban planning, S-7 Fleet operator, and S-8 ADS developers. Each of the stakeholders involved in the operation of the ADS vehicle may be associated with high-level loss scenarios. Of the loss scenarios presented in Table 11, L-1-L-3 directly relate to safety. While L-4 and L-5 may have safety connotations depending on the scenario, L-6 would have other consequences not related to safety, which would nonetheless affect the ADS’s operation.
Identified loss scenarios.
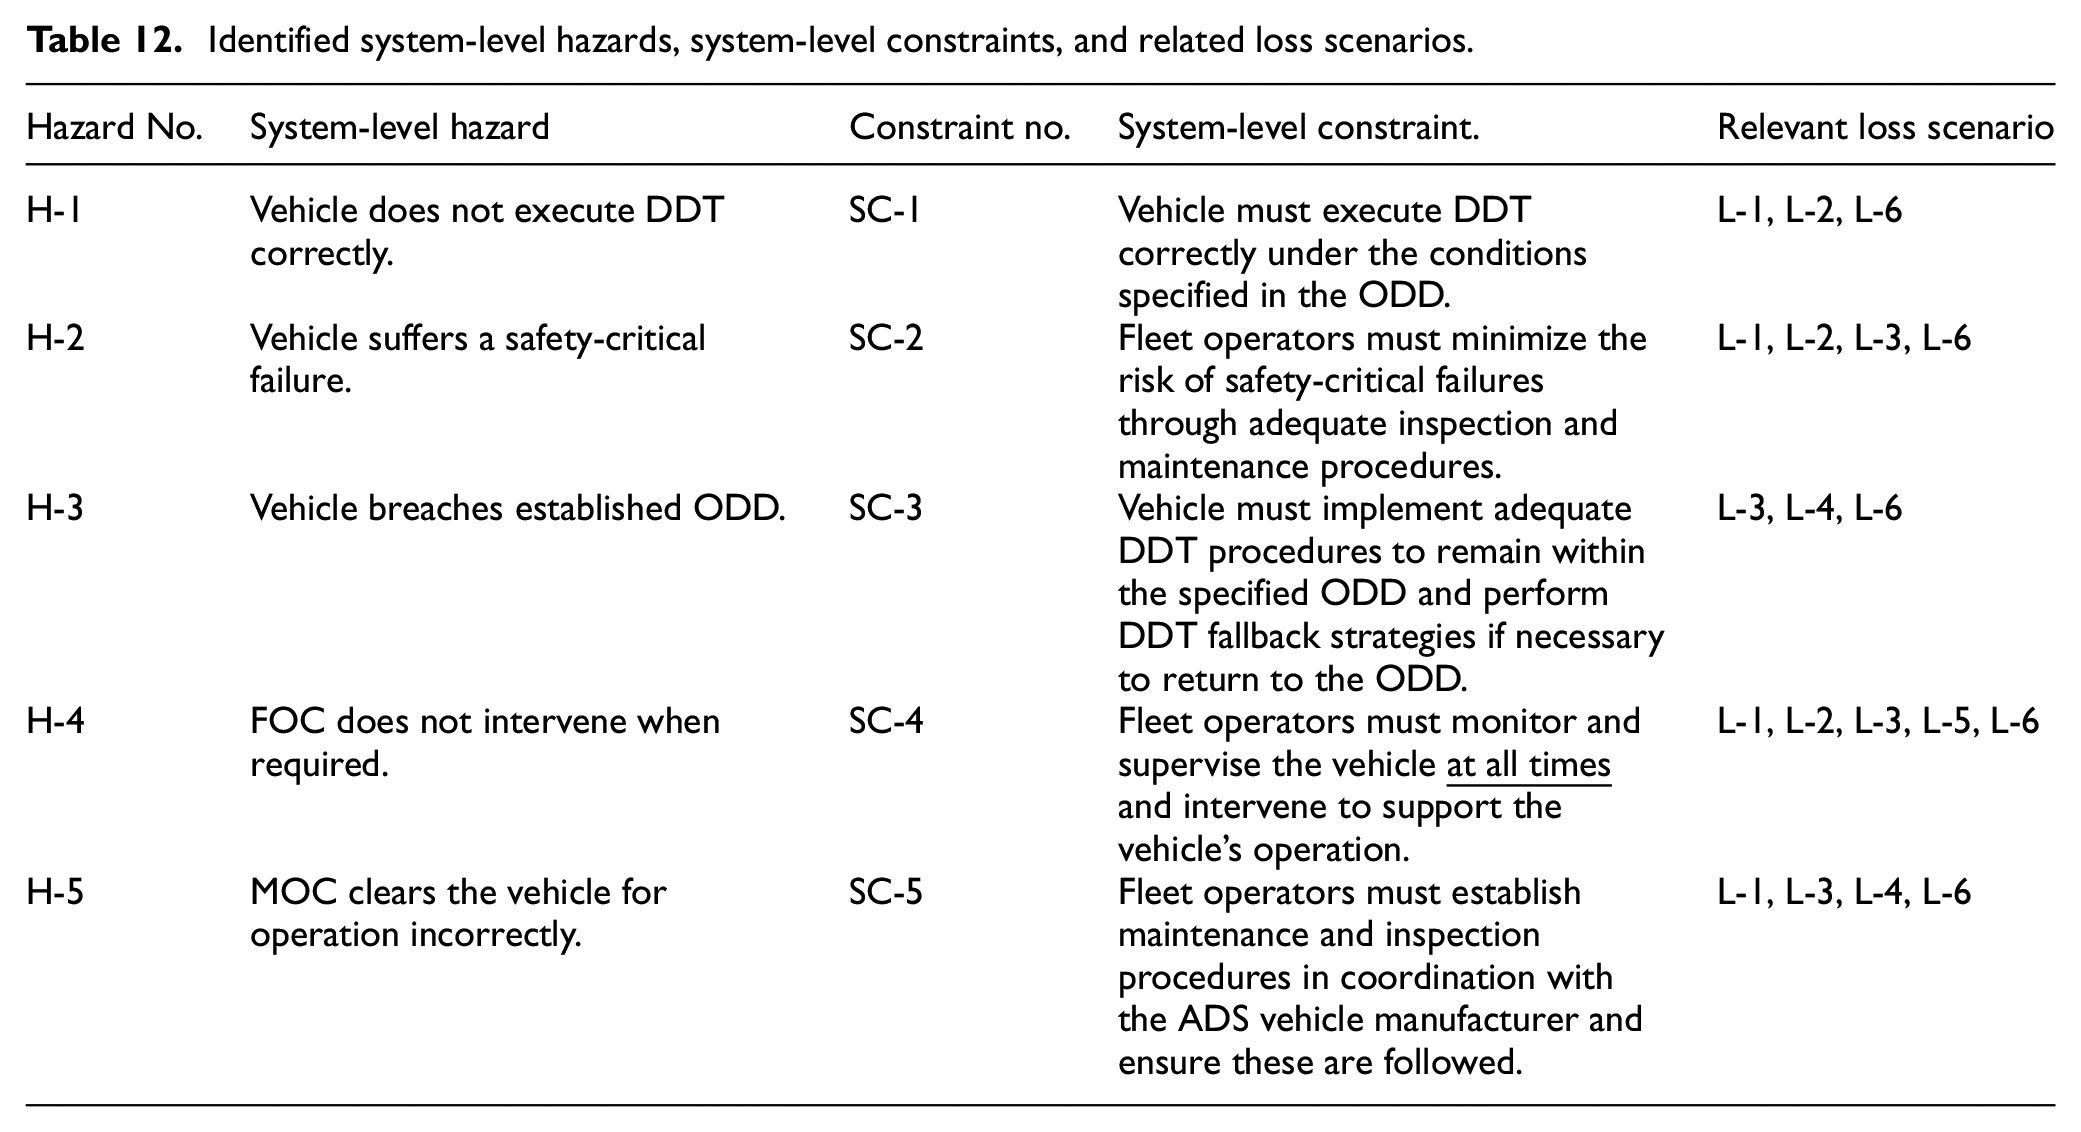
The system components and boundaries are defined based on Section 3.1 to identify the system-level hazards leading to these loss scenarios. The system-level hazards, constraints, and associated loss scenarios are presented in Table 12.
Identified system-level hazards, system-level constraints, and related loss scenarios.
The hierarchical control diagram based on the previous definitions is presented in Figure 11. The control structure considers the functional breakdown, associated control actions, and feedback loops. The functions of the three subsystems (i.e. agents) are organized in a vertical hierarchy, where the FOC and MOC controllers are at the highest level while the interaction of the ADS vehicle and its surroundings, “World,” is at the lowest level. Note that controllers receiving and emitting commands are placed at the same horizontal level. This modeling decision represents that the ADS vehicle’s operation is contingent on the fleet operator’s preventive and mitigative actions (FOC, MOC). The interactions with external agents can be summarized into five distinct types. The system’s outputs and entry information with the ADS vehicle’s surroundings (O1, E1), passengers (O2, E2), and third parties during vehicle operation (O3, E3), while interchanges with the ADS developer (O4, E4) and regulatory entities (O5, E5) focus on the management role of the fleet operator. Within the fleet operator, interactions between functional components are denoted with a “C” for control commands and an “F” for feedback, are numbered and carry a tag letter (a-d) to represent complementary actions (either emitted or received by the same controller). A brief overview of the diagram is summarized in this section. Details about the control actions are described in Appendix Table 5 and Appendix Table 6.
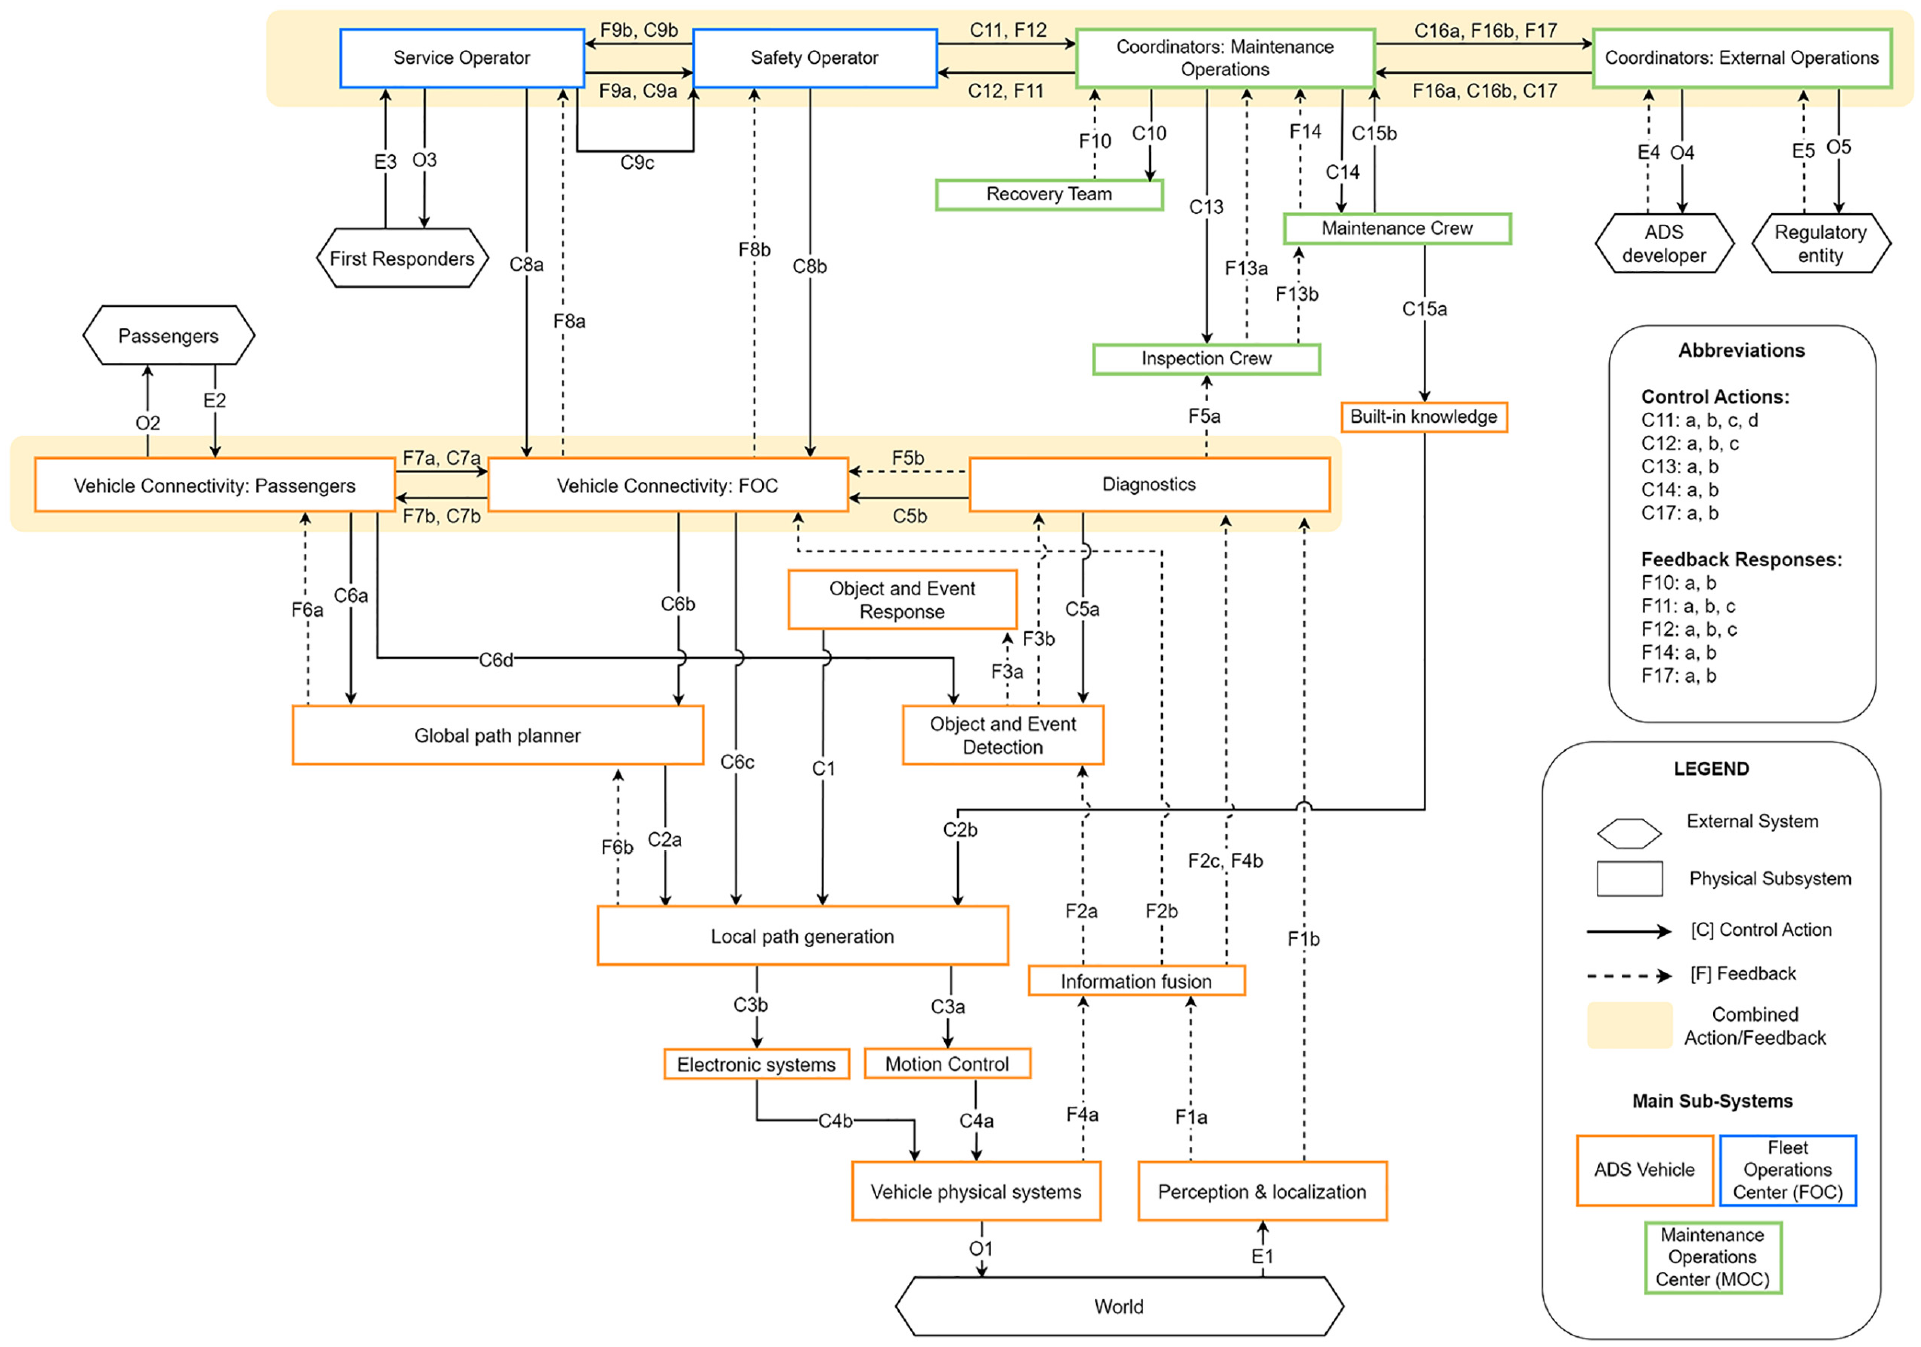
Fleet operations control diagram.
The first interface of the vehicle to its surroundings is the collection and processing of sensor data (F1) to support diagnostic (F2) and DDT planning (F3) functions. Likewise, sensor data from the vehicle’s physical systems is also collected and processed for diagnostic purposes (F4). The vehicle’s physical behavior (C4) may be altered by evolving local path generation plans (C1), navigation goals, ODD constraints (C2), DDT-fallback triggers (C5), or commands received by the FOC or passengers (C6). The ADS transmits vehicle health data (F5) and receives commands from the FOC to communicate with passengers (C7) and intervene in the event of emergencies (C8). Communications between the FOC and the MOC consist of coordinating inspection and maintenance activities, post-incident procedures, and vehicle recovery (C11, C12). The MOC coordinators act as the main manager of MOC crew activities, relaying information internal maintenance operations (C13, C14), and the vehicles’ recovery team (C10). Abnormal vehicle conditions discovered through inspection and maintenance operations are reported to the MOC (F13, F14), while system updates are managed in cooperation with the ADS developer (C15). Other interactions between the MOC and the ADS developer consist of management of change, coordination of external maintenance operations (C16) and fleet operations review (C17).
Stage II was conducted for all the operational phases defined in Stage I. Eight ESDs were developed to represent the operational phases, containing over 100 events related to the agent’s performance and 41 distinct end-states. Following this, 16 CoTA models were developed based on the ESDs, identifying over 200 tasks for the ADS, FOC, and MOC agents. Then, 13 ESD events were selected for further exploration through FTs, decomposing the top failures into over 120 intermediate events characterized by the six basic failure events detailed in Table 10. Finally, the STPA model developed is summarized in 38 control actions and 35 distinct feedback responses. The information generated at this stage was organized as equivalency tables, as the example presented in Table 3.
Stage III: Hazard identification
Implementing Steps 8–9 resulted in a total of 43 high-level hazards identified associated with 912 failure modes, providing traceability of multiple failure modes and agent interactions. Of these failure modes, 211 (23%) were unique, meaning these were connected to only one of the 43 hazard scenarios. Table 13 summarizes the failure modes identified by agent and method.
Failure modes identified per agent and method.
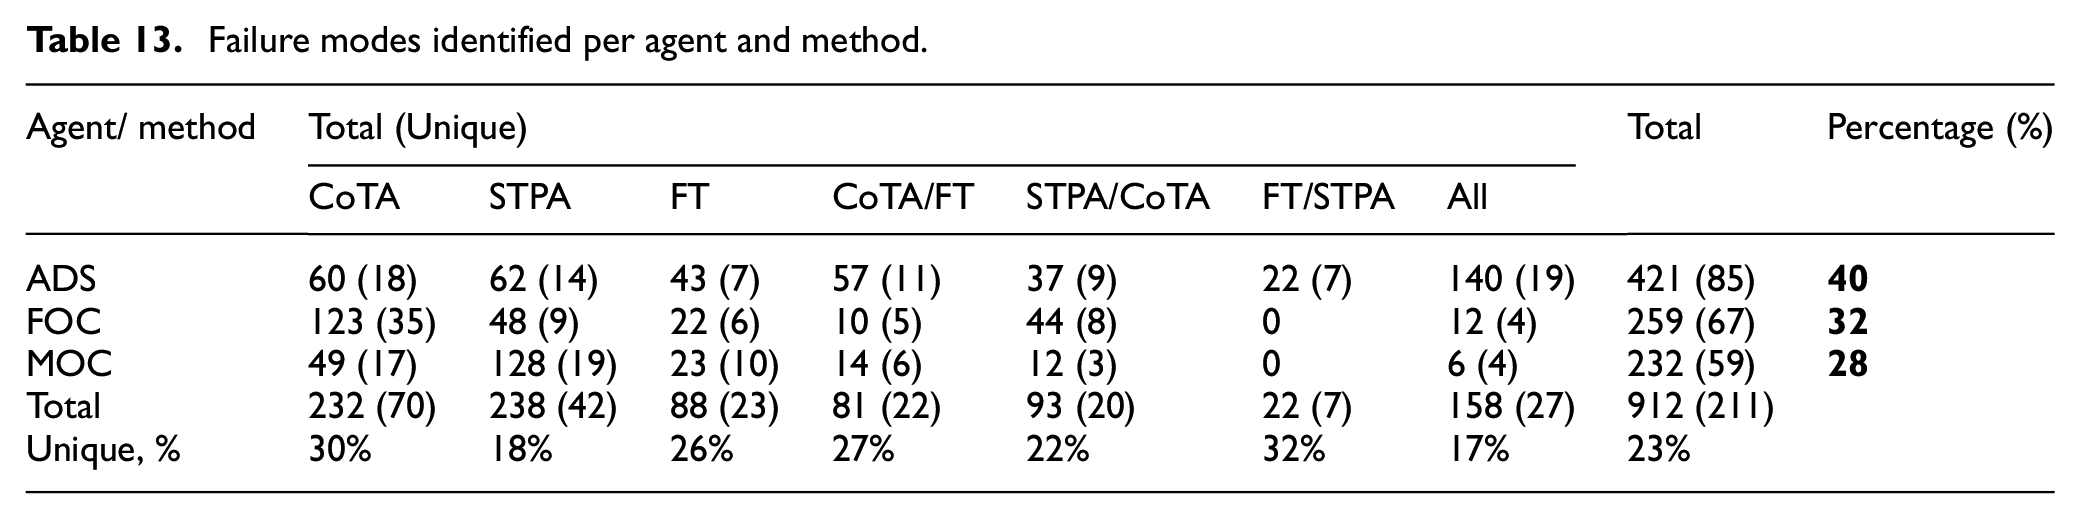
The distribution of failure modes characterizing each hazard scenario strongly depends on the focus with which Stage II was developed. In this application, in addition to failure modes directly related to an ESD event’s failure path (i.e. the hazard scenario), we have chosen to incorporate indirect failure modes explicitly. These originate from parallel and trigger tasks (CoTA) and dependent information pathways (STPA) leading to specific failure modes. Note that only the lowest levels of CoTA tasks and FT events were considered in the final list of failure modes. Likewise, FTs were only developed for selecting ESD events, hence covering a limited number of contributing failure modes. In relation to the system’s agents, the ADS has the highest number of contributing failure modes (40%), followed by the FOC operators (32%) and the MOC crew (28%). The COTA method provided more contributing failure modes related to the FOC operators and FTs provided more details to issues with the ADS vehicle. This relation may be expected, given that CoTA was developed specifically to address human-system interactions in complex systems, while FTs have been extremely popular to describe hardware and software failure events. STPA, on the other hand, contributed significantly to characterizing procedural issues of the MOC crew, particularly procedures not fully captured by the ESD-based scenario development (e.g. management of change issues). The highest overlap between the methods is observed regarding the ADS vehicle, for which 158 (27 unique) failure modes were identified.
Figure 12 provides an overview of distribution of failure modes by method, considering the (a) total number and (b) those uniquely connected to a hazard scenario. Focusing on the 211 unique failure modes, CoTA generated 66%, STPA 45%, and FT 37% (Figure 12(b)). Considering the failure modes identified by a single method, CoTA is responsible for 33%, STPA for 20%, and FT for 11%. However, there was also several redundant failure modes – 23% were identified by two methods (10% CoTA/FT, 9% CoTA/STPA, and 3% STPA/FT) and 13% by all three.
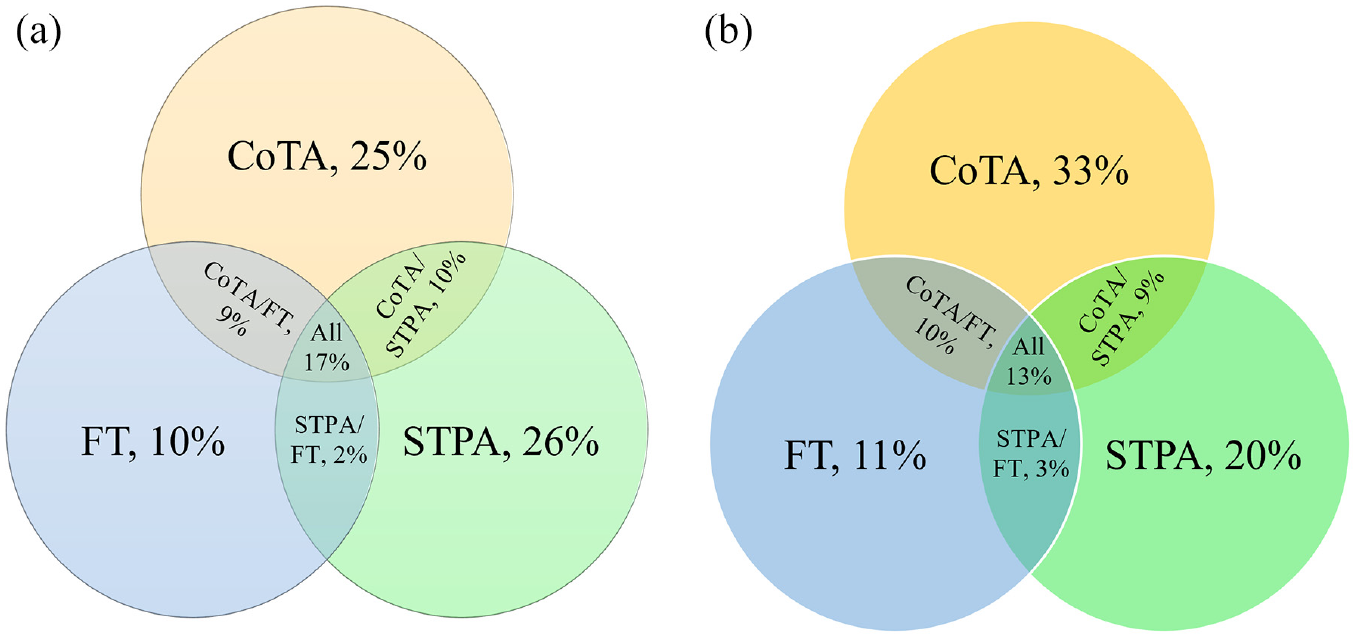
Distribution of identified failure modes by method (a) Total, (b) Unique.
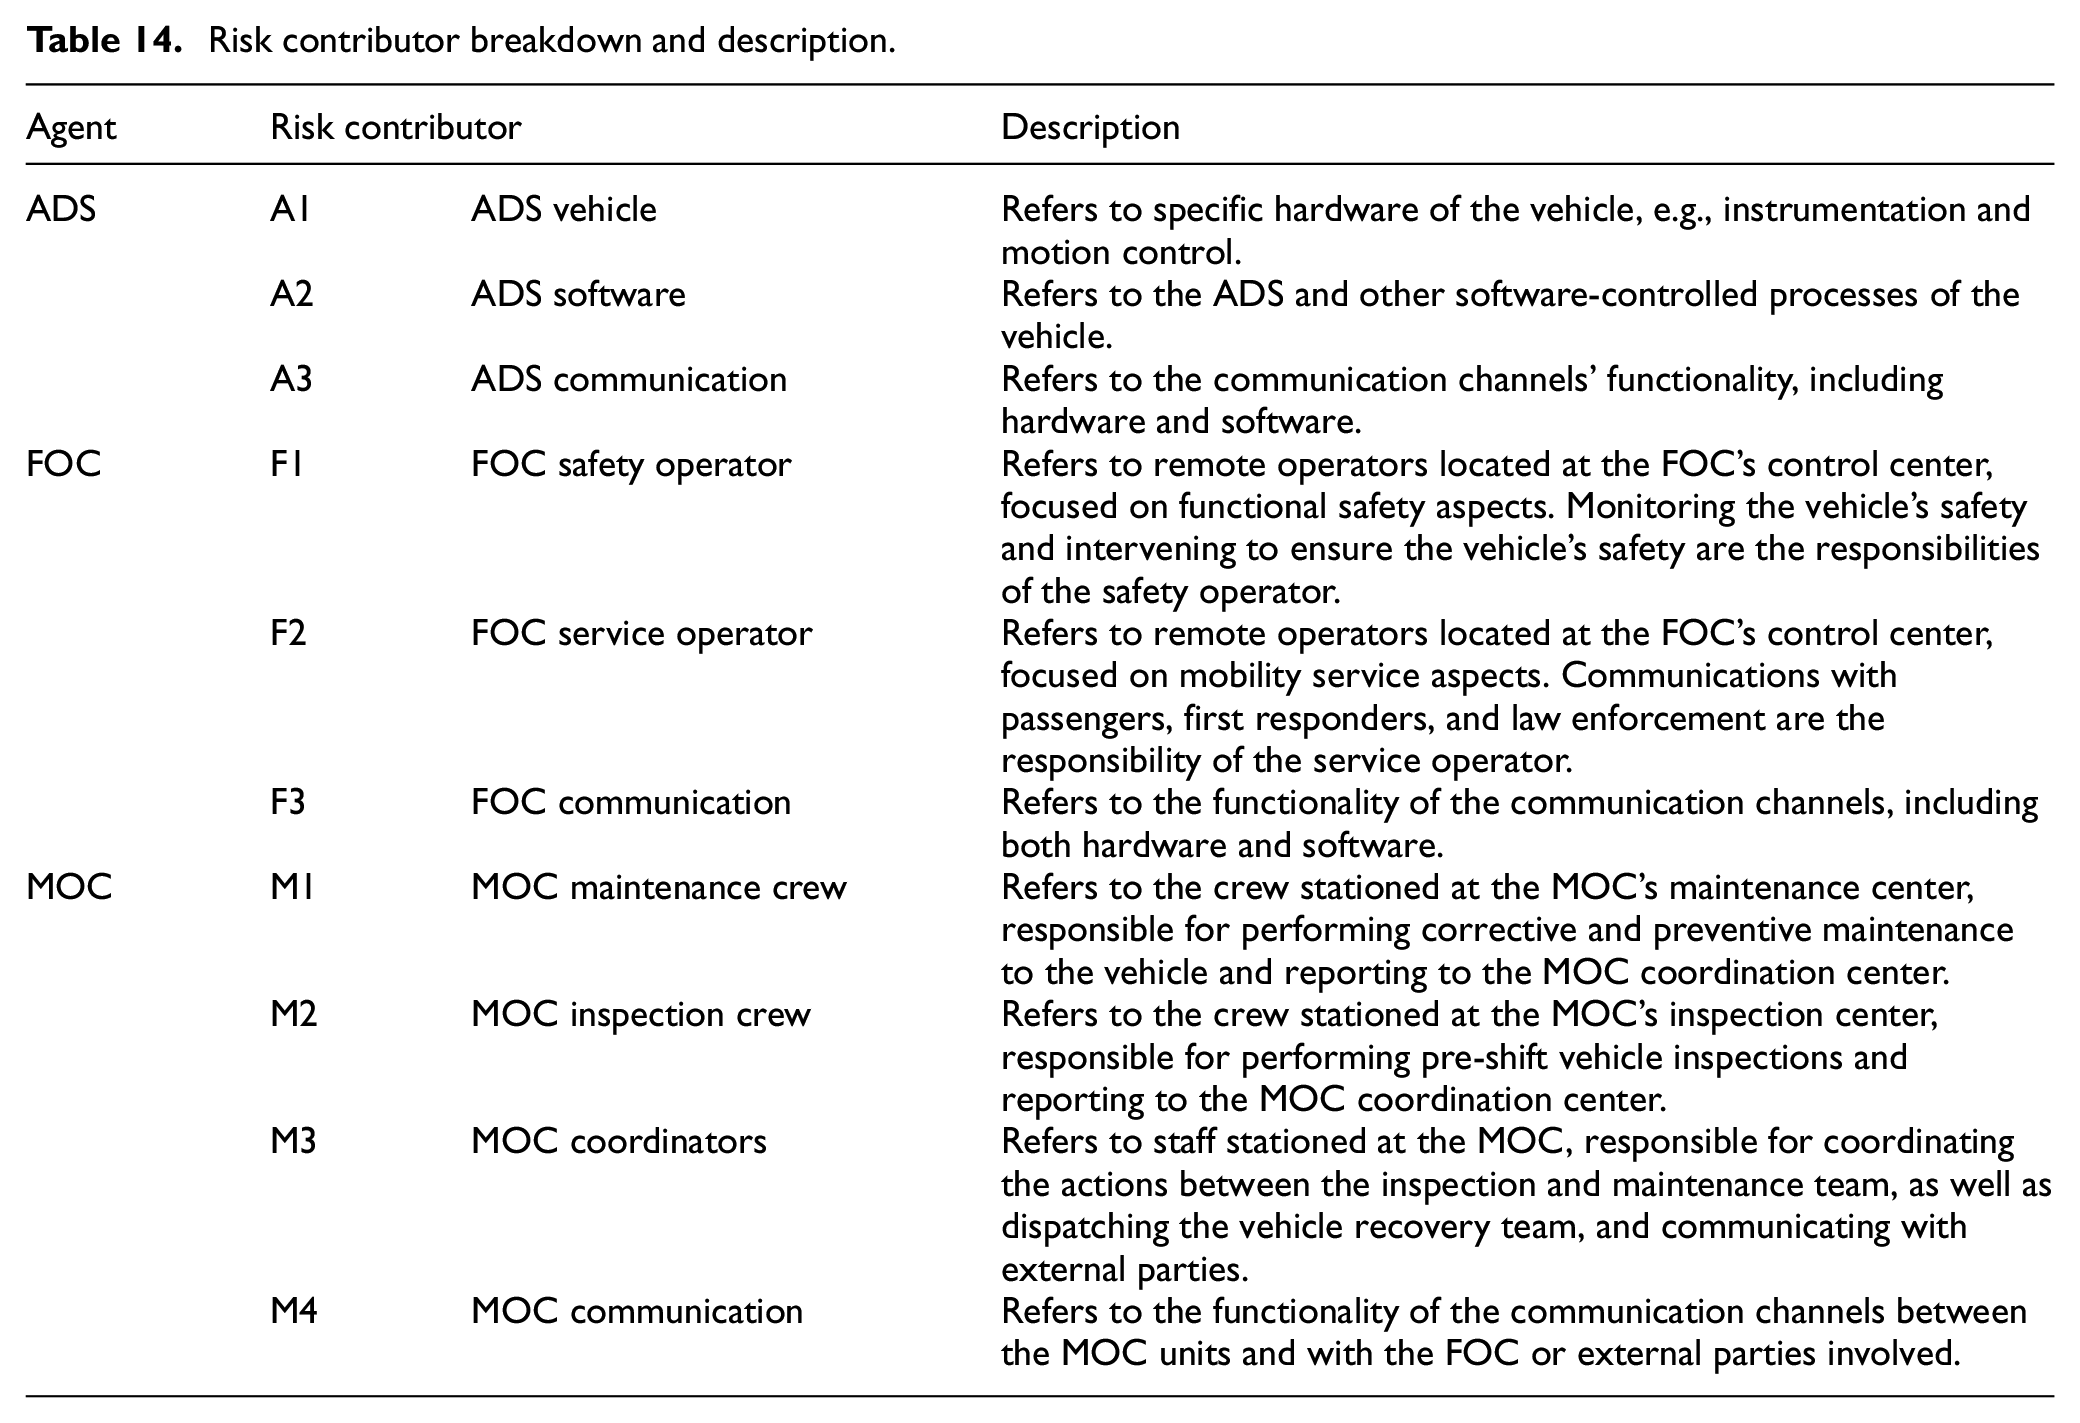
Each failure mode is associated with a single risk contributor described in Table 14. These are selected based on the functional breakdown of each agent performed during the system and scenario modeling stages. This division of agent functions is valuable in determining hazard prevention and mitigation responsibilities (see Section 3.4 for further details).
Risk contributor breakdown and description.
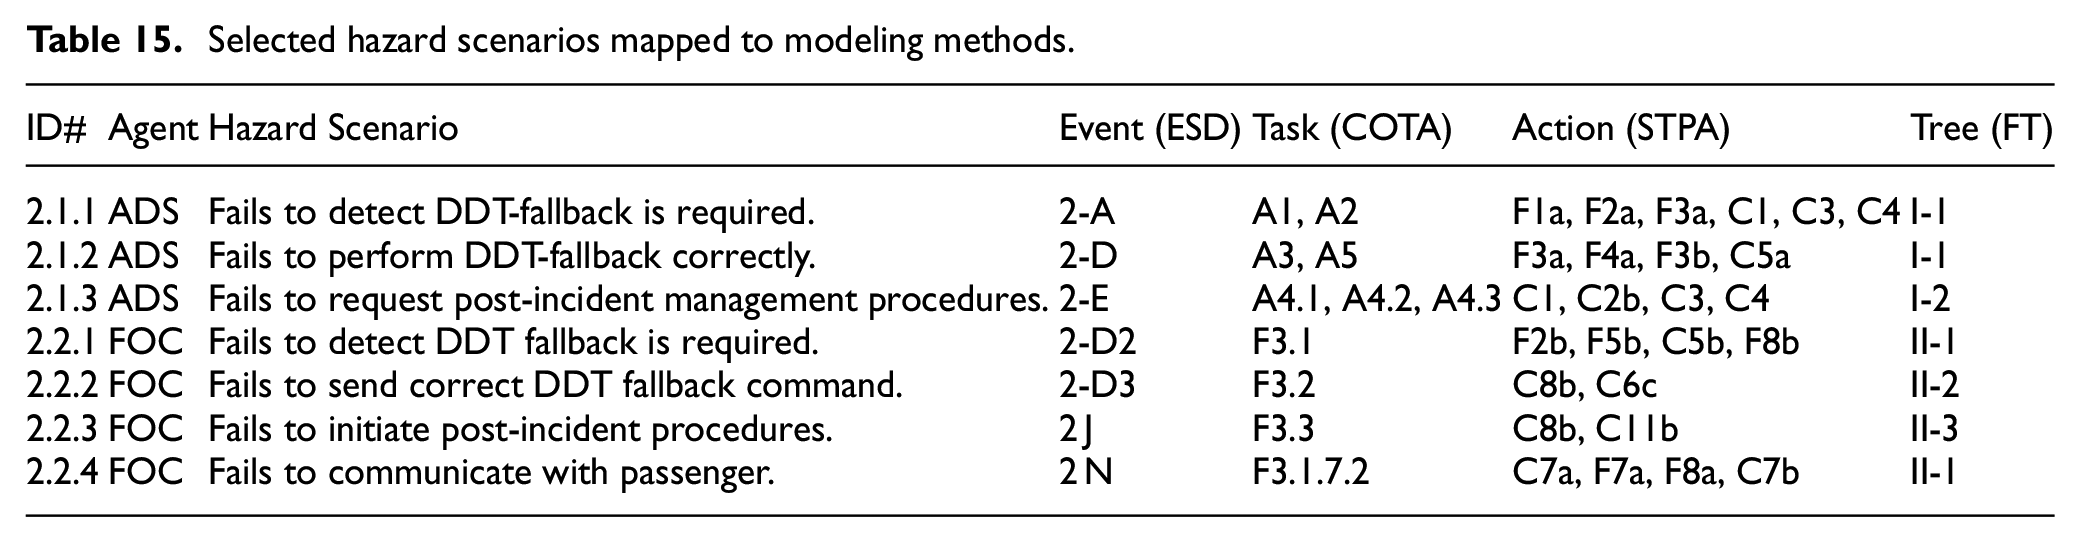
As an example, Table 15 presents the hazard scenarios identified during the “on-route with passengers” operational phase. This table provides the explicit connections between events developed to describe the ESD and the functions and interactions that support the success of events. The latter are derived from the corresponding CoTA, STPA, and FT diagrams. This aims to demonstrate how contextual information given by the operational phases determines which tasks and interactions are required to perform each subsystem’s functions.
Selected hazard scenarios mapped to modeling methods.
Details on the Hazard Scenario Example: #2.2.1 “FOC does not detect a DDT fallback is required” are discussed as follows. This hazard is characterized by the main failure modes provided in Table 16 and related indirect failure modes shown in Table 17. As the hazard derives from the failure path of the event 1-D2: “FOC detects DDT fallback is required,” the success of this event is described by the task F3.1: “Determine if a DDT fallback plan is required” (see Appendix Table 3). To determine that a DDT fallback is required, the FOC operator must assess whether the vehicle has breached the ODD (F3.1.1). This requires the operator to be trained in what is contemplated within the vehicle’s ODD (F3.1.1.1) and have the tools to assess the vehicle’s location and/or surroundings in real-time (F3.1.1.2).
Example hazard scenario #2.2.1 main failure modes.
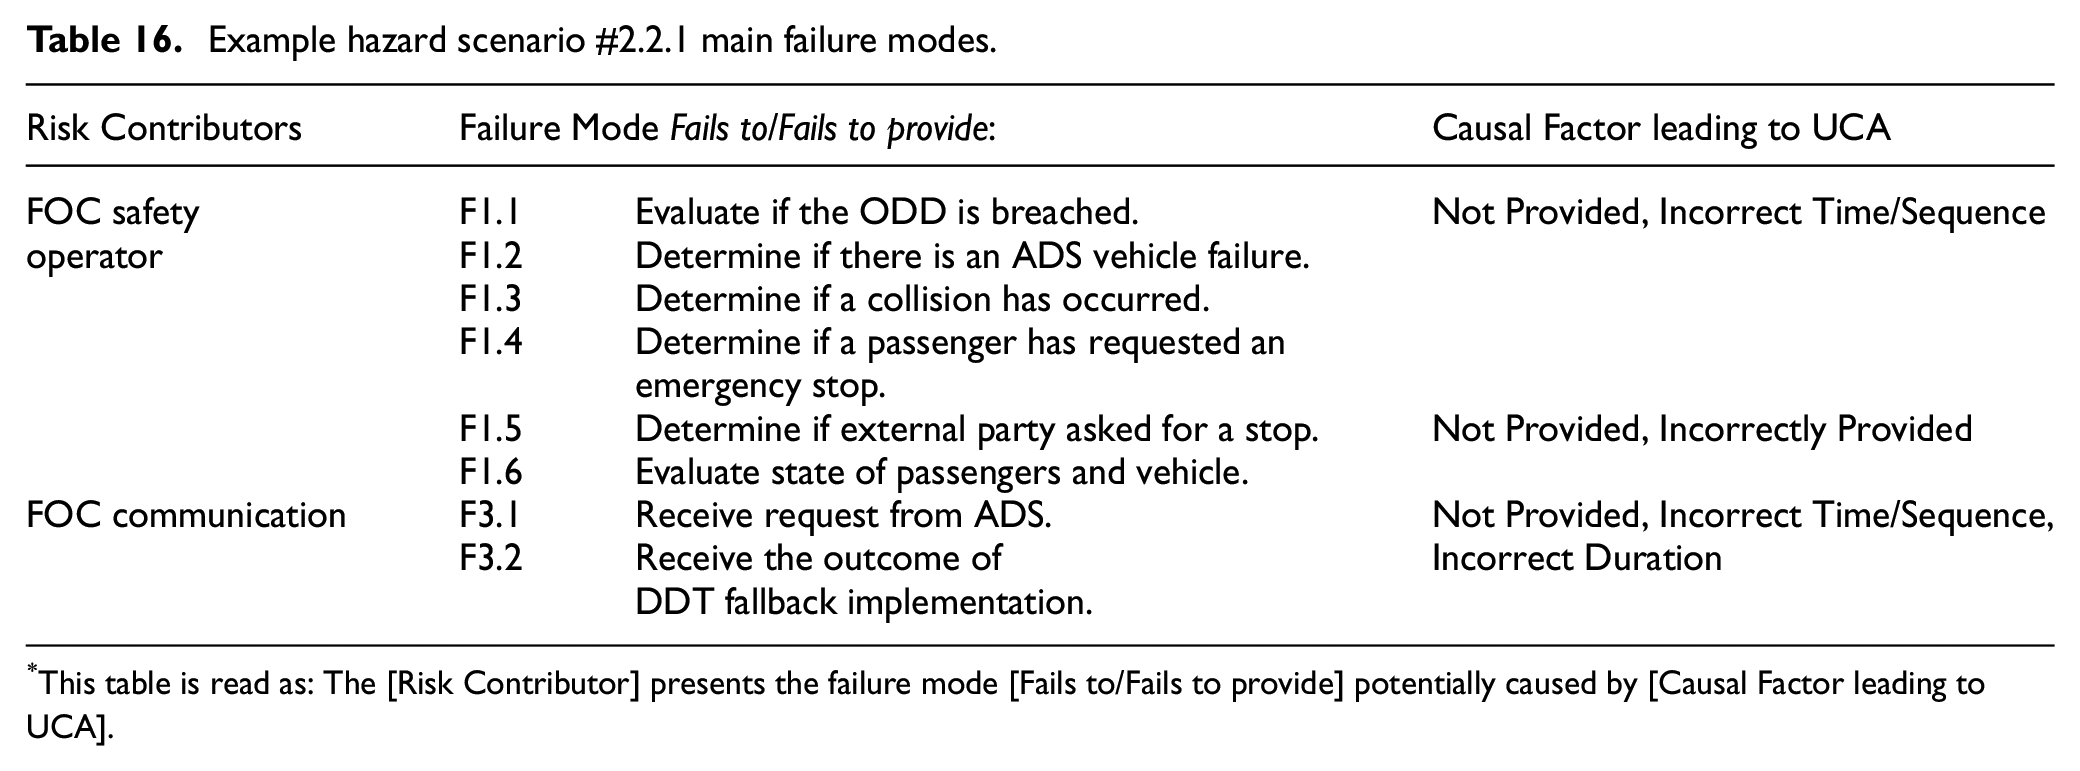
This table is read as: The [Risk Contributor] presents the failure mode [Fails to/Fails to provide] potentially caused by [Causal Factor leading to UCA].
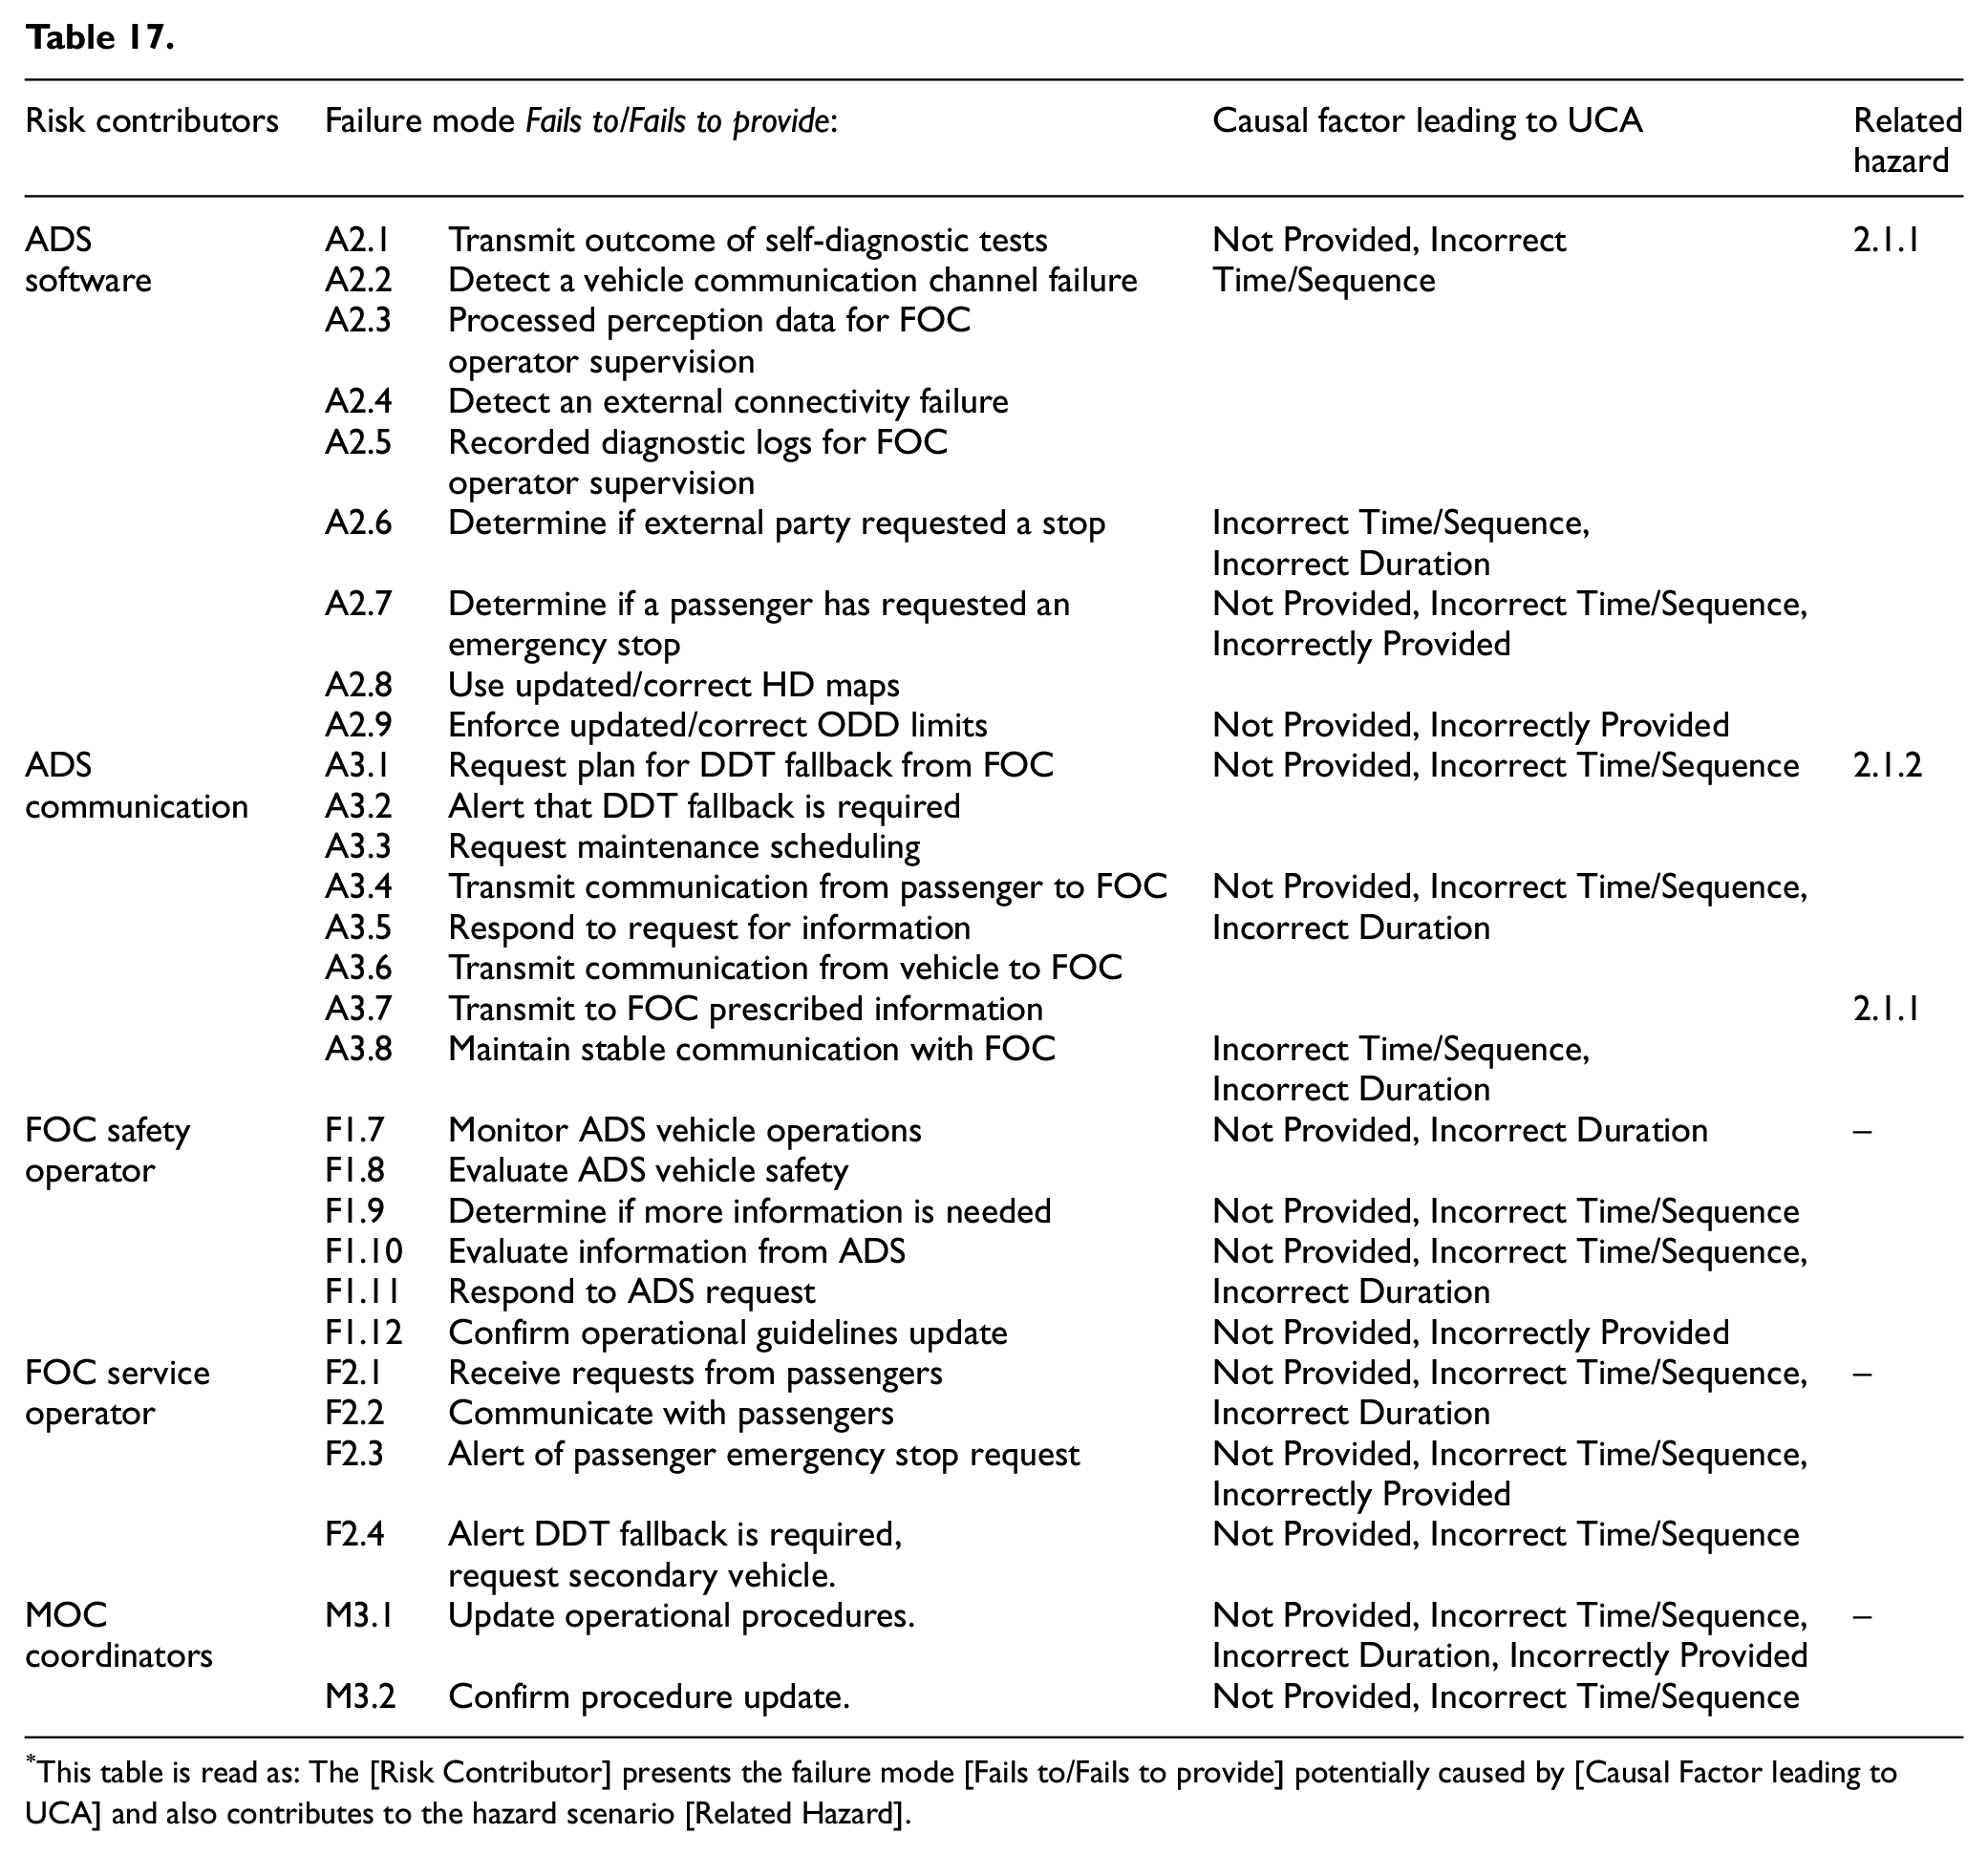
This table is read as: The [Risk Contributor] presents the failure mode [Fails to/Fails to provide] potentially caused by [Causal Factor leading to UCA] and also contributes to the hazard scenario [Related Hazard].
Similarly, the operator is expected to assess whether the vehicle has failed to respond adequately if an on-board failure has been detected, a collision has occurred, if an external party has requested a stop (i.e. law enforcement or first responders), or a DDT fallback plan was not executed correctly. As detailed in Table 9, Task 3 is expected to be performed by the FOC operator in parallel to continuously monitoring the vehicle’s operation, receiving and requesting information from the vehicle when required, and assessing if the vehicle needs to be dispatched elsewhere (Task 1, 2, and 4). The redescription of these tasks (in particular, Tasks 1 and 2) highlights the importance of the reliability and safety of the communication channels (e.g. video, sensors, and alarms) between the FOC safety operators and the ADS vehicle.
This critical aspect is further indicated by the key control actions and feedback that, when disrupted, may lead to a hazard scenario. An error in these control actions may be expressed as Not Provided or Incorrectly Provided (wrong action), Incorrect Time/Sequence (too early or too late), or Incorrect Duration (too long or too short), depending on the type of action (see Table 16). For instance, the quality and completeness of the information recorded by the vehicle is also of great importance in providing the FOC operator with the necessary tools to detect that a DDT fallback is required (F2b and F5b – errors arise through Not Provided or Incorrect Time/Sequence). Note that this depends not only on the reliability of the communication network but also on the design of the FOC human-system interface (HSI) (II-1F, Appendix Table 4). While the failure of the communication channels (II-1B, Appendix Table 4) can unexpectedly occur during operation, it may be the result of imperfect inspection and maintenance procedures (BE2: MOC-related human errors) or due to an improper frequency of maintenance activities (BE6: procedure design error) – both expressed through control actions Not Provided or Incorrectly Provided.
On the other hand, the ability of the FOC operator to detect potential threats to the vehicle’s operation may be significantly reduced if the ADS self-diagnostic module fails to detect an on-board failure (I-1B). Further, training, shift hours, and other factors can affect the operator’s situational awareness (II-1I, Appendix Table 4). Additionally, the pre-defined DDT-fallback procedures may not be adequate for the specific scenario which triggered the DDT fallback. This issue might be of importance during the initial period of operation of the fleet or given changing road conditions (e.g. construction zones, changing traffic signals). These procedures are of great importance, particularly when discussing hardware failures that the ADS self-diagnostic system cannot monitor without additional and failure-specific sensor systems (e.g. broken windshield or braking lights). Moreover, the ADS vehicle may not be capable of detecting every failure that affects its performance. The ADS vehicle manufacturer and the fleet operator are expected to establish which components or subsystems require a more frequent inspection to avoid unexpected operational failures.
This process is repeated until Step 10 is completed, and a hazard catalog compiles the list of contributing failure modes in the form presented in Tables 16 and 17 for each hazard scenario derived. Applying the proposed hazard identification methodology to the entire system yielded 43 high-level hazards associated with over 900 contributing failure modes. This enables the analyst to trace contributing failure modes and risk contributors across multiple hazards occurring during the same or distinct operational phases. Linking the contributing failure modes to specific risk contributors can be used to derive a list of operational safety responsibilities for each agent.
Safety responsibilities and risk mitigation measures
The results from the hazard identification methodology can be used to further explore the agents responsible for preventing the contributing failure modes. As presented in Table 17, while many operational hazards may be related to ADS failures or errors (e.g. a faulty sensor triggering an MRC), the underlying causes potentially can be detected, identified, and addressed before operation (e.g. pre-shift inspections). It must be emphasized that this process of identifying operational safety responsibility aims to improve existing safety barriers or countermeasures at different levels – remote operator, maintenance crew, fleet operator, or other organizations involved in operating the ADS-equipped vehicles. While the operational safety responsibilities highlighted in Table 18, for example, following established procedures, completing related tasks, etc., are linked to specific agents at a functional level, each activity is supported by the fleet operator.
Example of operational safety responsibilities from hazard scenario #2.2.1.
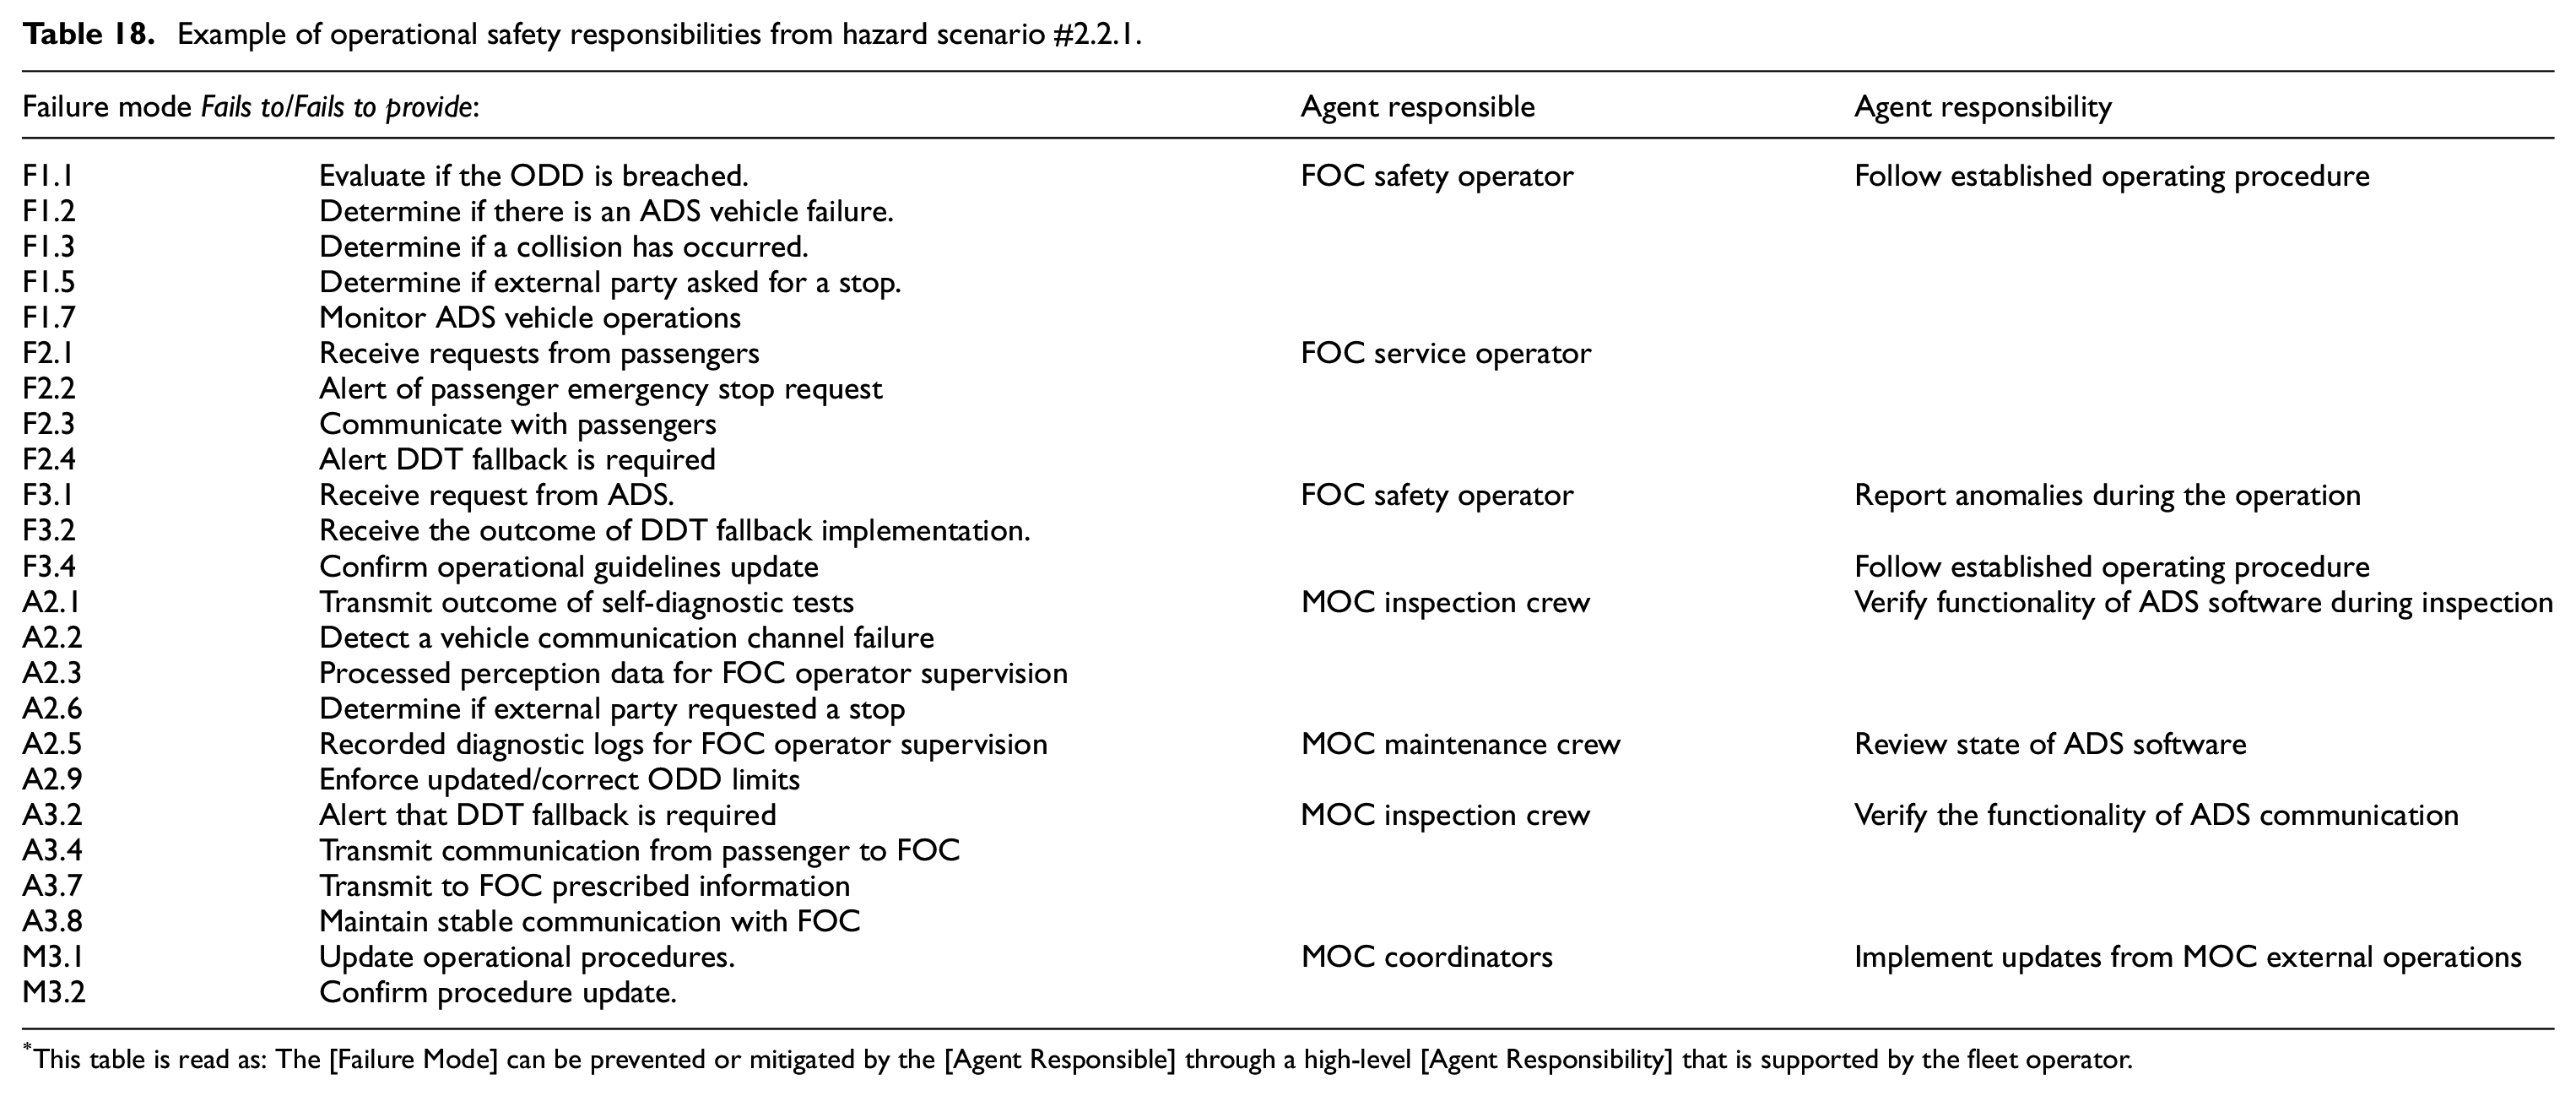
This table is read as: The [Failure Mode] can be prevented or mitigated by the [Agent Responsible] through a high-level [Agent Responsibility] that is supported by the fleet operator.
Given the relationship between the fleet operator and the ADS developer assumed for this analysis, the role of the fleet operator is generally limited to complying with operational requirements specified by the ADS developer. For instance, the ADS developer is expected to establish certain inspection and maintenance procedures requirements. However, the fleet operator may be considered responsible for developing internal operational procedures, and providing or certifying that their operators and crew members receive adequate training or tools to perform their tasks. Some operational procedures or tools may require input from the ADS developer, depending on the fleet operator’s access to the system’s hardware and software components.
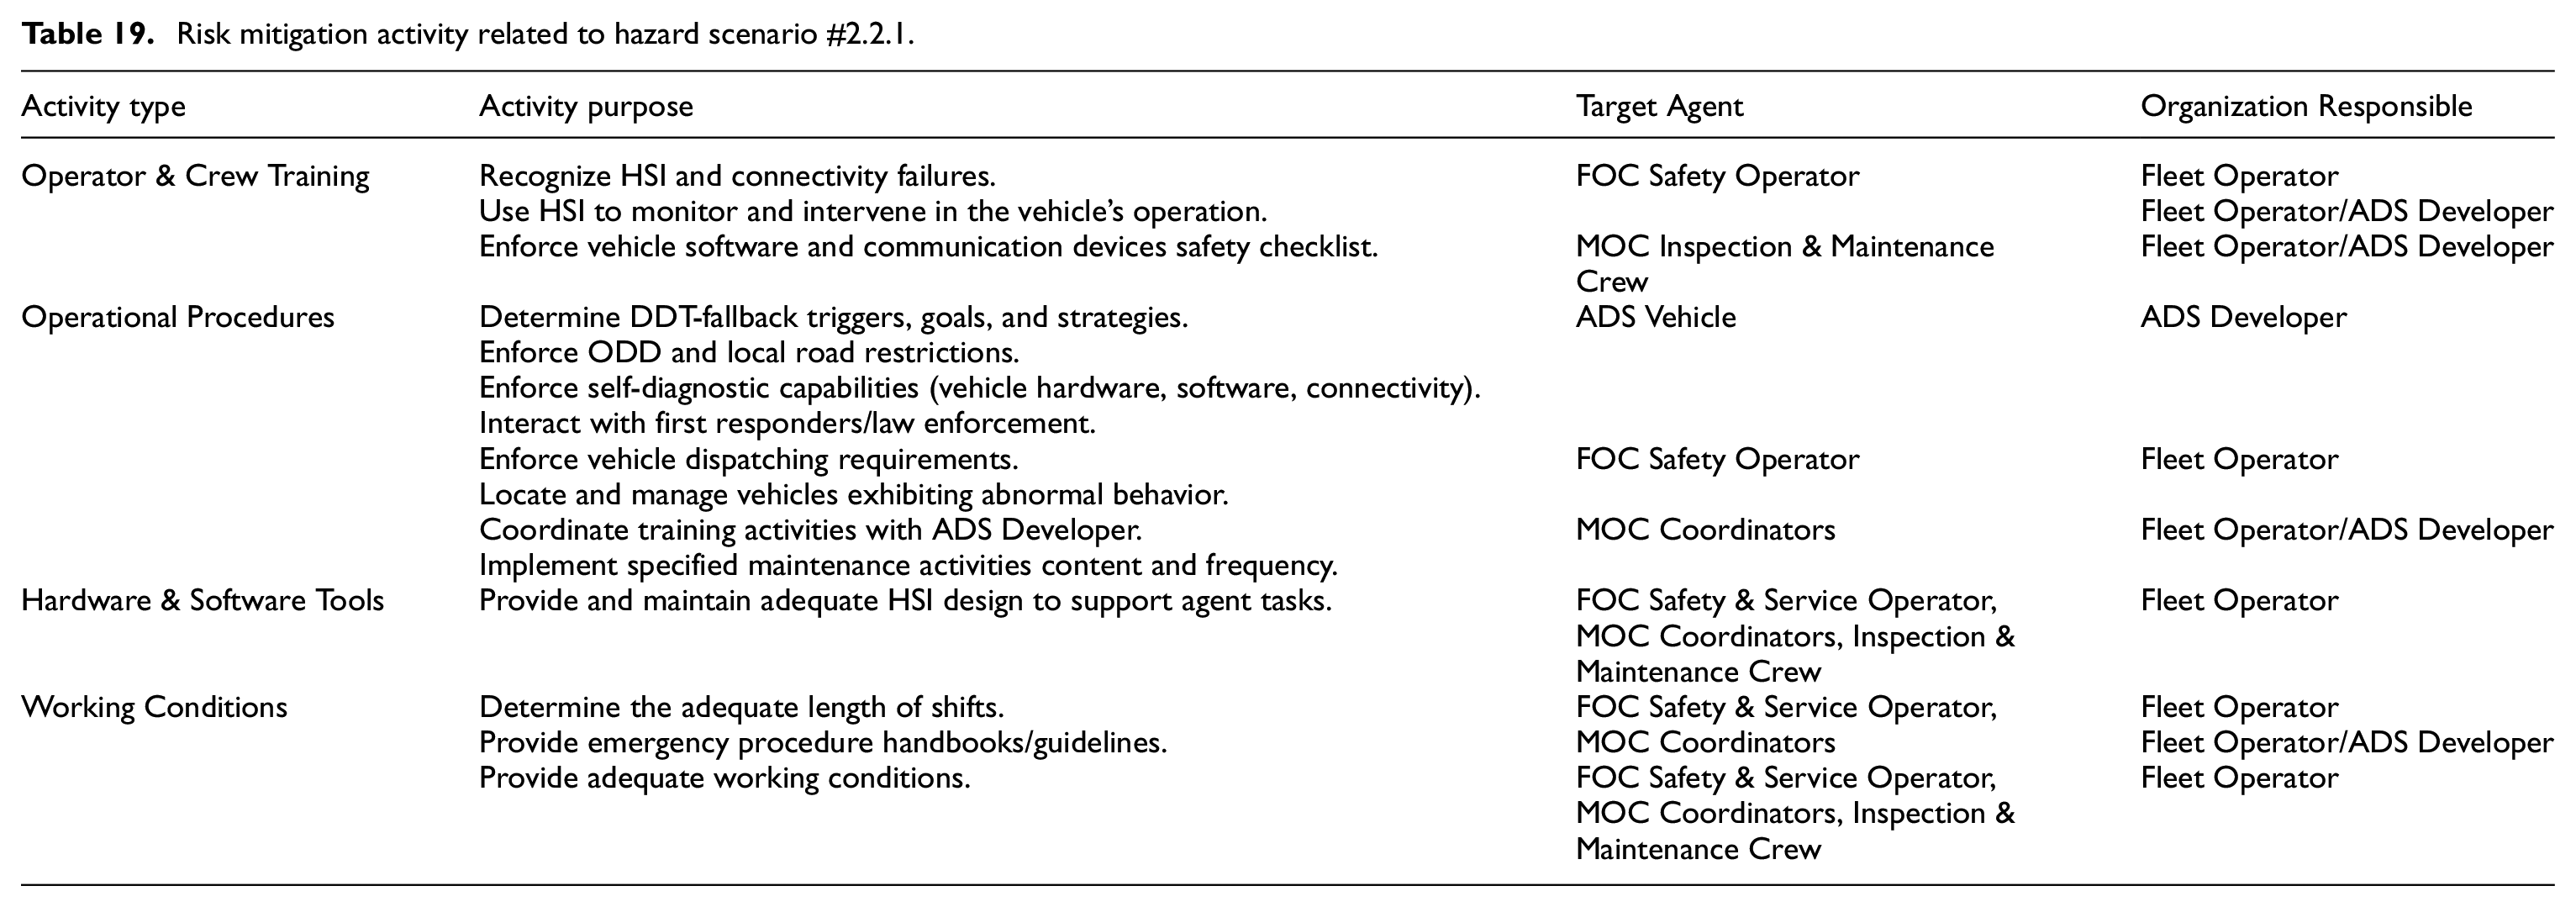
The operational safety responsibilities addressing each contributing failure mode were categorized by the resources the fleet operator requires to support each agent in performing their tasks (Table 5). This analysis resulted in a total of 140 risk mitigation activities covering the 211 unique contributing failure modes. This list contains activities that impact the tasks and performance of multiple target agents and can be aggregated into 81 distinct activities spanning operator and crew training, operational procedure development, software and hardware tools, and workplace adequacy factors. An example of these activities related to the hazard scenario #2.2.1 detailed in the previous section is presented in Table 19. In this example, it can be seen that while the operational procedures embedded in the ADS vehicle software play a direct role in detecting DDT fallback triggers (ODD breaches or system failures), these mainly depend on the ADS developer. Nonetheless, there may be other safety barriers in place that the fleet operator can enforce, particularly related to the remote operators and maintenance crew members. As L4 ADS developers begin to deploy larger-scale operations, it is crucial for fleet operators and regulatory entities to determine which activities, procedures, and requirements must be considered to ensure operational safety. Some of the most relevant risk mitigation activities identified target all agents (ADS vehicle, FOC, MOC) and include key activities such as those related to management of change, training remote supervisors to monitor and intervene in vehicles’ operation, providing adequate working conditions for operators, enforcing vehicle connectivity, and dispatching requirements, and coordinating internal incident mitigation activities.
Risk mitigation activity related to hazard scenario #2.2.1.
Discussion
L4 ADS case study
The hazard scenarios identified in the example highlight the complexity of the interactions between the ADS vehicle, FOC operators, and MOC crew during operations. This methodology enables tracking the hazard scenarios and contributing failure modes toward the fleet operator’s risk mitigation activities required to support the agents in performing their tasks.
The reliability and trustworthiness of ADS software and hardware play a central role in ensuring a safe trip for passengers and other road users. Yet, if the ADS fails to mitigate risks autonomously during operation, the FOC operators may need to function as a layered safety barrier. This implies additional design requirements for HSI, ADS component redundancy, safety alarm systems, and the extensive human factors involved in the remote operator’s functions. It may also lead to fleet operators opting to restrict further the ODDs prescribed by the ADS developer, for instance, regarding wireless communication systems’ reliability, stability, and quality (controlling the external factor, which may lead to the hazard scenarios described in the previous section). Additionally, even though the participation of the MOC is not explicitly shown in the example provided, preventive and corrective maintenance policies are expected to be key to reducing vehicle malfunctions during operation. Some key insights are summarized as follows:
The ODD usually includes physical restrictions regarding geographical locations, road conditions, and extreme weather. Wireless communications restrictions may need to be strictly enforced to support the tasks of the FOC safety and service operators. This is important for the MaaS aspect, as the ADS vehicles are expected to operate independently at reasonable low-risk conditions. Communication with passengers must be available in an emergency; hence, fleet operators may wish to restrict the ODD further than designed by the ADS developers. This aspect raises critical cybersecurity and wireless communication stability requirements that need to be pursued in depth.88,89 To address communication requirements in MaaS applications, it may be beneficial to leverage existing research regarding Connected Automated Vehicles (CAV) applications.90–92 Further, it may be useful to introduce the concept of a Fleet Operational Design Domain (FODD), determining the conditions under which the ADS vehicle may operate for MaaS.
The role of the FOC safety operator requires dedicated analysis. Particularly, the practicality of remote interventions in the ADS vehicle’s operation to address automation failures. In many scenarios, there might not be enough time for the remote operator to receive and adequately react to the information delivered by the vehicle or passengers.93,94 This time constraint upon the FOC’s next tasks is integrated into the ESD diagram (Figure 8). The event “2-D1: There is sufficient time for FOC operators to react to DDT-fallback requirement” is included such that the remote operators; performance may be physically possible and attenable considering HSI design, and network latency. The effect of time-related constraints over operational boundaries is a design factor that requires further study.82,95 Just as the current role safety drivers play during testing and validation of ADS vehicles, the FOC safety operators should know the ODD limits of the vehicle and how to recognize a potential breach. Further, fleet operators and ADS developers may design HSI, stricter ODD requirements (or FODD), or alarm systems to support the role of the FOC safety and service operators in performing driving assistance teleoperation functions. 29
Fleet operators will have a significant role in ensuring MOC crew training and adequate procedures. Hardware and software malfunctions may not be prevented or corrected due to inadequate inspection and maintenance operations. It may be the role of the ADS developer to work with the fleet operator and establish guidelines for inspection, maintenance, and incident investigation. Fleet operators may modify prescribed procedures (monitoring and intervening vehicle operation, pre-shift inspection, and/or maintenance policies) based on operational experience. Depending on the information asymmetry between the ADS developer and the fleet operator, different reporting and oversight policies might be involved to ensure the vehicle’s safe operation. A limited knowledge of the fleet operator about the ADS software and hardware specifications, requirements, and maintenance procedures may imply the need for a more active participation of the ADS developer, both in terms of operational and regulatory compliance.
Hazard identification methodology
Hazard identification constitutes a crucial step that can provide insight to develop more comprehensive procedures and guidelines to ensure operational safety. The proposed hazard identification methodology combines modern tools with traditional approaches that multiple analysts may be more familiar with.
The use of ESD to model the operational sequences plays a central role in constructing scenario-based or contextual analysis at a high-level. While agent functions and interactions are developed in depth through CoTA and STPA methodologies, context is fundamental to identifying hazards correctly. It also provides a risk-based approach in which hazards are not only identified, but they are associated with a consequence and frequency, allowing risk-based prioritization. A combination of unsafe actions may or may not lead to system-level hazards depending on the context. As modeling all the potential variations of scenarios in which the ADS vehicle operates (denoted as “World” in Figure 11) is not within the scope of the present analysis, establishing what can occur and who is responsible for it depending on the context (i.e. operational phase) provides a structured approach to exploring the space of potential hazards. Depending on the focus of the analysis, the specificity of the initiating events modeled may be chosen to challenge specific functions of any of the agents involved in the system’s operation. For instance, additional contextual aggravators may be added instead of “The vehicle is on-route to destination,” for example, “The vehicle is on-route to destination under reduced visibility conditions.” The list of relevant contextual aggravators may be elicited from the functional breakdown of the system, incident reports, or naturalistic driving datasets, among other sources. While these aggravators are challenging to identify and model when analyzing hazards at fleet-level operations, a higher specificity is crucial when expanding toward risk quantification efforts.
The proposed methodology leverages the synergy of the STPA and CoTA approaches, both aimed at explaining how unexpected interactions and task dependencies may propagate system-level failures. Both approaches are success-driven, that is, the models are constructed based on expected system behavior. Hence, the hazard identification process consists of interrogating each function, action, or task to identify sources of error, failure, or unsafe interactions. As the CoTA models are derived from the scenario-based ESDs, while the STPA system-level hierarchical control diagram is obtained from the functional definition of the system, both methods may lead to different contributing failure modes for the same hazards or even aid the identification of different hazard scenarios. However, while the identification of consequences is embedded into the development of STPA and FT models, CoTA relies on the ESDs end-states to express potential consequences of task failures. Likewise, while the tasks derived from the CoTA method are directly linked to specific scenarios by design (through the ESD), contextual analysis of causal factors in STPA are derived after identifying the UCA and is strongly dependent on how explicitly the feedback loops of the system are modeled. In contrast, the proposed methodology begins by developing ESDs, a method specifically for modeling dynamic scenarios, providing the foundation for the rest of the analysis. The deductive and inductive approach to context of the CoTA and STPA, respectively, acts as complementary forces within the hazard identification methodology. Another relevant aspect of the ESD and COTA model construction is using the IDA model to analyze the tasks and interactions of the ADS, FOC remote operators, and MOC crew. STPA has demonstrated its effectiveness in identifying software-related hazards and provides a means to assess the correctness of control actions regarding content or timing. However, employing STPA to design safety countermeasures may prove difficult as it requires detailed knowledge of the system, which in turn increases the difficulty of conducting the UCA analysis effectively.49,96 In the proposed methodology, the IDA cognitive model is employed to identify potential hazard scenarios and contributing failure modes for each of those stages. Hence, the actions of each agent (machine or human) are modeled at the level of diagnostics and situation assessment rather than only as controllers and feedback emitters. 36 The underlying IDA approach is employed to identify the resources needed to perform said actions, for example, how the information is transmitted and presented to the agent, what previous knowledge the agent requires to decide the appropriate action, and what mechanisms are needed to perform the actions adequately. The CoTA and FT models provide insights into the dependency between tasks and functions that do not depend on the accuracy of the modeled feedback loops. Further, the FTA models is the only failure-oriented method employed, providing additional depth by exploring the failure path of key ESD events. However, the benefits of employing FTs methods (as well as the ESD) increase significantly when more quantitative data is available. Similarly, the benefits from conducting STPA-based hazard identification increase when more information about the nature of the system is available.
Regarding the methodology’s efficiency in identifying failure modes contributing to hazard scenarios, only a 13% of these were covered by all three methods – STPA, CoTA, and FTs (Table 13). In the case study presented, CoTA was the method that provided the most unique failure modes (33%), followed by STPA (20%) and FTs (11%), while the rest were identified through at least two methods. This resulted in a total of 36% redundant contributing failure modes. However, this result is highly dependent on the analysis and will probably vary depending on the nature of the system studied.
Given the tools’ flexibility, the proposed methodology is highly scalable, and the level of detail may be modified iteratively as desired. The strengths and limitations of methods used in this approach have been leveraged to analyze the agent’s interactions from different angles. In this regard, analyzing highly complex cyber-physical systems requires experts with diverse perspectives, including system reliability (software, hardware, and human) and cybersecurity. As presented in this work, the proposed methodology has the inherent flexibility to be fully expanded for qualitative analysis. It may also be employed for quantitative risk assessments, as the modeling stages of the agents’ functions and tasks may be reduced or compressed at a higher level to comply with the available data. For instance, while specific hardware of software failure rates for the perception sensor suite may not be available, data representing a combined “detection failure” may be the lowest-level FT basic event to be quantified. Alternatively, semi-quantitative approaches can be leveraged to prioritize the development of prevention or mitigation policies addressing critical safety hazards. In this case study, the methodology’s results focus on identifying operational safety responsibilities and providing input to develop risk mitigation measures. Common cause failure analysis plays a key role in highly interconnected complex systems. In this work, the analysis is conducted at a sub-system level and so the study of component-level redundancies and dependencies to determine common cause failures is not within the scope of the application and must be carried out in detail at a later stage. However, linking the hazard scenarios to risk contributors and risk mitigation measures enables analysts to trace potential causes of contributing failure modes, providing evidence, for instance, to consider common cause failures in the system. For example, if a high number of ADS vehicle sensor failures can be traced back to inappropriate inspection and maintenance policies, this may prompt the fleet operator to update procedures, training, or the tools available to the crew.
The methodology implementation presents technical challenges in terms of available resources, time, and knowledge of the system. All the methods employed require significant time and expertise to be developed in a way that adequately represents the system operation and the analysts’ purpose of the investigation. In this regard, implementing this methodology can become a highly resource-intensive process even at early system design stages. Further, some potential limitations of the methods need to be further addressed, for example, scenario explosion in ESDs, the analyst-dependent identification of parallel tasks and the re-description details of CoTA tasks, 47 difficulty evaluating safety countermeasures to identified UCAs, 96 or difficulty expressing event dependencies. 34 While this work aimed to apply the methodology for a fleet-level analysis, these models would need further refinement to focus on highly specific scenarios, that is, contextual aggravators. Likewise, the assessment of the risks each hazard scenario poses is out of the scope of the methodology – as it is highly system-dependent. In this regard, the methodology and its application presented in this work are more suited for a system-wide exploration of hazards conducted by an organization responsible for operating or developing operational guidelines for a system rather than an in-depth component-level analysis for system designers.
Applying the proposed methodology led to identifying hazards and contributing failure modes not sufficiently explored in operating L4 ADS fleets for MaaS. By including human and organizational aspects into the system’s overall performance, this methodology highlights hazards from interactions not usually considered in functional safety studies, for example, between fleet operator’s operators and crew members with the ADS vehicle. This approach and the main findings of this work have been validated with stakeholders during the development of a larger project exploring potential risk-reducing strategies for L4 ADS fleet operators. Further validation of the hazard identification methodology can be achieved through comparison with other methods, such as simulation-based, dynamic risk assessment methods, or driving simulator-based observational studies. As the testing and deployment of L4 ADS fleets become more widespread, so do the opportunities to conduct validation activities through expert opinion and data collected during operation. In particular, future efforts may focus on the role of external events, including actions of other road users.
Effective hazard identification plays a key role in designing safe systems and operations, as well as providing a robust basis for future risk quantification. When analyzing complex systems where multiple human and machine agents interact to achieve common goals, the number of risk scenarios to be analyzed increases unbounded by the complexity of the environment in which they operate. Identifying the safety hazards through a structured methodology is the first step to developing adequate safety barriers from a functional and procedure-based perspective. These barriers, in the form of operational procedures or system design, are needed to address human and organizational aspects still present in autonomous system operations. The hazard identification methodology proposed in this work addresses these key issues. This methodology provides a scalable and flexible approach to establish connections between hazard scenarios, agents’ tasks, and the corresponding operational safety responsibilities to contain, prevent, and mitigate the identified hazards. Further work focusing on quantifying event likelihoods, the severity of potential consequences, and the resources required to implement safety barriers can lead to assessing the effectiveness of the identified risk reduction activities.
Conclusions
This work presents a structured and layered hazard identification methodology designed to address the intricate dependencies and interactions between different elements in complex systems. The methodology is applied in the context of L4 ADS fleet operations for MaaS, where fleet operators manage and deploy these vehicles for passenger transport. The methodology, which comprises three distinct stages: system modeling, scenario modeling, and hazard identification, offers a structured and layered approach to identifying and characterizing hazard scenarios. The methodology thoroughly analyzes the system’s operational landscape by employing a combination of traditional and modern hazard identification and modeling tools such as ESD, CoTA, STPA, and FT. The methodology offers flexibility to pursue risk quantification efforts and explore risk mitigation measures to address the identified hazards.
The implementation of each stage and the utilization of these models are described in detail, and a case study focused on the operation of an L4 ADS-equipped vehicle fleet is presented. This work considers the crucial role of the fleet operator, who is responsible for two agents: the remote operators at the FOC supervising the vehicle and the MOC crew dedicated to inspection and maintenance activities. By exploring the success and failure of pivotal ESD events through CoTA and FT, respectively, the methodology investigates the contributing factors leading to hazards occurring during the vehicle’s operation. Combined with the system-level STPA, this method establishes a clear link between operational scenarios, risk contributors, and safety-related agents’ tasks. This systematic approach enables a comprehensive characterization of the hazard scenarios and their contributing factors, providing insights for developing safety barriers through operational guidelines or procedures. An example is provided to display the use of the methodology, focusing on the hazard scenario hazards “FOC does not detect a DDT fallback is required.” This hazard scenario encapsulates multiple contributing factors, including the design of monitoring, intervention, maintenance procedures, and other human-related factors that should be further explored in future work.
The discussion and results presented in this paper are part of a larger project that aims to identify the safety responsibilities and risk mitigation activities of fleet operators of ADS L4 fleets operating as MaaS. The proposed methodology provides a structured approach to identify the main safety hazards that may arise during operation. Moreover, it provides the necessary traceability required to derive operational safety responsibilities to address said hazards. A key challenge remains to fully leverage the proposed methodology’s strengths for quantifying risks. This stems primarily from the limited access to operational data of L4 ADS vehicles deployed as MaaS. However, the methodology can also be oriented toward deriving data collection activities to populate the developed models, paving the way for further research. Ultimately, the hazard identification methodology presented in this work is a compelling approach for analyzing and addressing risks in complex systems, particularly in the domain of L4 ADS fleet operations for MaaS.
Supplemental Material
sj-docx-1-pio-10.1177_1748006X241233863 – Supplemental material for Operational safety hazard identification methodology for automated driving systems fleets
Supplemental material, sj-docx-1-pio-10.1177_1748006X241233863 for Operational safety hazard identification methodology for automated driving systems fleets by Camila Correa-Jullian, Marilia Ramos, Ali Mosleh and Jiaqi Ma in Proceedings of the Institution of Mechanical Engineers, Part O: Journal of Risk and Reliability
Footnotes
Appendix
Declaration of conflicting interests
The author(s) declared no potential conflicts of interest with respect to the research, authorship, and/or publication of this article.
Funding
The author(s) disclosed receipt of the following financial support for the research, authorship, and/or publication of this article: This work was supported by U.S. Department of Transportation National Highway Traffic Safety Administration [grant number 693JJ921D000018]. The work presented in this paper remains the sole responsibility of the authors.
Supplemental material
Supplemental material for this article is available online.
References
Supplementary Material
Please find the following supplemental material available below.
For Open Access articles published under a Creative Commons License, all supplemental material carries the same license as the article it is associated with.
For non-Open Access articles published, all supplemental material carries a non-exclusive license, and permission requests for re-use of supplemental material or any part of supplemental material shall be sent directly to the copyright owner as specified in the copyright notice associated with the article.