
Abstract
Variations in clinical practice are common. However, some variations may cause undesired consequences. Careful consideration of their causes and effects is necessary to assure the quality of healthcare delivery. A modelling approach that could capture these aspects would help to achieve this goal. In this paper, a Newborn Life Support procedure is modelled. This activity is considered prone to error with reduced outcomes for the patient. Hence, it is necessary to understand the nature of the activity and its variations. A Coloured Petri Net (CPN) approach and a simulation technique are used for this purpose. The CPN colours are used to represent the characteristics of babies and to control the flow of tokens representing the resuscitation procedure. Probabilistic modelling aspects include the duration of individual tasks, the choice of treatment and the condition of the baby. The model outputs consist of the percentage of babies with an unsatisfactory outcome, the percentage of babies who need full resuscitation, and the duration of the procedure until a satisfactory condition is achieved. The modelling approach is demonstrated using a number of scenarios on some common NLS variations, relating to the maximum number of ventilation and the probability of errors in the inflation procedure.
Introduction
Variations in clinical practice
Safety, effectiveness, and efficiency are essential in healthcare delivery. Each clinical treatment is tailored to suit the condition of patients, either physically or psychologically, in order to guarantee a safe and effective outcome. However, variations in clinical practice results are not only caused by the patient’s condition. Local management policy and protocol,1–3 leadership,4,5 clinical staff bias,6–8 social relationship, 9 interpersonal skill, 10 an availability of clear clinical guidelines, academic background of the clinical staff, 11 and their workload level12–14 are additional examples of factors that may cause the variations. Some of these factors result in a number of unwarranted variations that would cause undesired consequences, such as a longer completion time of a clinical task, failures to deliver effective treatments to patients, and unnecessary cost of healthcare services.15,16 All possible factors that may cause these unnecessary variations should be carefully considered in order to design a better healthcare system delivery.
The significance of understanding how the causal factors of clinical practice variations affect the performance of the procedure has been researched in the literature. Some works conducted their analysis based on in-field observations, and clinical staff experiences and some diagrammatic models of clinical protocols were developed.17,18 Some others tried to develop statistical relationship models9,19–22 (e.g. regression), analytical models 23 (e.g. Markovian queueing theory), simulation models (e.g. discrete event simulation, agent-based simulation, system dynamic)24–27 or the combination of these techniques28,29 in order to dynamically study how a particular clinical activity is performed. The benefit of using a dynamic model is allowing someone to perform experiments with some characteristics of the activities represented in the model and estimate the effect of potential changes in the activity. Eventually, a necessary improvement for the clinical procedure under investigation can be proposed with justified evidence. Among these dynamic modelling methodologies, the simulation technique is considered more flexible to accommodate complex system modelling. 30 The complexity of a system may have something to do with the number of entities in the system, relationships between entities, and some probabilistic aspects concerning the duration of processes, system state changes, etc. In this paper, the simulation technique is used to analyse the Newborn Life Support (NLS) protocol. This clinical activity can be considered a complex procedure due to the number of tasks involved, as well as the types of probability distributions for the task duration and its conditional rules for adapting actions, such as the decision to continuously deliver ventilation procedures in the absence of babies’ responses and the characteristic of drug administration and chest compression procedure in a prolonged cardiopulmonary action. To the best of our knowledge, the use of this modelling approach on the NLS procedure has never been proposed in the literature.
NLS procedure
The Newborn Life Support procedure is an evidence-based protocol to resuscitate and stabilise newborn babies requiring assistance at birth. Ten percent of all newborns need help to initiate breathing and 1% even need an advanced resuscitation procedure. 31 Unfortunately, this clinical procedure is prone to error. A literature study conducted in the works of Yamada et al. 31 found that the error rate of this procedure ranges from 15% to 28%. Some errors relating to the unawareness of the clinical team to assure the success of a certain procedure before moving on to other tasks, 32 as well as a lack of necessary equipment and competent staff, 33 may cause ineffective treatment and bring some delays for the baby to initiate breathing. The longer the time needed for a baby to initiate breathing is, the higher the risk of asphyxia, which can cause disability and mortality, becomes. However, it is also undoubtedly true that the congenital condition of the babies relating to their organs will determine their responses to a given treatment. Moreover, there are still other factors that may influence the outcome of this procedure. Human limitation in processing information, the skill level of the medical staff, the quality of leadership and communication of the clinical team become several other factors that may affect the performance of teams in this procedure.31,32 In addition, other general factors of clinical practice variations, such as resource availability and the clarity of the guidelines of the action, may also have their own contributions. The complexity of variations in this activity makes it more difficult to comprehensively understand the interactions among tasks and furthermore, to continuously work on the improvement of outcomes. A modelling approach that can represent variations of the procedure, their causal factors, and interactions between aspects of variations would be very useful to deal with this issue.
Process modelling and Petri nets
An adequate conceptual model of the observed system must first be developed as the basis of a simulation model. This stage also aims to provide a sufficient understanding of the system for the modeller. All possible relationships and actions rules should be clearly defined so that subsequently the simulation model can be built up to demonstrate the interaction and the probabilistic aspects of the system, and eventually find the outcome of the system under a particular system configuration. In this paper, a Coloured Petri Net (CPN) approach is used for the conceptual modelling of the NLS procedure.
A Petri net is a bi-partite graph consisting of two types of nodes, that is, places and transitions. 34 A pair of nodes is connected by an arc, and token(s) may flow through the nodes. The way the transition works by consuming some tokens from their preceding places and producing some new ones to the output places, based on the arc connections and rules, is the key mechanism of the tokens flow. Tokens can be used to model any entity of a system that is processed or utilised by a particular activity. However, some tokens can also be used to control the flow of other tokens in the diagram. As the system complexity increases, the diagram can become very large and complex. Yet, besides this disadvantage, Petri nets are acknowledged as a method that can model a real system accurately 35 which is then very useful for a system modeller to translate the conceptual model into a simulation process. The addition of colours in Petri nets makes it possible to attach some information to the tokens and differentiate the transition rules based on that information. The use of colour enables the elimination of some nodes in a standard Petri net 36 which will consequently reduce its graphical complexity and size. The ability of the CPN to accurately model a complex system with a simpler diagrammatical representation is beneficial while studying the NLS process.
The methodology proposed in this paper can be considered a novel approach to studying the NLS procedure. Based on our findings, there is still no work that investigates this clinical activity by using the process modelling and simulation approach, as proposed in this paper. In addition, the NLS procedure is modelled using a number of scenarios based on some commonly observed variations which are performed to capture their effects on outcomes and identify potential improvements to the procedure. In this paper, in-field data from a number of real resuscitation actions are also used to support the modelling approach.
The remainder of this paper will be organised as follows: Section 2 gives some background knowledge of the NLS procedure and the Coloured Petri Net method. Section 3 consists of a Coloured Petri Net model of the NLS procedure developed in this paper, the data and parameter values that are used in the simulation and the scenarios used in the model. Section 4 contains the results of the simulation and a discussion, as well as some proposed improvements for the procedure. The final section gives the conclusions and areas for further research.
Background
Newborn Life Support procedure
The condition of a baby straight after delivery can be very poor so that they cannot breathe properly, and the NLS procedure should be performed. The type of delivery (i.e. normal or caesarean) and the gestational age of the baby are some influential factors that may determine this condition. 37 About 85% of babies at term will initiate breathing in 10–30 s after delivery, but others will need some assistance. 38 Ten percent may respond to the drying and stimulation process, while the rest will need ventilation or even a more advanced procedure, such as chest compression and drug administration, in order to initiate the breathing process and recover all health indicators of the baby. Figure 1 gives an overview of the procedure according to the latest guidelines of the Resuscitation Council UK. 38
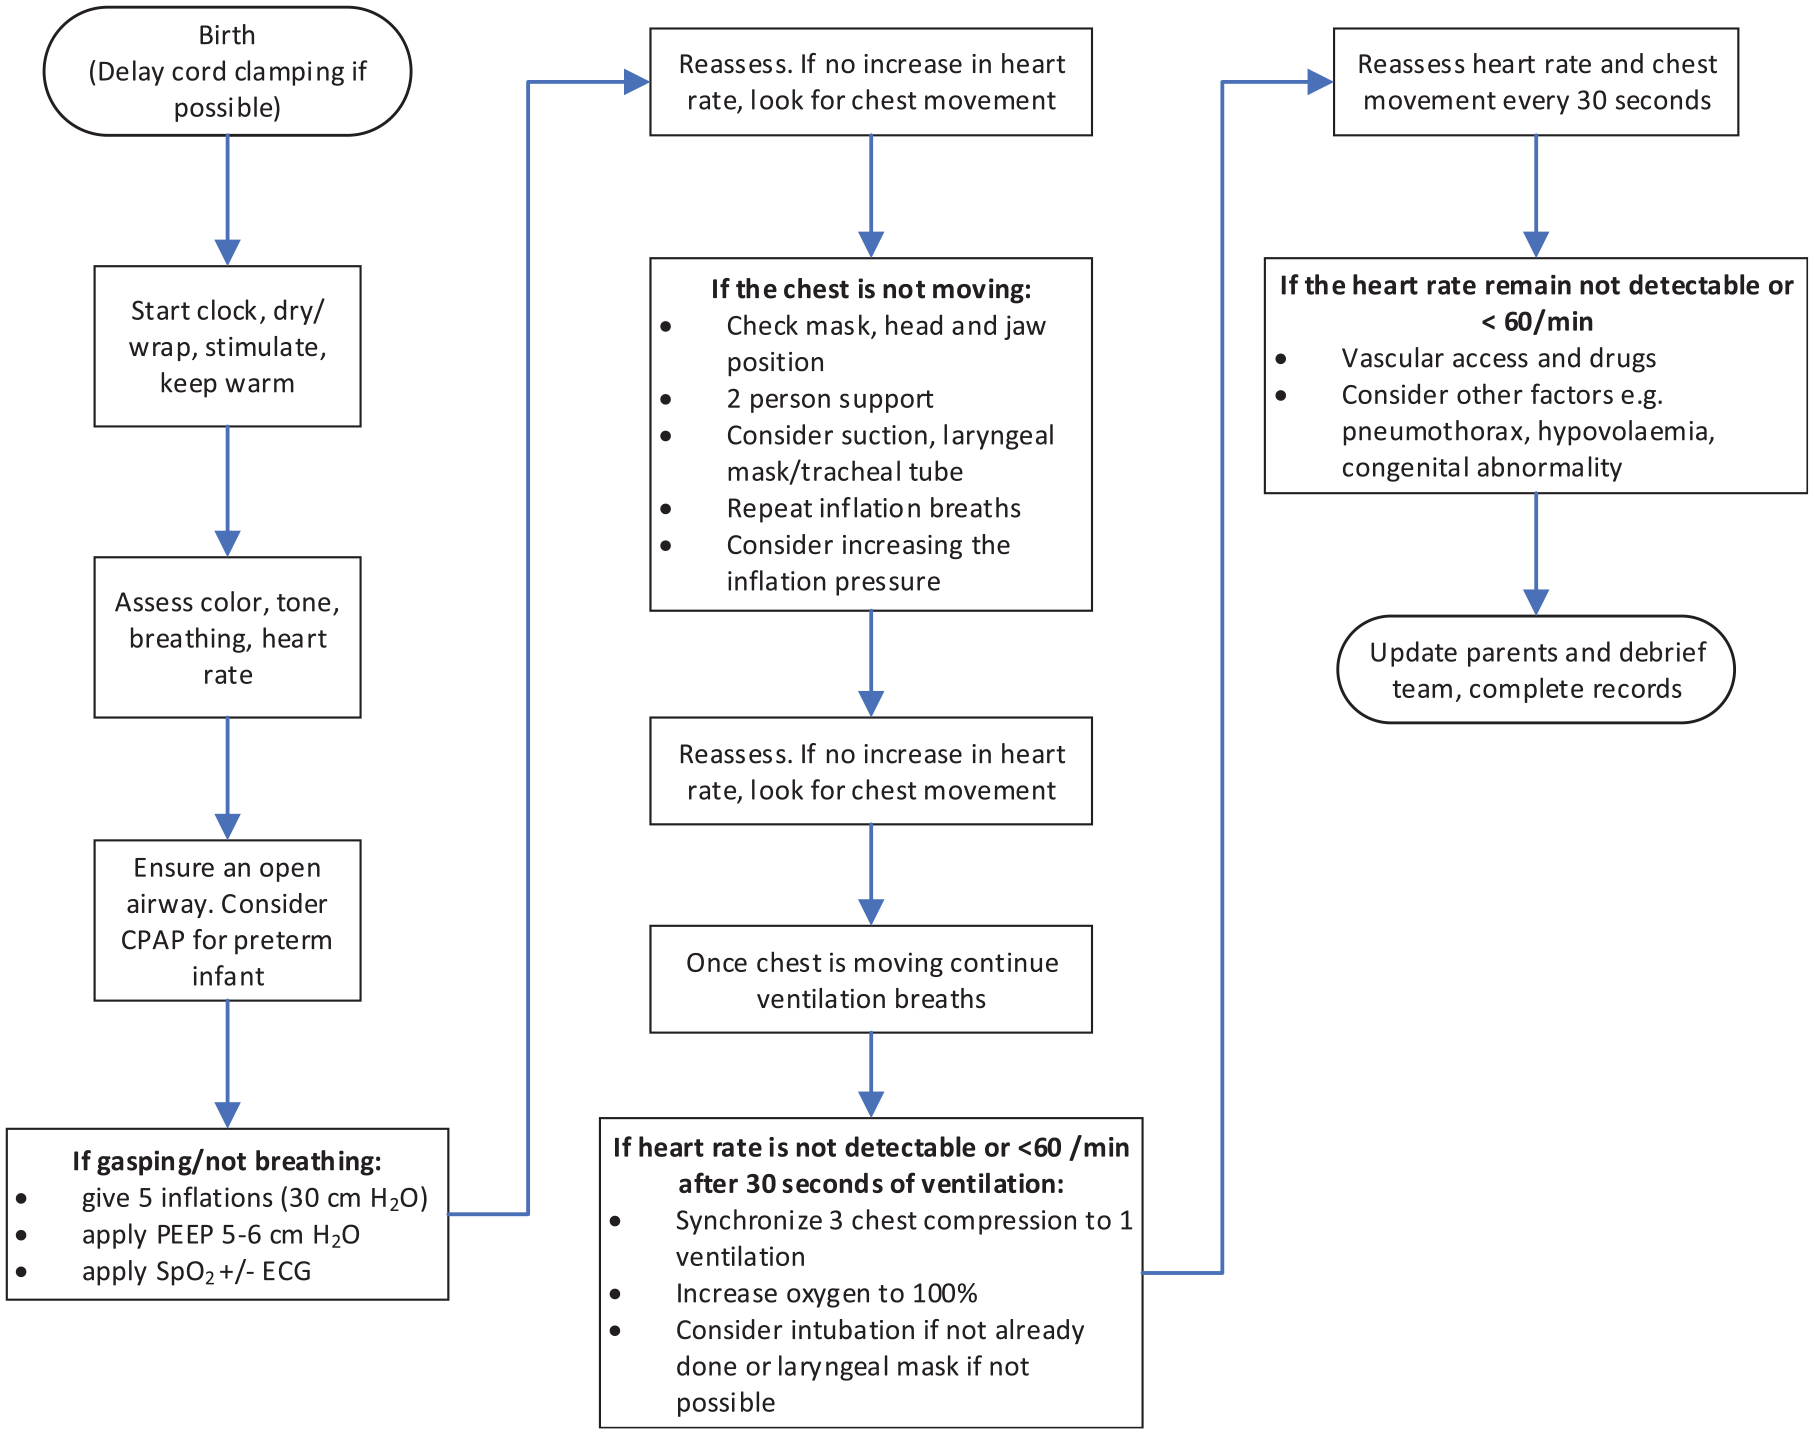
A simplified NLS procedure.
The NLS procedure is performed by a team, and the team composition and the number of members may vary. For example, some literatures31,39,40 show that the team can consist of between three and eight members, which may include neonatal nurses, a respiratory therapist, physicians, and a neonatal fellow. Some examples of staff roles 41 involve the airway staff, breathing staff, circulation staff, leader, recorder, medication staff, and access staff. Good coordination among the team members should be managed by a qualified team leader to achieve a desired clinical outcome. For this reason, the neonatal staff is usually trained not only in terms of individual clinical skills but also in terms of team coordination ability. Teamwork behaviours to be considered in the NLS team relate to communication techniques, conflict management, team composition, and vigilance level of clinical staff to the situation during resuscitation.39,40,42
Data about the NLS procedure shows that there are several types of errors that can occur, 31 and some errors may have serious consequences. Disability or even mortality can happen due to late or ineffective resuscitation treatment. Some examples of these errors include failure to move wet linen, inadequate respiratory pressure, and inadequate interruption of Positive Pressure Ventilation (PPV) to stimulate breathing activity. 31 An example of failure to move wet linen will cause difficulties in maintaining the normal temperature of the baby. The temperature of the baby should be maintained around 36.5°C–37.5°C because for example in the case of a very low-weight baby (i.e. 401–1499 g), each 1°C decrease in the baby’s temperature will increase the rate of mortality as much as 28%.38,43 Furthermore, inadequate ventilation and chest compression, and a lack of equipment or staff may cause delays in the baby’s recovery. An example of such a situation is a baby with no heart rate at birth. The longer the time needed to return the baby’s spontaneous circulation, the higher the risk of mortality and neurodevelopmental impairment that the baby may experience would become. 38
Coloured Petri nets
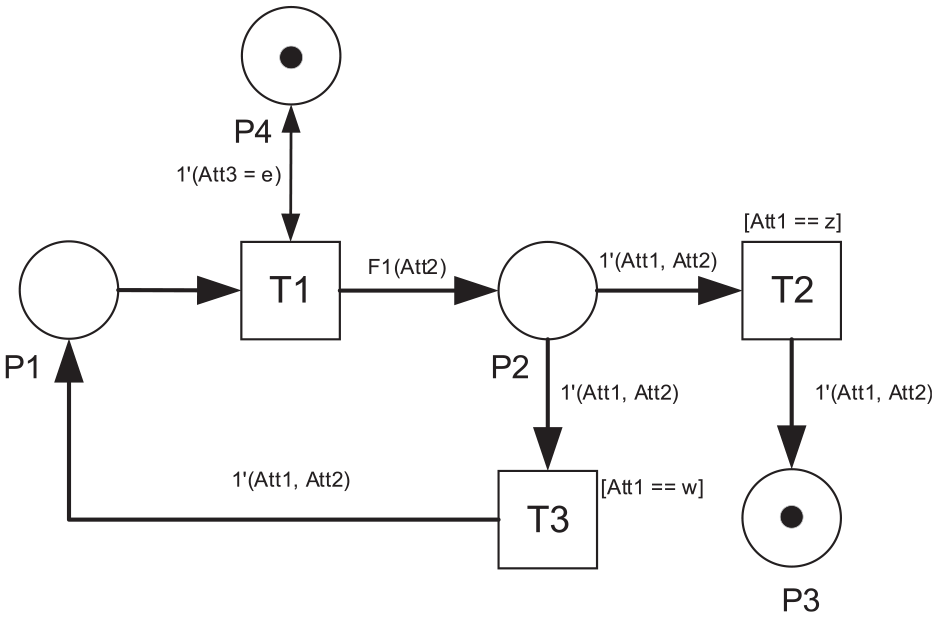
Coloured Petri Nets (CPN) is an extension to standard Petri Nets that allow attachment of information to the tokens. In CPNs, there is more than one type of token possible in every place or consumed by a particular transition in the net, due to different information carried by the tokens. The firing of a certain transition can also be controlled by some additional rules, regarding the type of tokens available in the input places that are connected to it. Likewise, the new output tokens resulting from the transition can also be programmed to bring some information that will be used in a downstream transition. A simple example of the CPN can be shown in Figure 2. Notations of the CPN are adopted from Jensen. 36 However, instead of using ‘=’ as a conditional operator for equality, we use ‘==’ to differentiate between the conditional comparison expression and the value assignment to a certain variable.
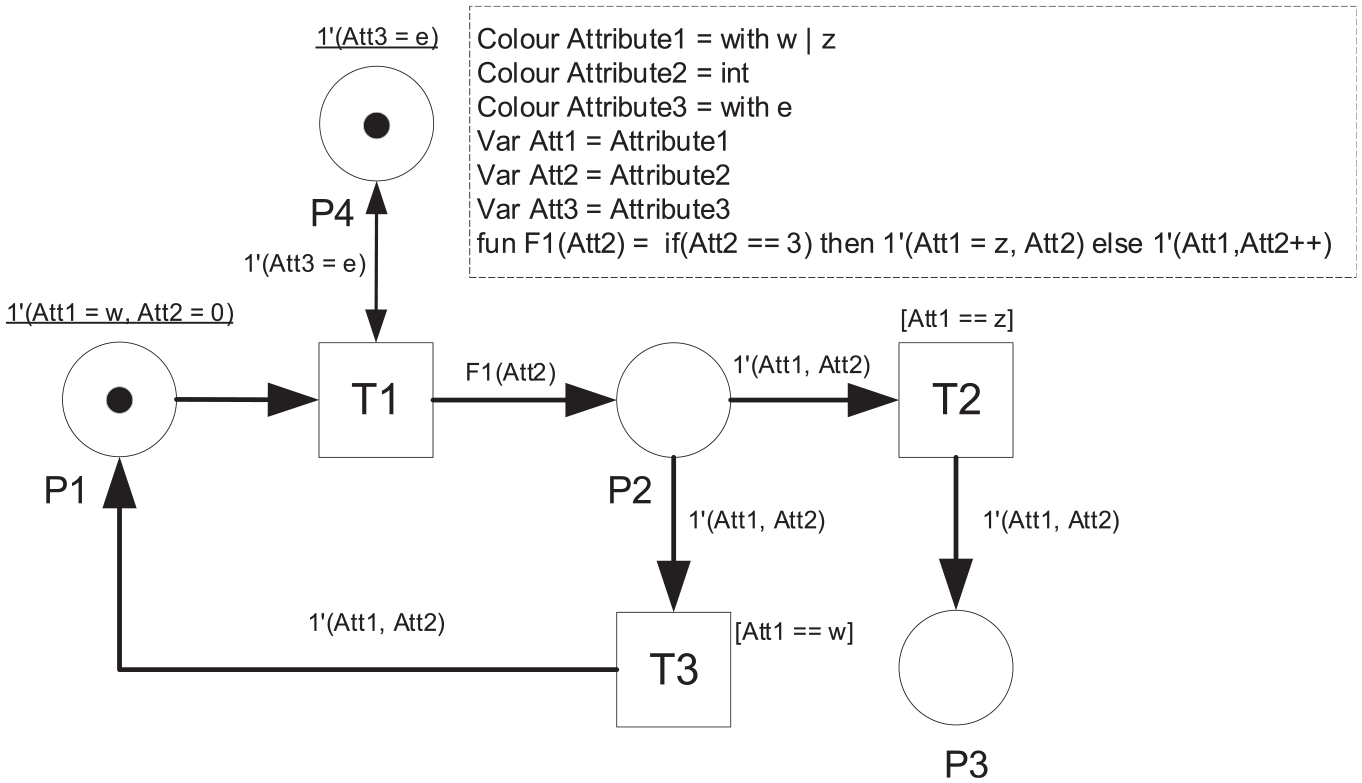
Simple CPN example.
The CPN in Figure 2 consists of three transitions (T1–T3) and four places (P1–P4). There are three colours defined for the tokens as described in the dashed line box. However, not all the tokens have the same colour structure. The token in P1–P3 has a combination of Attribute1 and Attribute2, while the one in P4 only has a colour of Attribute3. These colours are implemented in three variables (i.e. Att1–Att3) that are attached to the corresponding token. Each colour has its own type of value. Attribute1 and Attribute3 have a colour of character with 2 types and one type of value, respectively. Meanwhile, Attribute2 has a colour of integer. The initial marking (i.e. the initial distribution of tokens) of the CPN is described by the underlined expressions which show that there is 1 token with ‘w’ value of Att1 and 0 value of Att2 in P1, and 1 token with ‘e’ value of Att3 in P4.
The execution of the CPN will start with the occurrence of T1 since all the input places have tokens to fire T1. The occurrence of T1 will produce two tokens as there are two output arcs coming out from T1. The first arc connected to P4 will cause T1 to produce a token with a colour structure of Attribute3 which has a value of ‘e’. The second arc will make T1 produce a token according to a conditional function F1.
A function is another additional feature of the CPN that makes the method flexible. In this example, F1 is defined as a function that reads the value of Att2. As long as the value of Att2 is not 3, T1 will produce a token with the same value of Att1 but with an increasing value of Att2 by 1. However, once Att2 reaches the value of 3, the conditional function will make T1 change the value of Att1 to ‘z’ but without any further increment to the value of Att2. This new token will be placed into P2. This type of CPN is used to model NLS tasks that need repetition such as ventilation, chest compression and drug administration.
The token placed in P2 will then determine the occurrence of either T2 or T3. In this example, T2 and T3 have conditional rules to be fired, which are called ‘guards’. As the term implies, this rule will guard or limit the occurrence of the transition to some specific condition, defined in the square brackets. T2 will only occur if the token available in the input place P2 has an Att1 value of ‘z’. On the other hand, T3 is designated for an Att1 value of ‘w’. Both T2 and T3 will produce a new token with a pair of Attribute1 and Attribute2 colour structures. No changes will be made to the value of colour variables after the occurrence of these two transitions. An example of ‘guards’ application in the NLS model is to differentiate the clinical actions between term and preterm babies.
Figure 3 shows the updated marking of the CPN, which is 1 token in P4 and 1 token in P2. The attribute value of the token in P4 does not change, but the one in P2 has an increment of 1 for variable Att2, that is, 1′(w,1).
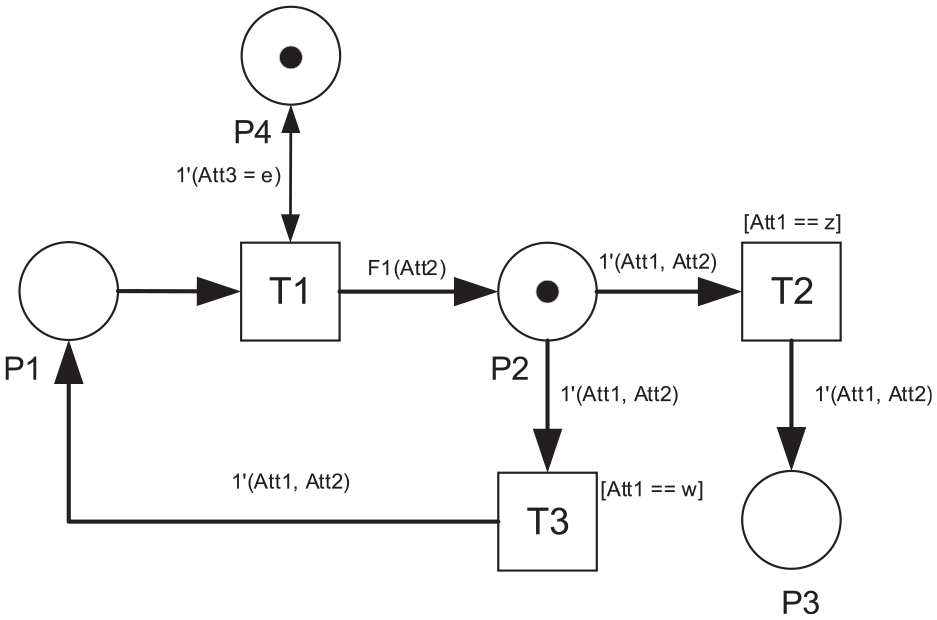
The marking after switching T1.
The next transition is the occurrence of T3. The value of Att1 in P2 is equal to ‘w’ which matches the guard function of T3. Therefore, the token in P2 will be consumed by T3 and it will produce a new token that is put into P1. The new marking can be shown in Figure 4.
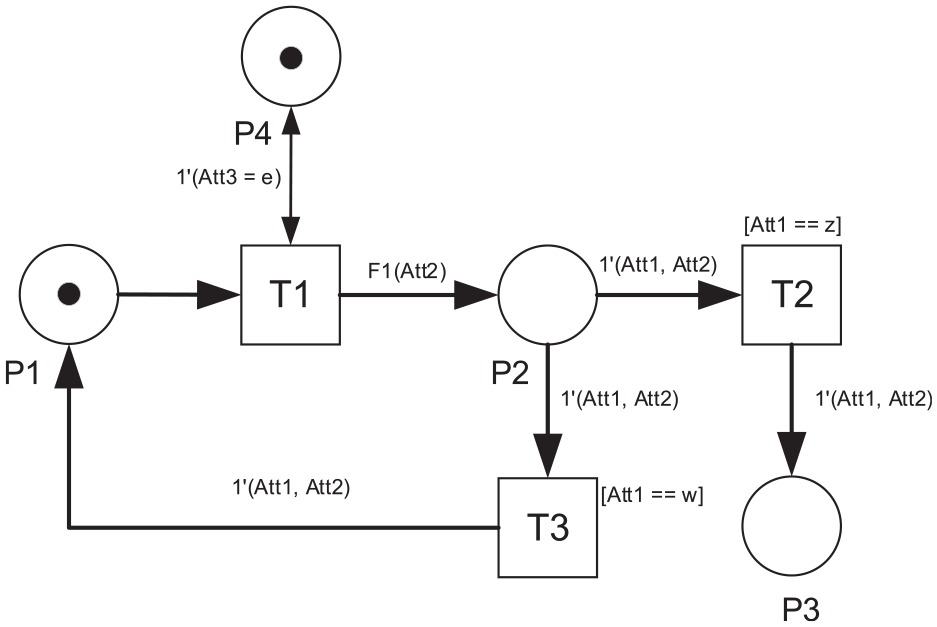
The marking after switching T3.
The marking in Figure 4 looks similar to the initial condition. However, the values of the attributes of the token in P1 have changed. The value of Att2 will keep changing by the occurrence of T1 and T3 until it is equal to 3. As soon as the Att2 is identified to be equal to 3 in P1, T1 will change the value of Att1 to ‘z’ and leave the value of Att2 the same. During the switching of T2, it will consume the token in P2 and produce a new token for P3. The final marking of CPN can be seen in Figure 5. The final value of the colour variable of tokens in P3 and P4 are 1′(z,3) and 1′(e), respectively.
Final Marking of CPN Example.
Two other important features that are commonly used in Petri Nets are the delay time of transitions (constant or random) and the weight of input and output arcs. If some delay time is applied to a transition, the occurrence of the transition will be postponed for some delay time duration once the firing condition has been met. This feature is useful to model a certain activity or process that in reality needs a certain time duration to complete, such as the ones in workflow management. 44 Delayed transitions are used to take account of the duration of the NLS procedure in this paper. On the other hand, the arc weight feature will allow the transition in Petri nets to consume or produce a number of tokens that are equal to the weight. 34
Proposed CPN model
The CPN approach is used to build a conceptual model of the NLS procedure. The model is developed based on the standard algorithm of the NLS process, additional detailed explanations of the NLS procedure in the NLS textbook, 38 and consultations with experts in neonatal medicine. Every activity in the NLS procedure is modelled using transitions. A token is used to model the progress of the procedure and the health condition of the baby. All places have a token that represents a job that needs completion, denoted by the same colour structure ‘Job’.
The NLS procedure in the CPN starts with generating a token that carries information about the gestation age of a baby. This information will differentiate the treatment routeing and the probability of the baby’s response to treatment, as well as the duration of some activities in the NLS procedure. The NLS procedure is eventually terminated based on three possible scenarios: it can be stopped if either the baby has shown a satisfactory condition, the baby needs an advanced treatment that is beyond the scope of the NLS procedure (e.g. surgery), or the baby has not well responded to the NLS treatment (although it has been performed properly for more than 10 min). During the last scenario, the clinical team will seek an agreement from the family of the baby, and the baby will be continuously monitored to look for possible improvement. The modular version of the CPN model of the NLS procedure is presented in Figure 6. Off-page flow chart connector symbols (i.e. pentagon-shaped) are adopted in the CPN diagram to minimise the complexity of the transition-place connections.
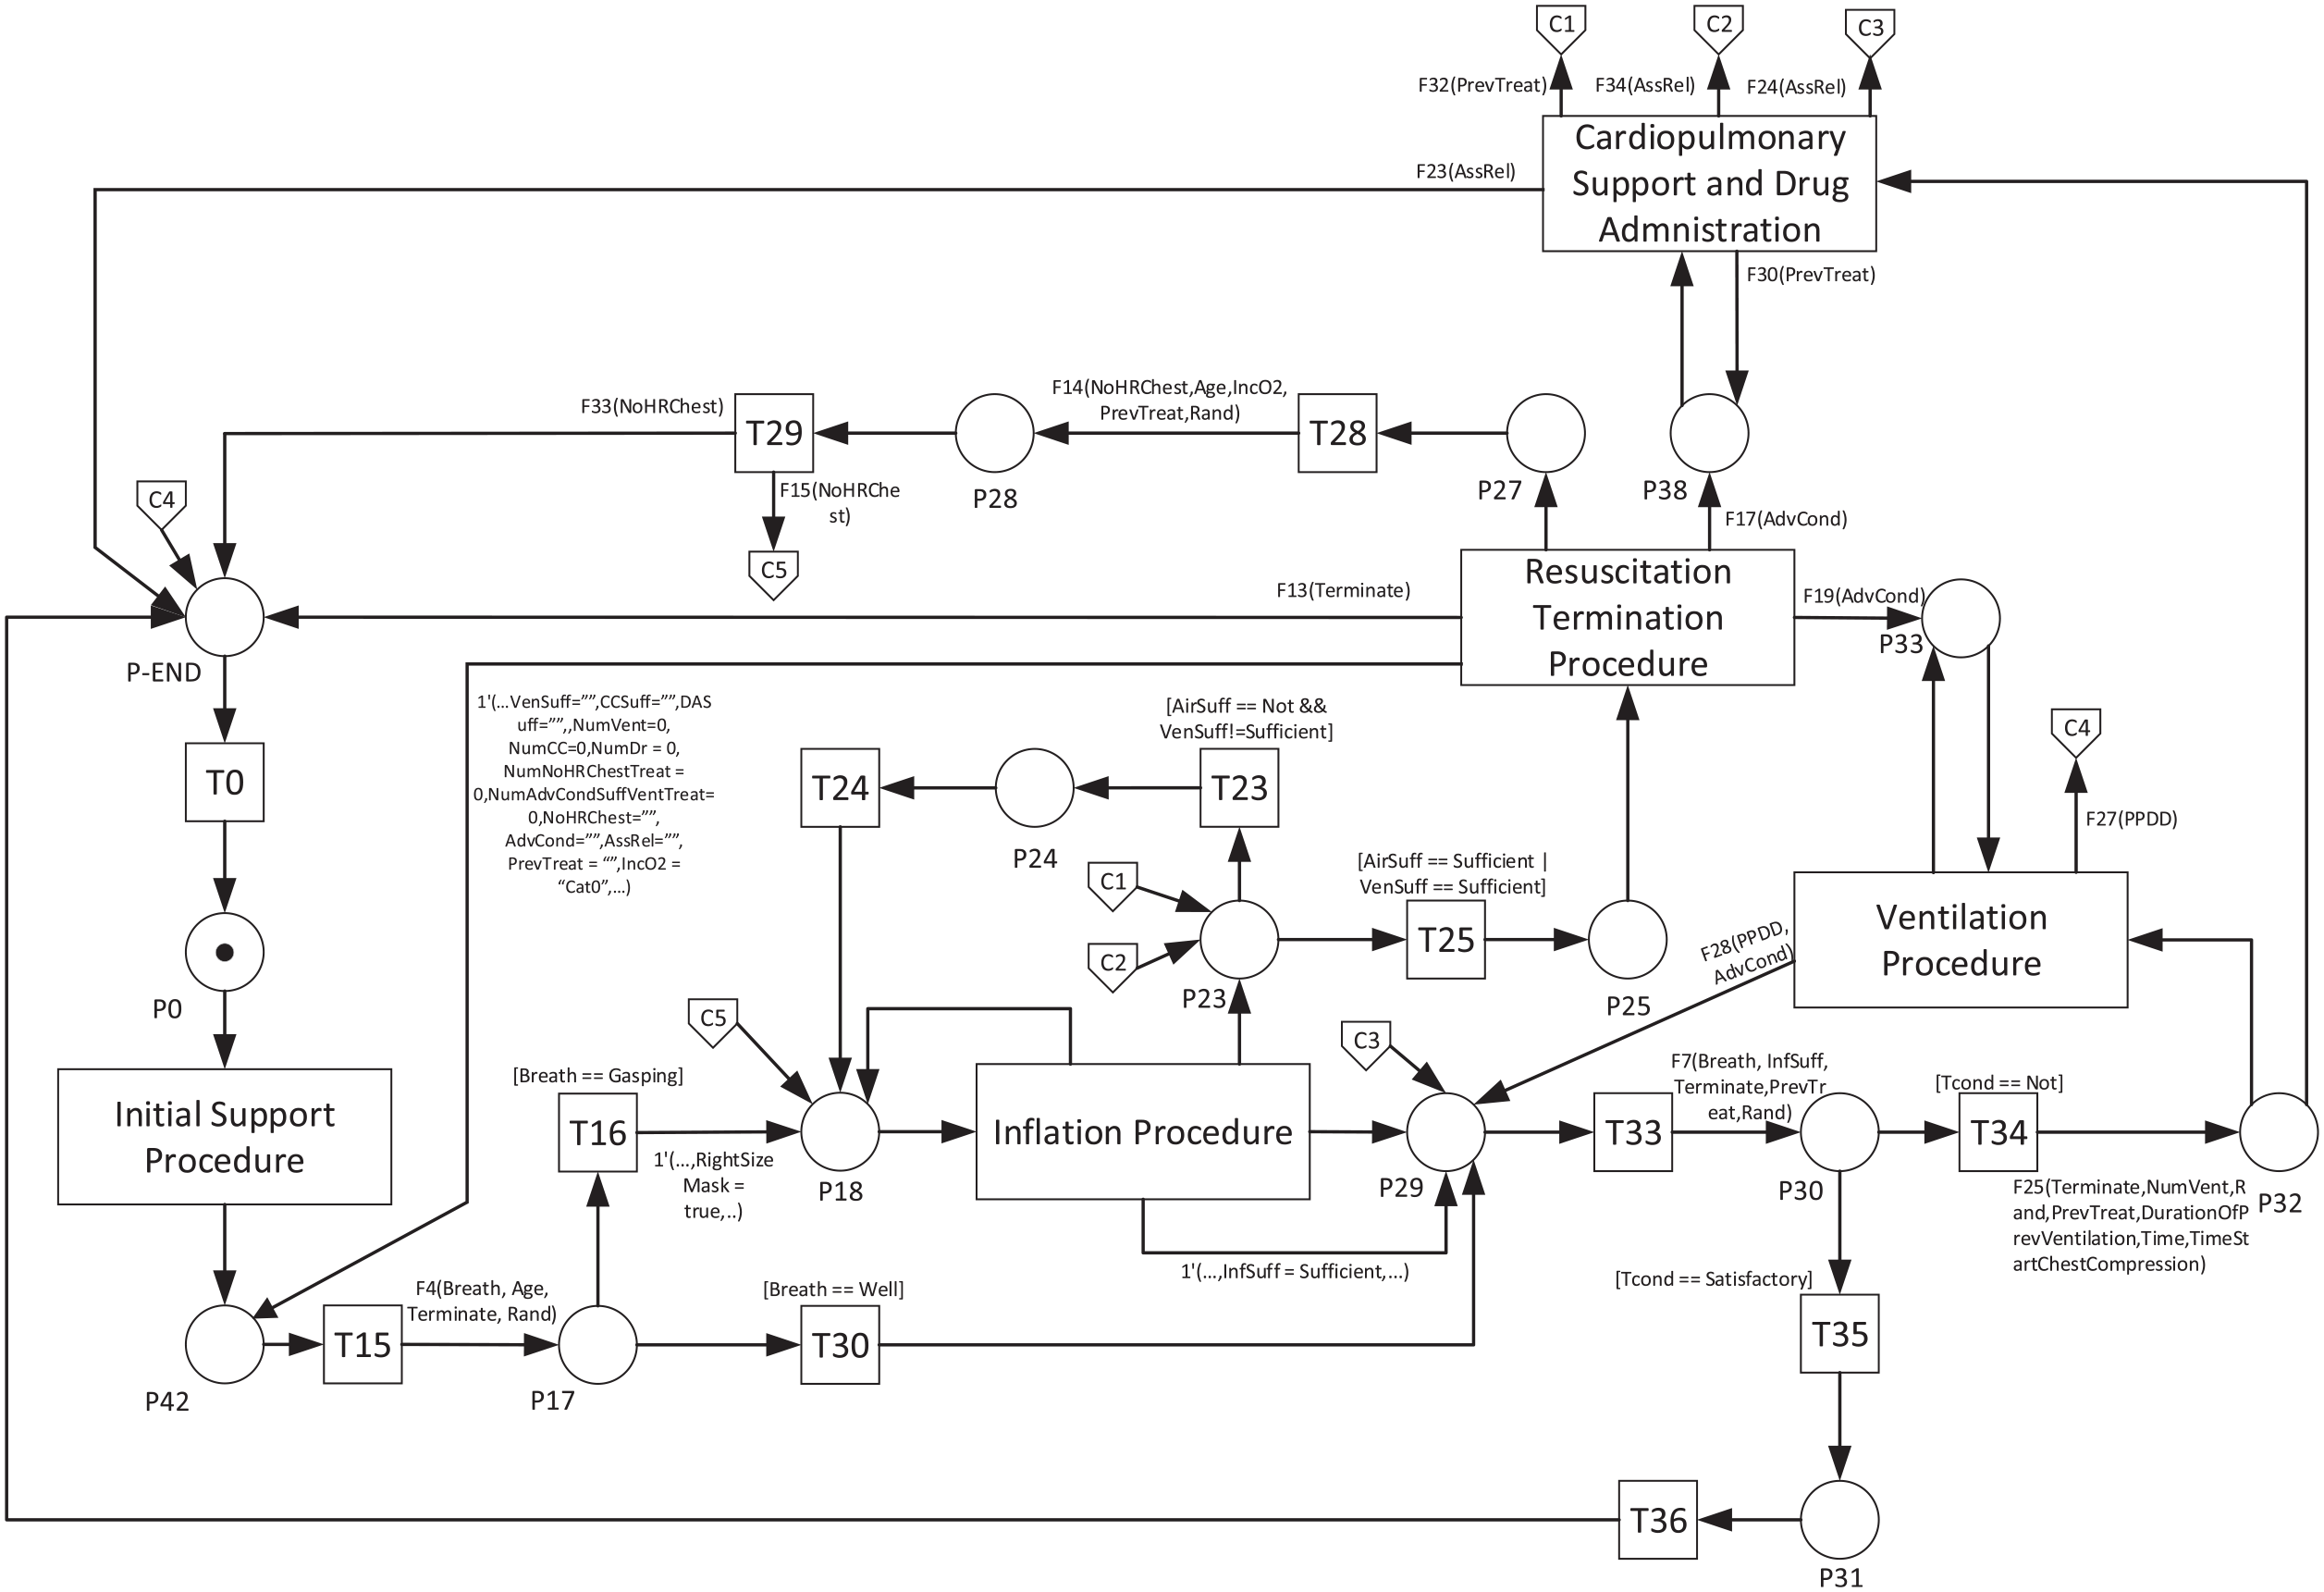
Modular CPN of NLS procedure.
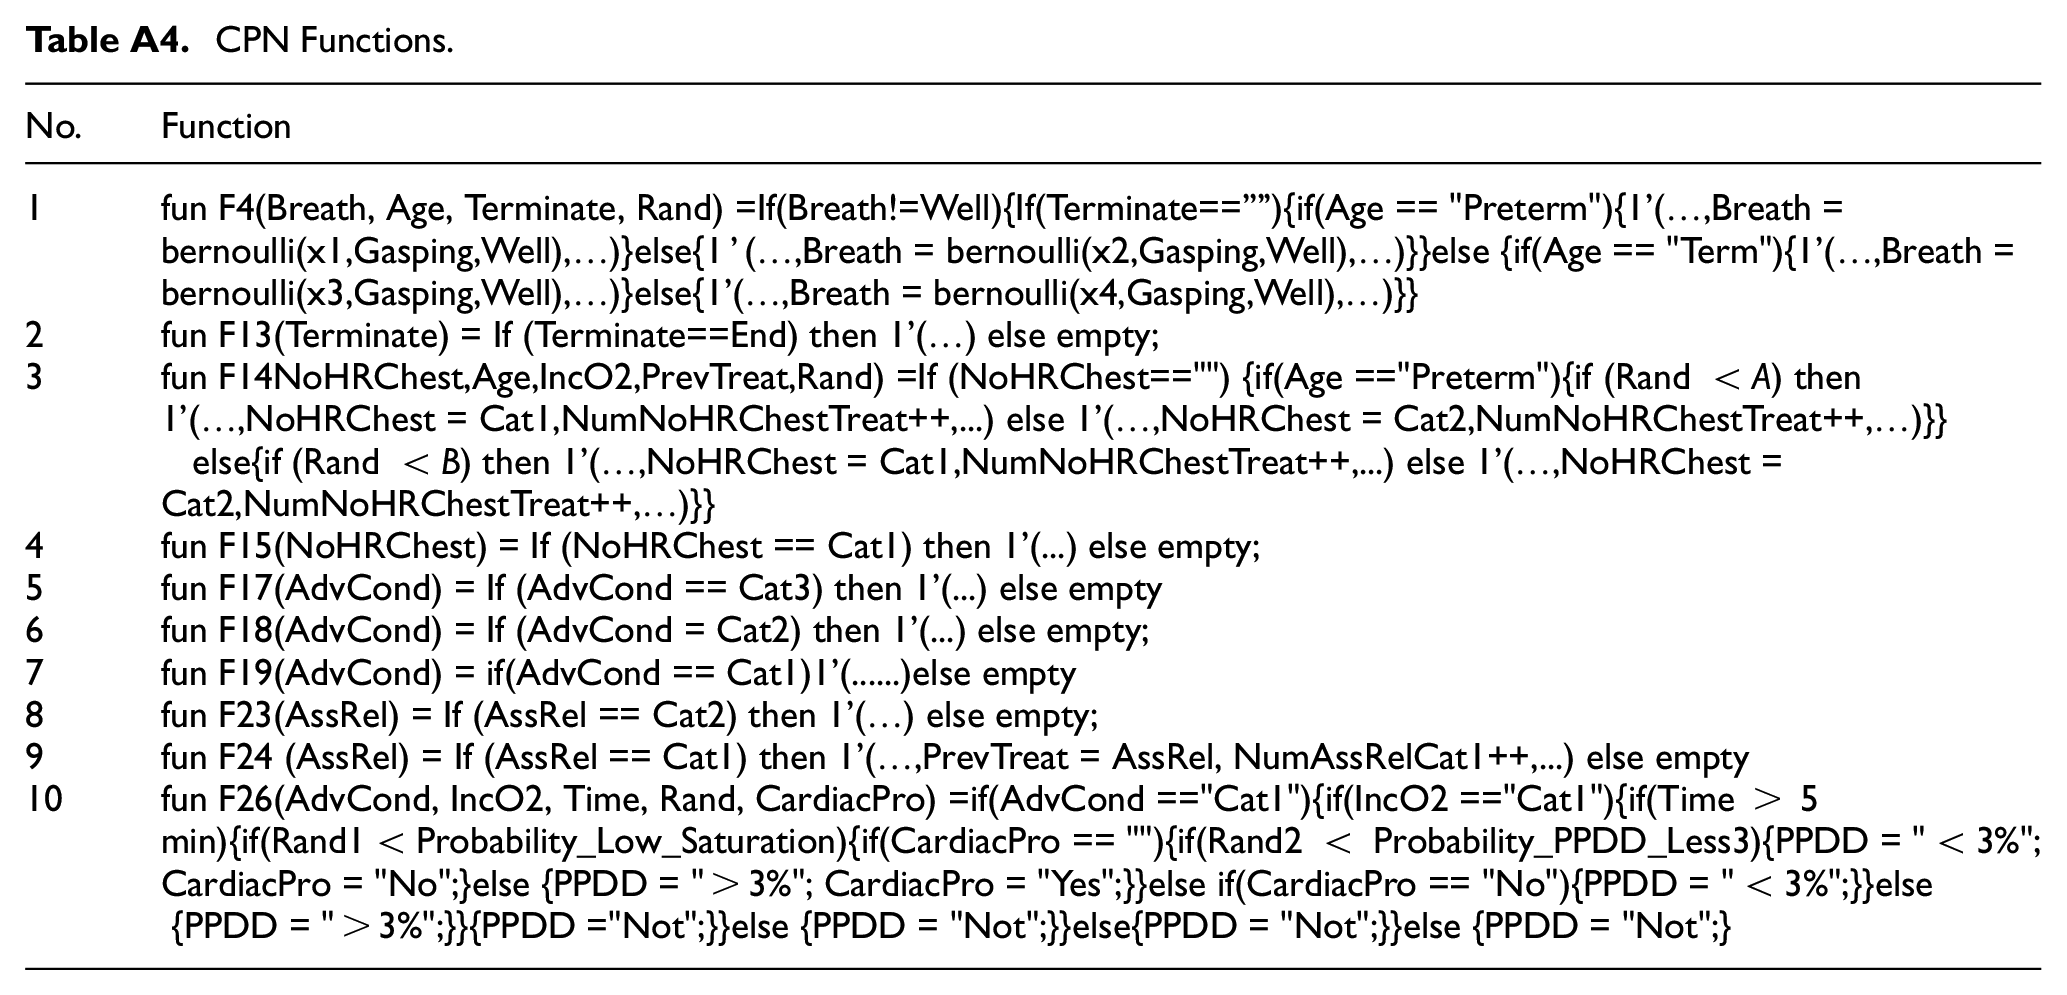
There is a total of 50 transitions, 43 places, 37 functions, 35 individual colours and 1 composite colour ‘Job’ that are used in the detail of the CPN model. However, some entities are grouped and described in Figure 6 with a higher-level activity representation such as the inflation and ventilation procedure module. Some examples of activities modelled by the transitions as well as colours, variables, and functions are shown in Tables A1–A4 in Appendix A.
Model parameters
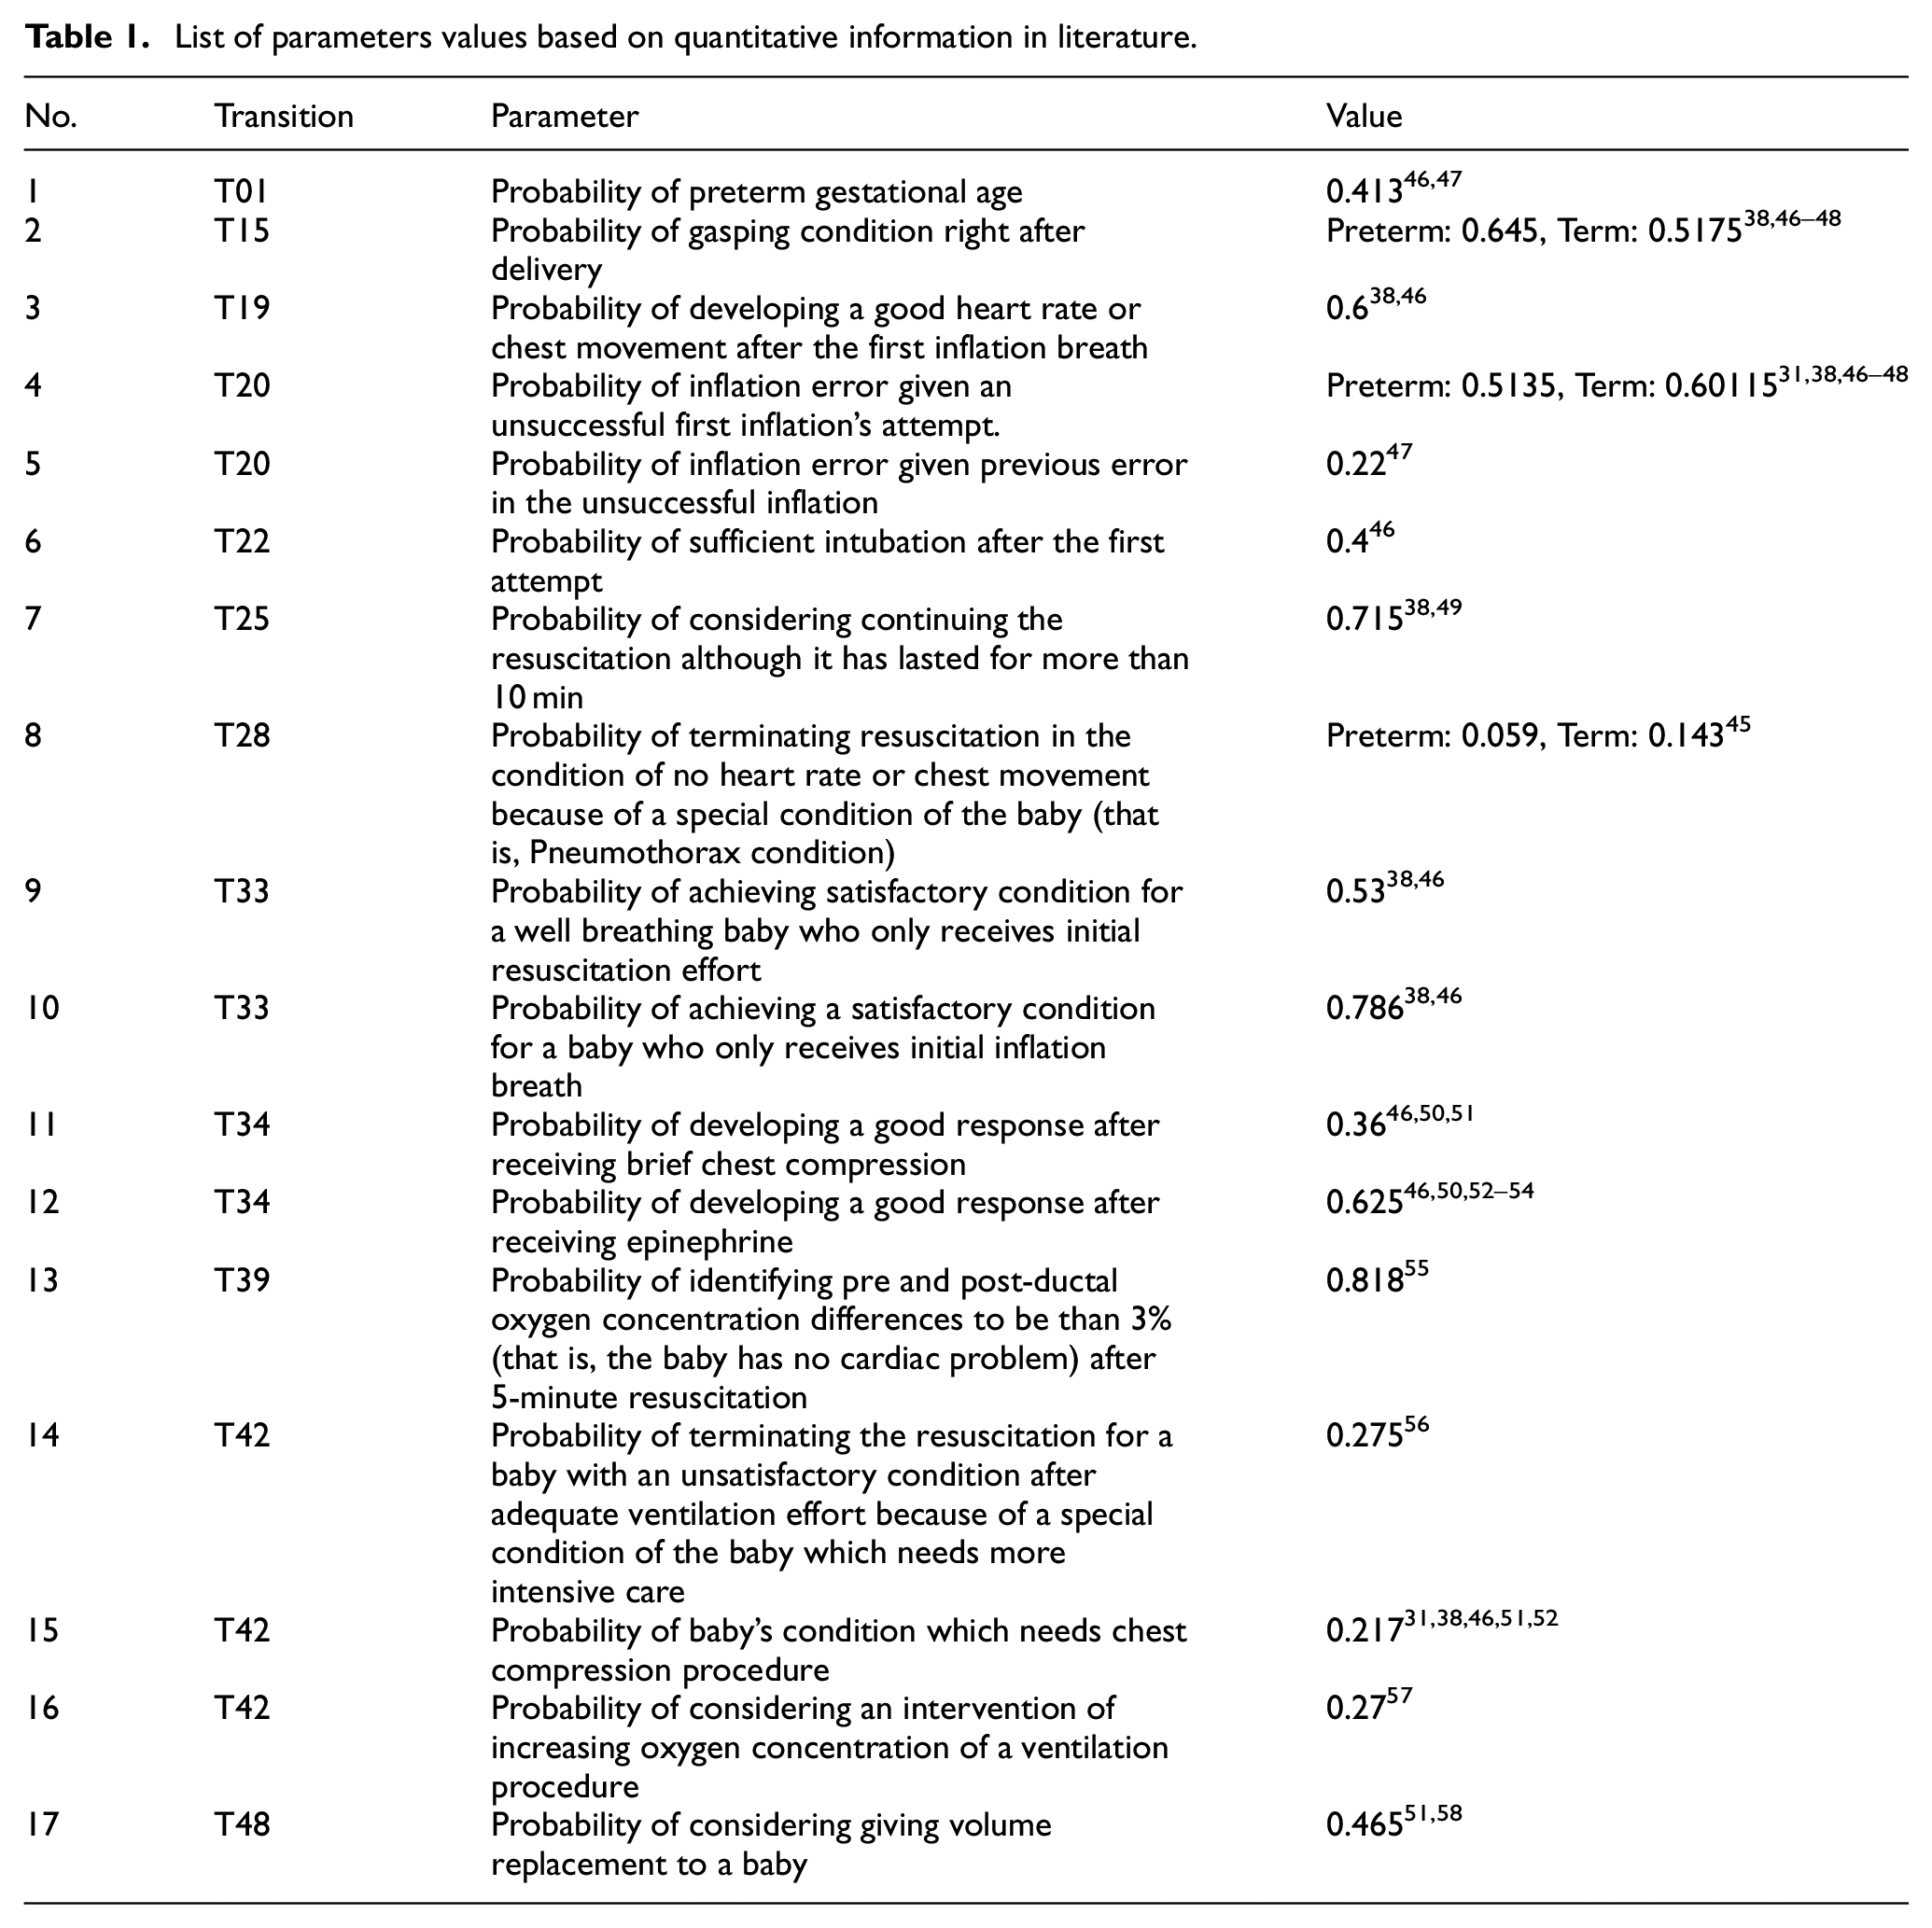
The initial marking of the CPN is one token present in place P0 with the initial colour value of 0 for the numeric colour variable, ‘false’ for the Boolean colour variable, ‘Cat0’ for the IncO2 variable, and none for the rest of colour variables. Some functions in the CPN will generate a specific colour value and assign it to the corresponding colour variable attached to the token. Some parameters on the probability of a particular event are defined to govern this process. A range of values for some parameters in this model are obtained from literature, and some assumptions are made based on qualitative information in literature if quantitative data is not available. All parameter values which are determined based on qualitative information are explained in the subsequent part of this section. Table 1 shows the list of parameters, their values and the references of quantitative information where the values of parameters come from. Some values are directly cited from the literature, but some others are firstly adapted in the context of this CPN model. For instance, the probability of terminating the resuscitation effort of a baby with no response in the heart rate and chest movement (T28) refers to the case of a baby that suffers from Pneumothorax. In the CPN model, it will be identified after the intubation effort has been found unsuccessful. Therefore, the proportion of babies with this condition found in the literature will be adjusted by comparing the number of Pneumothorax cases with the population of babies who have received intubation. The number of babies who received intubation is approximated by the number of babies who received surfactant, obtained from Duong et al. 45 Moreover, some parameters in the model are also differentiated between Term and Preterm babies if the information is available, and there is a significant difference between these gestational ages.
List of parameters values based on quantitative information in literature.
Probabilistic transition rules
In addition to the parameter values presented in the previous section, some additional probabilistic rules are defined based on statistics and qualitative information in the literature. There are two activities that are modelled to have dependent dynamic probabilistic values. These include the probability of continuing a standard ventilation procedure for more than one trial and the probability of developing a good response after an advanced ventilation procedure.
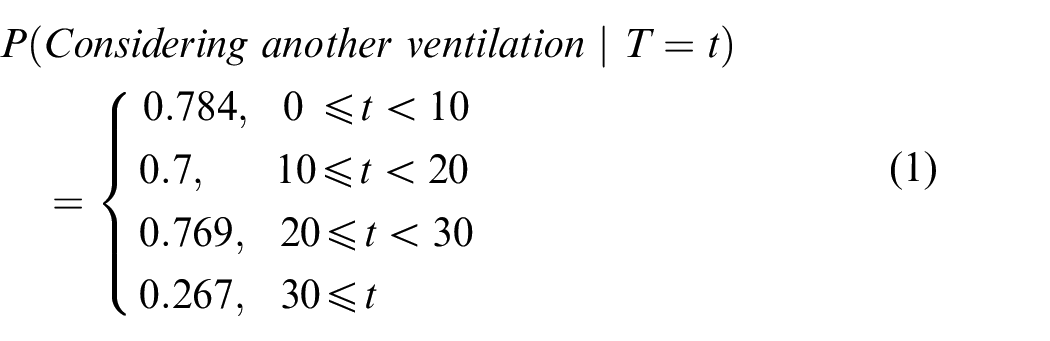
These values are interpreted as the probability of considering another ventilation effort. For example, on a particular occasion, the clinical staff may perform 8-s ventilation to the baby. After this ventilation, it is checked that there is still no improved response from the baby. Based on this situation, the probability of considering another ventilation procedure will follow equation (1) with a probability of 0.784. This probability value is chosen because the previous ventilation only lasted for less than 10 s. The clinical staff will also consider terminating the standard ventilation with a probability of 0.216 (i.e. 1–0.784), which makes the clinical staff continue the resuscitation with a different action. The guideline proposed for the duration of assisted ventilation is between 30 and 60 s 59 before the clinical staff consider more advanced actions to do. This duration is the total time of one or more fractions of ventilations. However, even though the guideline may expect the maximum limit of a single ventilation duration to be 60 s in order to meet the proposed standard, based on the in-field data, 60 there is still a possibility of longer than 60 s ventilation. Therefore, the upper limit of the ventilation duration of the last probability class in equation (1) is opened.

T = duration of a single advanced ventilation procedure (s)
Equation (2) is used to determine the probability of developing good responses when the baby receives an advanced ventilation procedure for a certain duration of time and it is applied to T34.
Another task in the NLS procedure that is separately experimented with to approximate its parameter values is the chest compression activity. The rule of this procedure is modelled based on Chamnanvanakij and Perlman. 51 The probability of showing a good response to the chest compression effort is differentiated between standard/brief compression and prolonged compression. Standard compression is defined as the procedure which lasts no more than 2 min. It will result in a good response with a probability of 0.36, as listed in Table 1. Meanwhile, chest compression that lasts for more than 2 min will have a different probability value as further explained in the subsequent paragraph. The prolonged chest compression will be needed by a baby with a poorer condition with a lower probability of response. In this case, clinical staff may also consider drug administration. This condition is modelled to follow a probability of considering drug administration procedure which is explained in the following paragraph.
Based on this prolonged chest compression condition, the probability of developing a good response to the procedure, the probability of considering drug administration, and the possible maximum total duration of a single trial of chest compression in Chamnanvanakij and Perlman 51 are applied to govern not only the number of chest compression cycles performed in every trial but also the total time of the whole cycle of the compression procedure in each trial. Based on our model, the value of parameters for the probability of initiating a good response in prolonged chest compression, the probability of considering drug administration, and the maximum total duration of chest compression cycles are 0.001, 0.275 and 13 min, respectively. A very small value of the first parameter is considered reasonable because the data in Chamnanvanakij and Perlman 51 shows that all babies that need prolonged compression finally received some drug injections after going through the procedure. It means that there is only a small probability for the baby to initiate a good response without the help of drug administration if prolonged chest compression is applied. The combination of the first two probability values (i.e. probability of good response and probability of considering drug administration) in the prolonged chest compression procedure will cause most babies to receive some drug to help to recover their undetectable heart rate. The drug administration procedure is commenced when it meets the criterion for the second parameter value. A separate simulation model for the prolonged chest compression task was developed based on Chamnanvanakij and Perlman 51 to determine a suitable combination of these first 2 parameter values. Based on this model, it is estimated that the average prolonged compression duration with this parameter configuration is equal to 4.58 min.
Task duration modelling
In addition to probabilistic events and its parameter, the duration of each activity in the NLS procedure is also modelled. Some literature and in-field data are used to estimate the probability distributions of activity durations as well as their parameters. Where relevant data is unavailable, the durations are either modelled as a constant or approximated by some combinations of other relevant activities. Table 2 lists the activities in the NLS model, the number of samples in the in-field data, the probability distributions, and their parameters for the duration of each activity, as well as the minimum and maximum durations of the activities modelled using the Beta distribution.
List of tasks duration in NLS model.
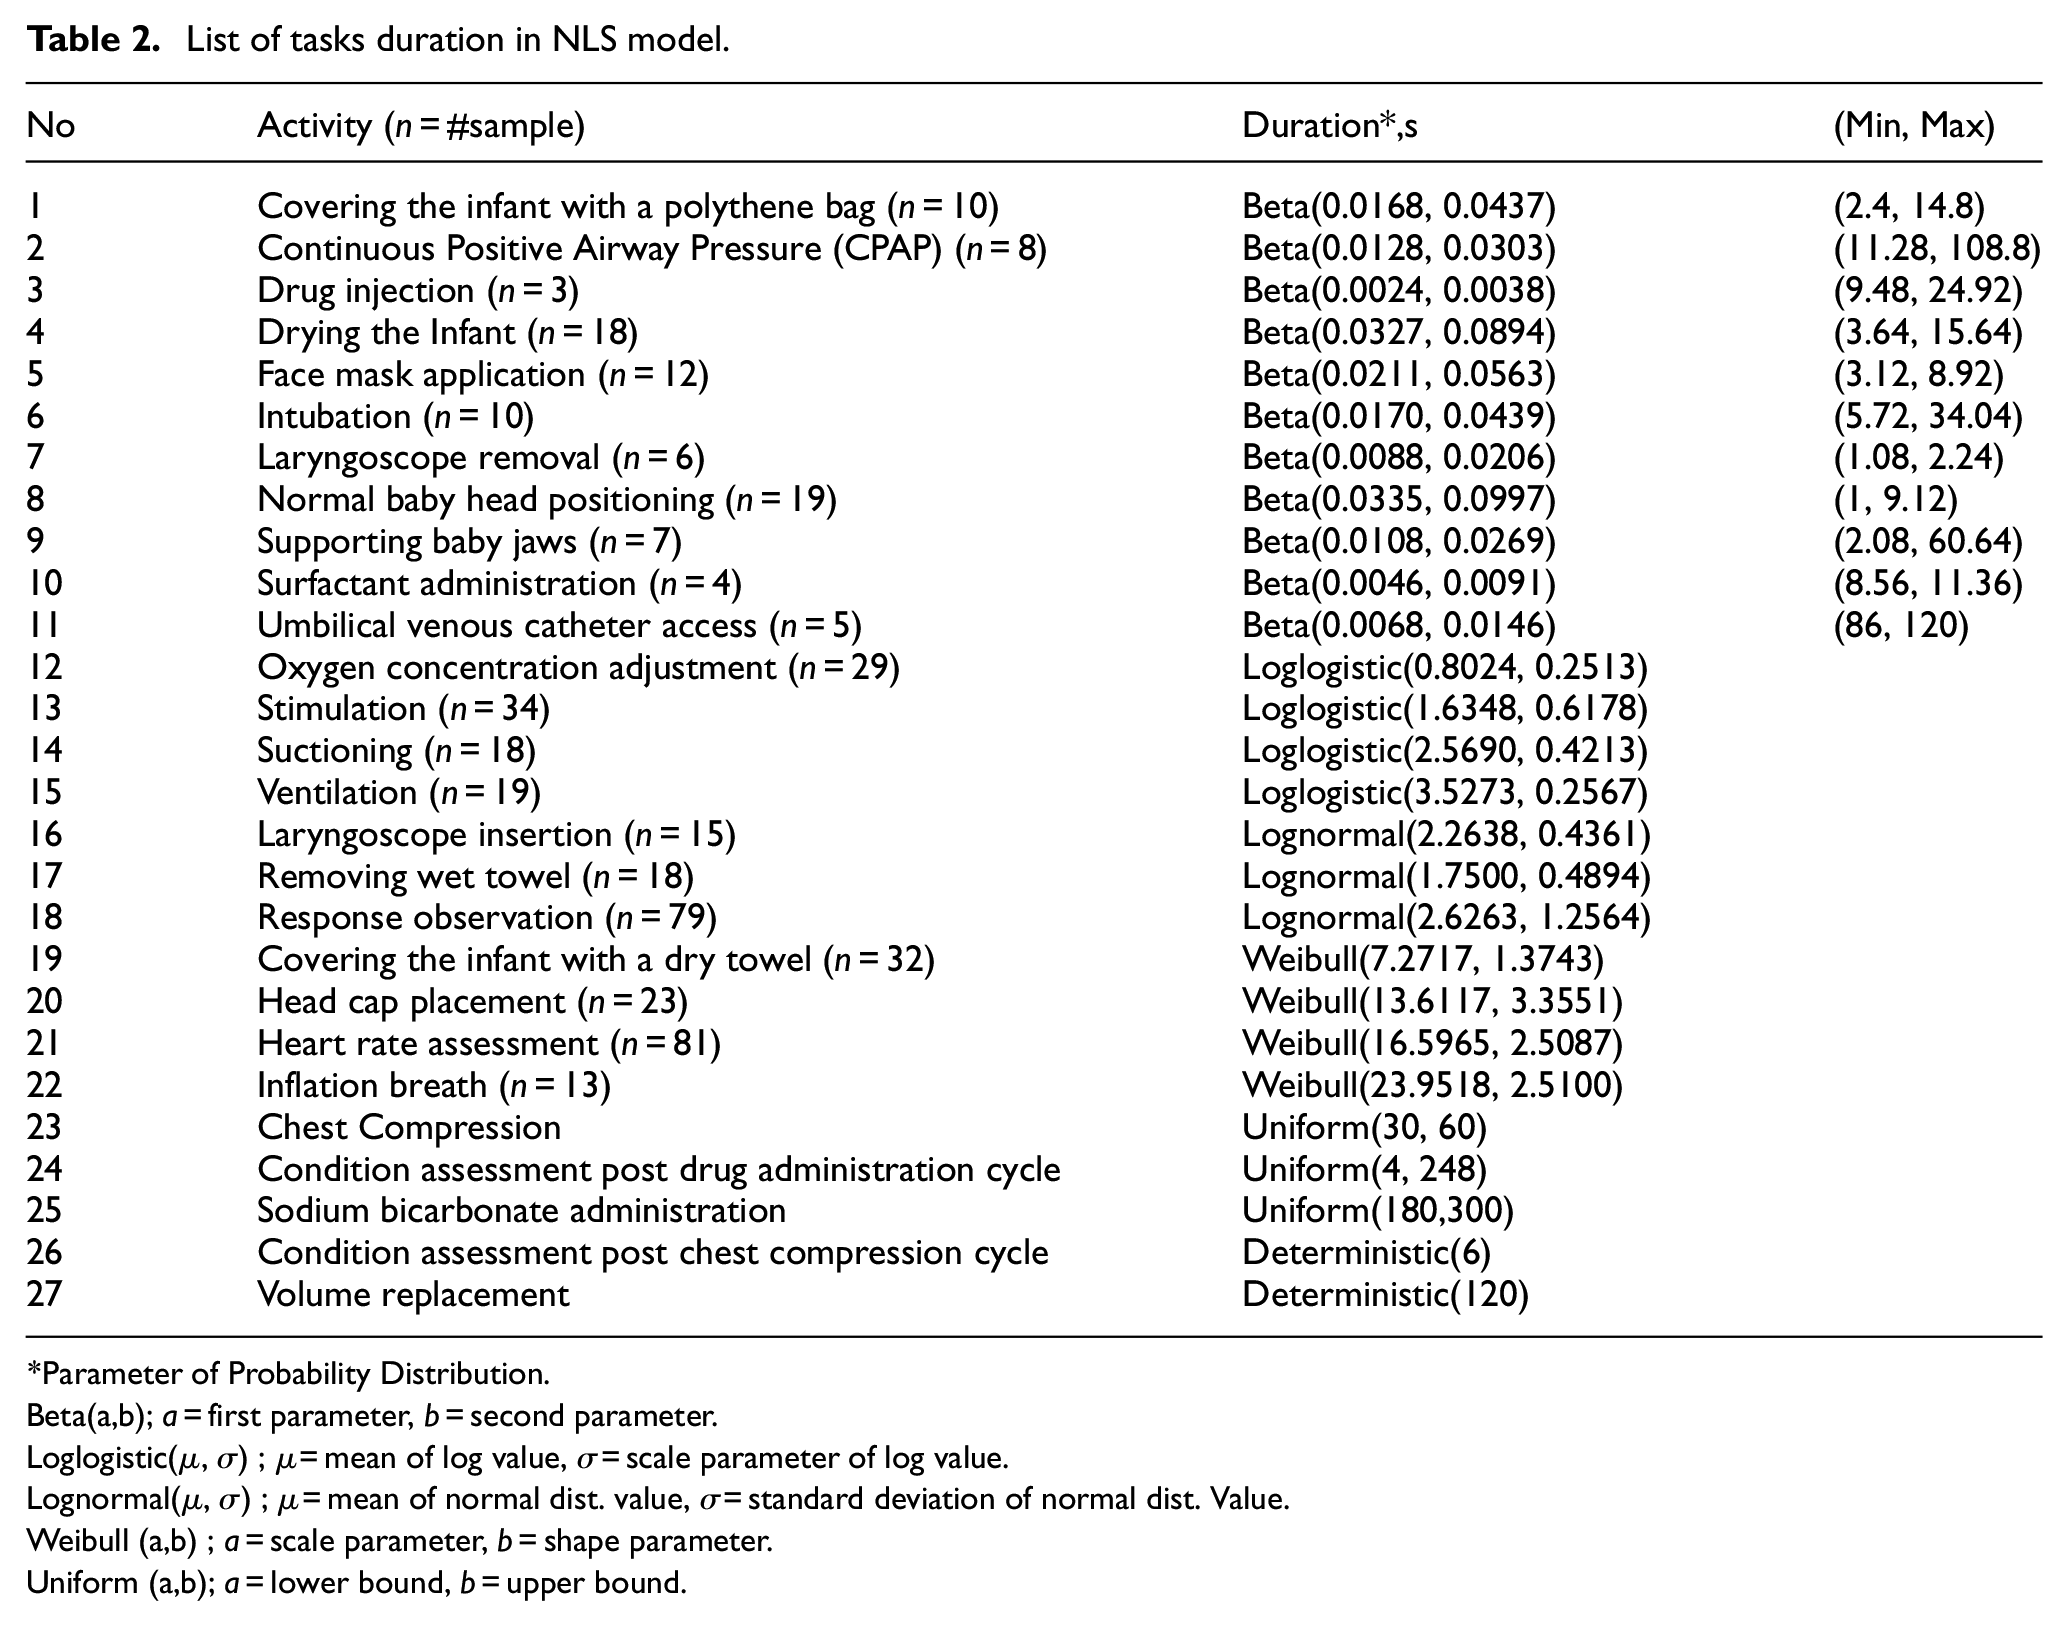
Parameter of Probability Distribution.
Beta(a,b); a = first parameter, b = second parameter.
Loglogistic(µ, σ) ; µ = mean of log value, σ = scale parameter of log value.
Lognormal(µ, σ) ; µ = mean of normal dist. value, σ = standard deviation of normal dist. Value.
Weibull (a,b) ; a = scale parameter, b = shape parameter.
Uniform (a,b); a = lower bound, b = upper bound.
The first 22 duration of tasks in Table 2 is estimated from the in-field data in the form of resuscitation recording videos, 60 except for the duration of umbilical venous catheter access that is obtained from literature. 62 As many as 23 videos are used to obtain the duration of activities. Many videos contain a number of repetitions of certain activities which result in more than 23 items in a sample. However, there are also some rare activities with a small sample. Five probability distributions were considered for the in-field data, such as Weibull, Gamma, Lognormal, Loglogistic, and Beta distributions, as common types of distributions used to model the duration. 63 The duration of tasks with a small sample (n ≤ 10) is fitted by the Beta distribution, which is used as an approximate model due to the lack of data. 63 For larger samples, the probability distribution is chosen using the p-value method. Since the Beta distribution was fitted to the standardised value of task duration ranging from 0 to 1, it needs information about the minimum and the maximum duration of tasks which can convert the standardised generated random variate to the actual range value of the task duration.
The next three activities in Table 2 are modelled assuming the uniform distribution, where the lower and the upper bounds are found in literature.51,53,64 The last two activities are modelled assuming a constant value of the duration.38,65
Several other assumptions are made in the NLS model. Some of the most important assumptions are given below:
The duration of decision-making activities during the resuscitation procedure is assumed 0. This assumption is based on the fact that the process is usually performed very quickly or even simultaneously with other actions. An example of this activity is determining the sufficiency of intubation action.
The probability of success of a repeated action is assumed higher, especially when some problems that cause the failure of the previous activities have been rectified or when some additional actions to improve the performance have been applied. One of the examples relates to the repeated inflation procedure which can be performed after technical errors have been resolved. The baseline probability value used to determine this parameter value refers to the one for T19, as shown in Table 1.
The maximum number of repetitions of some tasks is assumed based on data in the literature relating to the common practice of the procedure as well as the risk of the procedure. One of the examples is the maximum trials of drug administration procedure which is set to 2 to keep the repetition to the minimum number in order to avoid the risk of tachyarrhythmia. 66
The probability of terminating the resuscitation procedure is differentiated between 2-time points. The probability is assumed higher (i.e. 0.5) for the resuscitation procedure that has been performed for more than 20 min than the one within the interval of 10–20 min (i.e. 1–0.715) as referred to the inverse probability value of T25 in Table 1. The probability is determined based on the range of values interpreted from related information found in Fawke et al. 38 and Foglia et al. 49
The probability of babies achieving satisfactory conditions is set lower for the ones who need advanced treatments. The setting of this parameter reflects an assumption that these babies have poorer health conditions. The lower bound of approximated relevant probability38,46 is used for the parameter value.
Model results
Simulation model for the NLS procedure
After having developed the CPN model of the NLS process, a Monte Carlo simulation was developed using the C++ programming language. A modular and sequential programming technique was applied to translate the CPN model into a simulation model. The verification of the simulation code was carried out by running some scenarios of the NLS procedure in the simulation model. There is a total of 24 initial scenarios ranging from the simplest situations in the NLS procedure to some complex ones which involve full and long resuscitation procedures. The movement of tokens in the model and the total duration of the procedure for each scenario, obtained from the simulation model, were compared with the expected outcomes coming from the manual calculation. The code was revised until no further errors were found.
The model was also validated by using some data in the literature. The validation process aims to ensure that the NLS model closely reflects the real NLS procedure. There are three types of indicators used to validate the model. These include the proportion of babies who need full resuscitation, 38 the proportion of babies who achieve stabilisation without the need for cardiopulmonary treatment, 38 and the recorded time point of the eight most relevant key events in the full resuscitation procedure. 54 Some statistics were derived from literatures38,54 to perform a hypothesis test to determine the validity of the NLS model. Student’s t distribution was assumed as the basis of confidence interval construction in Heathcote et al. 54 On the other hand, there is no statistical distribution assumption for the data in Fawke et al. 38 since only constant values are presented. Table 3 shows the derived statistics used to compare the outcomes from the simulation model and the literature.
Validation statistics of The NLS process.
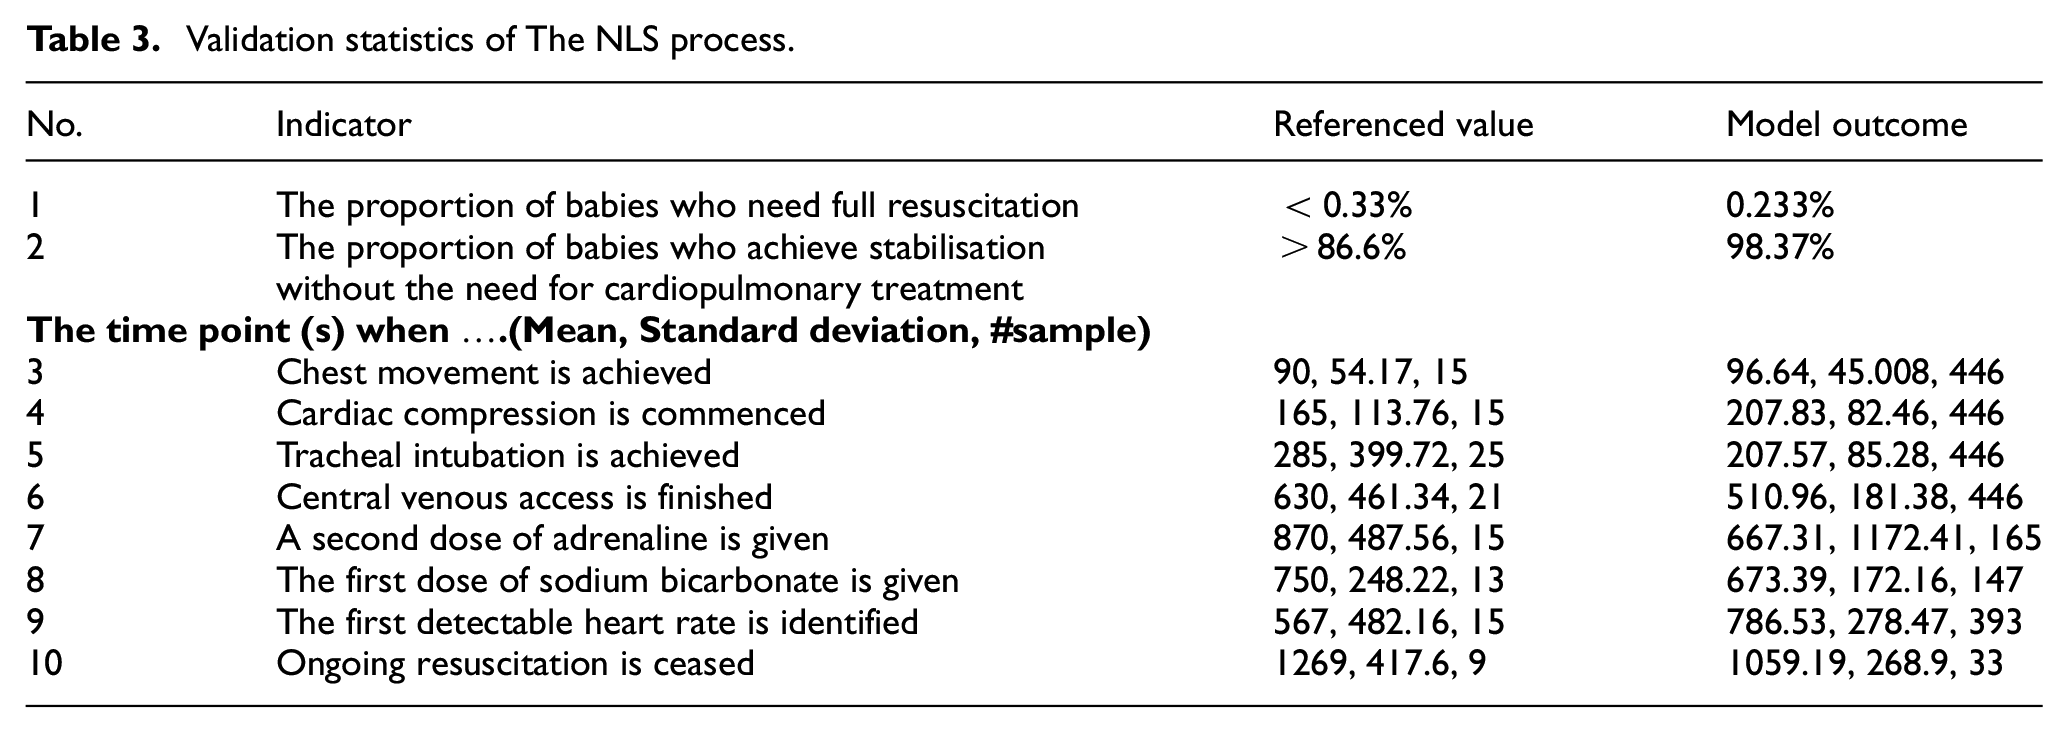
The sample size adequacy of each outcome of the simulation model was calculated using a sample size formula for a single sample of proportion 67 and the relative error method 63 for the time point of 8 observed key events. A confidence level of 95% and a relative error of 10% were applied in the sample size calculation. Based on this calculation, the simulation model was executed 200,000 times. An iterative process of the simulation model adjustment and modification was conducted until it resulted in a valid model. A number of adjustments performed during the validation process relate to some values of model parameters including the probability of events and the duration of some tasks. The probability parameters were adjusted by choosing other possible values within the range of values found in the literature. Some alternative reasonable assumptions were also considered for the probability parameters. The assumptions and the parameter values listed in Tables 1 and 2 in the previous section are the final results of these adjustments.
The outcomes of the model can be shown in Table 3. Hypothesis testing of one single sample proportion and two samples mean with an assumption of different variance 67 were applied to the outcome of the model and the referenced value. A significance level of 5% is applied for the hypothesis test. The Normal Distribution approximation for a large dataset is assumed for the hypothesis test on proportion, while the Student’s t distribution is the basis for the two independent samples test on the mean. The null and alternative hypotheses for proportion and mean are defined based on the referenced values in Table 3. Some timepoint outcomes of the simulation model shown in Table 3 seem to have a considerable difference in the mean value compared to the references. However, due to a large standard deviation of timepoint in both the references and the simulation, these two results are still statistically comparable.
Variations scenarios in the NLS procedure
Twelve experiments were conducted to demonstrate the ability of the model to investigate changes in the outcomes of the NLS procedure due to the effects of variations in the procedure. The outcomes of the NLS procedure were observed as the proportion of babies who still have an unsatisfactory condition at the end of the protocol, the proportion of babies who need full resuscitation, and the duration needed until the baby achieves stabilisation (satisfactory condition). The unreliability of the process is represented by the first performance indicator, that is, the higher the proportion of babies with the unsatisfactory condition is, the more unreliable the process can be considered. Meanwhile, the second indicator represents both the reliability and the efficiency of the procedure. The full resuscitation action will be considered if a standard resuscitation action doesn’t bring any result. An unsuccessful standard/initial procedure may be caused by erroneously performed actions or babies’ conditions themselves. Hence, this second indicator may partially reflect the reliability of the initial resuscitation action. In the context of the whole NLS procedure, the higher proportion of full resuscitation cases found to recover babies’ condition is, especially the ones caused by improper initial actions, the less efficient the NLS procedure we have. Finally, the third performance indicator on the duration of the resuscitation procedure will represent the efficiency of the process. The shorter the duration needed for the NLS procedure to recover the babies’ condition is, the more efficient the NLS protocol will become.
Sensitivity analysis was carried out for parameter values of the NLS model. There were seven parameters involved in the analysis with their lower and higher values compared with the value used in the initial model. Some parameters were also differentiated based on the gestational age of the baby, that is, preterm and term columns in Table 4. The parameters in Table 4 were chosen due to their relationships with the condition of errors in the procedure or because these actions were observed to have a high variation in the real resuscitation activity, especially for the scenarios relating to the repetition of ventilation. This high variation was indicated from the range of task duration measured from the 23 video recordings of the resuscitation procedure used in this research. The scenarios relating to the technical errors in the procedure simultaneously reflect variations in the skill of clinical staff, the condition of a baby, and the standard good practice for the task. On the other hand, scenarios regarding the maximum trials of respiratory procedures only represent variations in the standard practice of a clinical task.
Variations of NLS procedure.
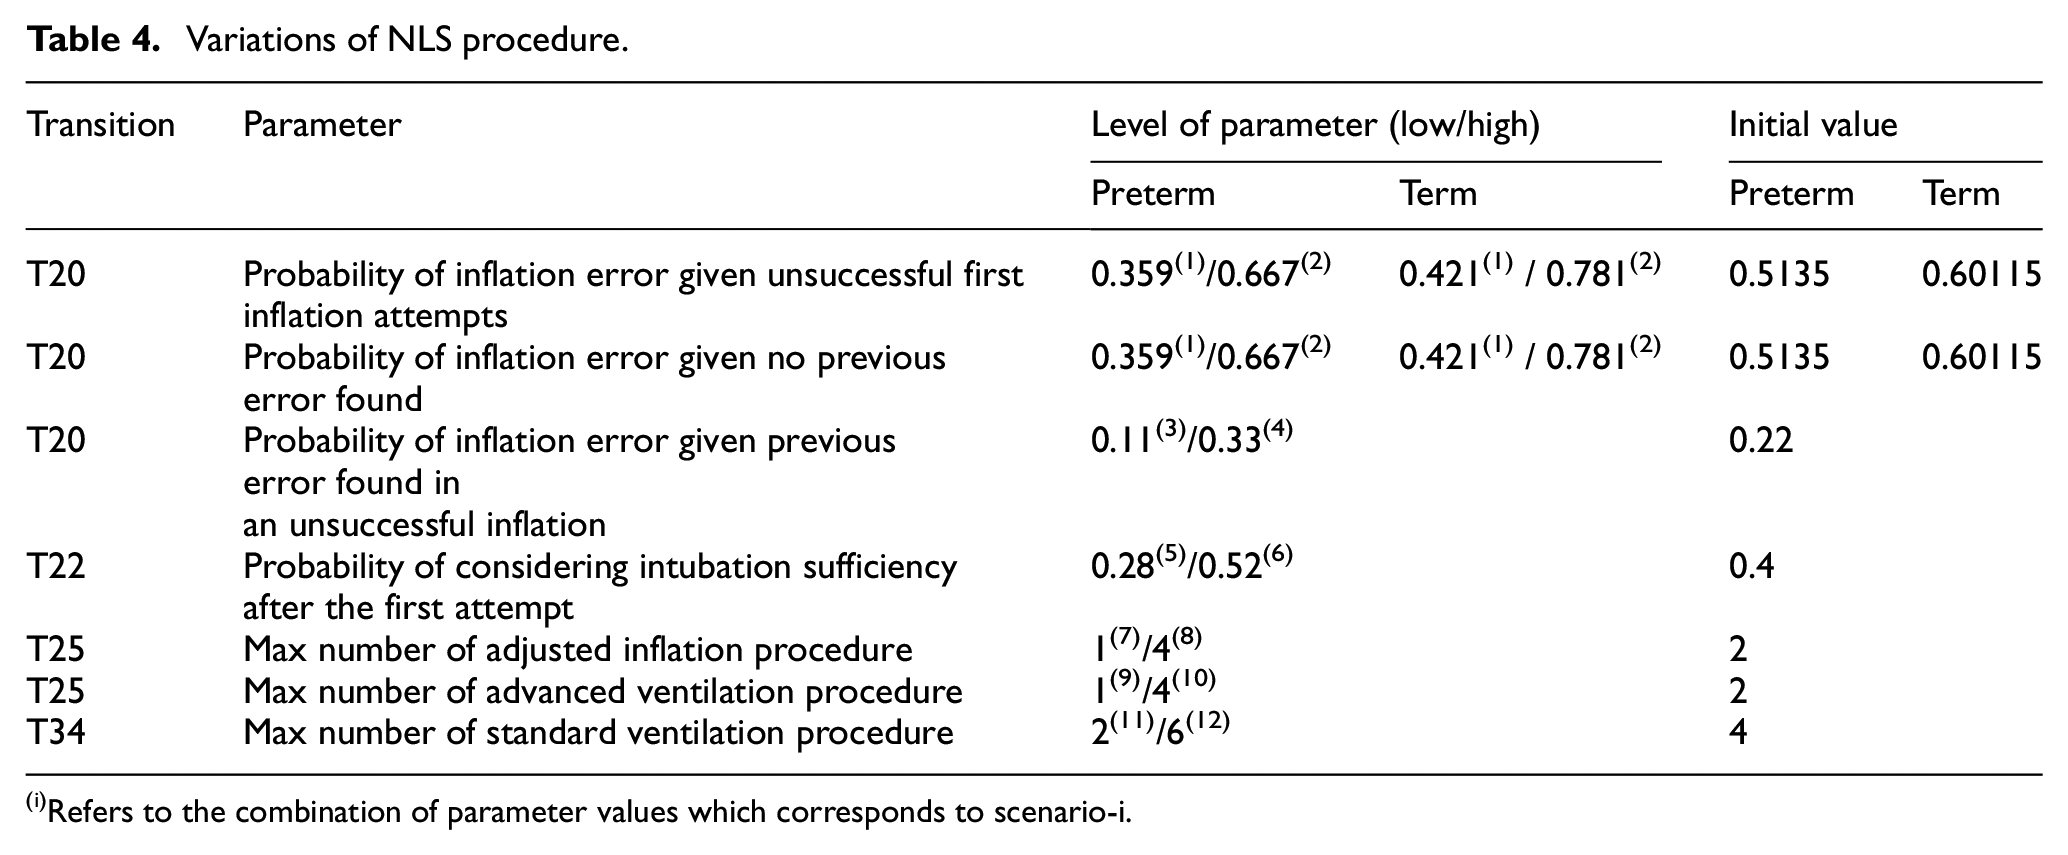
Refers to the combination of parameter values which corresponds to scenario-i.
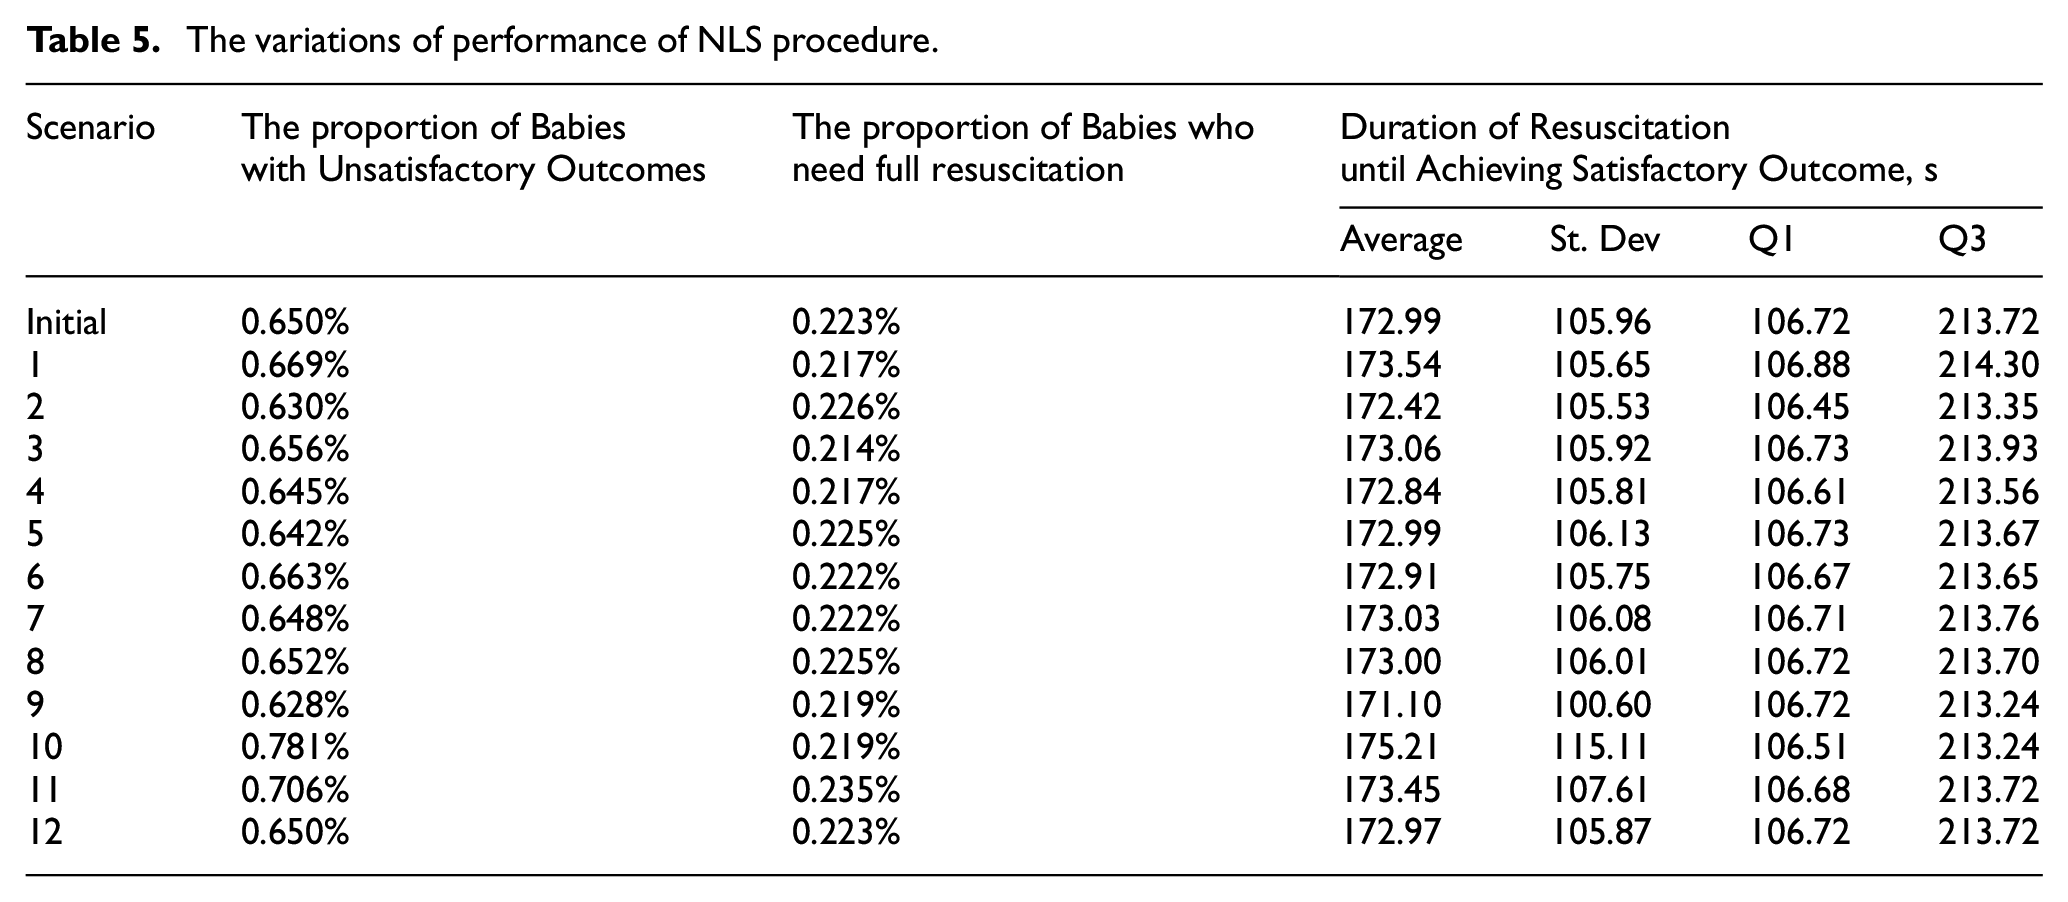
The experiment was performed by changing one parameter at a time, except for the first two parameters which have the same initial probability value and their changes were applied simultaneously. Twelve variations of the NLS scenarios were generated as referred to by the subscripted numbers in Table 4. For instance, scenario 1 is a scenario which applies the low-level value of the first two parameters. The outcome performances of the NLS procedure for each scenario are presented in Table 5. Each column refers to different performance indicators observed from the NLS model.
The variations of performance of NLS procedure.
Discussion
Scenarios on the inflation error and intubation adequacy parameters
As mentioned in the previous section, the parameters involved in the scenarios represent variations in the skill of clinical staff, the condition of the babies, as well as the standard practice guideline in the NLS procedure. Variations described by the first four parameters in the Table 4 represent all categories of variation, that is, changes in probability, represented by scenarios 1–6 and illustrated in Figures 7 to 9.
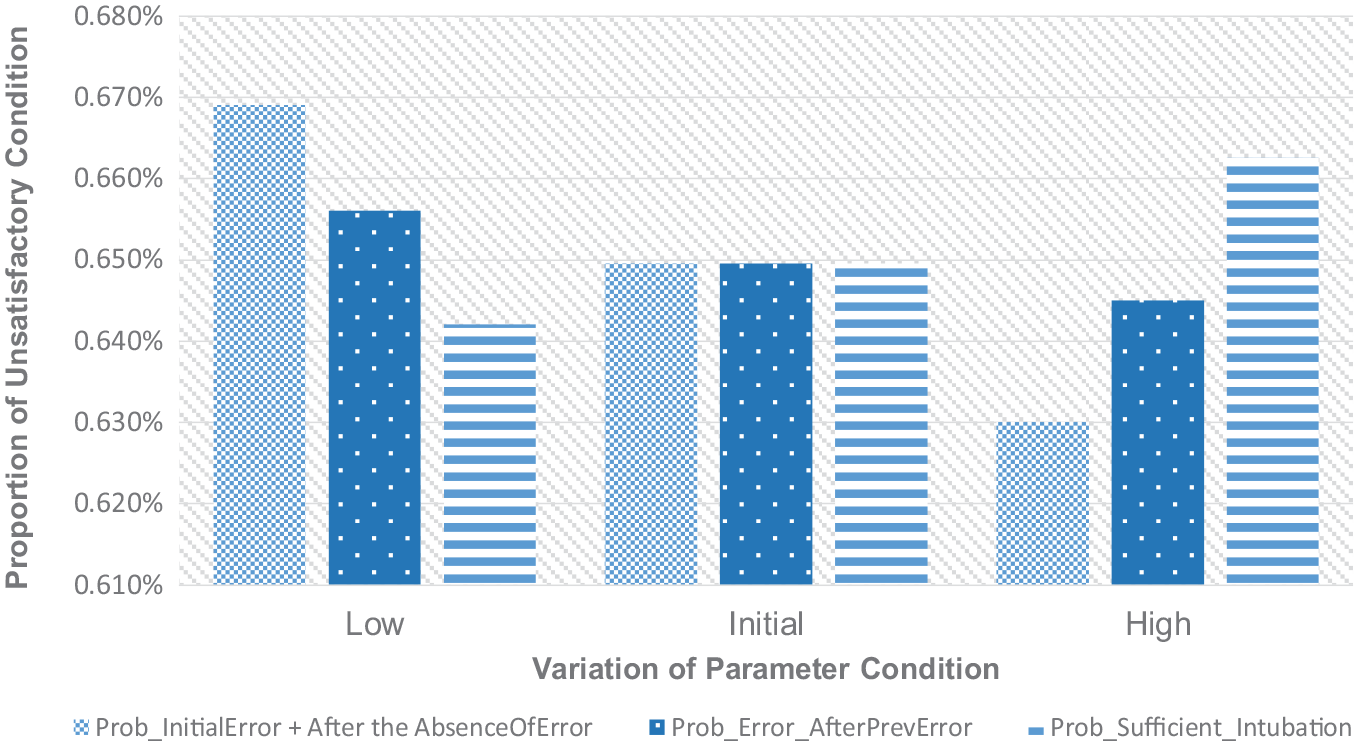
Variations of the proportion of unsatisfactory condition relating to tech. error.
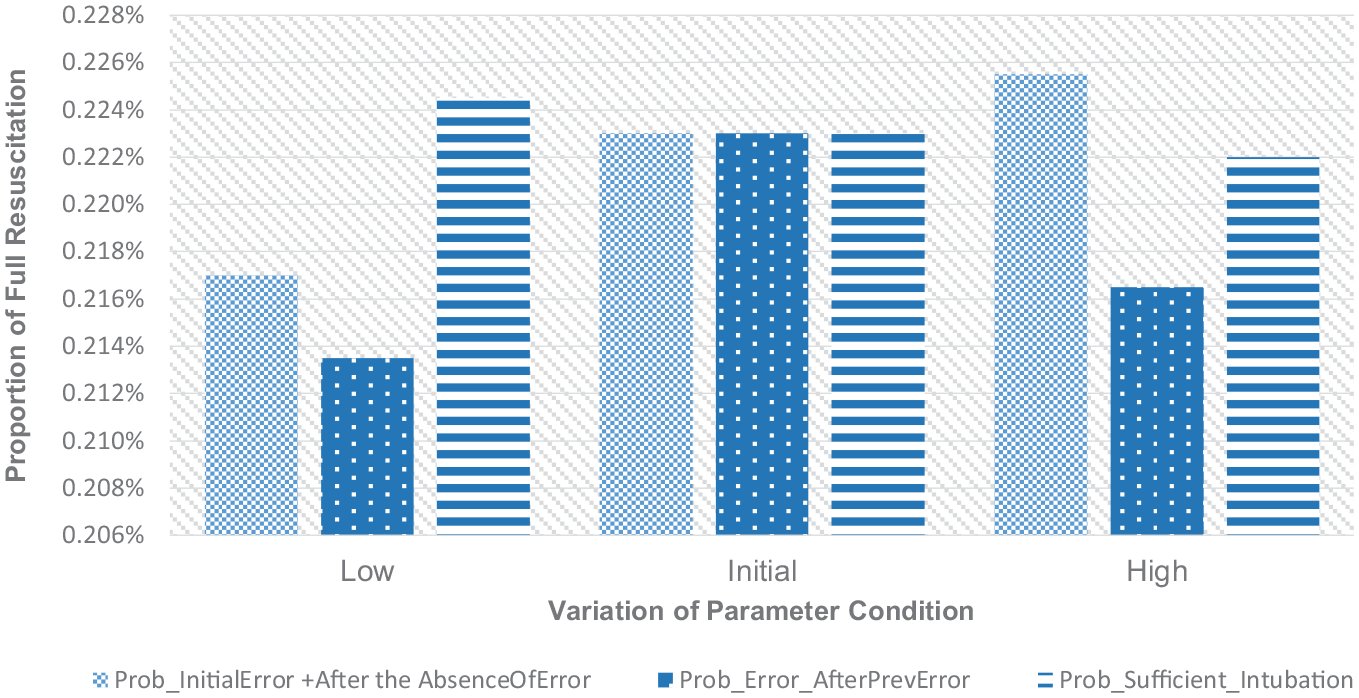
Variations of the proportion of full resuscitation relating to tech. error.
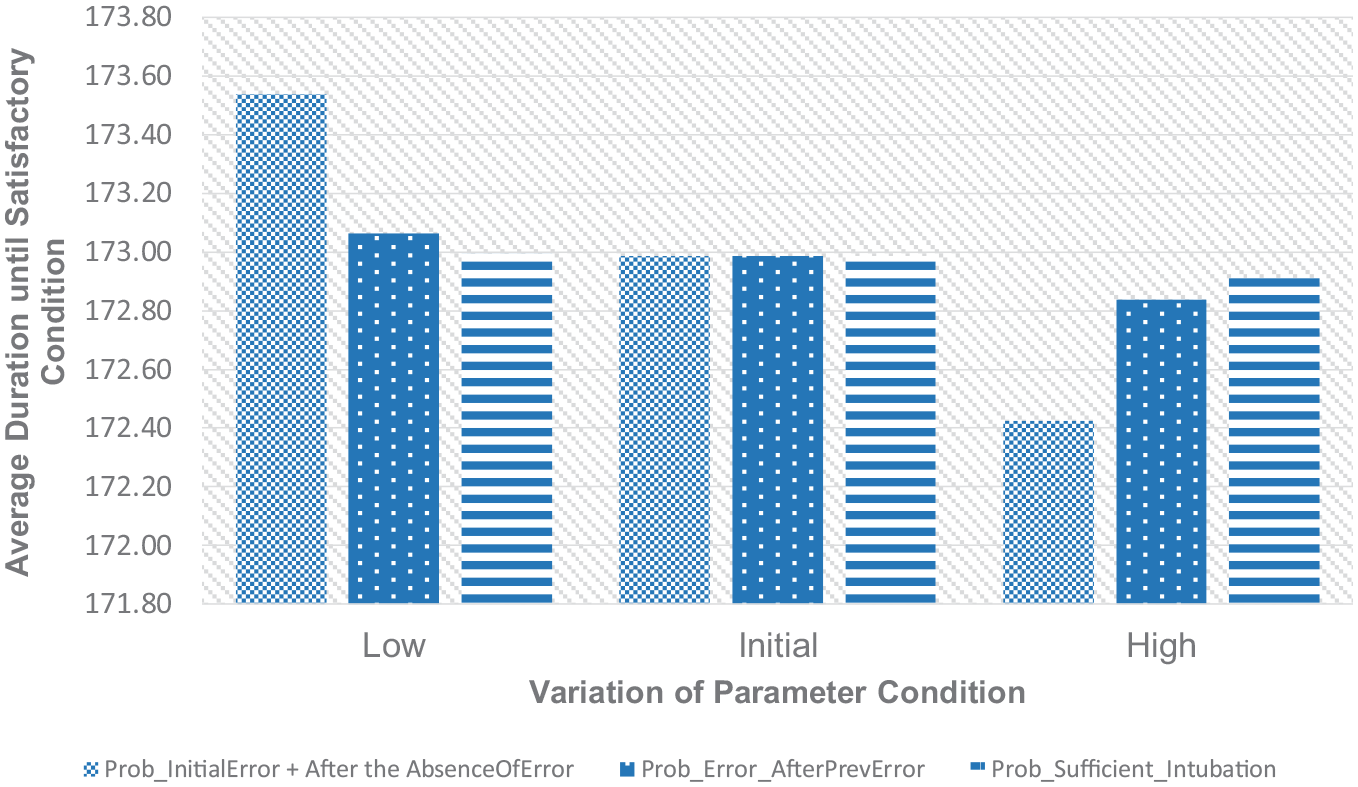
Variations of the time duration of resuscitation relating to tech. error.
Based on the context of the NLS model developed in this paper, the probability of inflation error regardless of the previous error status of the task represent the conditional probability of error given the failure in an inflation action. Hence, in this situation, the probability of inflation error refers to a condition when unsuccessful inflation is caused by some technical errors in the procedure which relate to the skill of the clinical staff. Otherwise, this unsuccessful inflation may be caused by the poor physical condition of babies, which causes difficulties in responding to the procedure. Therefore, this first group of scenarios simultaneously reflects two kinds of variation in the NLS procedure.
Figure 7 shows a decreasing pattern in the proportion of babies with an unsatisfactory condition as the probability of inflation error increases. A higher probability of inflation error means that more failures in the inflation procedure are caused by technical errors during the procedure. In other words, the probability of poor physical condition causing inflation failure is lower. Once the technical errors in the inflation procedure have been dealt with, the probability of success for the inflation is assumed to be higher. This reasonable assumption will cause the probability of a baby to fully recover becomes higher. The higher the probability of technical error which is found as the cause of inflation failure instead of the congenital condition of the baby is, the higher the chance for the inflation procedure to effectively obtain a good response from the baby once the errors have been rectified will become. Therefore, there will be fewer babies who end up with unsatisfactory conditions at the end of the procedure when technical issues are found as the most likely cause of unsuccessful inflation. It will be harder for the NLS procedure, including the inflation procedure, to recover the baby’s health if the congenital condition of the baby turns out to be the cause of failures in the procedure. This reflects that the initial baby’s condition is very poor.
On the other hand, the probability of considering the adequacy of intubation shows an opposite trend. However, this probability also relates to the fact whether errors in the inflation procedure can be found so that it enables the inflation procedure to gain a desired response from the baby. This intubation procedure can be repeated to support the inflation before it is considered to be ineffective, and the clinical staff should find another solution. This condition means that the intubation procedure has been delivered adequately to support the inflation but unfortunately, there is still no response from the baby.
As a part of efforts to induce a positive response of an inflation action from a baby, a higher probability of considering the sufficiency of intubation means that it will be quicker for the clinical staff to conclude that the intubation effort is not effective anymore and they will go for some more advanced procedures to inflate the baby’s lung. On the contrary, when this probability is lower, the intubation will be reapplied to the baby and the standard inflation procedure will be repeated. In this situation, it is modelled that there will be a chance to revisit the unsuccessful standard inflation to find some previously unidentified technical errors in the procedure. As explained for the first two parameters in this scenario, corrections to these inflation errors will make the rectified inflation procedure have a higher probability of successfully obtaining a desired response from the baby. It explains why the lower probability of considering intubation sufficiency results in a lower proportion of babies with unsatisfactory outcomes.
The outcome affected by these first four parameters shows the reliability of the NLS procedure, which will be influenced by the nature of the babies’ condition, the skill of clinical staff, and some good practice guidelines applied to the procedure. Based on the results, as well as the characteristics of the NLS model developed in this research, a more careful evaluation of unsuccessful standard inflation procedure may improve the reliability of the procedure. Therefore, instead of rushing to apply a more advanced protocol or diagnose a severe baby’s health condition, an effective investigation of possible technical errors in the unsuccessful standard inflation procedure should be carried out. In the meantime, other aspects of variations relating to the complementary interpretation of the cause of failure in the inflation procedure (i.e. the skill of the clinical staff and the condition of the babies) show some significant changes in performance when the procedure deals with different scenarios of baby’s condition. In this situation, the intervention to improve the outcome of the procedure should be emphasised in prenatal care during pregnancy.
For the second performance indicator, the proportion of babies who receive full resuscitation procedure will generally increase as the probability of errors, as the cause of unsuccessful inflation, increases and when the probability of considering intubation sufficiency decreases. However, this conclusion is limited to the values of parameters used in the scenarios. As previously discussed, the higher the probability of error or the lower the probability of terminating the intubation effort is, the higher the probability of the NLS procedure to be directed to revisit the previous unsuccessful inflation will become. This action aims to find some technical issues in the previous inflation task and rectify them. Eventually, this rectified inflation will increase the effectiveness of the procedure. Once the baby has shown a good response to this procedure, some following supporting actions to enhance the baby’s condition will take place. Standard or advanced ventilation, chest compression, and drug administration procedure will follow this successful inflation depending on the development of the baby’s condition. Full resuscitation is identified when the NLS procedure progresses to the drug administration task. The number of babies that receive this set of subsequent actions will decrease as the probability of errors decreases and the probability of considering intubation sufficiency increases. This is because the reason for the unsuccessful inflation is most likely to be diagnosed not to stem from the errors in the procedure but the physical condition of the baby. Therefore, the NLS procedure tends to be directed to doing an advanced assessment of the baby’s condition in which there is some possibility to terminate the NLS protocol because the baby will be diagnosed with severe conditions that need more intensive treatments which are beyond the scope of the NLS procedure. This situation may decrease the number of babies that may take part in a full resuscitation procedure. However, there appears to be an exception in terms of variation in the probability of another inflation error found when some errors have been found in the previous evaluation.
The decrease in the number of cases of full resuscitation procedures may show a more efficient NLS protocol if it is also followed by a satisfactory outcome for a baby who only receives the initial procedure. At the same time, this condition will reflect the reliability of the initial resuscitation stage. Assuming a normal health condition of a baby, an error-free or accurate delivery of the initial NLS procedure should result in a more reliable initial resuscitation stage. Due to the way this causality is modelled in this paper, the effect of variation regarding the condition of the initial resuscitation action (i.e. technical error in the inflation procedure) cannot be separated from its complementary interpretation of event relating to a poorer condition of the baby as the cause of an unsuccessful initial action. Therefore, the model results in a higher number of babies with unsatisfactory outcomes when the technical issue in the unsuccessful inflation procedure is less frequently found. In the meantime, the characteristic of the outcome affected by the variations in the probability of considering intubation sufficiency may support the previous insight about the undesired effect of early stopping on intubation action. As shown in Figure 8, given a constant probability of technical error in unsuccessful inflation (which may also reflect a steady baby’s condition level), a higher probability value of intubation sufficiency may result in a lower proportion of full resuscitation. However, it is followed by a higher number of unsatisfactory outcomes (Figure 7). In this situation, instead of representing a positive sense of the NLS performance, the decreased proportion of full resuscitation cases reflects an inadequate effort during the resuscitation. There are more babies with the unresponsive condition to the inflation procedure who tend to be diagnosed with a severe health condition so that the resuscitation will be prematurely terminated with an unsatisfactory outcome.
The average of resuscitation duration until the baby achieves a satisfactory condition generally becomes smaller, when the probability of inflation errors as the cause of failed inflation increases. Successfully identified causes of action failure as well as the correction to the procedure increase the effectiveness of the inflation task. It means that the probability of gaining a positive response from the baby is higher as defined in the model. In addition, as also explained previously, the complementary probability of this error represents some possibility of another factor of variation which may cause the failure in the inflation procedure. It is defined as the poor physical condition of the baby. The lower the probability of technical error found as the cause of the inflation failure is, the higher the number of cases of babies with poorer conditions is reflected. Therefore, it will be harder for the inflation procedure to obtain the desired response from the baby. It may even need to progress to some advanced inflation, health condition assessment and observation activities first so that the total duration for the resuscitation procedure will be higher. However, it is not observed from variations in the probability of intubation sufficiency. The higher the number of adequate initial intubation efforts is, the lower the average duration needed for the resuscitation procedure to recover the baby’s condition becomes. The size of the population under consideration for the calculation of the resuscitation duration decreases as the number of unsatisfactory babies increases, as shown in Figure 7. In addition, the proportion of babies who receive full resuscitation, which may cause a longer duration of the procedure, also decreases.
Scenarios on the maximum repetitions of respiratory support procedure
The second category of variations in the NLS procedure relates to the maximum number of trials of respiratory actions before the clinical staff decides to move on to another alternative action. These include the maximum number of advanced inflations, advanced ventilations, and standard ventilation that may be applied to a baby in the absence of response to the previous action (unsuccessful action). An understanding of how these variations affect the outcome may result in an insight that can help to improve the performance of the procedure. Figures 10 to 12 show the pattern of the outcome of the NLS procedure based on the variations in these three parameters.
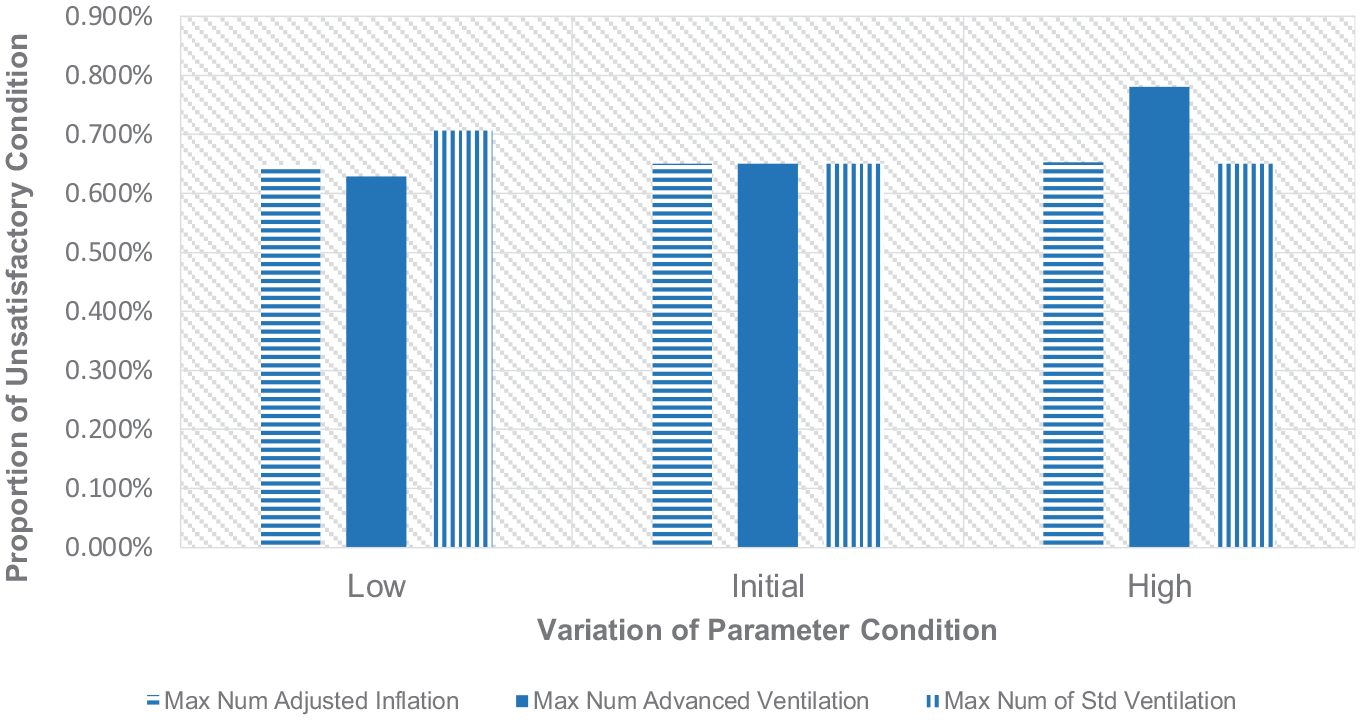
Variations of the proportion of unsatisfactory condition relating to max action repetition.
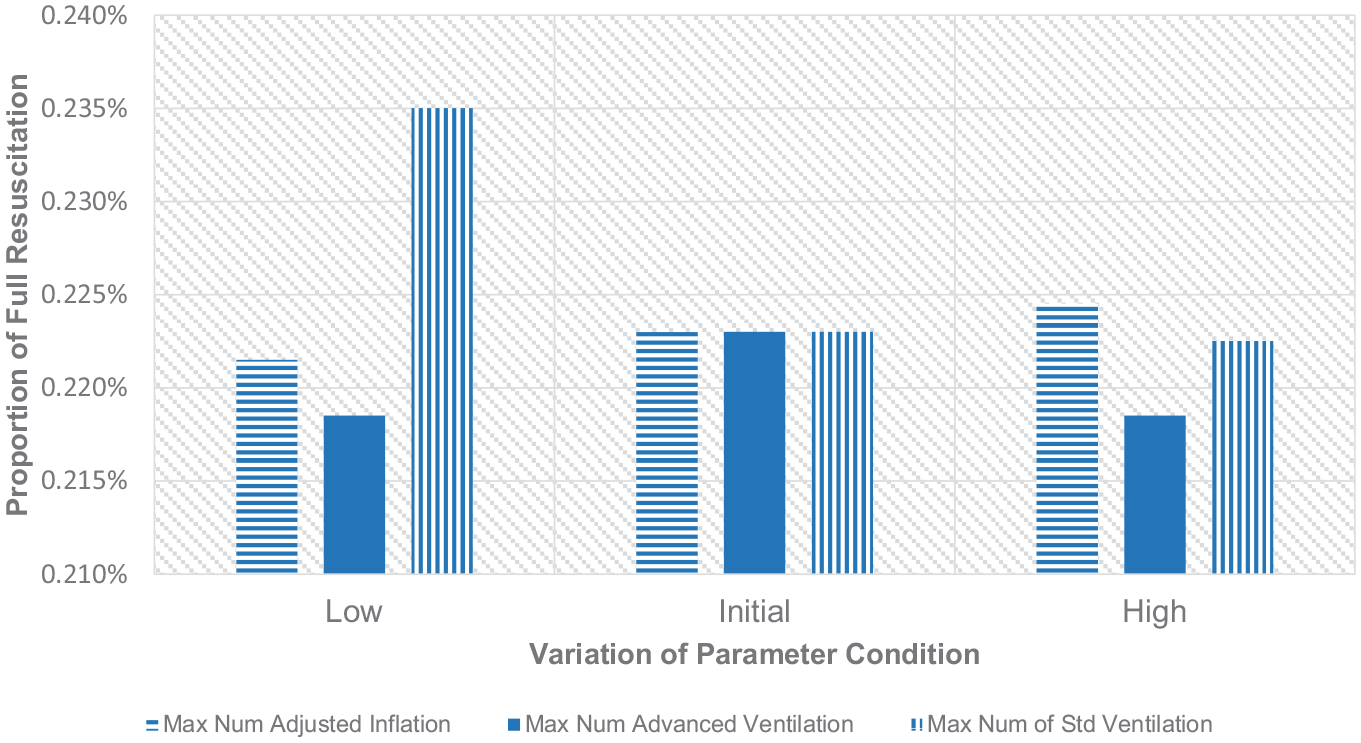
Variations of the proportion of full resuscitation relating to max action repetition.
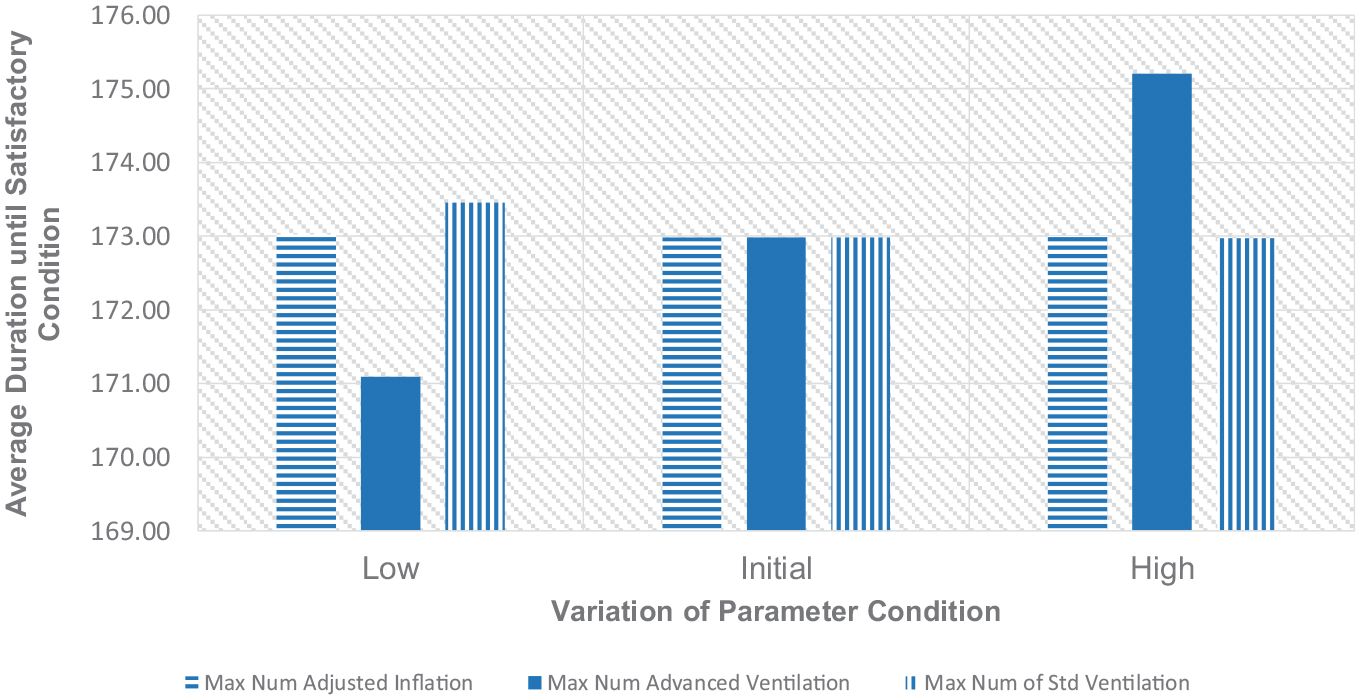
Variations of time duration of resuscitation relating to max action repetition.
Based on these three figures, a higher maximum number of standard ventilations is preferable. Such an approach can improve the reliability of the process, as well as other performance indicators of the NLS procedure. The proportion of babies with unsatisfactory conditions at the end of the procedure is decreasing. Likewise, the proportion of babies who have to go through a full resuscitation scheme and the total duration needed until the baby is able to be recovered also improves with a higher number of standard inflations. Therefore, limited to the variations of the maximum number of standard ventilation applied in this paper, it is better for the clinical staff to work on the standard ventilation with higher repetitions as the following action to improve the baby’s condition before they consider another advanced treatment. However, it doesn’t mean that the standard ventilation can be applied as many times as possible because hyperventilation may also injure the baby’s lung and even cause apnoea. 38
On the contrary, increasing the maximum number of advanced inflation and ventilation attempts brings undesired effects to the outcomes of the procedure. The advanced respiratory procedure that may include adjustment to the oxygen concentration and air pressure level should be kept minimum because increasing the number of trials will either worsen or make no difference to the outcome of the procedure. The exception applies to the advanced ventilation trials with their non-monotonic effect on the proportion of full resuscitation cases. However, the lower number of repetitions of this action is still preferable due to the simultaneous benefit to the three NLS performance indicators. Based on the results in Figures 10 to 12, the low-level maximum trial limit of these two advanced procedures is recommended. Keeping these treatments to a minimum number of attempts will make other possibly more effective actions in the case of unsuccessful advanced treatment to be conducted earlier. This strategy may direct the NLS algorithm to the re-evaluation of some fundamental conditions of a baby, such as the condition of the baby’s airway and heart rate and provide a chance to apply a more promising action to the baby.
Conclusion
In this research, the combination of CPN modelling and simulation method is shown to be suitable to study the variations of the NLS procedure. The probabilistic aspects of the procedure that have not been investigated in previous works are able to be exposed in this research. Furthermore, it also demonstrates the possibility to estimate the effects of variations in the NLS procedure which are essential in justifying the consequences of possible changes proposed to the current protocol. The ability to experiment with aspects of variations in the NLS procedure with the methodology used in this paper will provide necessary information for anyone responsible for this protocol in order to prevent some possible adverse events, maintain the quality of the current procedure, or even improve procedure outcomes.
However, a valid or representative model is vital for this purpose. The model in this paper has been validated by looking at three categories of indicators. Yet, the accountability of the model can still be improved by applying other validation methods or indicators as those data become available. The developed model can be considered a general model of the NLS procedure. It means that the model captures and involves many variations of the phenomenon of the NLS process, as well as its implementation in a number of different healthcare institutions and countries. It is useful in terms of the model generality and in demonstrating a way how the procedure can be studied. However, the applicability can be low for a specific clinical institution due to the healthcare institution itself is in fact part of the aspects that induce variations in the clinical procedure. Careful considerations of the assumptions used in this research are needed to properly apply the result to a specific healthcare institution.
Based on the outcome of this research, some suggestions for the NLS protocol can be proposed. The standard ventilation is shown to be influential in increasing the possibility of successful recovery with a higher maximum number of trials limit to pursue. On the contrary, the number of advanced inflation and ventilation should be kept minimum and alternative actions should be considered.
Further study on this procedure can be performed by considering other relevant factors that may cause variations in the performance of the NLS procedure. For example, the availability of resources, the individual skill of clinical staff, and the quality of teamwork during the NLS process are some important and useful aspects to be evaluated in further work.
Footnotes
Appendix A
CPN Functions.
| No. | Function |
|---|---|
| 1 | fun F4(Breath, Age, Terminate, Rand) =If(Breath!=Well){If(Terminate==””){if(Age == "Preterm"){1’(…,Breath = bernoulli(x1,Gasping,Well),…)}else{1 ’ (…,Breath = bernoulli(x2,Gasping,Well),…)}}else {if(Age == "Term"){1’(…,Breath = bernoulli(x3,Gasping,Well),…)}else{1’(…,Breath = bernoulli(x4,Gasping,Well),…)}} |
| 2 | fun F13(Terminate) = If (Terminate==End) then 1’(…) else empty; |
| 3 | fun F14NoHRChest,Age,IncO2,PrevTreat,Rand) =If (NoHRChest=="") {if(Age =="Preterm"){if (Rand <A) then1’(…,NoHRChest = Cat1,NumNoHRChestTreat++,…) else 1’(…,NoHRChest = Cat2,NumNoHRChestTreat++,…)}} else{if (Rand <B) then 1’(…,NoHRChest = Cat1,NumNoHRChestTreat++,…) else 1’(…,NoHRChest = Cat2,NumNoHRChestTreat++,…)}} |
| 4 | fun F15(NoHRChest) = If (NoHRChest == Cat1) then 1’(…) else empty; |
| 5 | fun F17(AdvCond) = If (AdvCond == Cat3) then 1’(…) else empty |
| 6 | fun F18(AdvCond) = If (AdvCond = Cat2) then 1’(…) else empty; |
| 7 | fun F19(AdvCond) = if(AdvCond == Cat1)1’(……)else empty |
| 8 | fun F23(AssRel) = If (AssRel == Cat2) then 1’(…) else empty; |
| 9 | fun F24 (AssRel) = If (AssRel == Cat1) then 1’(…,PrevTreat = AssRel, NumAssRelCat1++,…) else empty |
| 10 | fun F26(AdvCond, IncO2, Time, Rand, CardiacPro) =if(AdvCond =="Cat1"){if(IncO2 =="Cat1"){if(Time > 5 min){if(Rand1<Probability_Low_Saturation){if(CardiacPro == ""){if(Rand2 < Probability_PPDD_Less3){PPDD = "<3%"; CardiacPro = "No";}else {PPDD = ">3%"; CardiacPro = "Yes";}}else if(CardiacPro == "No"){PPDD = "<3%";}}else {PPDD = ">3%";}}{PPDD ="Not";}}else {PPDD = "Not";}}else{PPDD = "Not";}}else {PPDD = "Not";} |
Acknowledgements
I would like to acknowledge the support of Dr Thomas Smith (Blueskeye AI) for giving access to the in-field preliminary data of baby resuscitation video recording used in his research as well as sharing some knowledge about his work. Don Sharkey is supported by the National Institute of Health Research Children and Young People MedTech Co-operative. The views expressed are those of the author(s) and not necessarily those of the NHS, the NIHR, or of the Department of Health.
Declaration of conflicting interests
The author(s) declared no potential conflicts of interest with respect to the research, authorship, and/or publication of this article.
Funding
The author(s) disclosed receipt of the following financial support for the research, authorship, and/or publication of this article: Alfian Tan receives funding from the Indonesia Endowment Funds for Education (LPDP).