A common cause failure occurs when two or more elements fail due to a shared cause. The system with such failure often needs different repairmen and a multi-level maintenance strategy. The paper studies the reliability of k-out-of-n: G repairable systems considering common cause failure and multi-level maintenance strategy. The models with a multi-level maintenance strategy are established by considering the failure of all and partial components due to common cause failure. The reliability indices of the systems, such as availability and the mean time to first failure, are derived. An optimization maintenance model is established by minimizing the cost, and a three-level maintenance strategy is determined. Numerical examples are provided to illustrate the application. The results show that the multi-level maintenance strategy improves the system reliability and reduces the maintenance costs of systems with common cause failure.
The k-out-of-n: G system consists of n components, and the system works normally if and only if when there are at least k working components at the same time in the system.1–3 As this kind of system has been widely used in various fields, the research on the maintenance problems of the k-out-of-n: G system has become a hot topic in recent years. For instance, preventive maintenance,4 condition-based maintenance,5 the optimal maintenance policy which includes preventive maintenance and corrective maintenance,6 and the maintenance under D-policy.7 Krishnamoorthy et al.8 study a k-out-of-n: G system with repair under N-policy and give some reliability indices. Where the N-policy means that the repairman repairs until all the failed components in the system are repaired when the number of failed components in the system reaches N. It is extended by Fu et al.9 who study a machine-repair model with bi-level maintenance strategy by applying the supplementary variable method. In the bi-level maintenance strategy, different repairmen are assigned reasonably and effectively to repair the failed components by adjusting the thresholds. The results of Krishnamoorthy et al.8 and Fu et al.9 are extended by Wu et al.,10 who study the k-out-of-n: G repairable system with a bi-level maintenance strategy. Two types of repairmen are considered to achieve a reasonable allocation of human resources and save the maintenance cost in the system.
With the in-depth research for the k-out-of-n: G system, different failure modes of the components in the system are studied. Such as external shock, load sharing, and common cause failure (CCF). Xiao et al.11 study the optimal resource allocation for defending a k-out-of-n system against sequential intentional and unintentional impacts. Nezakati and Razmkhah12 study a load sharing k-out-of-n: F system that assumes the degradation of components causes dependent competing failures including soft and hard failures. Common cause failure is a failure of two or more components at the same time or at a comparatively short time interval caused by the same reason. From the safety assessment of the nuclear power plant to the aerospace system, it can be seen that CCF is one of the significant reasons for causing the system to fail in advance.13–16 For the research of the CCF in the system, there are mainly two methods: the explicit method and the implicit method.17 Based on the research results of these methods,18–20 Li et al.21 analyze the reliability of k-out-of-n: G systems subject to CCF by using the Markov process to comprehensively analyze the non-repairable and repairable systems. Markov models of non-repairable and repairable systems are established, and the calculation method of the system reliability when common cause failure occurs is studied. Various problems related to CCF are also researched. Coolen and Coolen-Maturi22 study the system reliability following CCF of components by non-parametric predictive inference. Cao et al.23 consider a selective maintenance optimization problem for systems subject to random CCF. For the Bayesian-based methods, Qiu and Ming24 study the system affected by the probabilistic common cause failure under different relationships. Li et al.25 study the common cause failure in a dynamic environment. In addition, the research based on CCF has many results in power systems, energy systems, and other fields.26–29
Among the abundant studies in the literature mentioned, the bi-level maintenance strategy is researched, and the common cause failure is also combined with other problems to discuss. However, the problem of how to reasonably allocate the repairmen with multiple levels has not been solved when considering common cause failure. For example, the maintenance work of multiple signal transmission towers in a certain place is considered. The repairmen with multiple levels are often assigned to repair the failed towers, and extreme weather and other effects will cause all the signal transmission towers to fail. Researching such problems has practical implications. This paper is devoted to analyzing and solving such problems. Therefore, the main contributions of the research are: (1) the bi-level maintenance strategy is extended to the multi-level maintenance strategy; (2) two models with the multi-level maintenance strategy considering the failure of all and partial components due to common cause failure are established, respectively; (3) reliability indices of the system are derived under the model; (4) the optimal multi-level maintenance strategy is determined by minimizing the maintenance cost of the system.
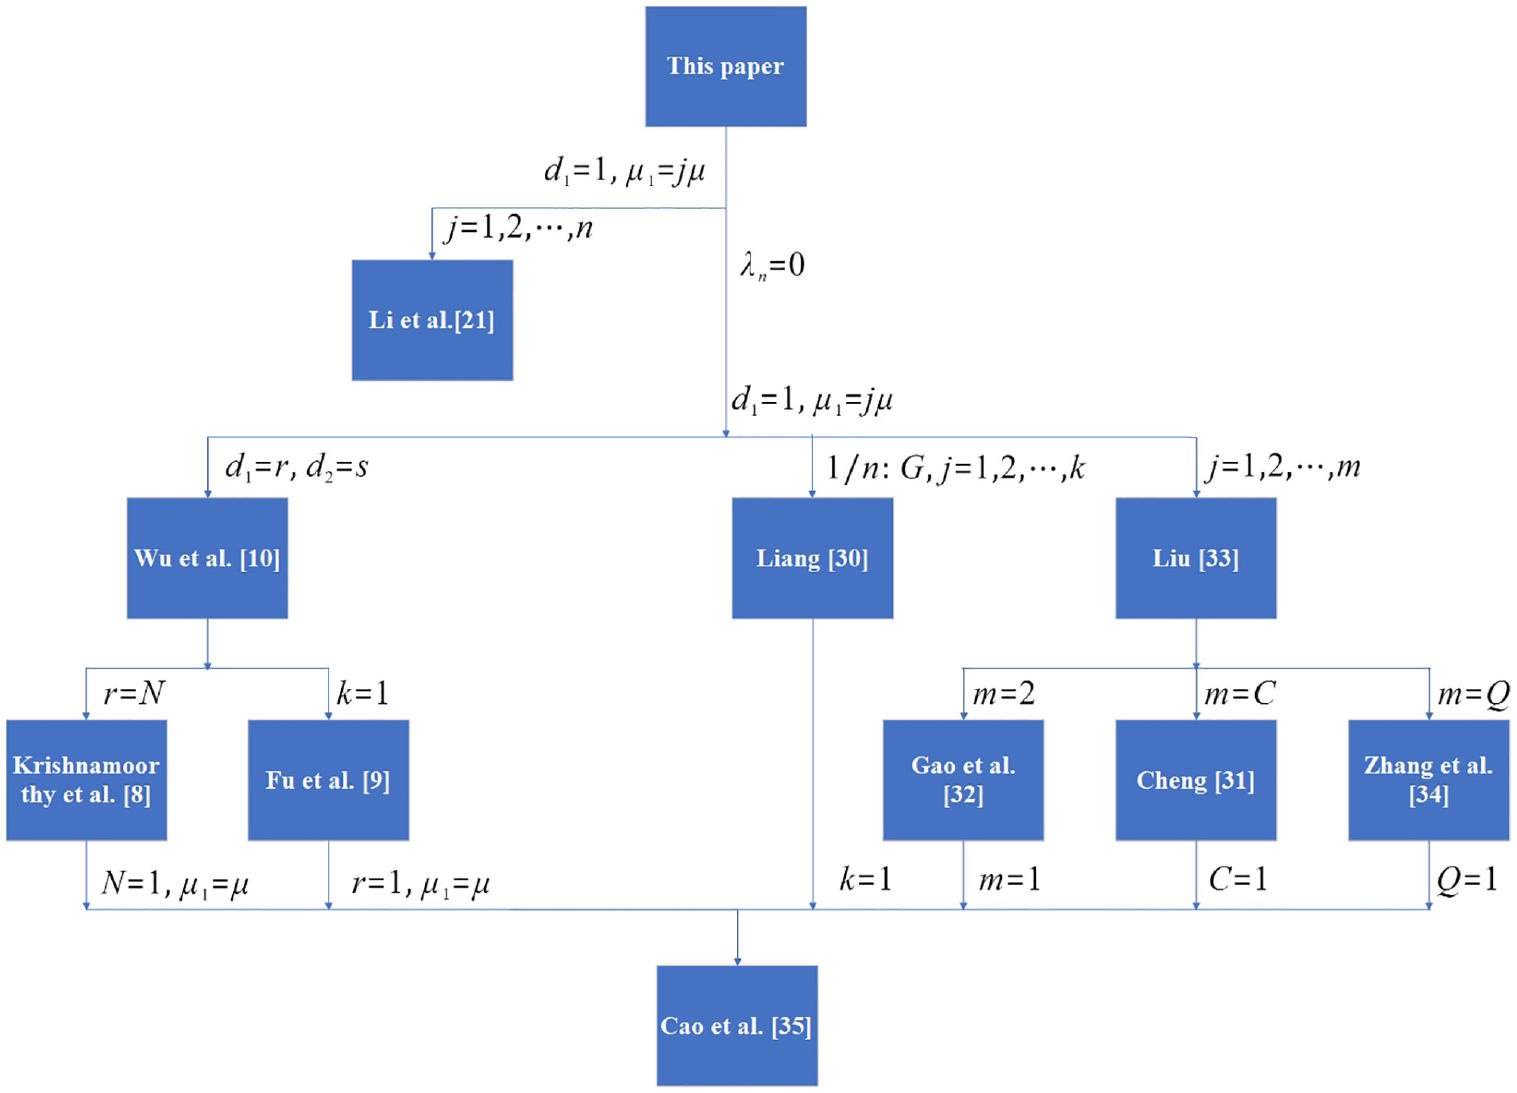
The relationships of the research achievements between this paper and other references are shown in Figure 1, in which j expresses the number of identical maintenance equipment (the explanation of more notations and variables involved is in Model assumption) . It is the model of the repairable system in Li et al.21 when the parameters of this paper are set as , . Then discuss , which means CCF isn’t considered. It is the model of Wu et al.10 when the parameters are set as . It is the model of Krishnamoorthy et al.8 when , and it is the model of Fu et al.9 when . The parameters are set as , it is the model of Liang30 when . And it is the model of Cheng31 when , then there are the models of Gao and Zheng32, Liu33, Zhang and Zheng34 when , and , respectively. In addition, the model of this paper degenerates into the classic k-out-of-n: G repairable system after adjusting the parameters, and Cao and Cheng35 use the Markov method to obtain the reliability indices of the system.
The relationships between research achievements in this paper and other references.
The rest of this paper is organized as follows. Two models with a multi-level maintenance strategy considering the failure of all and partial components in the system are established in Model description, respectively. The reliability indices of the system considering all the components fail due to common cause failure are derived. And the optimization model is established by minimizing the system maintenance cost in Reliability indices and maintenance optimization. The three-level maintenance strategy as a special case of the multi-level maintenance strategy is discussed in Special case. The proposed models are illustrated with numerical examples in Numerical examples. Finally, the conclusions and future research are discussed in Conclusions.
Model description
Model assumption
The model assumptions of the k-out-of-n: G repairable system considering common cause failure and multi-level maintenance strategy are as follows:
The system consists of n components, which will fail if and only if there are at least n − k + 1 failed components in the system. All the components are identical and independent exponential distributed. There are two states of the components in the system: working and failed.
The lifetime distribution of components follows the negative exponential distribution where The independent failure rate of the components is , and the failure rates of CCF between two or more components are , respectively, which means there are two or more components in the system that fail due to CCF. The maintenance ability of repairmen can be divided into l levels. The higher the level, the better the maintenance ability. And the corresponding maintenance time is assumed to follow the negative exponential distribution , where , , .
When the working components fail, the repairmen will be assigned to repair the failed components according to the multi-level maintenance strategy. The multi-level maintenance strategy is expressed as where If the number of failed components is less than the threshold , the repairmen will not be assigned to repair the failed components. If the number of failed components reaches , the level 1 repairman will be assigned to repair immediately. The level 1 repairman will withdraw from the system when the level 1 repairman has completed the maintenance work and all the failed components have been repaired. If the maintenance work of the level 1 repairman is not completed and the number of failed components increases to , the level 2 repairman will be assigned to repair. The level 2 repairman will withdraw from the system when the level 2 repairman’ s maintenance work is completed and the number of failed components is less than . Then the level 1 repairman continues to repair until all the failed components are repaired. And the level 2 repairman will replace the level 1 repairman to repair if the number of failed components reaches again during this period. And so on, if the number of failed components increases to , the level repairman will be assigned to repair. The system is still operating when repairmen with the above levels are assigned to repair. However, the system fails in the following two situations: ① the number of failed components reaches n − k + 1 due to independent failure rate, and other components no longer fail; ② the number of failed components reaches or exceeds n − k + 1 due to CCF, and other components no longer fail. During the operation period of the system, if the number of failed components due to CCF exceeds the level l repairman will be assigned to repair until the number of failed components is not exceeding . Assume that the maintenance of all levels for the failed components is perfect.
The random variables involved in the system are independent of each other. For instance, the independent failure rate of the components, the failure rate of CCF between the two or more components, and the maintenance rate of repairmen at different levels.
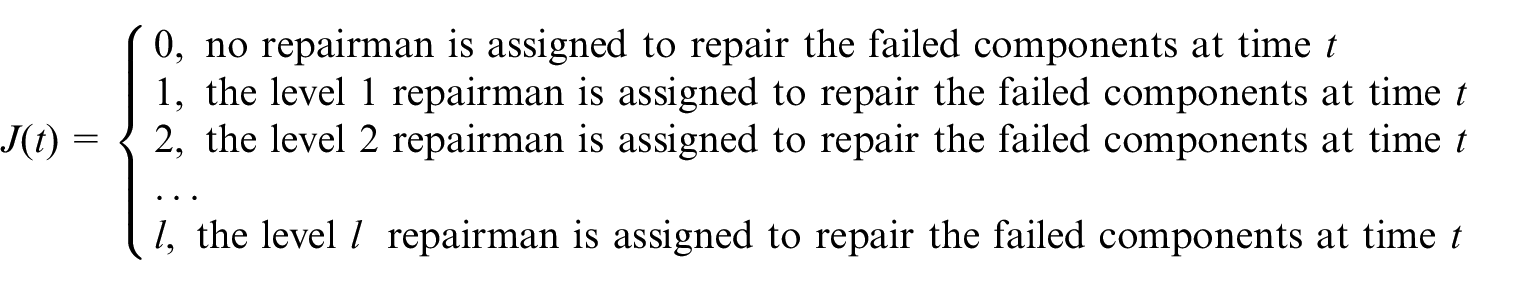
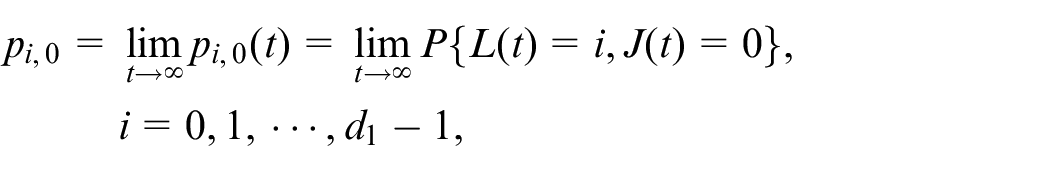
Assume expresses that there are i failed components in the system at time t (including the components in repairing), where And expresses that the repairman from different levels will be assigned to repair the failed components at time t, which can be expressed by
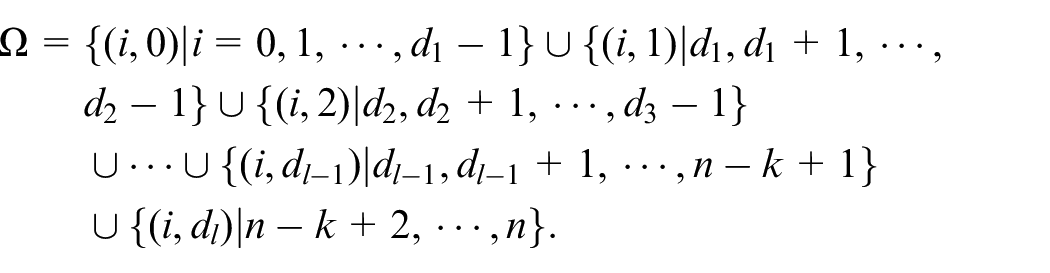
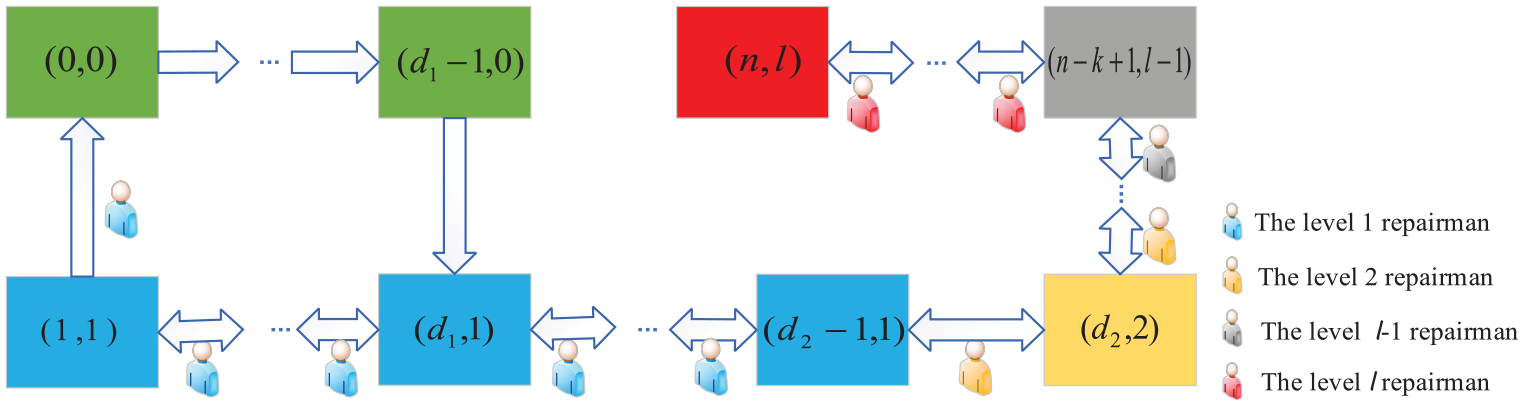
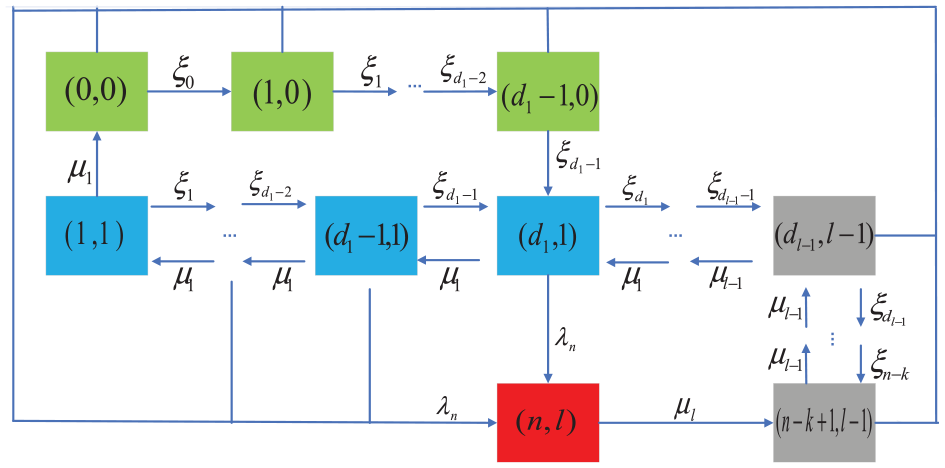
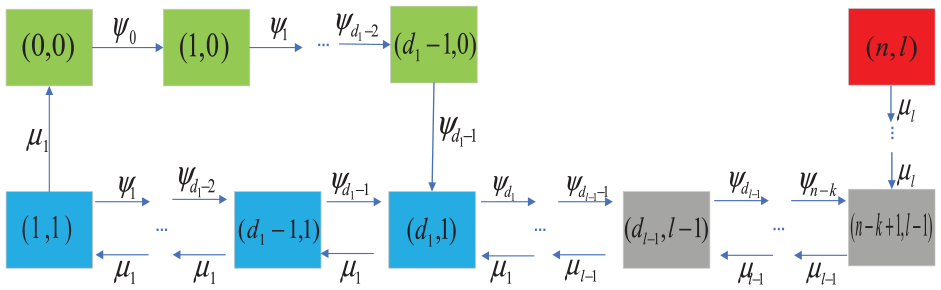
The maintenance process of the system with the multi-level maintenance strategy is shown in Figure 2. Repairmen aren’t assigned to repair if the number of failed components is less than the threshold ; the level 1 repairman is assigned to repair if the number of failed components exceeds the threshold ; the level 2 repairman is assigned to repair if the number of failed components exceeds the threshold ; and so on. The level repairman is assigned to repair if the number of failed components exceeds the threshold due to CCF. And the state space of the stochastic process is expressed according to the model description as follows:
The system with multi-level maintenance strategy.
System state analysis when all the components fail
When all the components fail due to CCF, it should not only consider the independent failure of the components, but also the CCF of all the components. Therefore, the values taken of are included in . The reason for the number of failed components is is that the components will fail due to the independent failure rate. That is, The reason for the number of failed components is that all the components may fail due to CCF. That is, It can be found that the system works normally when i is and the system fails when i is . The independent failure rate of the components is and the failure rate of CCF which causes all the components to fail is The state transition of the system is shown in Figure 3, where . Figure 3 has the same principle as Figure 2, and the only difference here is that considers assigning the level repairman to repair when all components fail due to CCF.
The state transition of the system for all the components due to CCF.
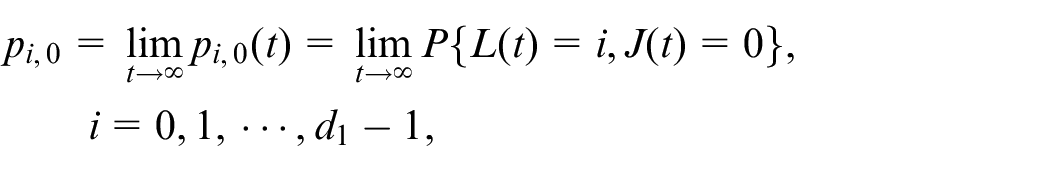
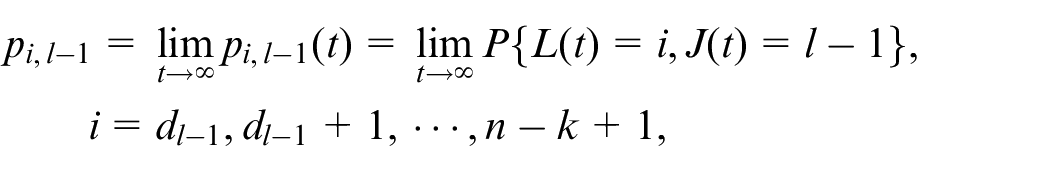
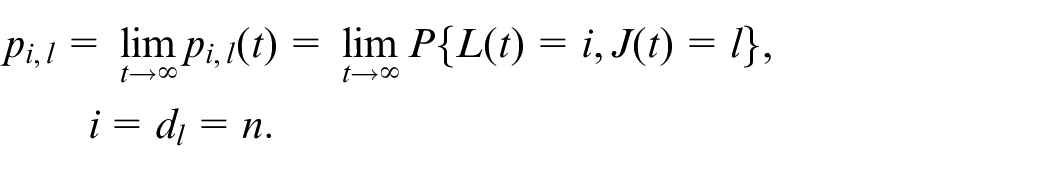
The steady-state probabilities of the system are expressed as follows:
…
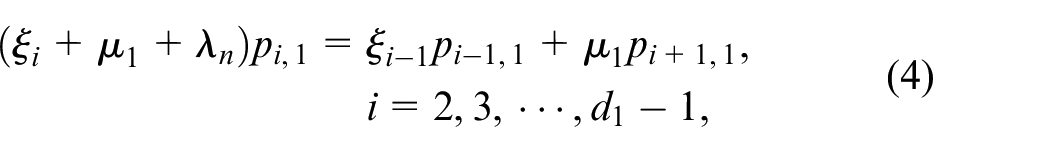
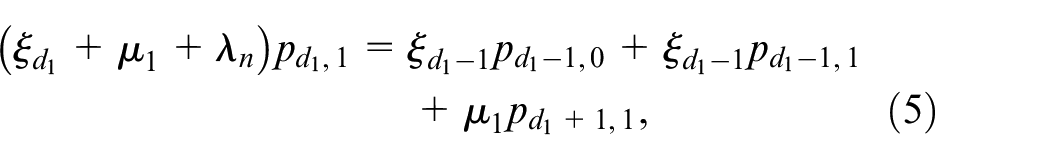
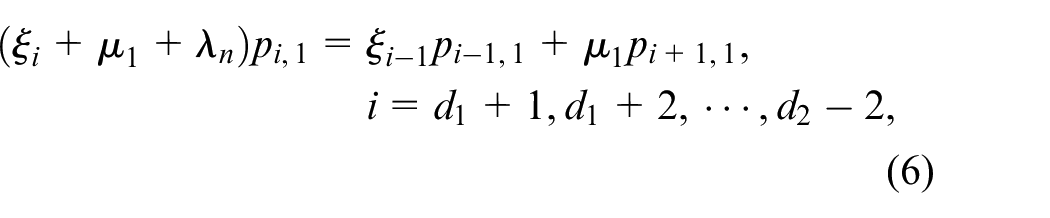
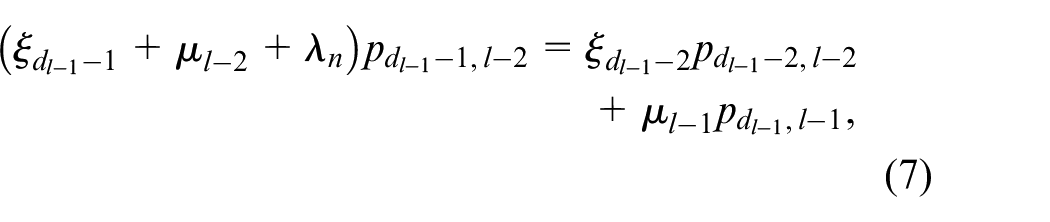
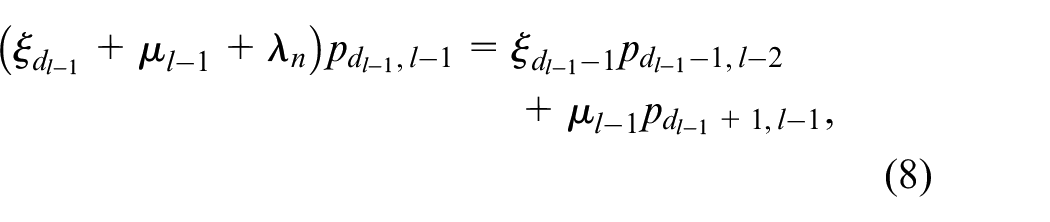
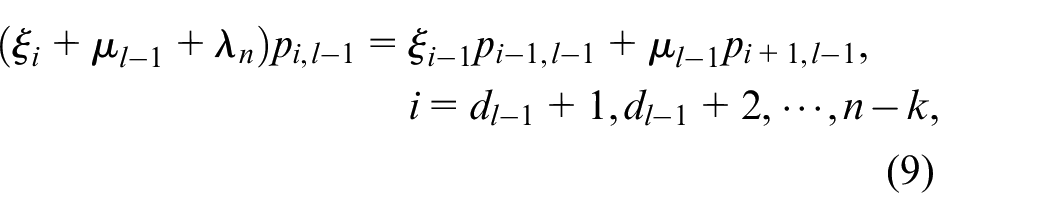
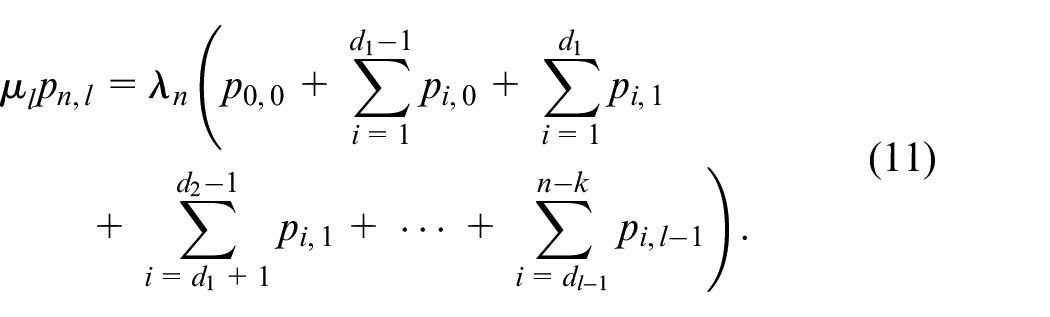
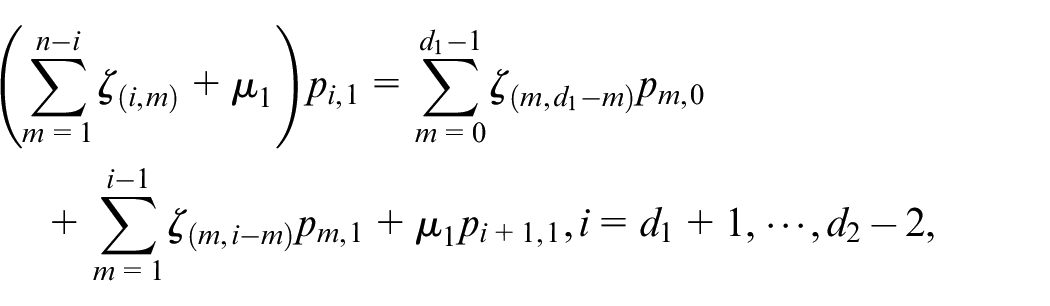
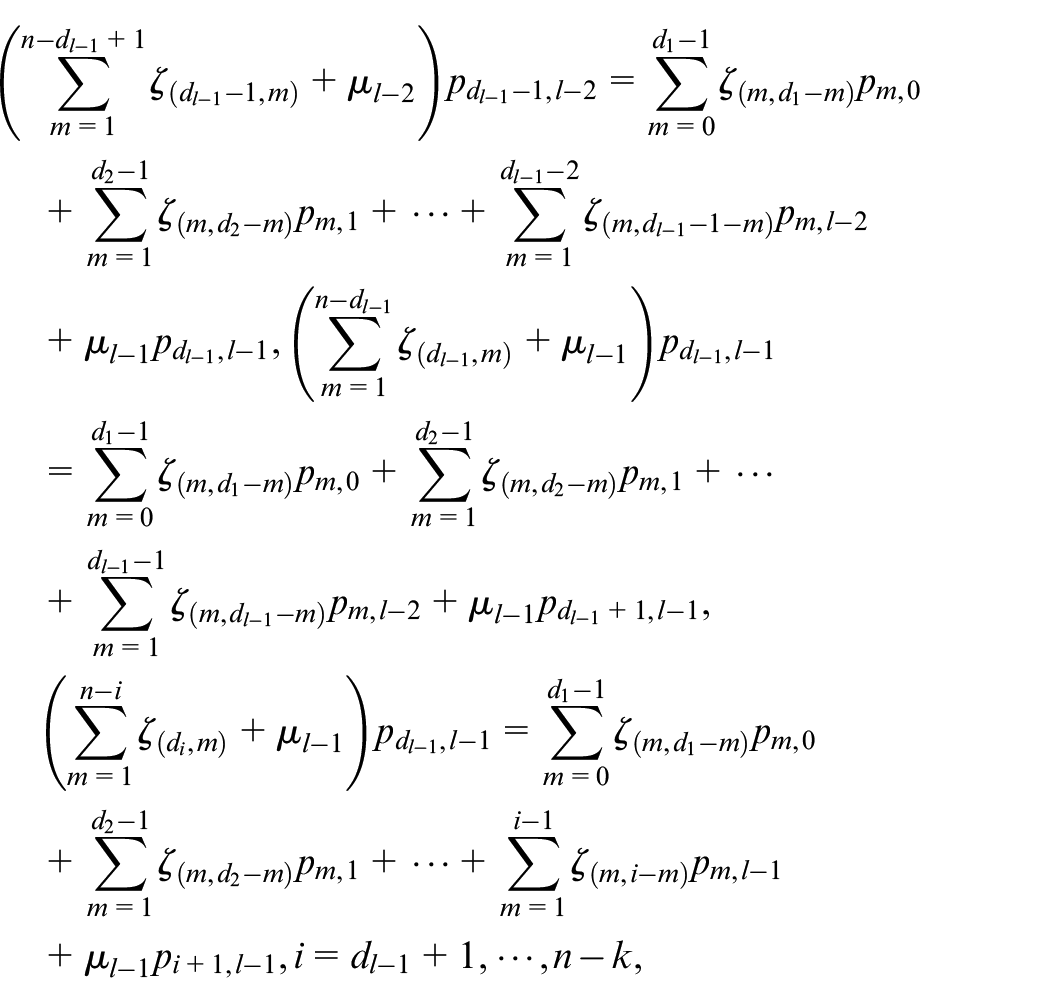
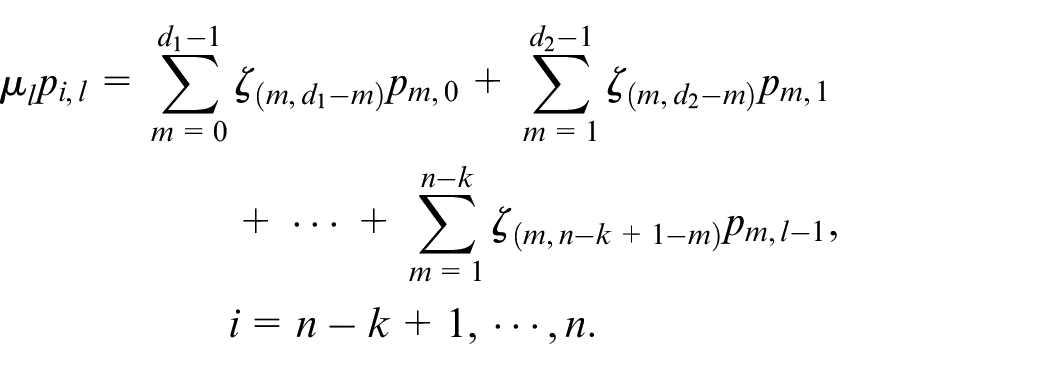
According to the theory of the Markov process and the figure of state transition, the steady-state probabilities of the system satisfy the following equations:
…
The analysis steps of the model are as follows:
Calculate from each equation as an equation with ;
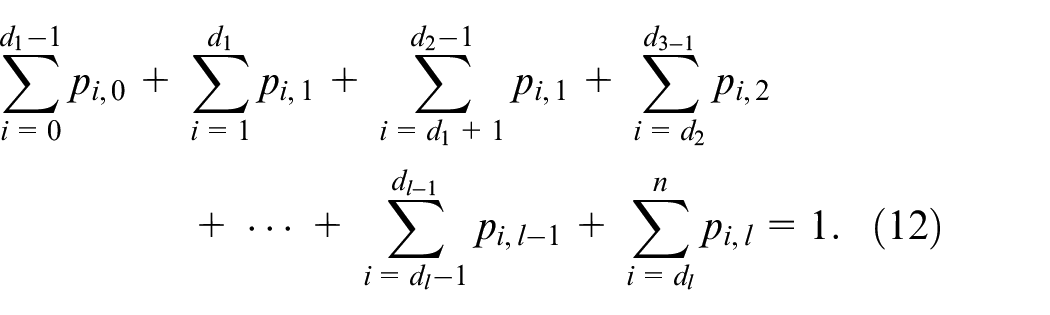
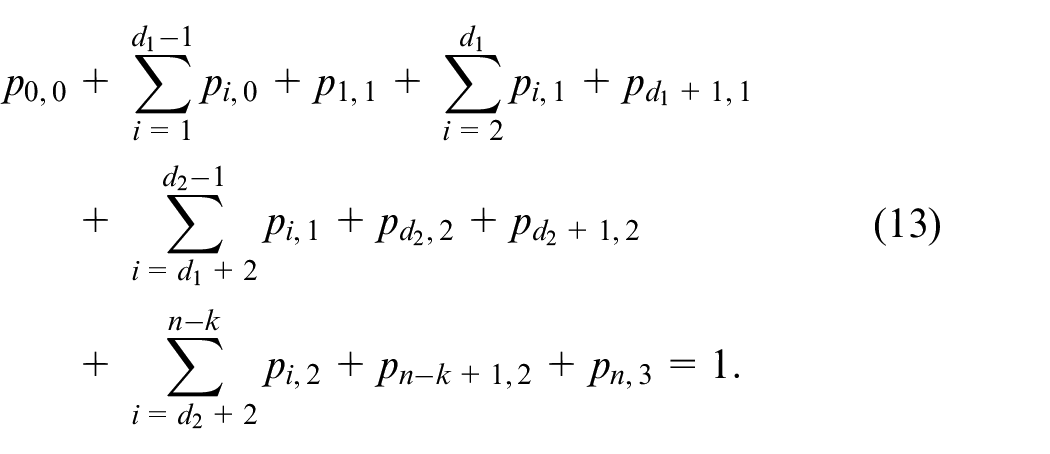
Obtain and place it in of (1) according to the regularity condition, that is, equation (12);
(3) Use the solved to derive the reliability indices of the system.
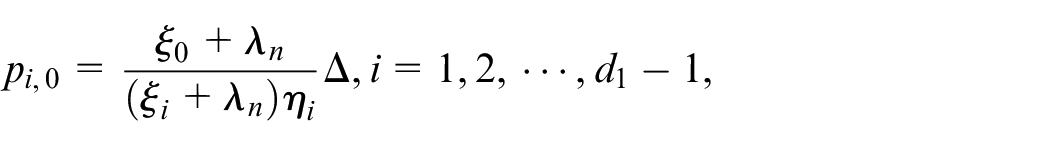
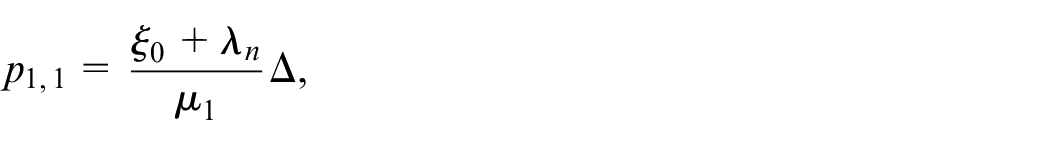
Assume , steady-state probabilities of the system are expressed as:
…
where , when
System state analysis when partial components fail
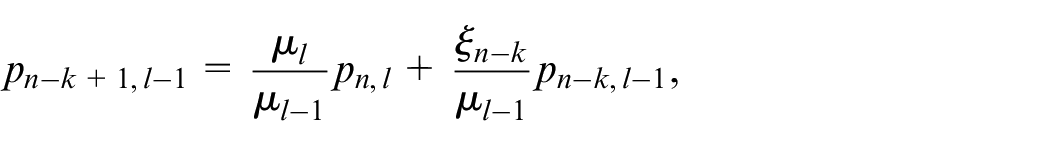
When partial components fail due to CCF, the possible states of the components are When the number of failed components is , considering it will increase to due to independent failure and partial failure due to CCF of the components. The transition probability from to is , where the is the combination number, that is, . “!” represents the factorial function, for instance, . The transition probability from to includes these parts as follows: the transition probability of the independent failure of components is which means there is a component of working components that fails due to independent failure, that is, the number of failed components is from to ; the transition probability of both components failing due to CCF is , which means there is a component of working components failing when the component (and the working component belongs to a group of CCF) is failed; it is easy to know that the transition probability of i +1 components is .21 Similarly, the transition probability of the number of failed components increasing to can also be derived. To facilitate discussion, the figure of the one-step transition in the system is shown in Figure 4. is the transition probability of the number of failed components from i to i +1 in the system, where Figure 4 has the same principle as Figure 2, and the only difference here is considering assigning the level repairman to repair when the number of failed components exceeds the threshold due to CCF.
The state transition of the system for partial components due to CCF.
The steady-state probabilities of the system are as follows:
…
According to the theory of the Markov process and the figure of state transition, the steady-state probabilities of the system satisfy the following equations. Assume that
…
The solutions for the steady-state probabilities of the system are similar to the procedure in System state analysis when all the components fail, so it is no longer discussed.
Reliability indices and maintenance optimization
Reliability indices
When all the components fail due to CCF, the analysis of reliability indices is as follows.
Mean time to first failure
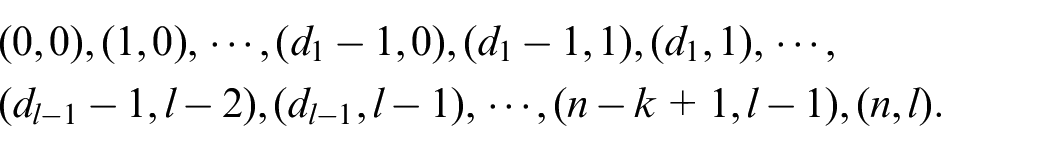
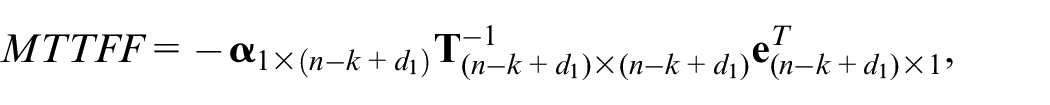
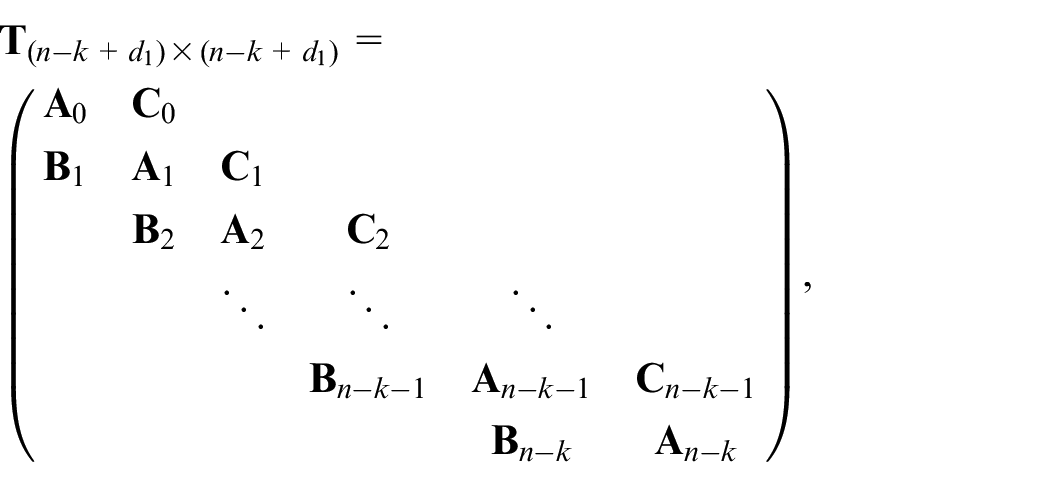
Based on the results of Tian and Zhang36 and Wu et al.,10 there are states of the system which ranked as:
Assume that the failure state of the system is the absorption state of the process,
where the initial probability vector is , The vector expresses the transpose of the vector . And the vector expresses the element of the corresponding position of state is 1 and the remaining positions are 0 when the initial state of the system is . For instance, when the initial state of the system is (2, 0).
where
(2) System availability
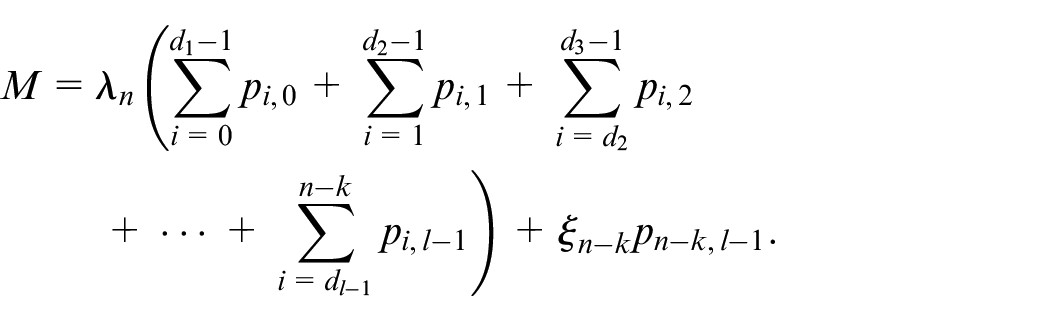
(3) Failure frequency of the system
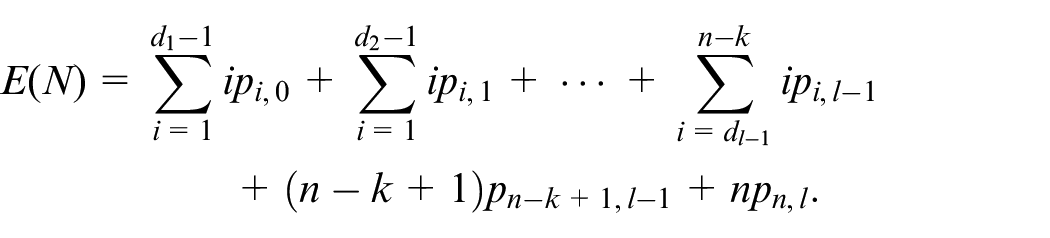
(4) Average number of failed components in the system
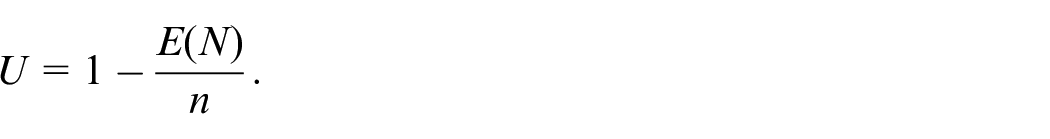
(5) Utilization rate of components in the system
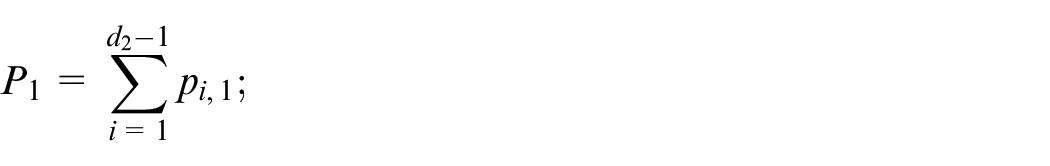
(6) Busy probabilities of the repairmen at all levels repair the failed components
Busy probability of the level 1 repairman
…
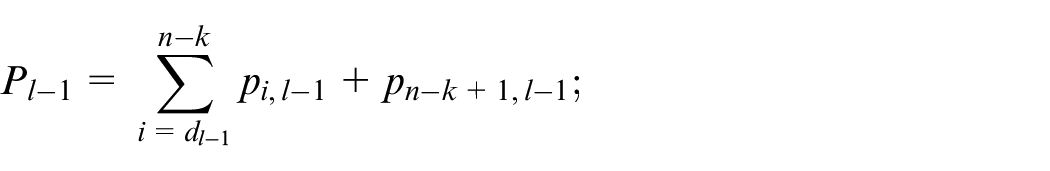
Busy probability of the level l-1 repairman
Busy probability of the level l repairman
Other reliability indices such as mean up time , mean down time can also be derived, so it is no longer discussed.
Optimization of maintenance strategy
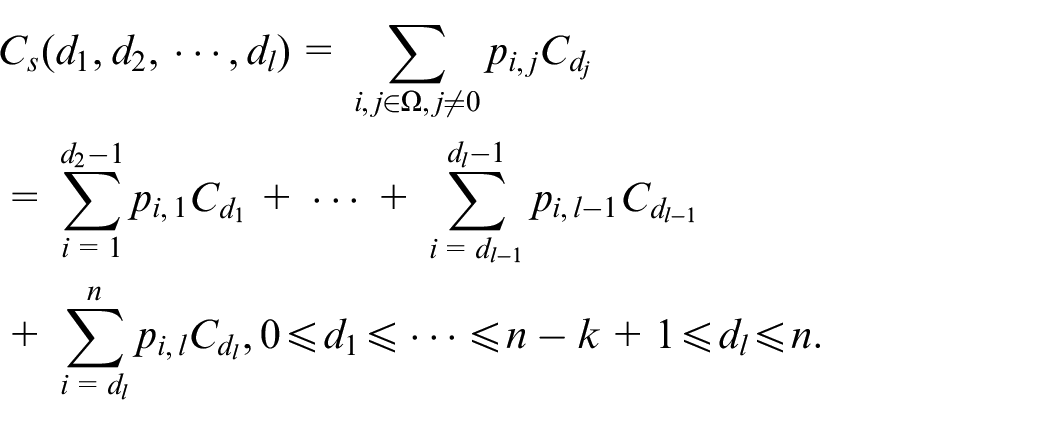
The purpose of this section is to minimize the system maintenance cost by optimizing the maintenance threshold , where . Assume that expresses the expected maintenance cost of the system, and expresses the expected maintenance cost per component of each level in the system. Since the levels of repairmen are various, assume without losing generality that it is expressed as:
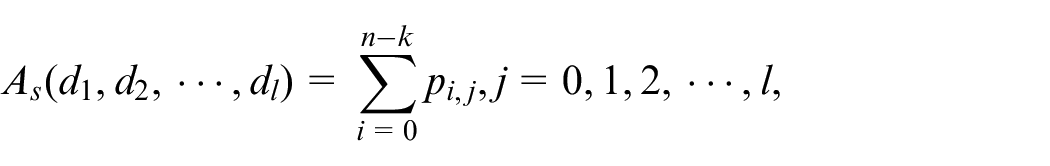
Since system availability is an important standard for evaluating the proposed maintenance strategy, this paper takes system availability as a constraint. The system availability is expressed as:
where, the state of the system may be , expresses the number of failed components in the system, and expresses the level of the repairman, where means there are no repairmen in the system. Therefore, the system availability is the sum of the availability of the system in all states.
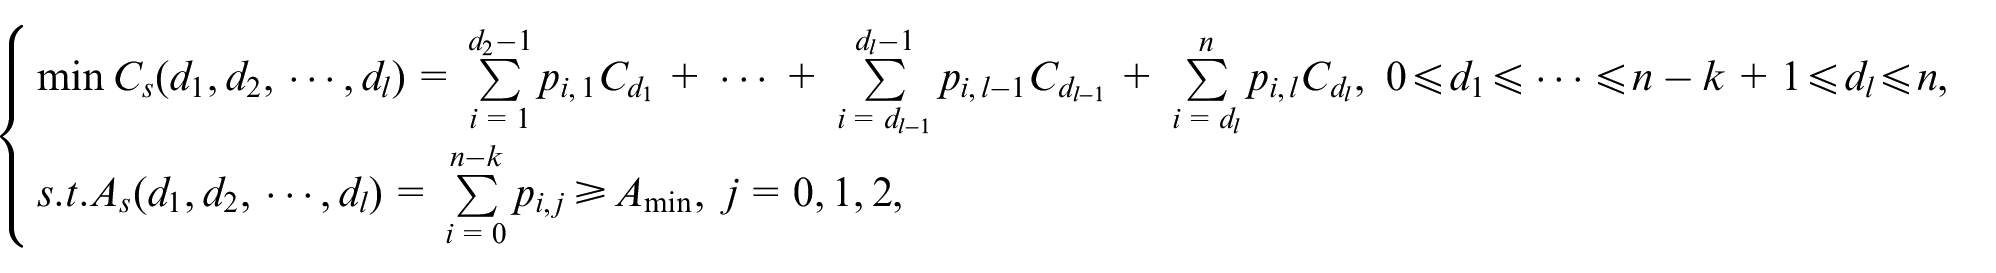
To minimize the system maintenance cost as the goal and take the system availability as the constraint, assume the minimum system availability is and the optimization model of the system is:
The optimization model described above can be reasonably adjusted according to the actual conditions. Because the number of failed components of the system, the maintenance time of the repairmen, and the expected maintenance cost per component of each level are considered in the system expected maintenance cost. But the different ways of adjusting the levels will affect the optimization of the system expected maintenance cost. Considering that the maintenance threshold of a level repairman cannot be adjusted for a while due to environmental factors, social factors, and other factors. For instance, the adjustment ways of a system with a three-level maintenance strategy are as follows: (1) adjust the three levels simultaneously; (2) one level is fixed and the other two levels are adjusted; (3) two levels are fixed and the other level is adjusted. Evidently, case (1) is the optimal solution of the above model, and cases (2) and (3) are the optimal solutions under additional conditions. The specific method should be adopted according to the actual conditions.
Special case
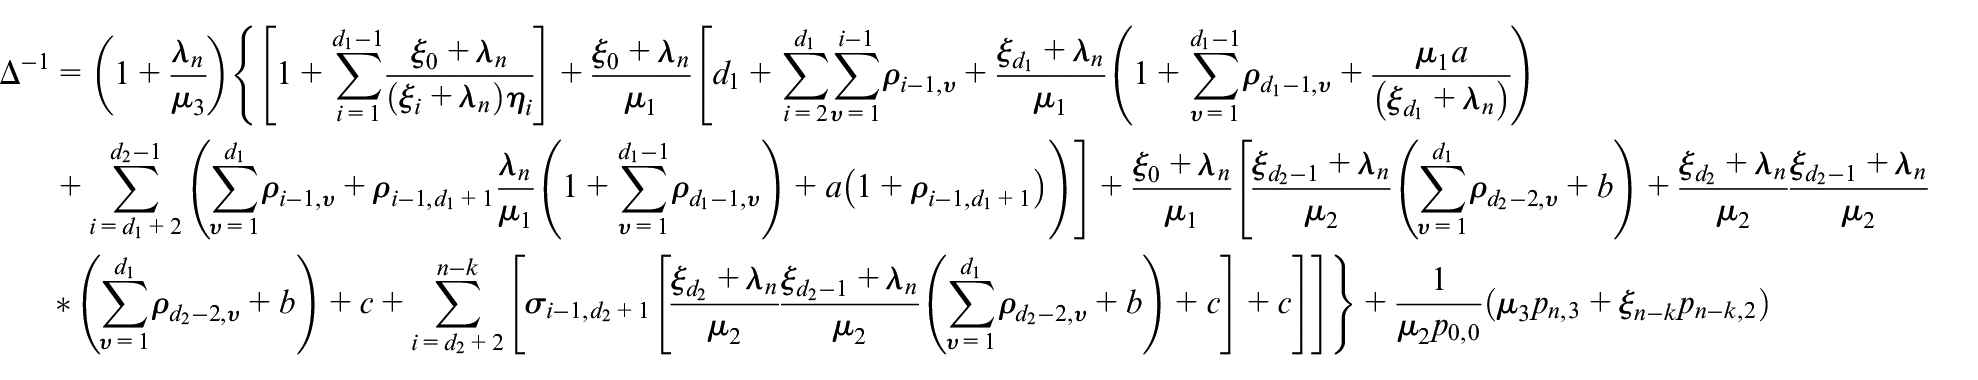
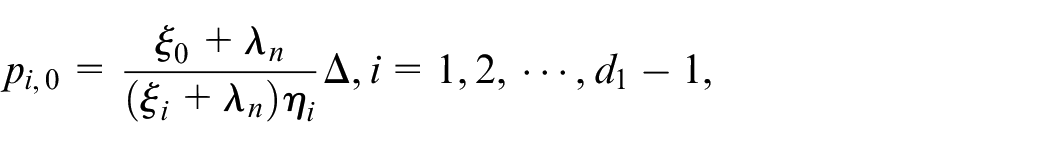
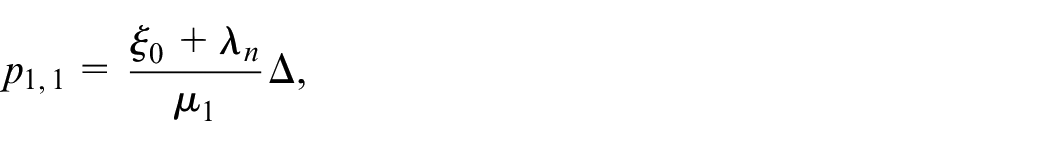
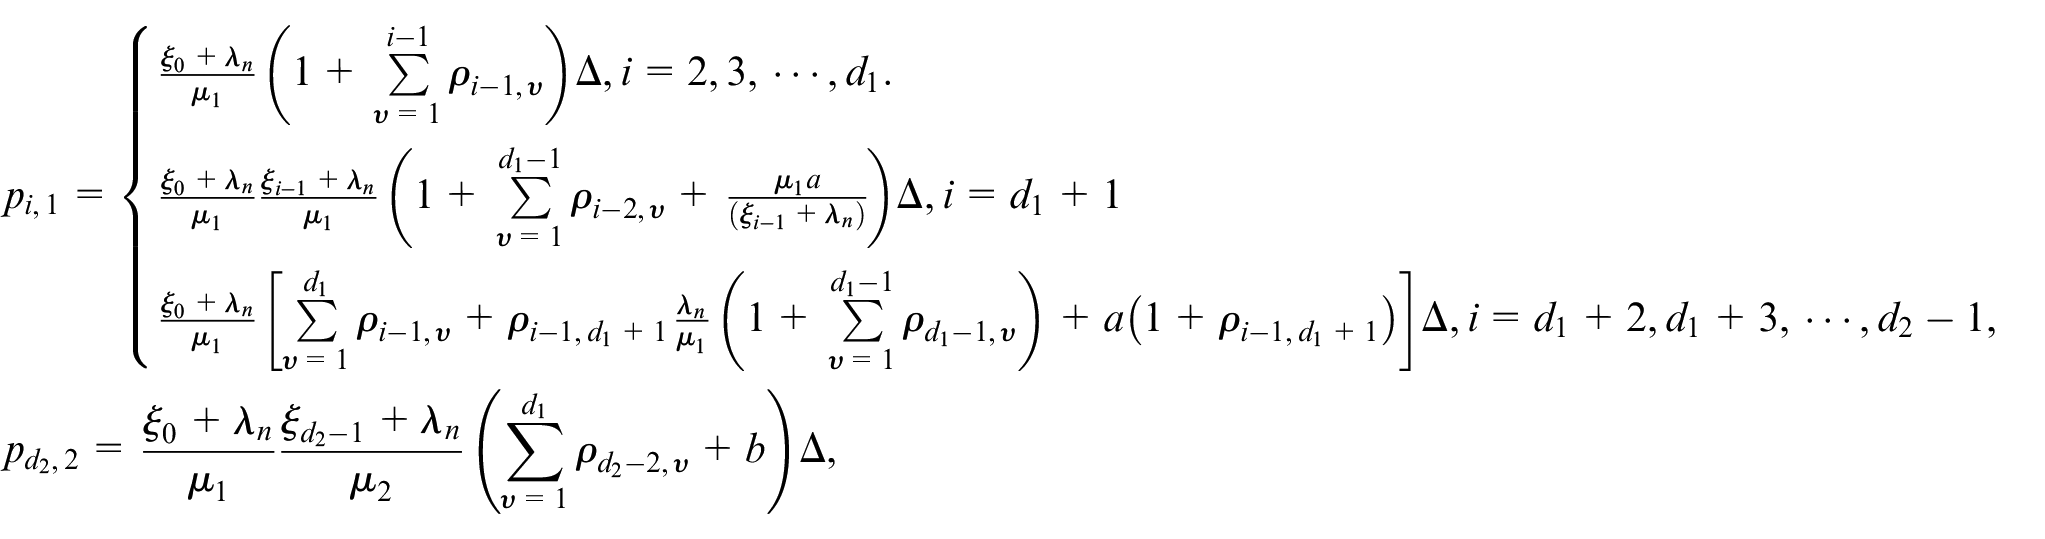
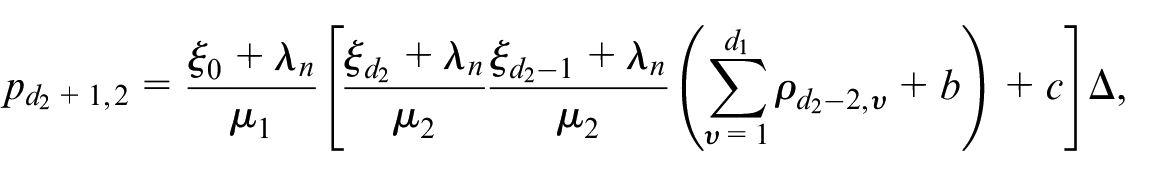
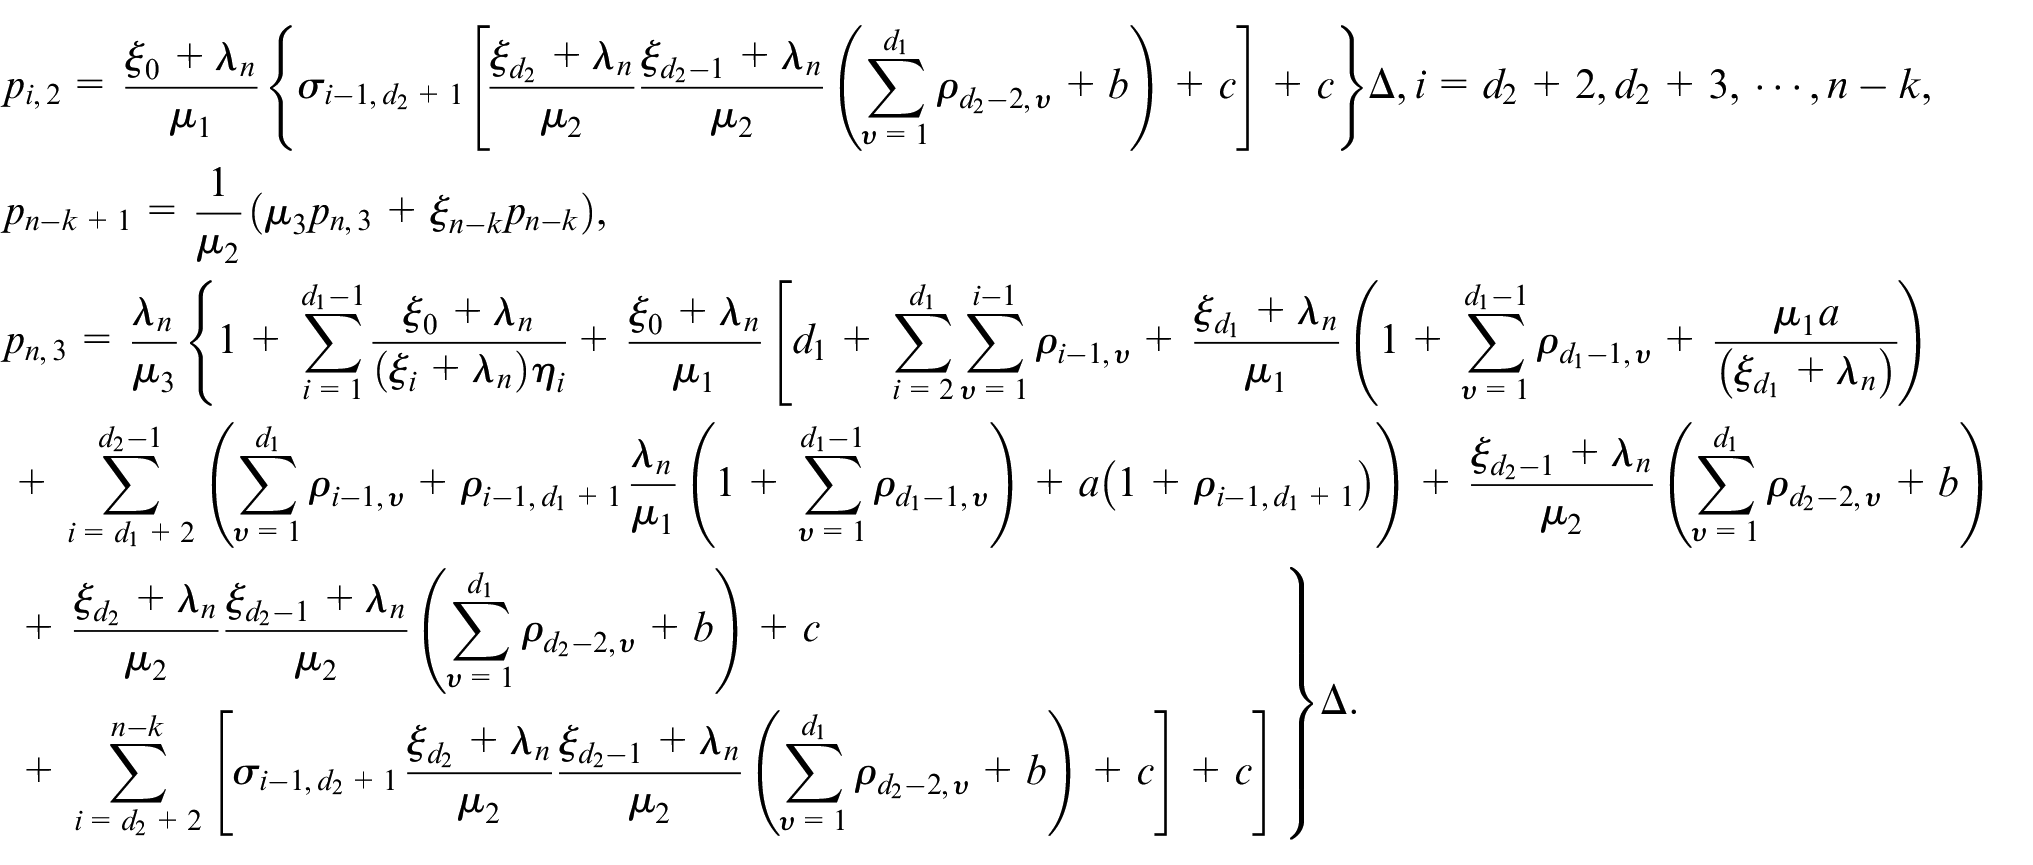
To facilitate discussion, the system with a three-level maintenance strategy will be discussed as an example. Based on the results in System state analysis when all the components fail, all the components that fail due to CCF are considered, and the expressions of steady-state probabilities are derived. The steady-state probabilities mentioned are
According to the regularity condition, that is, equation (12),
Take all the expressions above into equation (13) and assume ,
In summary, the steady-state probabilities of the system are:
Numerical examples
This section discusses the system considering common cause failure and the three-level repair strategy to illustrate the application of the proposed model.
Assume that the two signal transmission towers are installed to meet the communication needs in a certain area. The managers are determined to install 10 towers of signal transmission to meet the needs of different customers, that is, the communication transmission system in this area is a 2-out-of-10:G system. Communication in the area is basically not affected if the number of failed towers is less than 3. Otherwise, the level 1 repairman will be assigned to repair the failed towers. If the number of failed towers continues to increase to 6, communication will be disrupted and the level 2 repairman will be assigned to repair promptly. During this period, the level 3 repairman will be assigned to repair if all the towers may fail due to extreme weather. The lifetime of the towers follows the negative exponential distribution with parameter , and the maintenance time for the failed towers follows the negative exponential distribution with parameters respectively. Set parameters as The system expected maintenance costs per component of three levels are And the relevant results are retained to 10 bits after the decimal point.
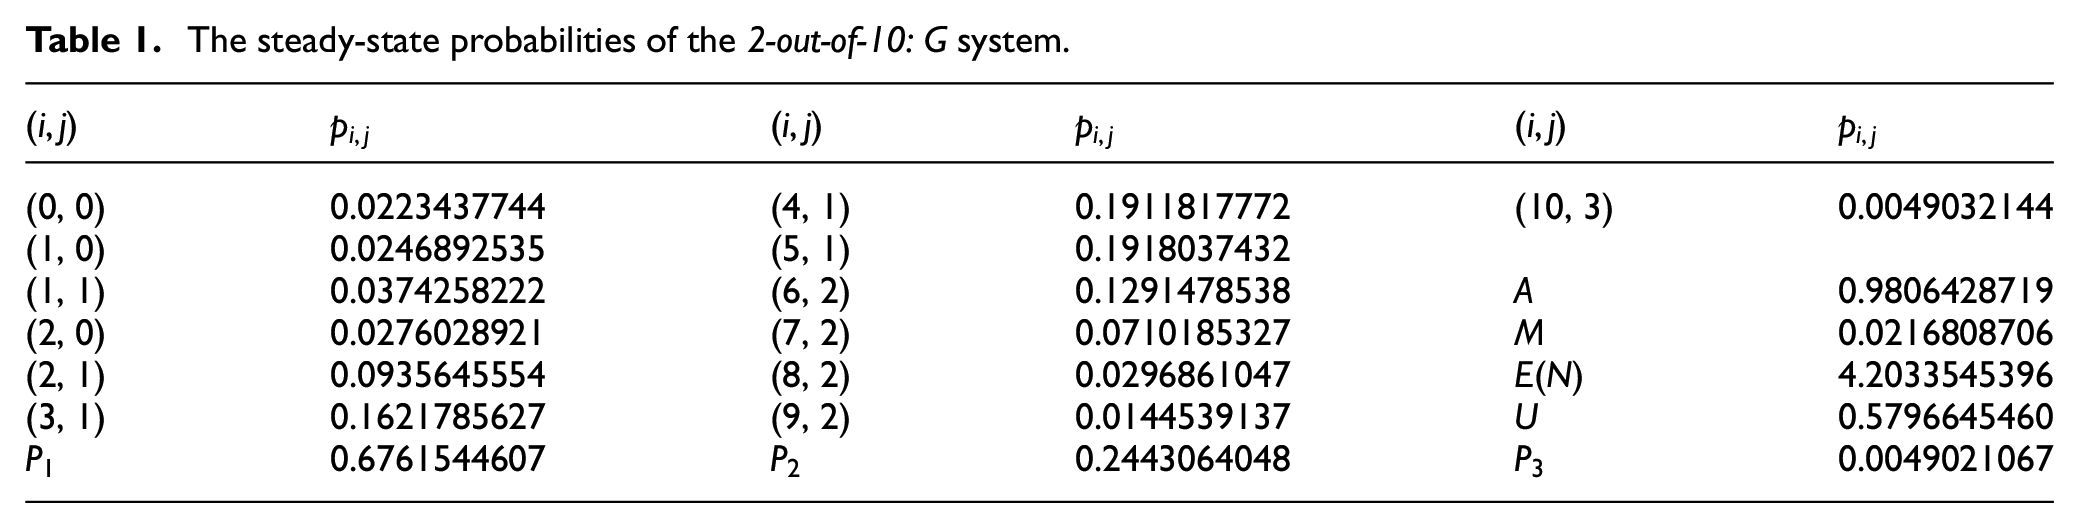
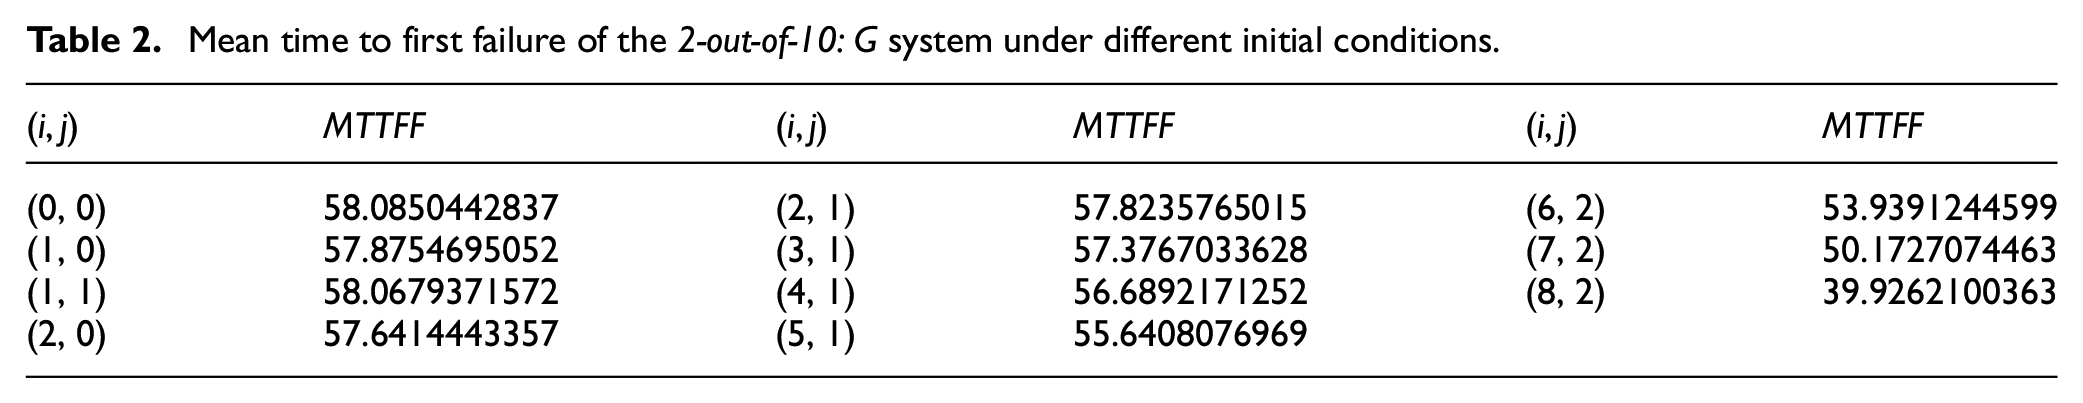
Numerical results of the steady-state probabilities, the relevant reliability indices, and the mean time to first failure under different initial conditions of the system are presented in Tables 1 and 2, respectively. As is shown in Table 1, the steady-state probabilities of the system gradually increase before the state (5, 1), and gradually decreases after the state (5, 1). Therefore, the probability of the system in the state is the largest, then the busy probability of the level 1 repairman is the largest, followed by the level 2 repairman, and finally the level 3 repairman. As is shown in Table 2, the more components of the system fail at the initial time, the smaller the value of MTTFF. This is because the system availability decreases while the failure frequency of the system increases as the number of failed components in the system increases. As a result, the possibility of the system failing increases, and the value of MTTFF decreases, which is in line with the actual case.
The steady-state probabilities of the 2-out-of-10: G system.
(0, 0)
0.0223437744
(4, 1)
0.1911817772
(10, 3)
0.0049032144
(1, 0)
0.0246892535
(5, 1)
0.1918037432
(1, 1)
0.0374258222
(6, 2)
0.1291478538
0.9806428719
(2, 0)
0.0276028921
(7, 2)
0.0710185327
0.0216808706
(2, 1)
0.0935645554
(8, 2)
0.0296861047
4.2033545396
(3, 1)
0.1621785627
(9, 2)
0.0144539137
U
0.5796645460
0.6761544607
0.2443064048
0.0049021067
Mean time to first failure of the 2-out-of-10: G system under different initial conditions.
(0, 0)
58.0850442837
(2, 1)
57.8235765015
(6, 2)
53.9391244599
(1, 0)
57.8754695052
(3, 1)
57.3767033628
(7, 2)
50.1727074463
(1, 1)
58.0679371572
(4, 1)
56.6892171252
(8, 2)
39.9262100363
(2, 0)
57.6414443357
(5, 1)
55.6408076969
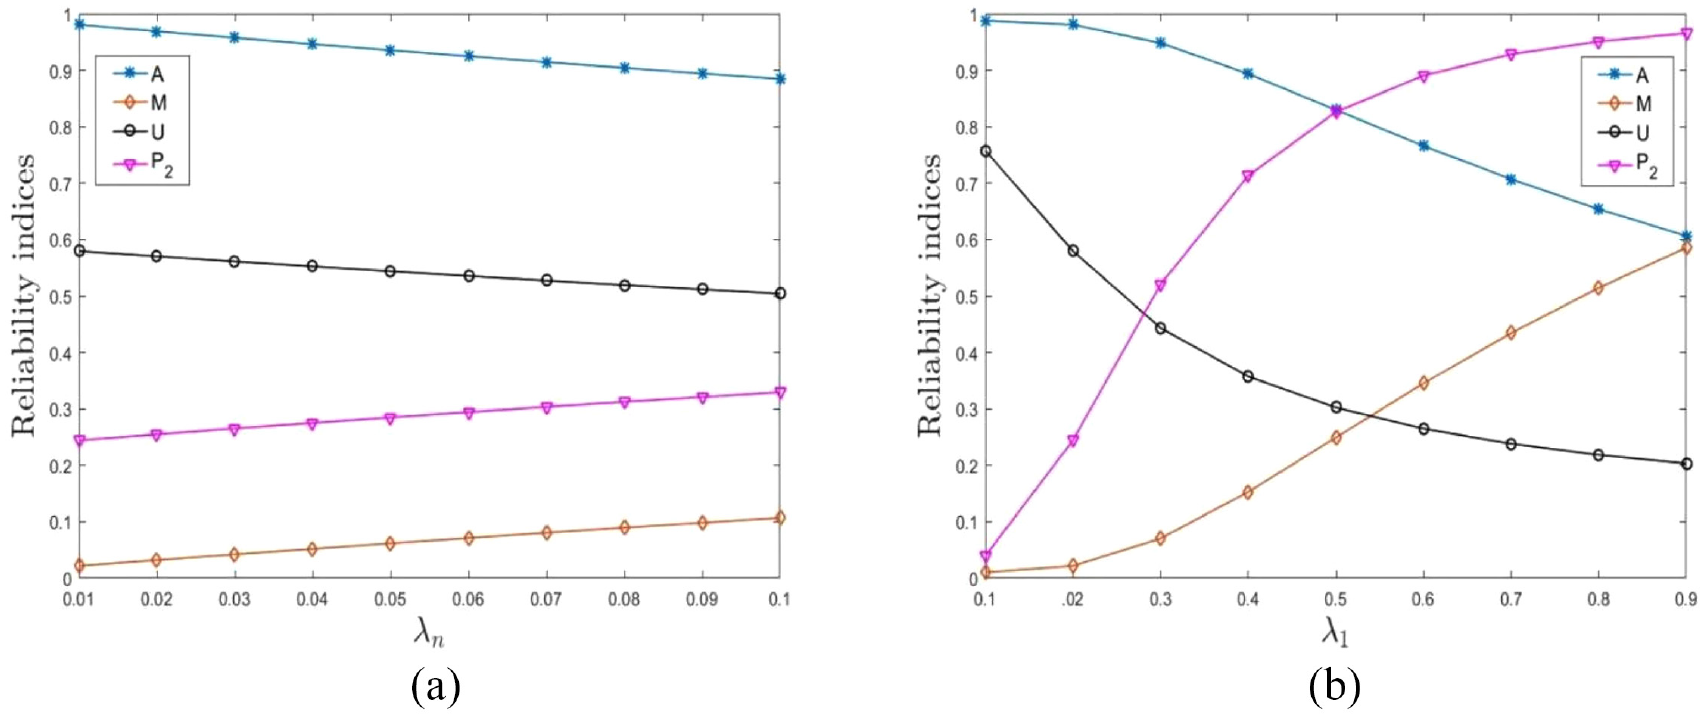
Firstly, to illustrate the impact on the system reliability due to the failure rate of CCF and independent failure rate, the trend of steady-state availability (A), failure frequency of steady-state (M), the utilization rate of the components (U), and busy probability of the level 2 repairman () in the system are shown in Figure 5. As can be seen from Figure 5(a), with the increases, that is, when the components are more likely to fail due to CCF. The steady-state availability and the utilization rate of components gradually decrease, while the failure frequency of the steady-state and the busy probability of the level 2 repairman gradually increase. The trends under different independent failure rates of components () in A, M, U, and are shown in Figure 5(b). As can be seen from the figure, with the increases, that is, when the components are more likely to independently fail. The steady-state availability and utilization rate of components gradually decrease, while the failure frequency of steady-state and the busy probability of the level 2 repairman gradually increase. The trends of these indices in (a) and (b) are the roughly same, this is because the steady-state availability of the system and the utilization rate of the components gradually decrease as the number of failed components in the system increases, so the busy probability of the level 2 repairman increases. However, the magnitude of variation in the indices of the system in (a) is significantly slower compared to (b). This is because the values of is smaller compared to , which means the greater the failure rate of the components, the more obvious the magnitude of variation in the indices of the system.
The trend of system reliability indices under different conditions: (a) system reliability indices under different and (b) system reliability indices under different .
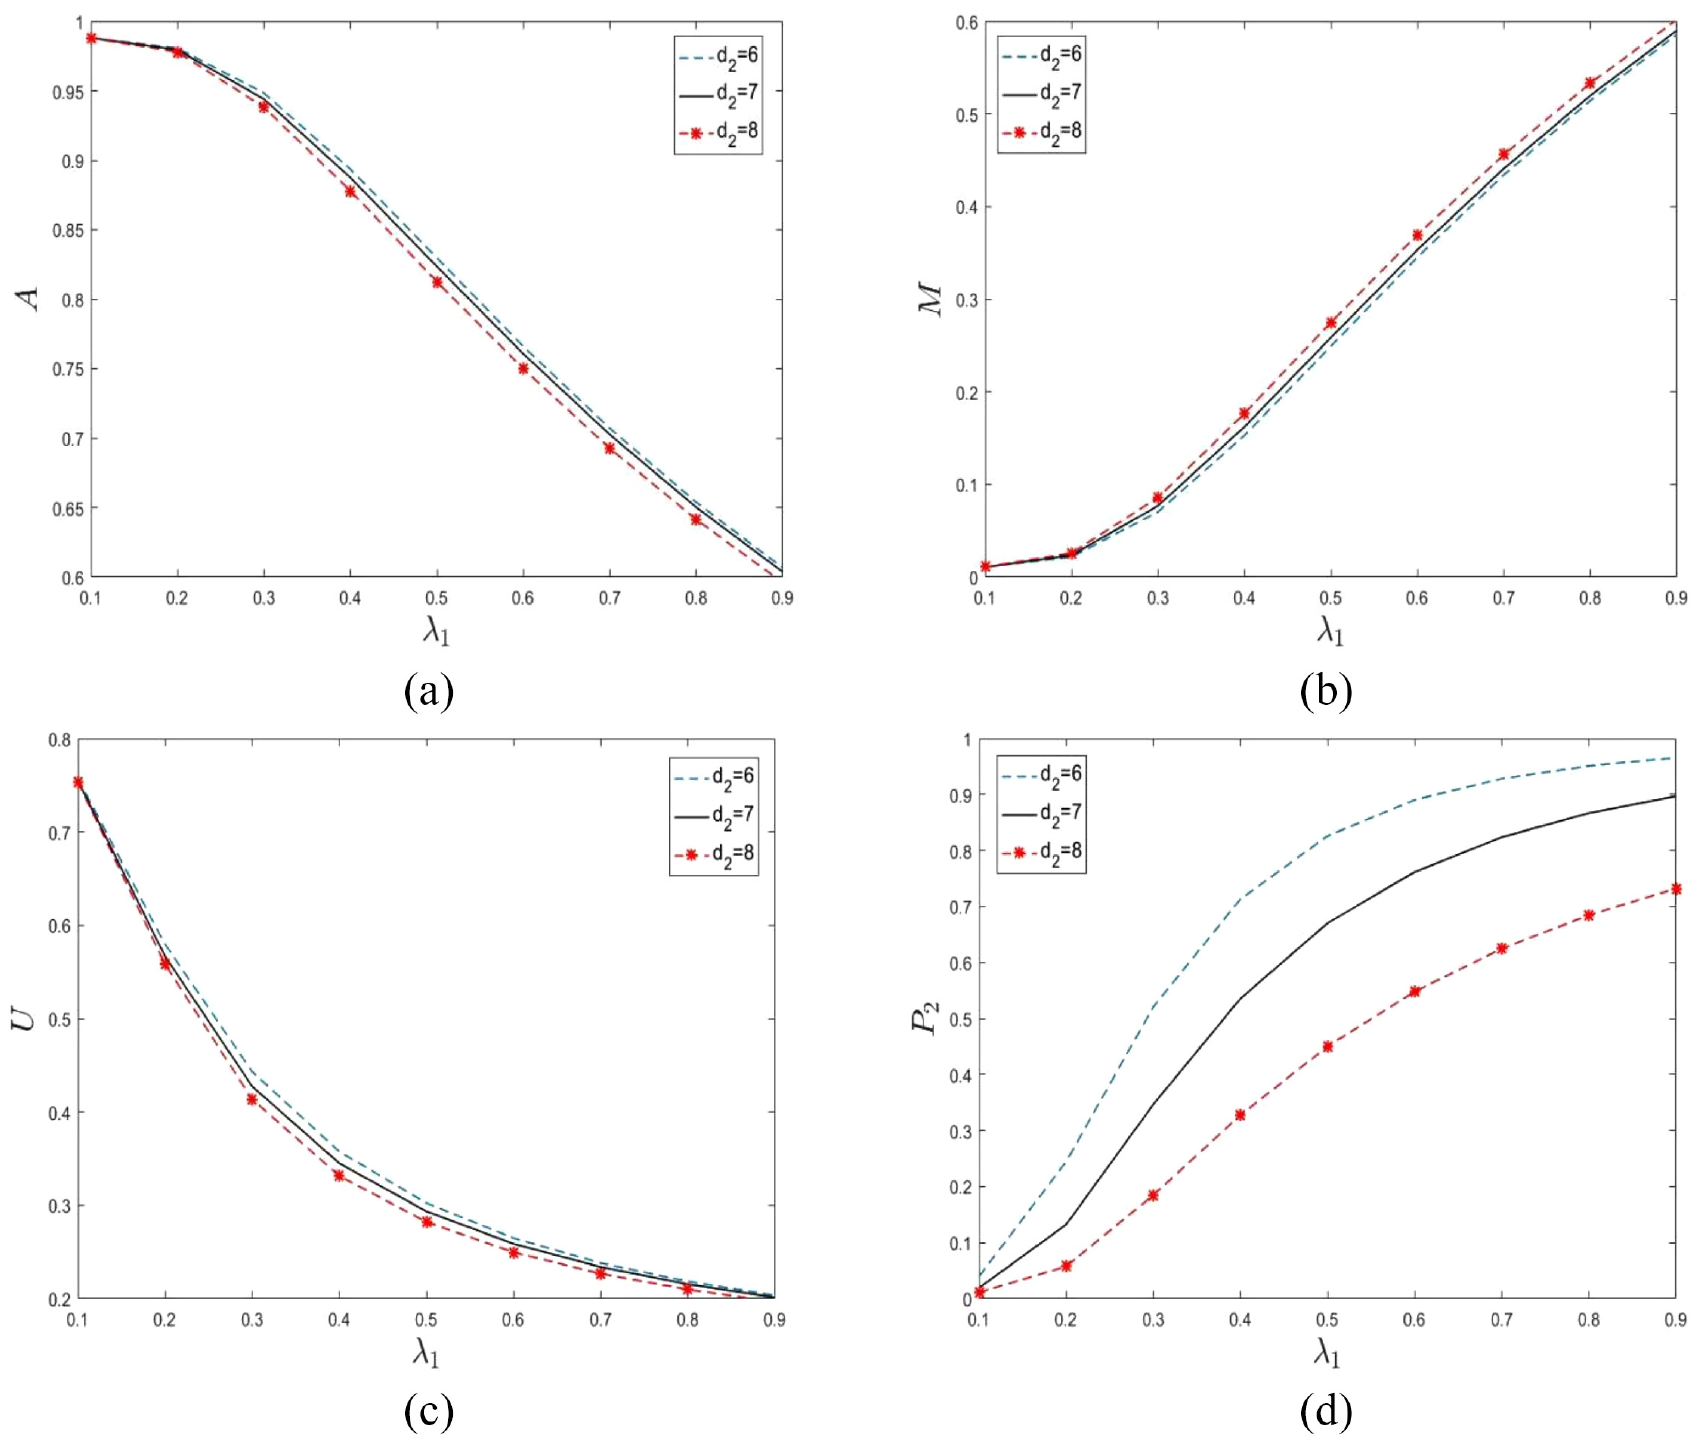
Secondly, to illustrate the impact of different maintenance levels on the system reliability, the different trends of A, M, U, and under different maintenance thresholds are shown in Figure 6. It can be found that the smaller the maintenance threshold , the earlier the level 2 repairman enters the system. The steady-state availability of the system and the utilization rate of the components are greater, while the failure frequency of the steady-state is smaller so that the busy probability of the level 2 repairman is also greater. This is because the failed components are more likely to be repaired in time when the level 2 repairman starts the maintenance work, so the steady-state availability of the system increases, and the failure frequency of the system decreases.
The trend of system reliability indices under different : (a) the system availability under different thresholds, (b) the failure frequency under different thresholds, (c) the utilization rate of components under different , and (d) the busy probability of level 2 repairman under different .
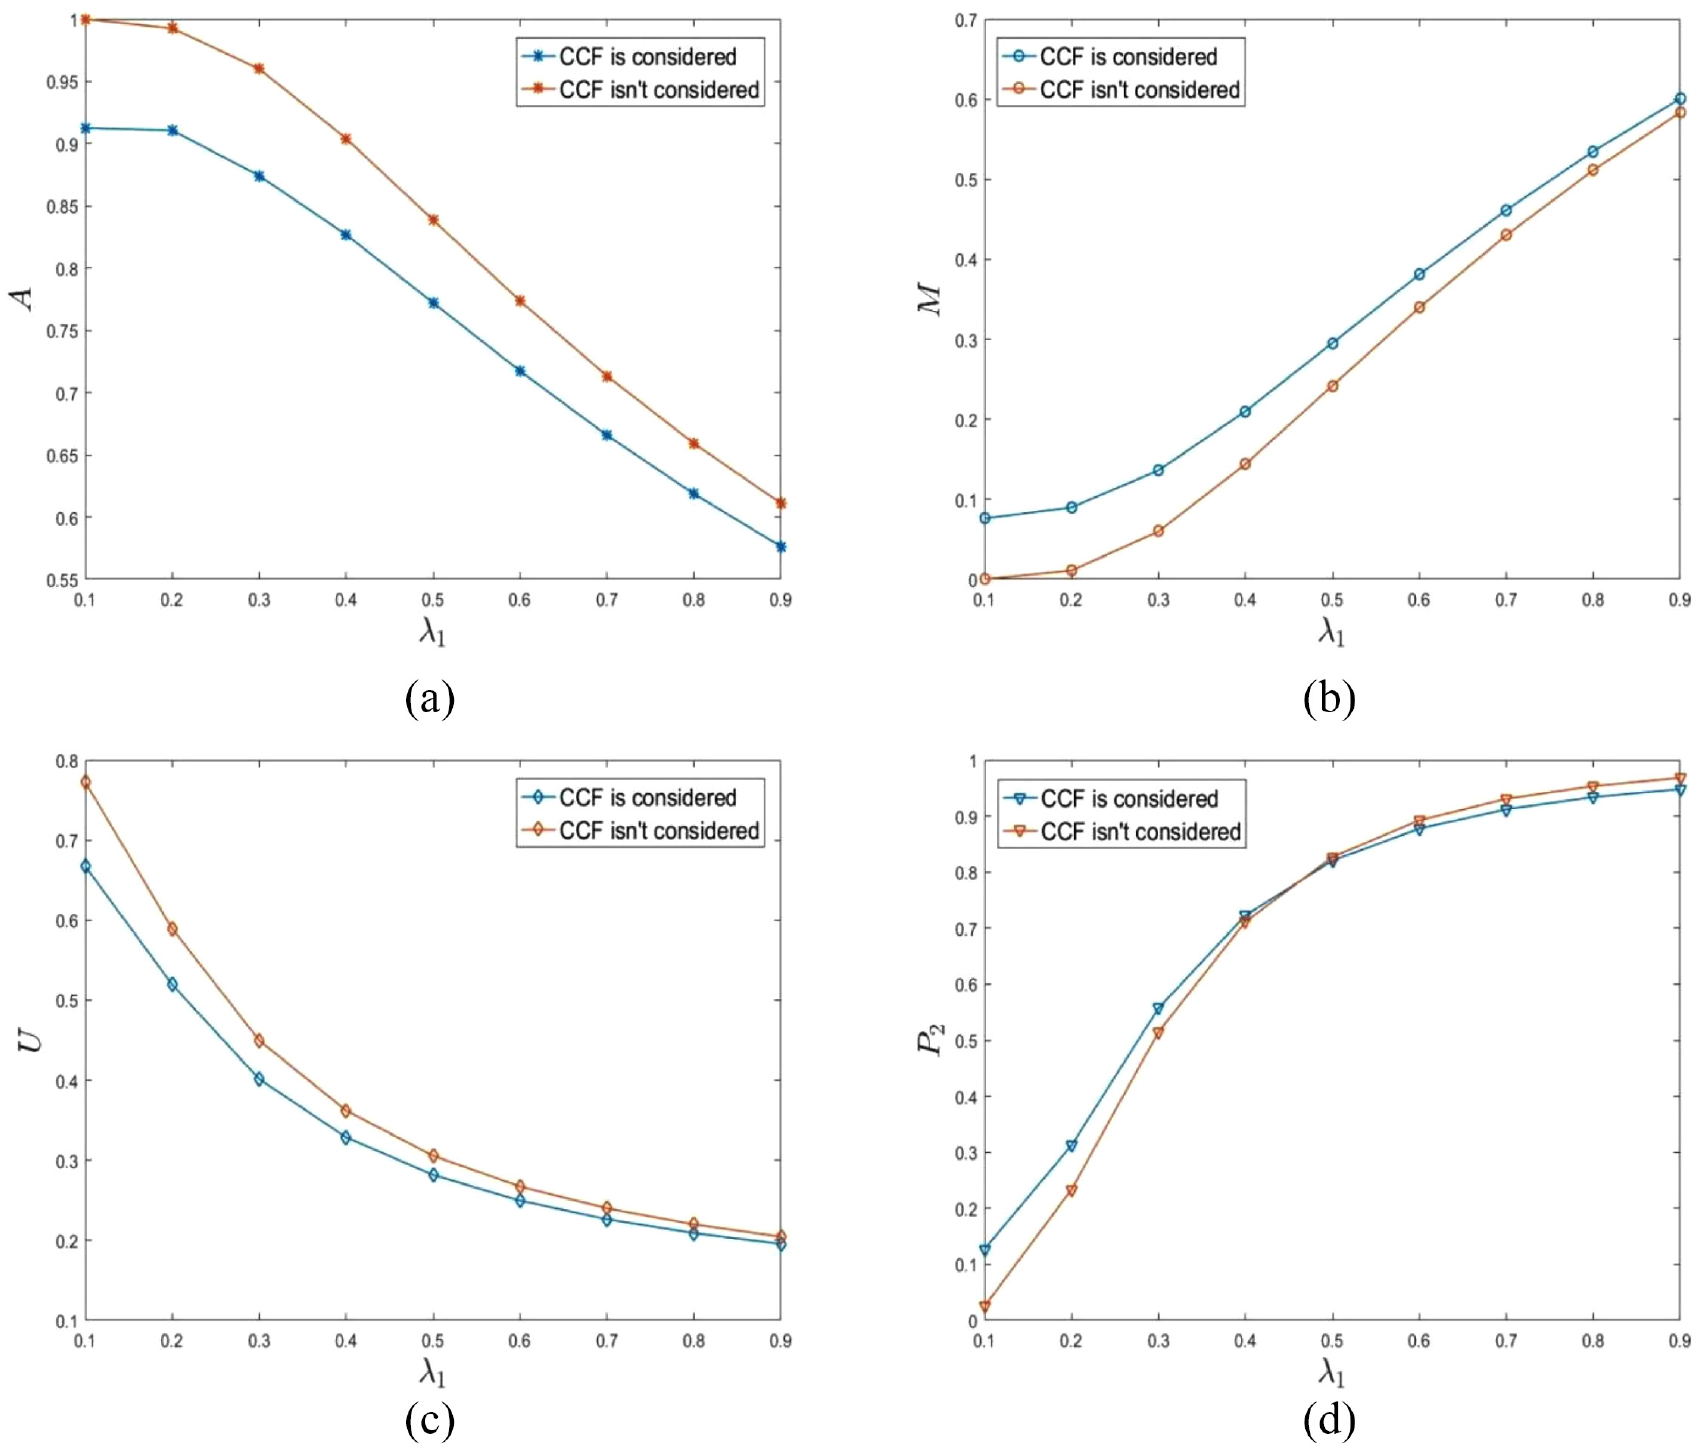
Finally, the impact of considering CCF or not considering it on the system reliability is discussed, and the sensitivity analysis is also researched where the parameter is set as . The trends of the system reliability indices under different conditions are shown in Figure 7. It can be seen when the independent failure rate of the components is given. The system availability and utilization rate of the components considering CCF are smaller compared to those without considering CCF. This is equivalent to increasing the failure rate of the system when considering the impact of CCF on system reliability. The failure frequency of steady-state is larger in the case of considering CCF, and the busy probability of level 2 repairman is larger before while it is smaller after . Because the impact of CCF on the busy probability of the level 2 repairman is smaller with the increase in the independent failure rate of the components. It can be seen that the components failing due to CCF will have a certain impact on the system, especially for the engineering fields with high-precision requirements such as aerospace and military weapons, which can’t be ignored.
The trend of system reliability indices considering CCF or without considering it: (a) the system availability under different conditions, (b) the failure frequency under different conditions, (c) the utilization rate of components under different conditions, and (d) the busy probability of the level 2 repairman under different conditions.
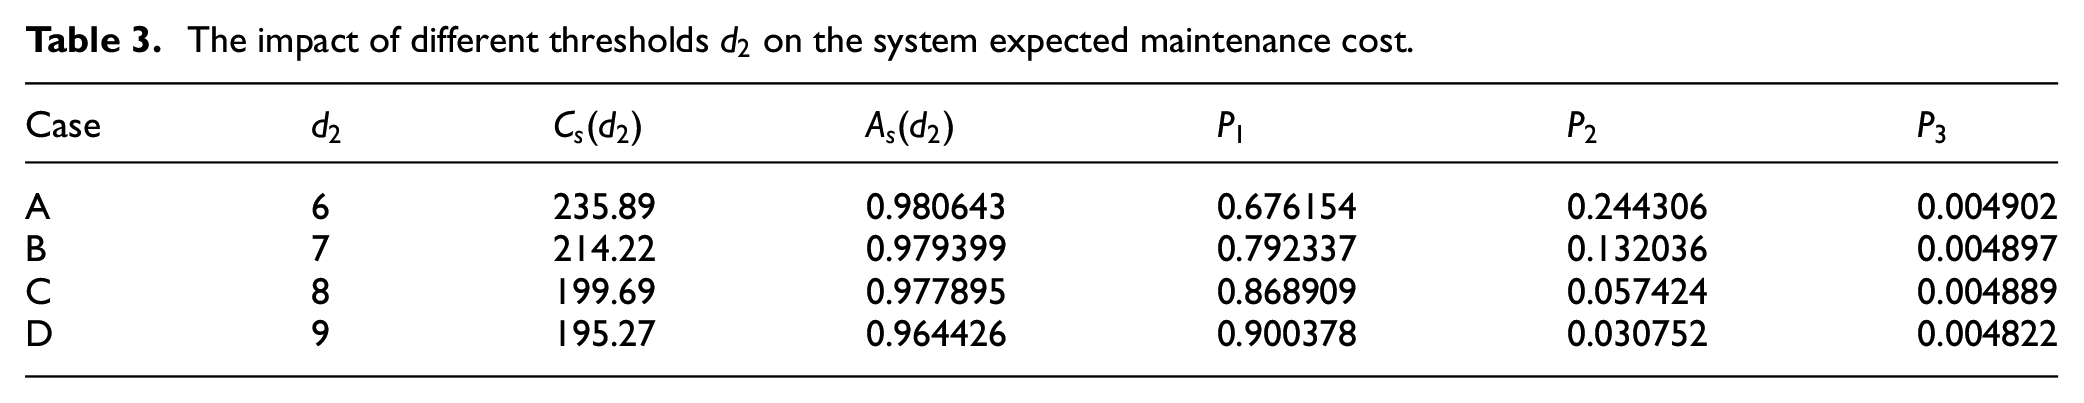
Then the optimization of the system expected maintenance cost is discussed. For the convenience of discussion, here assume two levels ( and ) are fixed and only one level () is adjusted, that is, the optimal solution under the additional condition is discussed. The impact of different thresholds on the system expected maintenance cost is shown in Table 3. The minimum system expected maintenance cost is 195.27, but the corresponding system availability is also minimal, which is less than the minimum system availability It can be seen that as the maintenance threshold increases, the system expected maintenance cost gradually decreases and the system availability is also gradually decreasing. This is because the greater the maintenance threshold , the later the level 2 repairman enters the system to repair, which means the level 1 repairman who has the lower maintenance cost will be assigned primarily to repair. As a result, the system expected maintenance cost and the system availability also decrease.
The impact of different thresholds on the system expected maintenance cost.
Case
A
6
235.89
0.980643
0.676154
0.244306
0.004902
B
7
214.22
0.979399
0.792337
0.132036
0.004897
C
8
199.69
0.977895
0.868909
0.057424
0.004889
D
9
195.27
0.964426
0.900378
0.030752
0.004822
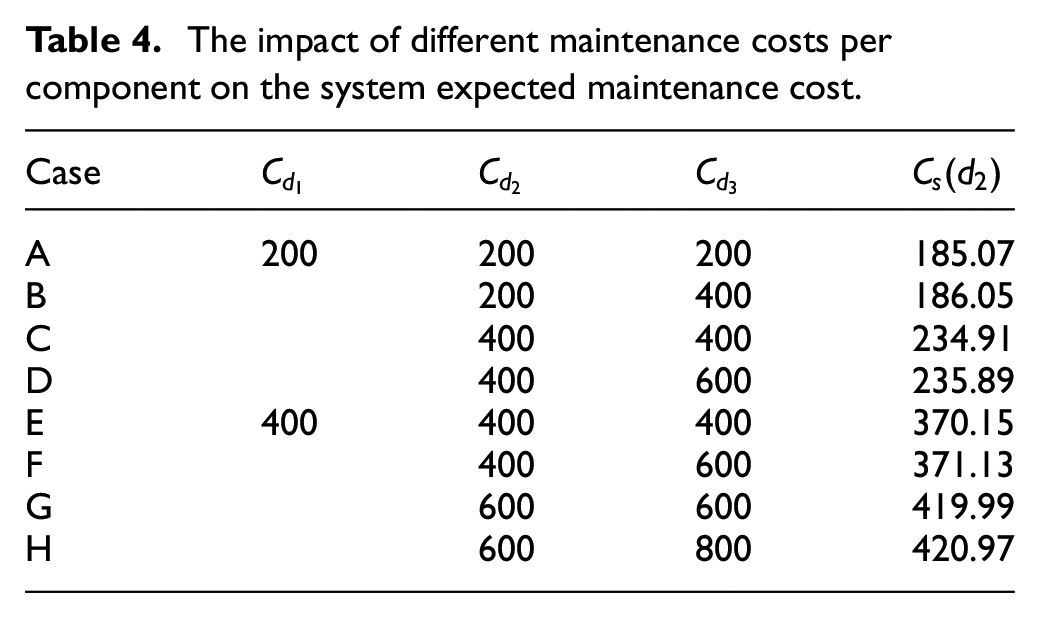
The impact of the maintenance cost per component on the system expected maintenance cost under different maintenance levels is shown in Table 4, where the maintenance threshold is given. Adjust which has a minor impact on the system expected maintenance cost in the cases of A and B. Adjust which has an intermediate impact on the system expected maintenance cost in the cases of B and C. And adjust which has a major impact on the system expected maintenance cost in the cases of D and F. This is because the probability of the level 1 repairman working in the system is the largest, followed by the level 2 repairman, and finally the level 3 repairman. Therefore, the change in the maintenance cost corresponding to the level 1 repairman has the largest impact on the system expected maintenance cost.
The impact of different maintenance costs per component on the system expected maintenance cost.
Case
A
200
200
200
185.07
B
200
400
186.05
C
400
400
234.91
D
400
600
235.89
E
400
400
400
370.15
F
400
600
371.13
G
600
600
419.99
H
600
800
420.97
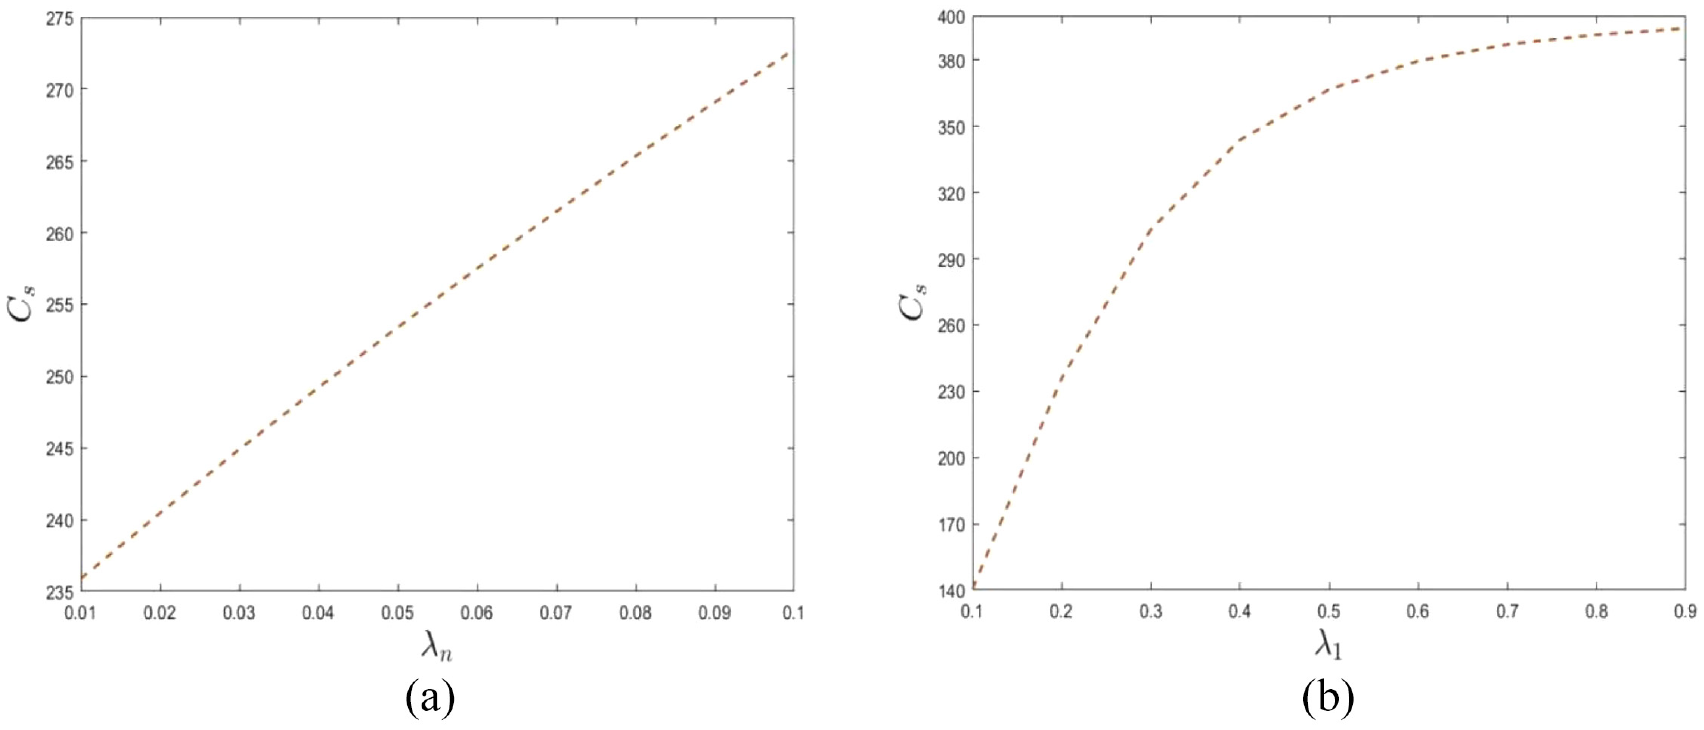
Moreover, to illustrate the impact of the system which considers CCF or without considering CCF on the system expected maintenance cost, the trend of the system expected maintenance cost is shown in Figure 8, where the maintenance threshold is still given. The trend under different is shown in Figure 7(a), which shows that the system expected maintenance cost also increases when is increasing. The trend under different is shown in Figure 7(b), and it can be seen that the trend is approximately as same as (a). However, the changing trend in (b) is more obvious compared to (a). This is because the independent failure rate is greater than the failure rate of common cause failure of the components, and the increasing rate of CCF is 0.01 while the independent failure rate is 0.1.
The trend of the system expected maintenance cost under different conditions: (a) the system expected maintenance cost under different and (b) the system expected maintenance cost under different .
Conclusions
The reliability science has been widely discussed by researchers.37–39 This paper studies the k-out-of-n: G repairable system with a multi-level maintenance strategy under the influence of common cause failure. Two models are established in two different conditions. The reliability indices of the system and the optimization model of maintenance cost are derived. In addition, the three-level maintenance strategy is also discussed. Finally, some numerical examples are given to demonstrate the results obtained in the paper. The results show that the multi-level maintenance strategy is more in line with the demand of actual situations for multi-level repairmen, and the impact of common cause failure on the system reliability can’t be ignored. The above two aspects considered also have a considerable impact on the system maintenance cost.
For future work, in-depth research will be considered from the following four aspects: (1) assume that the components are in multiple states; (2) competitive failure of the components and production wait time40 will be researched combining with multi-level maintenance strategy; (3) economic or structural dependence between components will be considered; (4) consider the joint optimization of the multi-level maintenance strategy in this paper and the inventory strategy tested by Kou et al.41.
Footnotes
Declaration of conflicting interests
The author(s) declared no potential conflicts of interest with respect to the research, authorship, and/or publication of this article.
Funding
The author(s) disclosed receipt of the following financial support for the research, authorship, and/or publication of this article: The work was supported by the National Natural Science Foundation of China under Grant [71961030, 71971228], Natural Science Basic Research Program of Shaanxi [2021JM-419].
ORCID iDs
Qinglai Dong
Xujie Jia
References
1.
CoitDWChatwattanasiriNWattanapongsakornN, et al. Dynamic k-out-of-n system reliability with component partnership. Reliab Eng Syst Saf2015; 138: 82–92.
2.
GongMLiuHPengR.Redundancy allocation of mixed warm and cold standby components in repairable k-out-of-n systems. Proc IMechE, Part O: J Risk and Reliability2020; 234(5): 696–707.
3.
SunHZhangYZhaoP.Allocating hot standbys to randomly weighted k-out-of-n: G systems. Proc IMechE, Part O: J Risk and Reliability2022; 236(1): 37–54.
4.
LevitinGXingLDaiY.Optimal operation and maintenance scheduling in m-out-of-n standby systems with reusable elements. Reliab Eng Syst Saf2021; 211: 107582.
5.
ZhangNFouladiradMBarrosA, et al. Condition-based maintenance for a k-out-of-n deteriorating system under periodic inspection with failure dependence. Eur J Oper Res2020; 287(1): 159–167.
6.
ParkMLeeJKimS.An optimal maintenance policy for a k-out-of-n system without monitoring component failures. Qual Technol Quant Manag2019; 16(2): 140–153.
7.
KrishnamoorthyAUshakumariPV.K-out-of-n: G system with repair: the D-policy. Comput Oper Res2001; 28(10): 973–981.
8.
KrishnamoorthyAUshakumariPVLakshmyB.K-out-of-n system with repair: the N-policy. Asia Pac J Oper Res2002; 19(1): 47–61.
9.
FuYHYuMMTangYH, et al. Steady-state probability algorithm and performance evaluation for M/(Mr, Ms)/1/N/N machine repair model under bi-level repair facility. J Shandong Univ Technol Nat Sci Ed2009; 44(4): 72–78.
10.
WuWQTangYHZhangYY.Reliability analysis of an k/n (G) system with bi-level repair strategy. J Syst Eng2018; 33(6): 854–864.
11.
XiaoHLinCKouG, et al. Optimal resource allocation for defending k-out-of-n systems against sequential intentional and unintentional impacts. Reliab Eng Syst Saf2020; 201: 106952.
12.
NezakatiERazmkhahM.Reliability analysis of a load sharing k-out-of-n: F degradation system with dependent competing failures. Reliab Eng Syst Saf2020; 203: 107076.
13.
DuSHSunUNWuLC.Research on common cause failure in risk assessment of maintenance activities in nuclear power plant. Nucl Sci Eng2019; 39(5): 804–808.
14.
WangBWXieLYFanFY, et al. Reliability analysis of folding wing deployable mechanism considering common cause failure. J Mech Eng2020; 56(5): 161–171.
15.
ChengZYuJGuoJP, et al. Primary study on spacecraft common cause failure and preventive actions. Spacecraft Eng2010; 19(6): 121–125.
16.
FanMZengZZioE, et al. A stochastic hybrid systems model of common-cause failures of degrading components. Reliab Eng Syst Saf2018; 172: 159–170.
17.
VaurioJK.An implicit method for incorporating common-cause failures in system analysis. IEEE Trans Reliab1998; 47(2): 173–180.
18.
SalemAMEl-DamceseMA.Reliability of systems subject to common—cause hazards. Nucl Eng Des2004; 227(3): 349–354.
19.
LevitinG.Incorporating common-cause failures into non-repairable multi-state series-parallel system analysis. IEEE Trans Reliab2001; 50(4): 380–388.
20.
ShenZPTangH.System reliability analysis with common cause failures using the GO methodology. J Tsinghua Univ Sci Technol2006; 46(6): 829–832.
21.
LiCYChenXYiXS, et al. Analysis of k-out-of-n: G systems subject to common cause failures based on Markov process. Syst Eng Electron2009; 31(11): 2789–2792.
22.
CoolenFPACoolen-MaturiT. Predictive inference for system reliability after common-cause component failures. Reliab Eng Syst Saf2015; 135: 27–33.
23.
CaoWJiaXLiuY, et al. Selective maintenance optimisation considering random common cause failures and imperfect maintenance. Proc IMechE, Part O: J Risk and Reliability2019; 233(3): 427–443.
24.
QiuSMingX.Explicit and implicit Bayesian network-based methods for the risk assessment of systems subject to probabilistic common-cause failures. Comput Ind2020; 123: 103319.
25.
LiYLiuYHuangT, et al. Reliability assessment for systems suffering common cause failure based on Bayesian networks and proportional hazards model. Qual Reliab Eng Int2020; 36(7): 2509–2520.
26.
HeHLGuoJBSeismic disaster risk evaluation for power systems considering common cause failure. IOP Conf Ser Mater Sci Eng2012; 32(28): 44–54+20.
27.
YuYWangSNiuF.Analysis of common cause failure effect on system reliability in seismic PSA. Prog Nucl Energy2014; 75: 158–167.
28.
ChengJTangYYuM.The reliability of solar energy generating system with inverters in series under common cause failure. Appl Math Model2019; 68: 509–522.
29.
KongXFWangJZhangZM.Reliability analysis of aircraft power system based on Bayesian networks and common cause failures. Acta Aeronaut Astronaut Sin2020; 41(5): 323632.
30.
LiangLD.Study on reliability of paralleled redundant repairable system with n identity units and k repair facilities. J Sichuan Univ Sci Technol Nat Sci Ed2016; 29(4): 88–93.
31.
ChengJ.A k-out-of-n: G repairable system with C repairmen. J Southwest Univ Nat Sci2010; 36(1): 12–15.
32.
GaoCLZhengHY.Reliability analysis of n-unit vote repairable system with two repair facility. J Gansu Lianhe Univ Nat Sci Edn2009; 23(5): 1–4.
33.
LiuJ.Study of Markov repairable system with m repairmen. Master’s Thesis, Beijing Institute of Technology, China, 2018.
34.
ZhangMYZhengMH.Reliability of n-unit vote repairable system with Q repair facility. J Tangshan Norm Univ2013; 35(2): 22–24.
35.
CaoJHChengK.Mathematical theory of reliability. Beijing: Higher Education Press, 2006.
36.
TianNSZhangZG.Vacation queueing models: theory and applications. Boston: Springer, 2006.
37.
AvenT.The reliability science: its foundation and link to risk science and other sciences. Reliab Eng Syst Saf2021; 215: 107863.
38.
XiaoHYanYKouG, et al. Optimal inspection policy for a single-unit system considering two failure modes and production wait time. New York: IEEE, 2021.
39.
TangTJiaLHuJ, et al. Reliability analysis and selective maintenance for multistate queueing system. Proc IMechE, Part O: J Risk and Reliability2022; 236(1): 3–17.
40.
XiaoHYiKPengR, et al. Reliability of a distributed computing system with performance sharing. New York: IEEE, 2021.
41.
KouGXiaoHCaoM, et al. Optimal computing budget allocation for the vector evaluated genetic algorithm in multi-objective simulation optimization. Automatica2021; 129: 109599.