
Abstract
Statistical modelling of wind speed is of great importance in the evaluation of wind farm performance and power production. Various models have been proposed in the literature depending on the corresponding time scale. For hourly observed wind speed data, the dependence among successive wind speed values is inevitable. Such a dependence has been well modelled by Markov chains. In this paper, the use of Markov chains for modelling wind speed data is discussed in the context of the previously proposed likelihood ratio test. The main steps for Markov chain based modelling methodology of wind speed are presented and the limiting distribution of the Markov chain is utilized to compute wind speed probabilities. The computational formulas for reliability indices of a wind farm consisting of a specified number of wind turbines are presented through the limiting distribution of a Markov chain. A case study that is based on real data set is also presented.
Keywords
Introduction
Modelling statistical behaviour of wind speed is of special importance in wind energy studies. The choice of the suitable statistical model for wind speed regime at a certain location is important for the assessment of wind resources, performance of wind farms and their power production. Some well-known statistical distributions such as Weibull, Gamma and lognormal have been used for modelling wind speed when the data set includes daily averages. Manifestly, a statistical dependence among successive wind speed values may occur especially when hourly observations are considered. That is, the wind speed value for the next hour may depend on the wind speed values at previous hour(s). Thus, a proper dependence model is necessary for better forecasting of wind turbine/farm power production.
Markov chain is a useful tool for modelling dependence for sequential data. Indeed, Markov chains have been used to model and simulate the wind speed in a discrete way. Sahin and Sen 1 used first-order Markov chain approach for wind speed modelling. Ettoumi et al. 2 have fitted first-order three-state Markov chain for the wind speed data collected at Oran (Algeria). Shamshad et al. 3 considered first and second order Markov chain models for synthetic generation of wind speed time series. Song et al. 4 presented a way to estimate the first order (one step) Markov chain transition matrix from wind speed time series by two steps which are based on estimators of transition matrices and an evolutionary algorithm that searches for the first order Markov chain transition matrix which can best match these basic estimators. Tang et al. 5 proposed a way for the categorization of steps in Markov chain based wind speed modelling. Nguyen et al. 6 used first-order Markov chain to model wind speed and investigated the impact of correlation between wind speed and wind turbine availability on wind farm availability. Zheng et al. 7 studied optimal preventive maintenance for wind turbines considering the effects of wind speed and used Markov chains for modelling the wind speed.
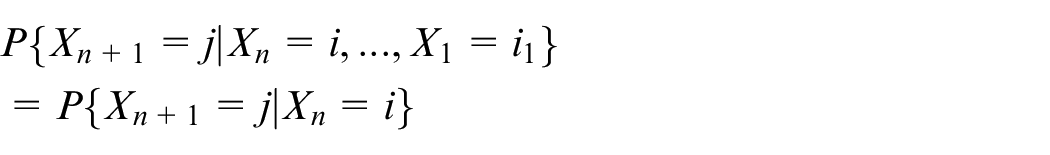
In the literature, mostly first order Markov chain has been used for modelling wind speed. Under first order Markov dependence, when the current state of the wind speed is exactly known, the probability of the future behaviour of the wind speed is not altered by the additional knowledge concerned with its past behaviour. That is, given the values
Various reliability indices have been proposed to evaluate the performance of power systems. Among the others, the Loss-of-Load Probability, Loss-of-Load Expectation and Expected Energy not Supplied have been widely used in reliability assessment of wind power systems (see, e.g. Tina et al., 8 Moharil and Kulkarni, 9 Billinton and Huang, 10 Chen et al., 11 Čepin, 12 Nguyen et al., 6 Eryilmaz et al., 13 Ghaedi and Gorginpour, 14 Zhang et al. 15 ). These reliability indices have also been used to choose the optimal wind turbine model for a wind farm (see, e.g. Fotuhi-Firuzabad and Dobakhshari 16 , Nemes and Munteanu, 17 Mohiley and Moharil 18 ).
The reliability indices depend on the aggregate power produced by a wind farm which is in fact a function of wind speed at the wind farm’s location. Thus, to compute and evaluate any reliability index, a proper statistical model should be developed for the wind speed random variable.
In the present paper, we compute well-known reliability indices for a wind farm consisting of a specified number of wind turbines when the wind speed is modelled by a Markov chain. To this end, we first summarize the existing hypothesis testing procedure to determine the order of the Markov dependence in wind speed modelling. Then, the long term distribution of the Markov chain is obtained via estimation of the transition probabilities and is used to compute discrete probability distribution corresponding to the wind speed. Finally, based on this distribution the reliability indices are computed. The main contribution of the paper lies in presenting and applying Markov chain methodology for wind speed modelling, and computing well-known reliability indices of wind and hybrid power systems based on the discrete wind speed distribution obtained via Markov chains. The new expressions for the Loss-of-Load Probability and Expected Energy not Supplied of a hybrid system that consists of specified number of wind turbines and a photovoltaic system that has a certain area are also obtained. These expressions contain reliability values of a wind turbine and photovoltaic system. Therefore, they enable us to evaluate the performance of a hybrid system with respect to reliability values of hybrid system components. The works appeared in the literature mostly focus on Markov chain based modelling of wind speed. In the present paper, we not only obtain a discrete distribution of the wind speed via Markov chains, but also compute and evaluate reliability indices for wind and wind-solar based power systems.
Based on the above perspective, the results and application-oriented findings of our study are reported in the following order. In Section 3, we present the theoretical framework for modelling wind speed via Markov chains. Section 4 contains equations for reliability indices which are based on the limiting distribution of the wind speed. Finally, in Section 5, we obtain numerical results which are based on real wind speed data.
Notation and abbreviations
In the following, we list the notation and abbreviations that will be used throughout the paper.
PVS: Photovoltaic system
Markov chain modelling of wind speed
A series of hourly wind speed measurements is converted to a sequence which is defined on the state space

and in state
Let the sequence
for all time points
Let
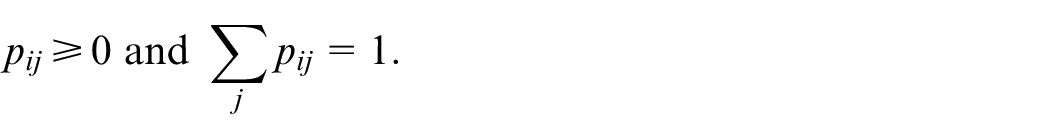
For a Markov chain defined on the states
where
In the case when the future behaviour of the process
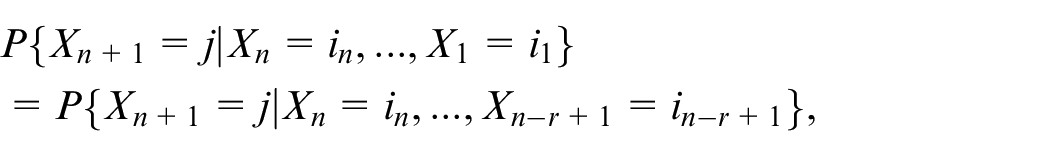
for all time points

Manifestly, when

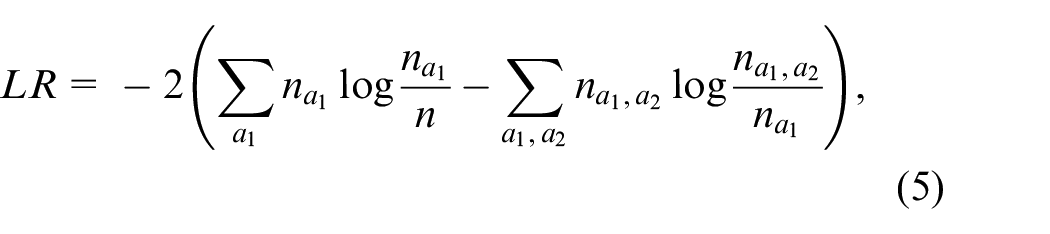
For testing
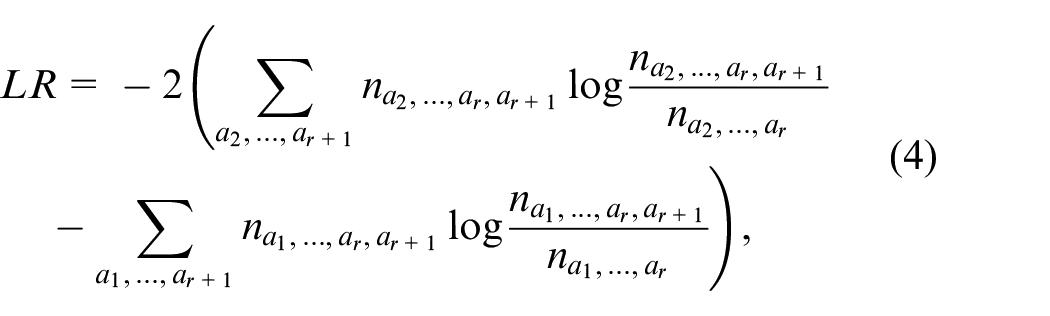
for
and
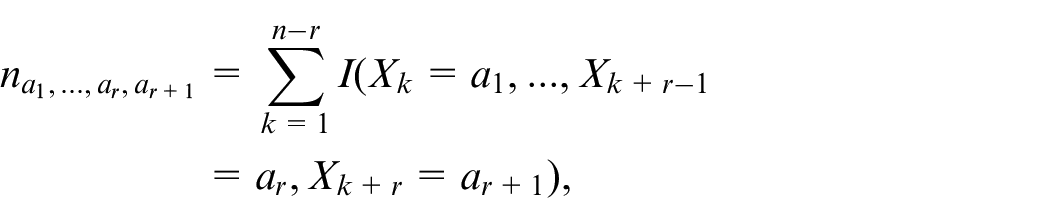
where
It should be noted that in the special case when
We are interested in obtaining exactly the order of the converted wind speed series
that is, independence against first order Markov chain. If
where
The process for modelling wind speed series via Markov chain is summarized below.
Step 1. A series of hourly wind speed measurements is converted to a sequence which is defined on the state space
Step 2. The test given by (3) is performed for successive values of
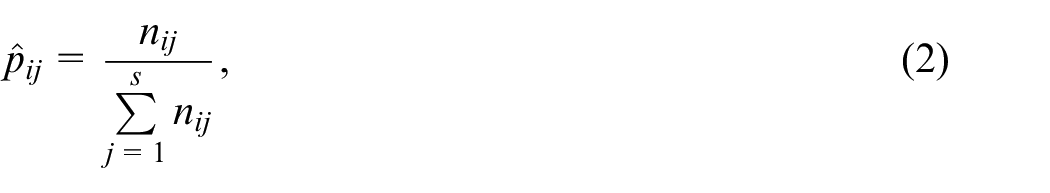
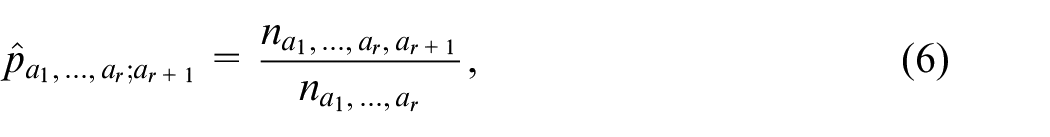
Step 3. The estimates of the transition probabilities
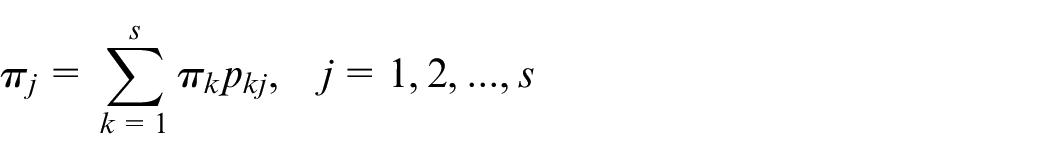
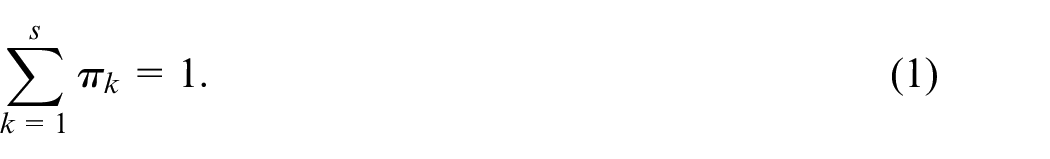
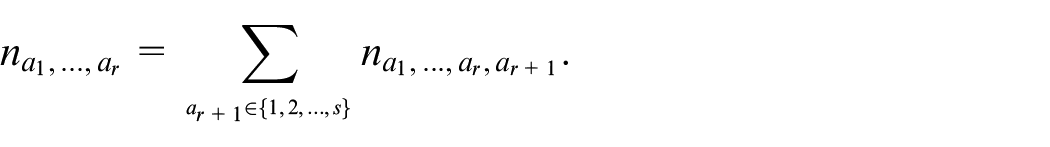
Step 4. The probability of being in state
Reliability indices
After obtaining the limiting distribution
where

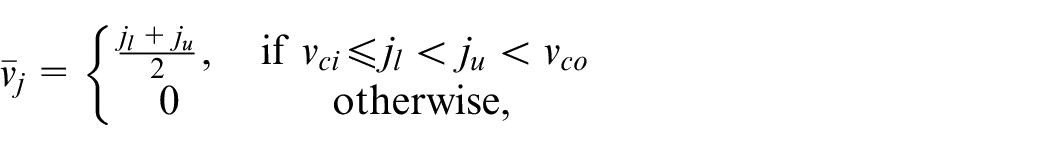
If the relationship between the wind speed
Wind speed probability distribution and wind turbine power output.
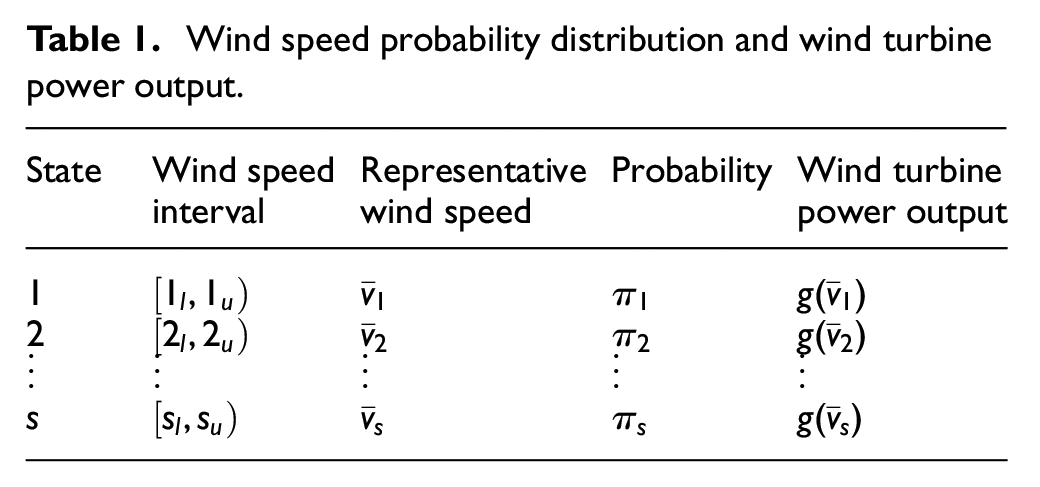
The aggregate power output of a wind farm that consists of

where
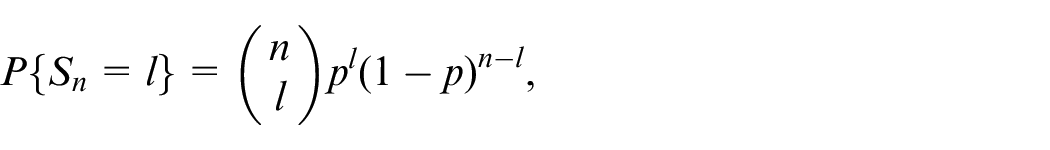
for
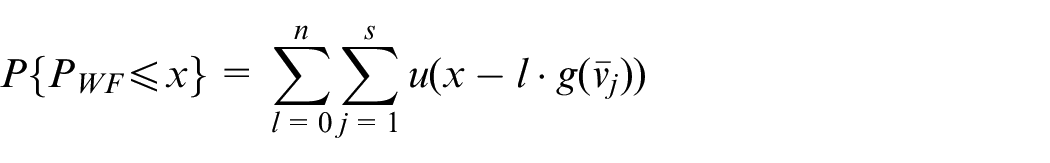
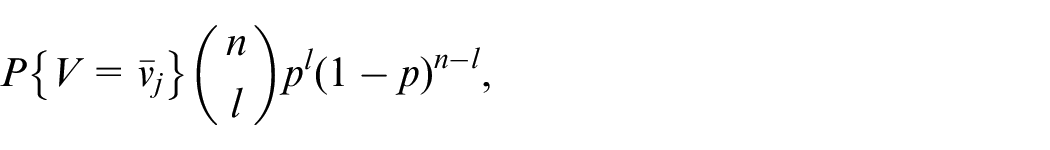
where
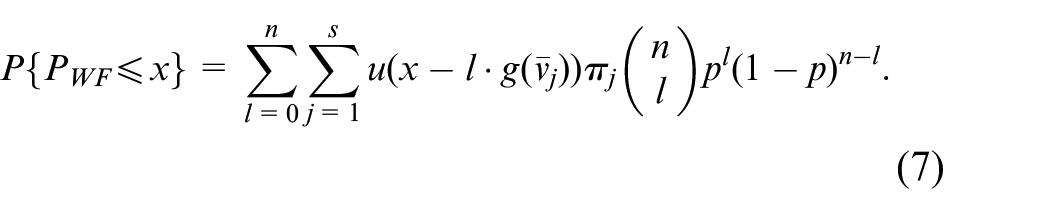
The distribution given by (7) can be easily computed using the entries presented in Table 1.
The relationship between wind speed and the power output of a wind turbine depends on the wind turbine characteristics. According to the widely used power equation, (see, e.g. Louie and Sloughter 24 )
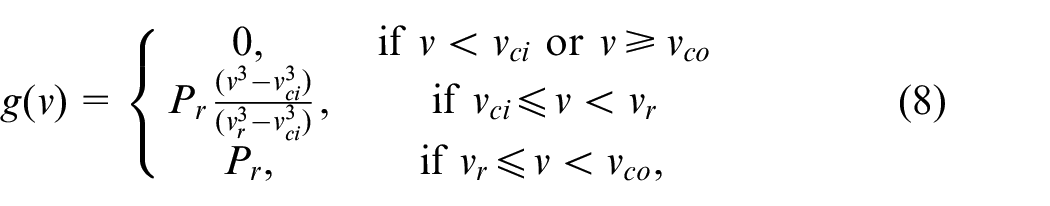
where
Wind turbine characteristics (
Wind turbine availability (
The long term distribution of the wind speed (
For a given load

Using (7), by conditioning on the number of available wind turbines and the number of wind speed states, the LOLP can be computed from
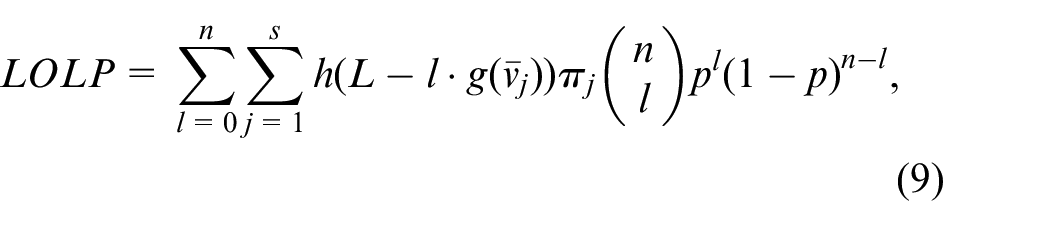
where
LOLE is defined to be the expected period during which the load demand is greater than available power generation. It can be defined as
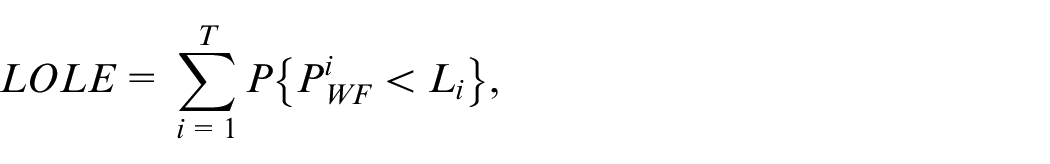
where

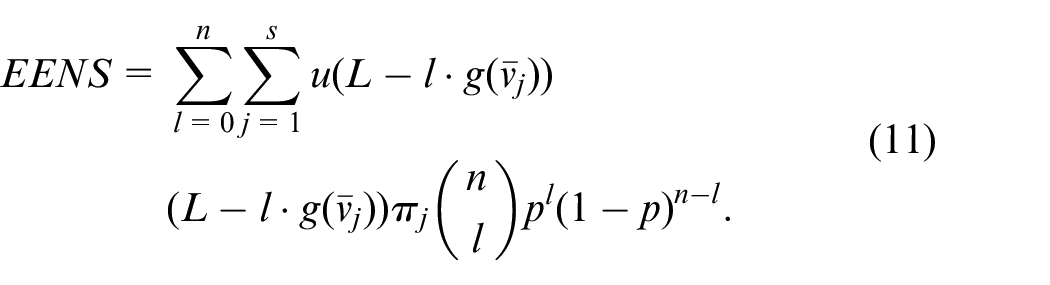
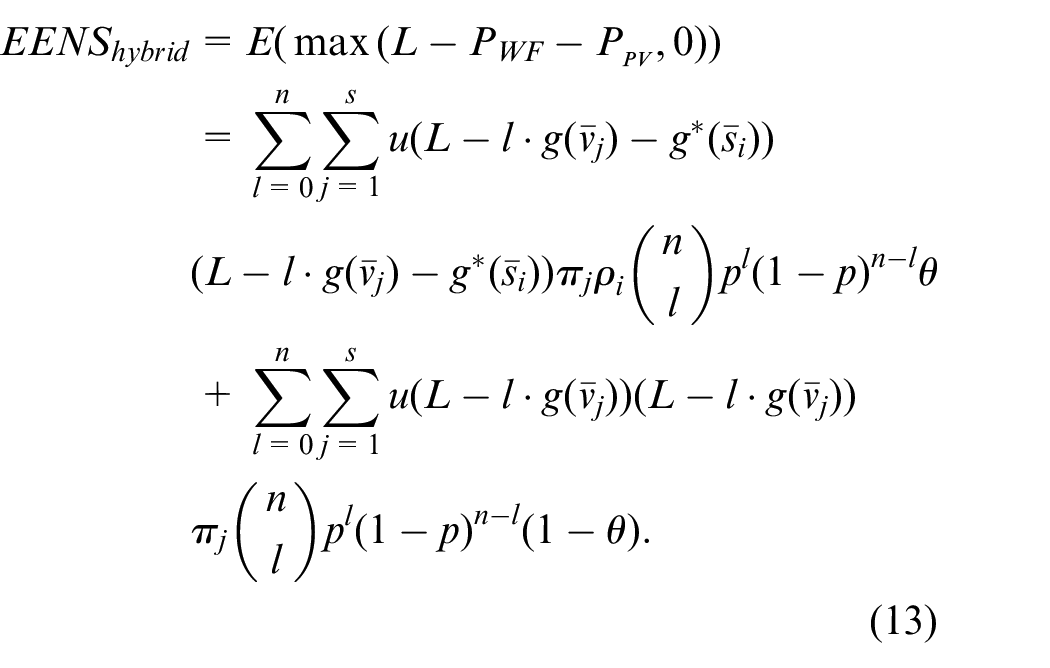
The EENS is defined to be the expected energy that will not be supplied when the local load

By conditioning on the number of available wind turbines and the number of wind speed states,
Case study
Our case study is based on a series of wind speed data collected at every hour at School of Foreign Languages of Atilim University (39.813°N, 32.726°E). The hourly wind speed data collected between 1 March 2020 and 28 February 2021 have been converted to a sequence which is defined on the state space
that is, independence against first order Markov chain. The value of (5) has been found to be
For
Estimated transition probability matrix.
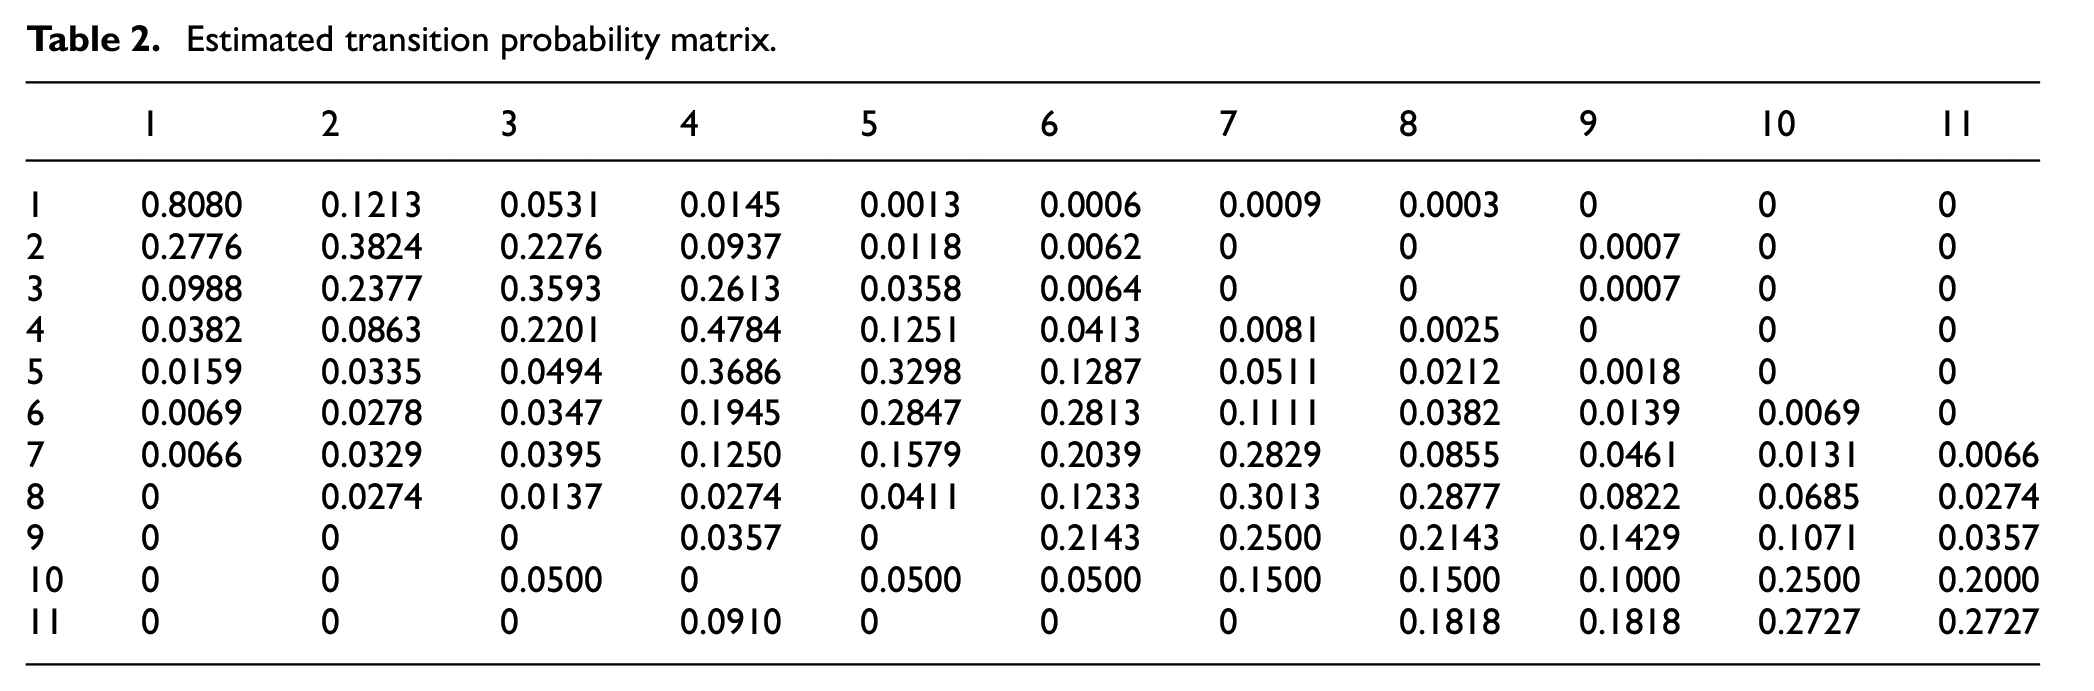
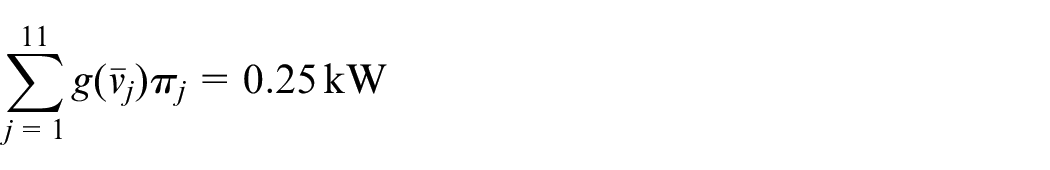
Based on the transition probability matrix given in Table 2, we obtain the limiting distribution of the Markov chain using (1). Table 3 contains representative wind speed values (
Wind turbine power output and its probability for a wind turbine with 5.5 kW rated power.
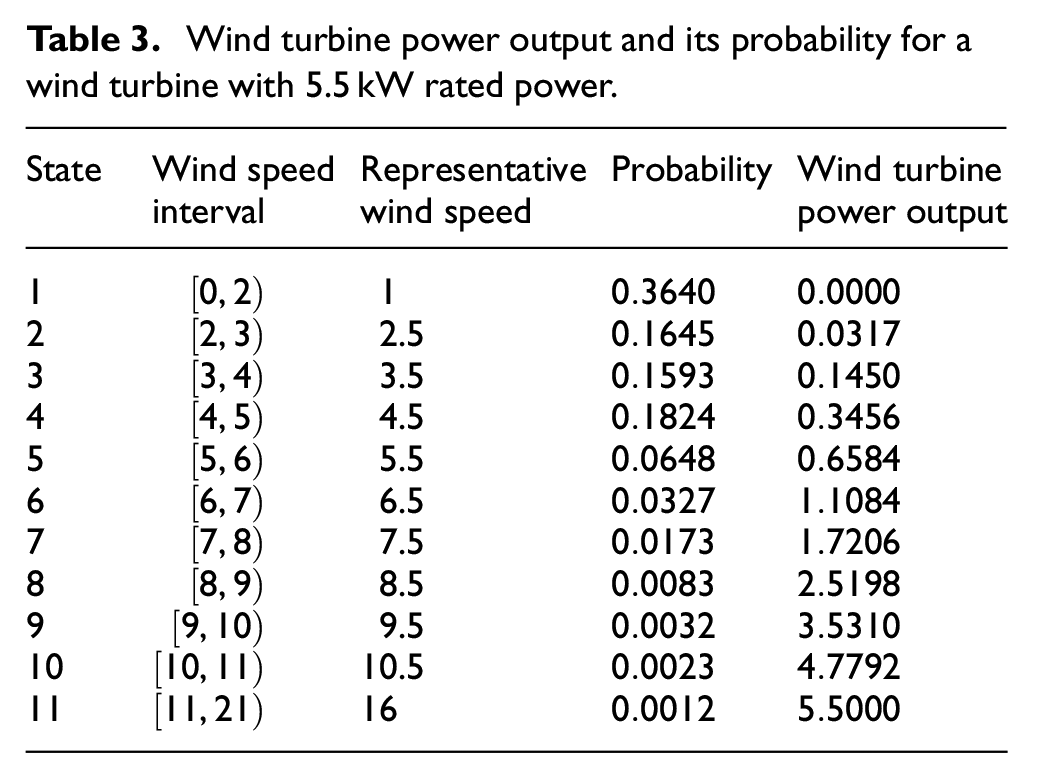
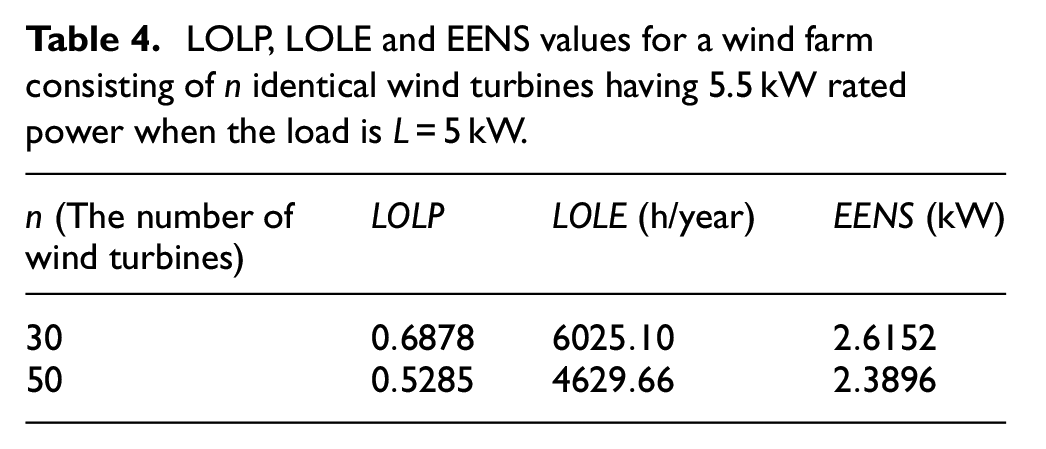
The expected output of the wind turbine is quite low when it is compared with its rated power. This is due to the dominance of low wind speeds in the area. Indeed, as it is clear from Table 3, the probability of the state 1 which corresponds to the lowest representative wind speed is the highest. Thus, a renewable energy system that consists of only wind turbines leads to high LOLP, LOLE and EENS values and hence a less reliability system. In other words, a reliable system cannot be established only using wind turbines. To obtain a required reliability level, many wind turbines should be used. This may not feasible due to constraints such as cost and the area of the wind farm location. In Table 4, LOLP, LOLE and EENS values are computed using the data presented in Table 3 and the equations (9) to (11) when the availability of each wind turbine is
LOLP, LOLE and EENS values for a wind farm consisting of
To observe the efficacy the Markov chain based modelling, we have performed a Monte Carlo simulation study. The first step in our simulation is based on the generation of hourly wind speed states from the Markov chain having transition probabilities presented in Table 2. That is, a series of wind speed states and corresponding representative wind speed values have been generated for one year period. Then, for
Hybrid system
Assume that a PVS having a certain area is integrated into a wind farm. For a fixed solar irradiation

where

for

Thus, for a hybrid system that consists of
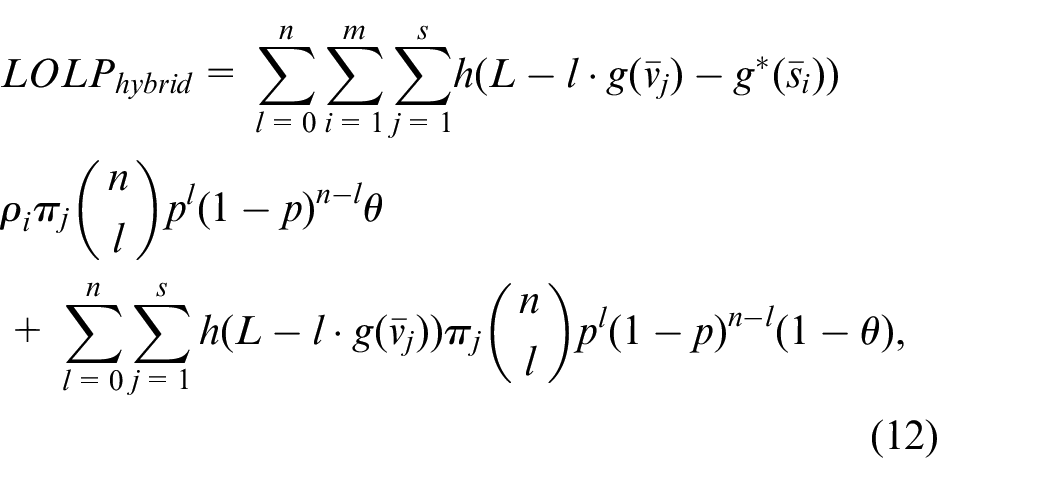
where
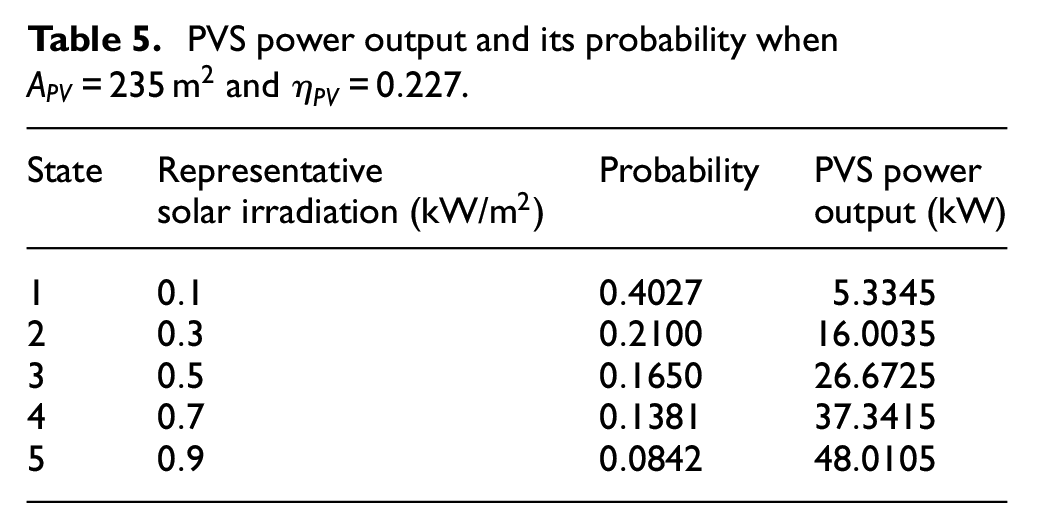
For the same area, the solar irradiation distribution has been empirically estimated based on the data collected between 1 March 2020 and 28 February 2021. Table 5 contains representative solar irradiation values (
PVS power output and its probability when
In Table 6, we compute LOLP, LOLE and EENS values for the hybrid system that consists of
LOLP, LOLE and EENS values for the hybrid system.
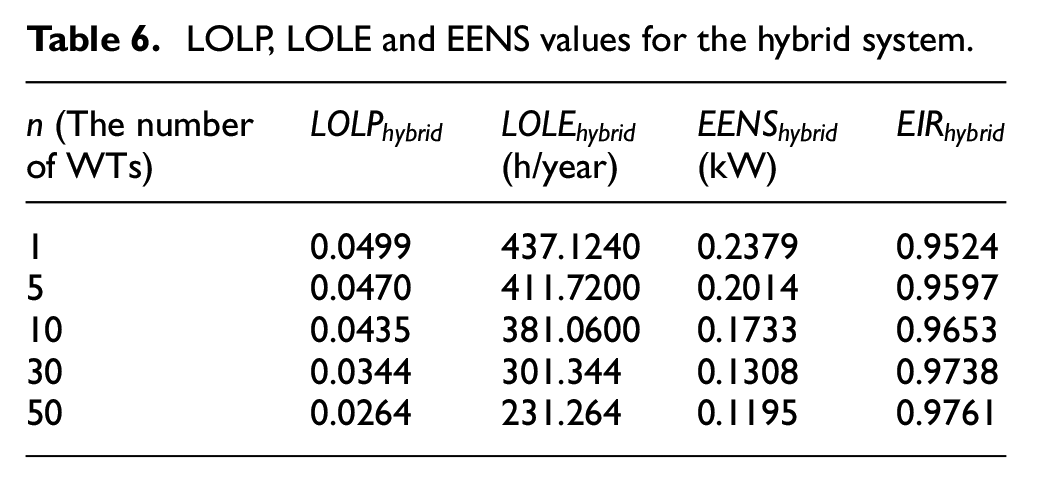
Based on EENS value, Energy Index of Reliability (EIR) is also calculated and included in Table 6. The EIR can be computed from

Summary and conclusions
In the literature, Markov chains have been directly used as a modelling tool without checking its suitability for a given wind speed data. For hourly collected wind speed data, a Markov chain of order
In our developments, it has been assumed that the wind turbine reliability is not influenced by the wind speed. In the literature, based on particular data sets, a significant correlation between wind speeds and the failure rate of the components of a wind turbine has been observed (Tavner et al. 25 ). As pointed out by Nguyen et al., 6 although the higher speed of wind within cut-in and cut-out speed values produces higher power output, it also degrades the reliability of wind turbines. The evaluation of reliability indices LOLP, LOLE and EENS considering the dependence between wind speed and wind turbine reliability under the present Markov chain based setup will be among our future research problems.
Footnotes
Declaration of conflicting interests
The author(s) declared no potential conflicts of interest with respect to the research, authorship, and/or publication of this article.
Funding
The author(s) disclosed receipt of the following financial support for the research, authorship, and/or publication of this article: This work was supported by The Scientific and Technological Research Council of Turkey (TUBITAK) under project TUBITAK 1001-119F182.