
Abstract
Because of the increasing importance and dependencies of infrastructure networks and the potential for massive cascading failures in real-world network systems, maintenance optimization to effectively reduce system performance loss caused by diverse disruptions is of significant interest among researchers and practitioners. In this work, a new recovery framework was developed to rapidly identify important system components for maintenance to improve network resilience against cascading failures. This work provides distinct advantages to determine an optimal maintenance priority by combining real-time network structure importance with other maintenance prioritization based on customer preference. This approach adopts structural graph embedding and deep reinforcement learning to extract real-time network topology information (such as minimum vertex cover) to update the maintenance priority during the recovery process. Based on the case studies on synthetic networks and a US airport network, the proposed recovery framework with real-time network topology awareness shows better performance than other maintenance prioritization strategies regarding resilience enhancement. This work improves the understanding of how the changing network structure influences maintenance effects. It also provides insights of the practical usefulness of advanced deep learning on helping optimal maintenance prioritization to effectively reduce the intensity and extent of cascading failures.
Keywords
Introduction
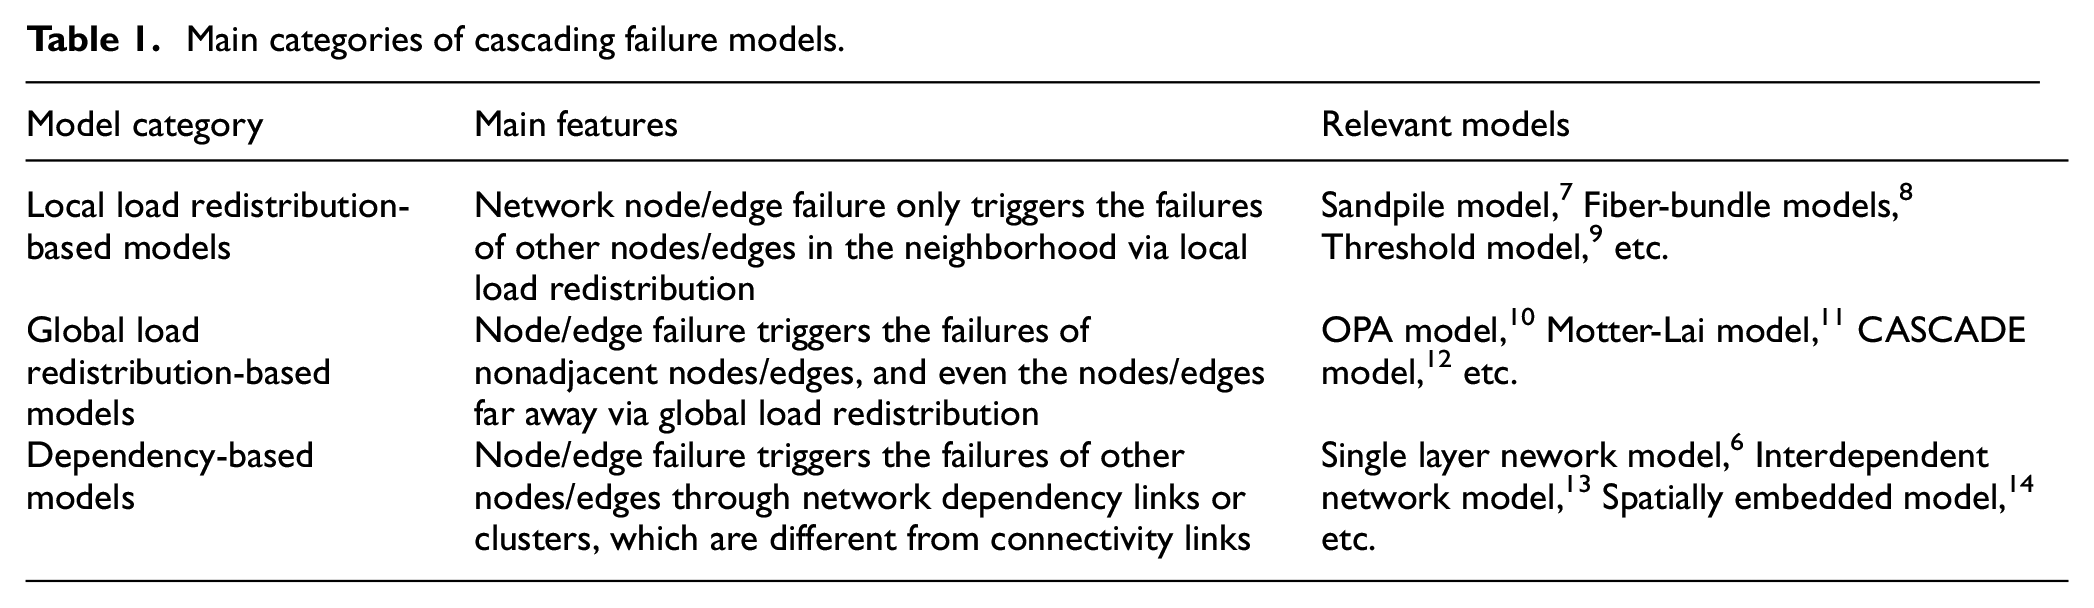
Real-world network systems with increasing scale and complexity, for example, infrastructure networks (such as power grids and transportation networks), are playing increasingly important roles in improving the efficiency of industry and the quality of modern life. Despite the promising benefits brought by diverse network systems, new challenges also emerge with their applications, such as reliability, safety, and maintenance. 1 For instance, a cyber-physical system, 2 which is a network of networks with new characteristics that require a fundamental understanding of their interactions and interconnections. These interdependencies strengthen the communication and control of system components, and provide intelligence, while they also weaken the system, accelerating failure propagation in the system. 3 Thus, unexpected cascading failures have been seen in different network systems in which the initial breakdown of some components can iteratively trigger other functional components to become inaccessible or unusable, which may result in a wide failure spread across the systems. 4 Cascading failures have catastrophic effects on personal lives and industries, and people have experienced these failures with devastating influences. 5 Therefore, significant research has been conducted related to cascading failures in network systems, for example, modeling of cascading failures. 6 Existing practices on cascading failure modeling can be categorized as Table 1.
Main categories of cascading failure models.
System resilience is the ability of a system to withstand or quickly return to normal condition after the occurrence of events that disrupt the system state. 15 Resilience reflects system-integrated capability against cascading failures, and some studies related to network resilience have also been conducted.16,17 Because failures are inevitable and resources to restore the system when failures occur are limited and subject to budgets, optimal maintenance methods or strategies to improve system resilience and mitigate the influences of cascading failures are of great significance and interests in both academia and practice.18–20 Di Muro et al. proposed a maintenance strategy for interdependent network systems by repairing the network nodes that belong to the largest connected component of each constituent network. 21 Almoghathawi et al. developed an optimization method, which decides the maintenance priority of failed components in interdependent networks, to achieve a balance between resilience and investment cost. 22 For demand-supply networks, Hosseinalipour et al. 23 developed a maintenance resource configuration method which can effectively reduce resource allocation cost while confining cascading failures.
Although efforts have been made to prevent cascading failures, high-impact cascading failures still occur in different network systems. One of the main reasons is that a large network system comprises many distinct components, which are subjected to diverse disruptions. Therefore, a key point of analyzing cascading failures in networks is to investigate the influence of component failures and some component importance measures have been proposed from different perspectives.24,25 In practice, real-life network component importance impacting maintenance prioritization changes as network topology changes by the ongoing failures and restoration process. Therefore, identifying the components with high importance from the changing network structure to update maintenance priority readily is important. It helps to optimally allocate the limited maintenance resources to improve system recovery efficiency. 26
Dui et al. 27 combined residual resilience and some importance measures to optimize the recovery sequence of failed ports and routes in a maritime transportation system during which the traffic is dynamically redistributed. Almoghathawi et al. 28 developed a resilience-driven optimization model to address the interdependent network restoration problem, where the disrupted components might be partially restored for seeking the minimum cost associated with the recovery process. However, current research on the component importance measures of network systems in terms of the effects of component restoration on network resilience against cascading failures is very limited. Most centrality-based importance measures are closely relevant to network topology and interaction, whereas vulnerability-based importance measures mainly quantify the influence of a component failure on a certain performance of a network. 29 While none of them consider both real-time network connectivity of great importance and the impact of network maintenance on resilience during cascading failure-maintenance process.
Among network topology-based features, minimum vertex cover (MVC) is a key network component/node subset with a minimized number of network nodes so that all network edges are covered, that is, it presents a network with the fewest possible network nodes while covering all areas. Since MVC serves as an approximation of the backbone of the entire nework system, it can be used to identify critical network components from the perspective of global network connectivity importance. Figure 1 presents an example to illustrate the MVC node set in a network system, where the three middle computers circled in red form the MVC node set. MVC has been applied to different research fields, such as network security, 30 computational biology, 31 and text summarization. 32
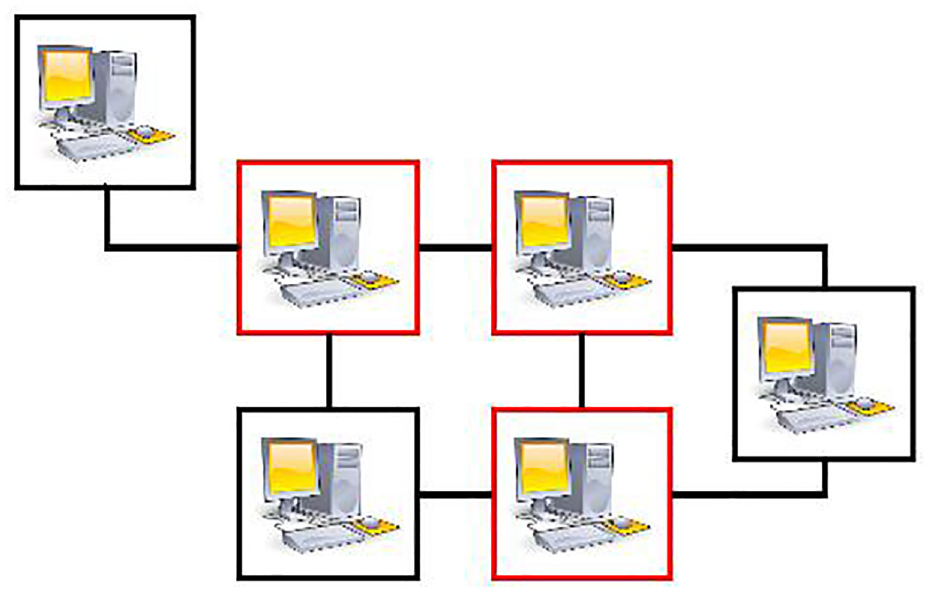
An exampl of MVC node sets in a network system.
In this paper, the authors propose a new recovery framework for network resilience enhancement against cascading failures by considering real-time global network topology information. The core of the framework is quick MVC identification, that is, identifying important system components for maintenance, based on structural graph embedding technique and deep reinforcement learning (RL)-based graph learning. By incorporating MVC into other maintenance priority strategies, the framework can optimize recovery resource allocation by real-time updating maintenance priority targets. According to the two case studies, both system loss caused by cascading failures and recovery time can be remarkably reduced using the proposed recovery framework compared with existing maintenance strategies. It demonstrates the effectiveness of our proposed method on effectively confining cascading failure and enhancing network resilience.
Background
In this section, the authors present the modeling of mixed cascading failures and three existing recovery strategies with specific preferences, which form the basis for the following case studies in the manuscript.
Cascading failure model
In this paper, a single-structured network system is presented as an unweighted, undirected, self-loop free graph G with N nodes and an adjacency matrix
Higher E(G) indicates a more efficient network load transmission. The transmission efficiency of the shortest path
35
between node i and node j is depicted by
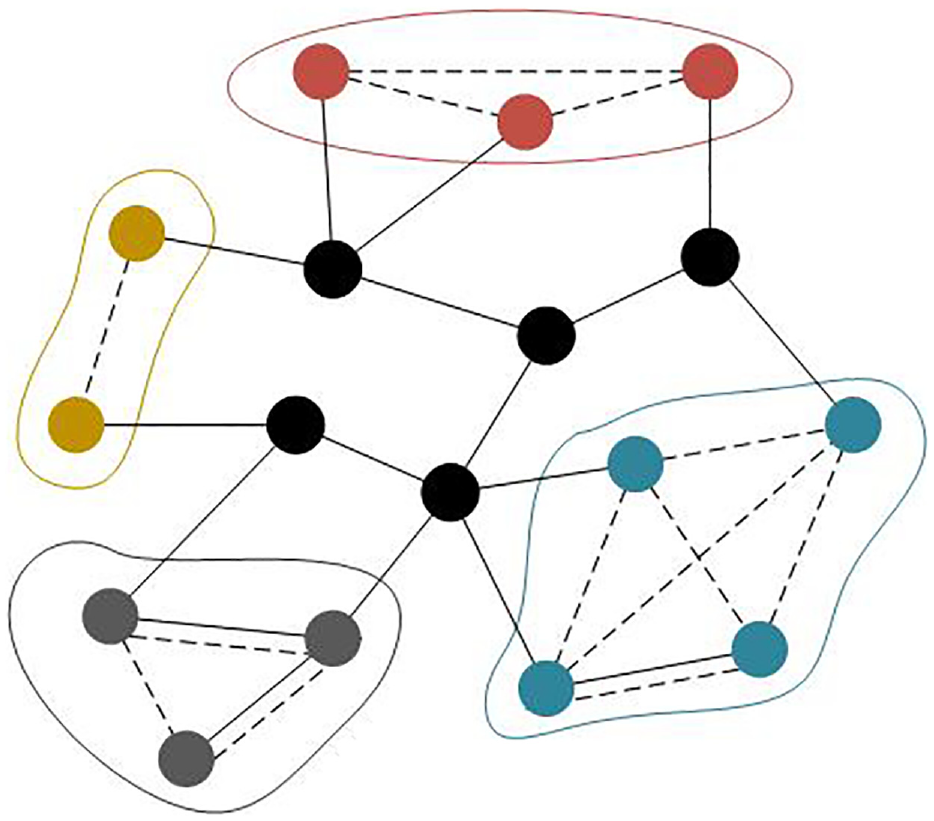
A single-structured network system with dependence node clusters.
Because the sizes of dependence clusters in a real-world network usually follow certain distributions, 37 the sizes of dependence clusters in a network system is assumed to follow a shifted/scale adjusted Poisson distribution. 6 The probability that a node belongs to a dependence cluster of size D, P(D), is obtained based on equation (2),
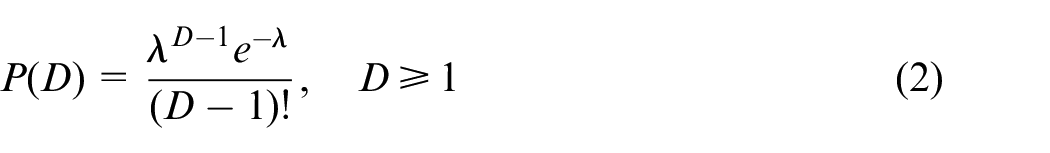
where
In summary, the mixed cascading failure model describes the iteration of two types of network failures, overloaded failures caused by load dynamics, and dependence cluster collapses caused by node dependency. The maintenance strategy was applied to restore network system when failure occurs so that a dynamical cascading failure-maintenance process could be observed.
Recovery strategy
Three different existing recovery strategies with specific preferences were employed to restore network system against cascading failures. (1) The high-degree first repair (HDFR) strategy is designed for the repair order assigned based on the degree (the number of topological connections) of failed nodes (i.e. this strategy has the preference that network nodes with higher node degrees are repaired with higher priority). (2) The shortest-time first repair (STFR) strategy assigns the repair order according to the required repair time of failed nodes. The maintenance prioritizes the failed nodes that require shorter repair time. (3) The high load first repair (HLFR) strategy prioritizes repair based on the amount of load transmitted through the failed nodes (i.e. this strategy has the preference that network nodes that carry higher loads are repaired with higher priority).
Ties, which occur when failed nodes under the same condition (i.e. degree, required repair time, or load), were broken according to the first fail/first repair policy. Once started, the repair activities of failed nodes do not stop until they are completed. For simplicity, it was assumed that the maintenance resources were available to complete repairs. The number of new repairing activities of failed nodes, which begin at each round of inspection for different maintenance strategies, is decided by the repair proportion p and total number of failed nodes in which repair activities have not yet started at the time of inspection.
As was mentioned previously, existing maintenance strategies with specific preferences rarely, if ever, consider component importance changing during the cascading failure-maintenance process. Therefore, identifying important components based on MVC from the real-time network structure is of practical significance for updating maintenance priority targets during the recovery process for effective maintenance. The authors propose a recovery framework that can combine real-time MVC importance with other preferences according to customers’ desirability (e.g., network transmission importance) to effectively restore network system from the cascading failures. Case studies were implemented on different network systems to demonstrate the effectiveness of the proposed framework. The details of the recovery framework are presented in the following sections.
Methodology
In this section, the authors propose a new recovery framework that combines MVC importance with existing maintenance strategies regarding other preferences to enhance system resilience against cascading failures. The framework is implemented by rapid MVC detection from the real-time network structure according to the graph embedding technique and the advanced RL-based graph learning.
Deep graph learning for MVC detection
MVC is an NP (non-deterministic polynomial-time)-hard computational problems, which means it requires exponential time algorithms to search for the optimal solution. Traditional methods to solve MVC can be divided into three categories: exact algorithms, approximation algorithms, and heuristic algorithms. Exact algorithms are based on enumeration or linear programming, which have exponential time complexity and are not practical for large-scale graphs. Approximation algorithms (if they are available) are faster with polynomial time complexity but do not guarantee solution quality and are not practically applicable. Heuristic algorithms are fast but do not guarantee solution quality, and they require expert knowledge and repeated designs for different problems.
RL has already shown its potential in optimization and management, and can be combined with graph embedding to derive a MVC solution efficiently. Recently, a few works have applied Reinforcement Learning (RL) to explore heuristics solutions for large-graph problems.39–41 Some other efforts use Graph Neural Network (GNN) to derive solutions for large-scale graph problems.42–44 The major difference between RL approaches and GNN approaches for graph problems is that RL approaches can automatically explore solution for the graph problems without predefined, labeled training datasets. It is important to note that for many NP-hard large-scale graph problems, it is impractical (or extremely computationally intensive) to generate appropriate training dataset. With an RL approach, it is convenient to construct reward function for the MVC problem: we simply add a constant negative value to the partial solution whenever a node is added to the solution, RL algorithms can automatically identify the best embedding and the best graph solution simultaneously during the training.45,46
In this study, the authors adopted an state-of-the-art, high-performance deep graph analysis environment (OpenGraphGym)46,47 to support MVC estimation in a very short time to provide real-time reference for maintenance priority updates. OpenGraphGym allows the authors to use several graph embeddings to represent graph attributes and features. We apply Structure2vec graph embedding
48
and deep Q-learning RL algorithm
49
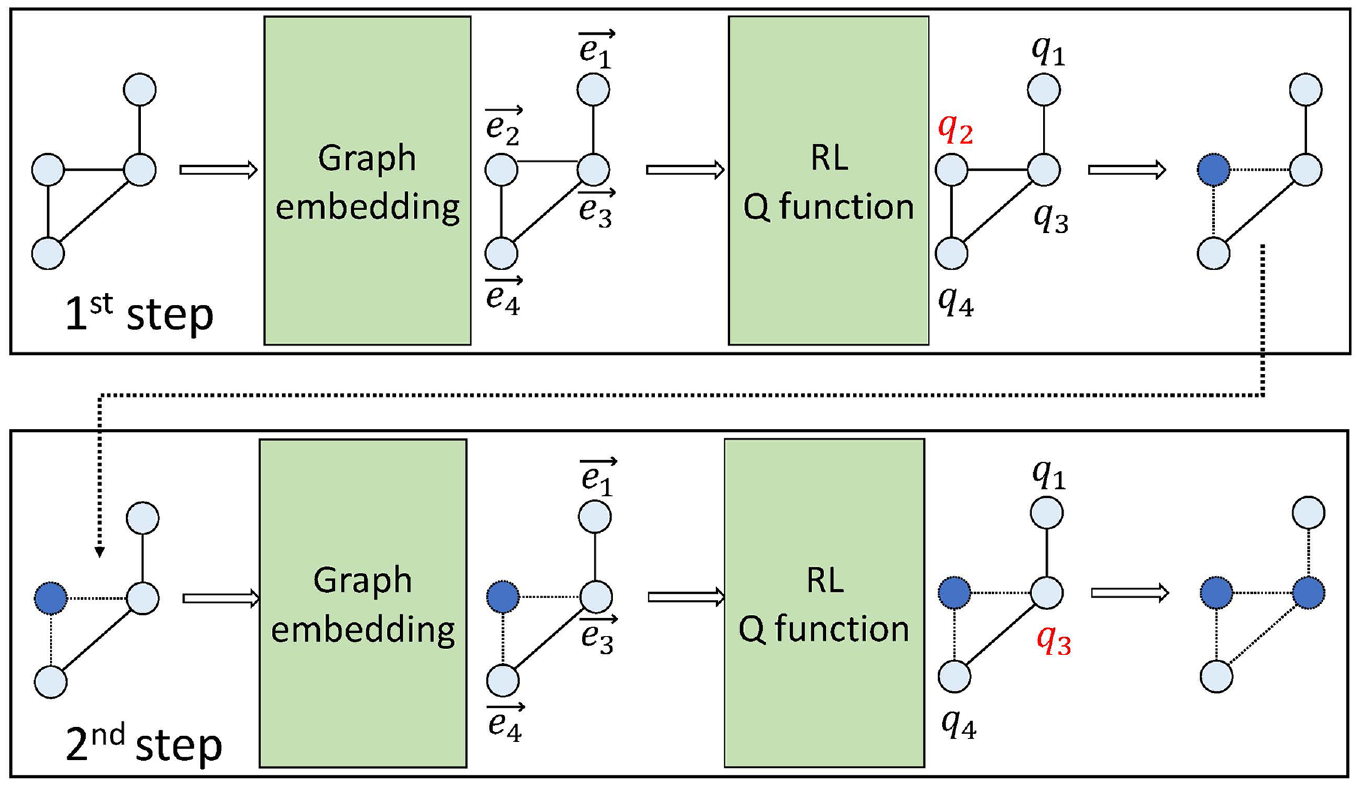
to search for the optimal MVC solution in this work (See Figure 3). Q-learning algorithm is a process of trial and error interactions between the agent and the environment.
50
The goal of Q-learning algorithm is to find an optimal policy which maximizes the rewards at each episode. We use an approximation function as the policy because of the large number of possible states. At each episode, the agent explores a new problem instance by initializing a new environment. At every step of each episode, the agent decides an action randomly or according to the policy. The environment perceives the state and returns the reward signal to the agent. The transition of state, action and reward denoted as

The diagram of the advanced RL-based graph learning for MVC detection.
Finally, each episode ends with a special termination state. Then, the agent will start a new episode with a new problem instance.
As shown in Figure 3, two major parts of the framework are graph embedding and the RL Q function. Two steps are illustrated in the figure. At each step, graph embedding takes the graph as the input and produces the embeddings for all nodes in the graph. Then, the embeddings for all nodes are sent to the RL Q function. The RL Q function computes the scores for all nodes in the graph (shown as q in Figure 3). The nodes with the highest score (e.g., q2) are marked and added to the partial solution. In Figure 3, two blue nodes are included in the partial solution.
By adding a node to the partial solution at each step, this approach provides a ranked MVC solution, which means that early selected nodes in an MVC solution generally contribute more to the final optimal MVC solution than late selected nodes. To further improve the computational efficiency to deliver a reasonable MVC solution, small graphs were used to train an MVC graph agent within the OpenGraphGym that can provide a reasonable MVC solution for relatively large graphs, which enables real-time MVC detection for real-world large scale networks. This acceleration is valid when the training graphs and testing graphs are of the same graph type and degree distribution.
MVC-based Recovery Framework
Because MVC identifies important network nodes from the perspective of global network connectivity, the proposed recovery framework combines it with the existing maintenance strategies having specific prioritization preferences for optimal maintenance resource allocation. HDFR strategy and HLFR strategy in which load is represented by betweenness centrality have already been proved to have the similar repairing effectiveness against the modeled cascading failures. 34 Therefore, real-time MVC was only incorporated with HLFR strategy and STFR strategy, respectively, to make comparisons with the existing maintenance strategies without incorporating MVC. The first/top u percentage of the nodes in MVC (the most vital nodes in the MVC node set) was assigned with a high maintenance priority. Then, the repairing of other failed nodes, which do not belong to these top u percentage of MVC nodes, are repaired following the order according to HLFR or STFR strategy. The order to start the repairing activities of the top u percentage MVC nodes, if their repairing had not yet started, was assigned based on their ranking inside of MVC. The maintenance prioritization of MVC in the recovery framework is indicated as u. Therefore, the weight of MVC for restoration is indicated by u. Bigger u denotes higher weight of MVC nodes regarding restoration priority.
The main steps of implementing the recovery framework with real-time MVC detection for system maintenance prioritization against cascading failures are briefly presented as follows:
Step 1. All network nodes are initially functional with limited capacity. Dependence clusters are created. Detect MVC of the network system.
Step 2. Randomly select nodes to break down because of initial disturbances.
Step 3. Dependence clusters collapse if CCT is exceeded. Update the network structure.
Step 4. Network loads are dynamically redistributed over the current network structure. Overloaded nodes break down.
Step 5. Failed nodes are arranged to start the repairing activities based on the maintenance strategy considering MVC importance.
Step 6. Quickly detect MVC from the current network structure.
Step 7. Return to Step 3 until system is recovered to the predetermined level.
The performance of the network system is recorded during the process of cascading failures with maintenance implementation.
Take an example of the case that MVC is combined with HLFR strategy and u = 10%. Every time at Step 5, the failed nodes belonging to the top 10% of MVC node set whose repairing activities have not been started, are repaired with top priorities (If the current MVC contains 100 nodes, only the top 10 important nodes have the top priorities to be selected to start the repairing). Then, other failed nodes, which do not belong to the top 10% of MVC set and the repairing activities have also not yet started, are repaired following the order according to the HLFR strategy if the maintenance resources are still available. Note again that only the failed nodes, whose repairing activities have not yet begun, are considered to decide the order of being repaired at Step 5. In reality, maintenance strategies are implemented with cost and different recovery prioritization usually comes with distinct investment with limitation. Therefore, there is an expressing need to improve the effectiveness and efficiency of recovery resource allocation. In this work, we focus on exploring the impact of maintenance prioritization and will consider the monetary cost associated with maintenance in future work.
Resilience metrics
In this work, system resilience loss was adopted to evaluate the maintenance effects of the recovery framework. 34 Figure 4 illustrates the changing trend of system performance after system interruptions and maintenance implementation. System interruption happens at time tI, which leads to the degradation of system performance Q(t). Maintenance actions are then applied to restore the system until Q(t) is recovered to a predetermined level Q(te) at time te. Note that the predetermined level Q(te) can be set to be the same, close to, or better than the pre-disruption level Q(tI). 34
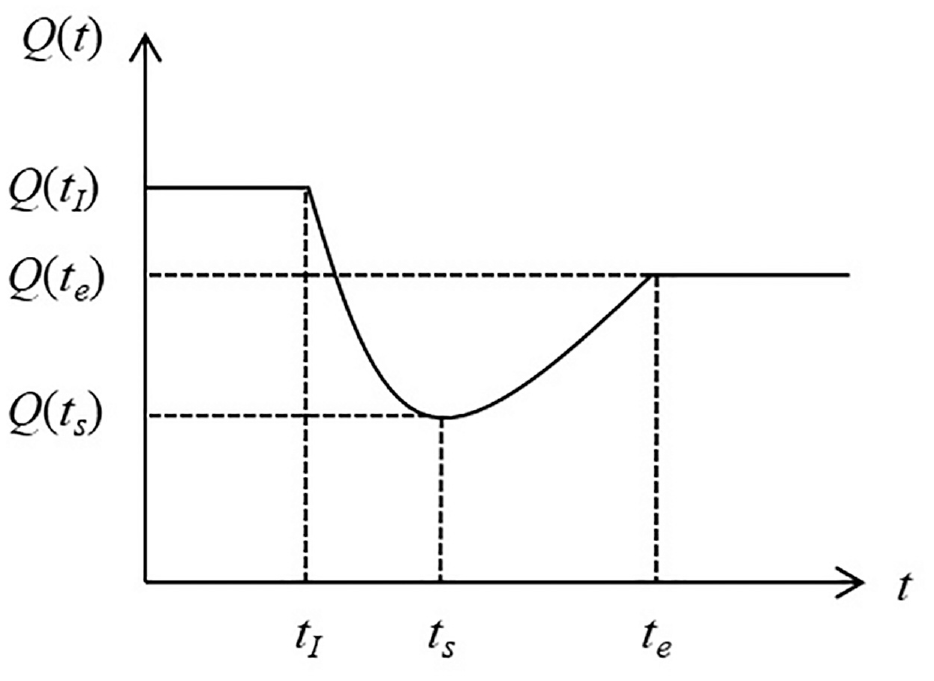
Changing trend of system performance Q(t) after system failures occur and after maintenance implementation.
System resilience loss up to time t is measured by a time-dependent metric,
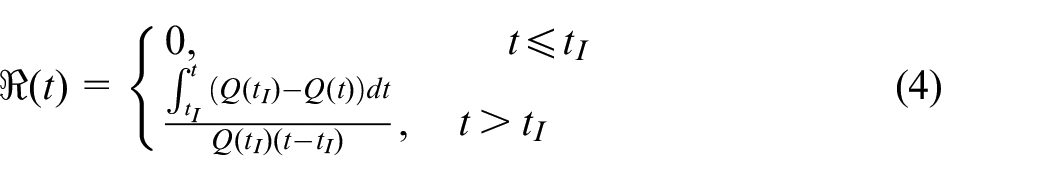
where
The predetermined system recovery level is measured by network efficiency E(G), as was described previously. The time to restore the network system to the predetermined level during the cascading failure-maintenance process, T (total repair time), reflects the maintenance effects in terms of downgrading operation time. In the following case studies, we assume that maintenance actions are conducted since the disruption event occurs, so T is the total repair time from tI to te. A shorter total repair time T is more desirable.
Case studies
Two case studies are conducted on a synthetic network structure and on a real-world network system structure. The results are presented in the following sections. To prove the effectiveness of the proposed recovery framework, three existing maintenance strategies introduced previously were implemented for comparison. The results under the existing maintenance strategies are used to compare with results from the MVC-based recovery framework.
Experiments with synthetic networks
In this case study, the mixed cascading failures are performed on a Barabási-Albert (BA) scale-free network with maintenance implementation. A BA network is a synthetic network model in which node degree distribution follows the power law
51
(i.e. the probability that the network node has degree k,
The main assumptions made in the numerical simulation are as follows, The required repair time for failed nodes are independent random variables that are uniformly distributed in1,4 in terms of simulation steps. Each simulation step represents a fixed duration of time. Once the repairing of a node is started, it does not stop until it is completed. CCT is 0.7 (i.e. dependence clusters instantly collapse once the failed nodes inside exceeds 70%). The maintenance process stops when network efficiency is recovered to 95% of its initial value. The proportion of total failed network nodes, where repair activities have not yet started, are selected to start repairing at each round of inspection, p = 0.6.
The adopted BA network examples have 250 nodes with an approximate edge probability of 0.1. To minimize random errors, the authors simulated the cascading failures triggered by 10 different sets of initial random failures of nodes, for each of which they randomly generated a different number of BA network realizations following the specific network scale. The 10 sets of different numbers of randomly initial failed nodes (v) are 9, 15, 21, 27, 33, 39, 45, 51, 57, and 63, accounting for about 4 to 25% of the total network nodes.
MVC graph agent development and implementation
To improve computational efficiency, the authors created 400 BA graphs of 20 nodes with an approximate edge probability of 0.1 to train the MVC graph agent. These training BA graphs are generated using the function “barabasi_albert_graph” in the graph manipulation library networkX. 53 This function can be used to create scale-free networks using BA network model. 51
The trained MVC graph agent is tested on random graphs. For the targeted 250-node BA networks with edge probability around 0.1, the agent provided the MVC solution with the average size of 202, whereas the average size of MVC solutions given by a 2-opt MVC solver in networkX is around 225. The solution size obtained from the networkX solver is theoretically guaranteed to be less than two times the optimal solution size. 54
Based on the trained MVC graph agent, MVC is estimated from the real-time BA network structure changed by the ongoing cascading failures and maintenance implementation. Then, the maintenance priority is updated according to the current MVC and the other maintenance preference.
Results and discussion
MVC is combined with HLFR and STFR, respectively, to perform the proposed recovery framework to dynamically update the maintenance priority. The parameter u, which determines the top percentage of MVC nodes that have high maintenance priorities, are top 10%, top 30%, top 50% of the nodes in MVC, respectively. Figure 5 presents the average resilience loss and T vs. v in BA networks under the proposed recovery framework and three existing maintenance strategies. The presented results under the existing maintenance strategies for each v correspond to an average of over 90 network realizations. The results under MVC-based recovery strategies are averaged over 20 realizations. D-size exerts a notable influence of dependence clusters on network robustness against mixed cascading failures, for example, both recovery time and network collapse threshold are impacted by D-size. 6 Scenarios with different D-size are also considered, that is, D-size = 4, 8, 12, 16, respectively. The curves shown in Figure 5 are averaged over the results of the scenarios with the four values of D-size.
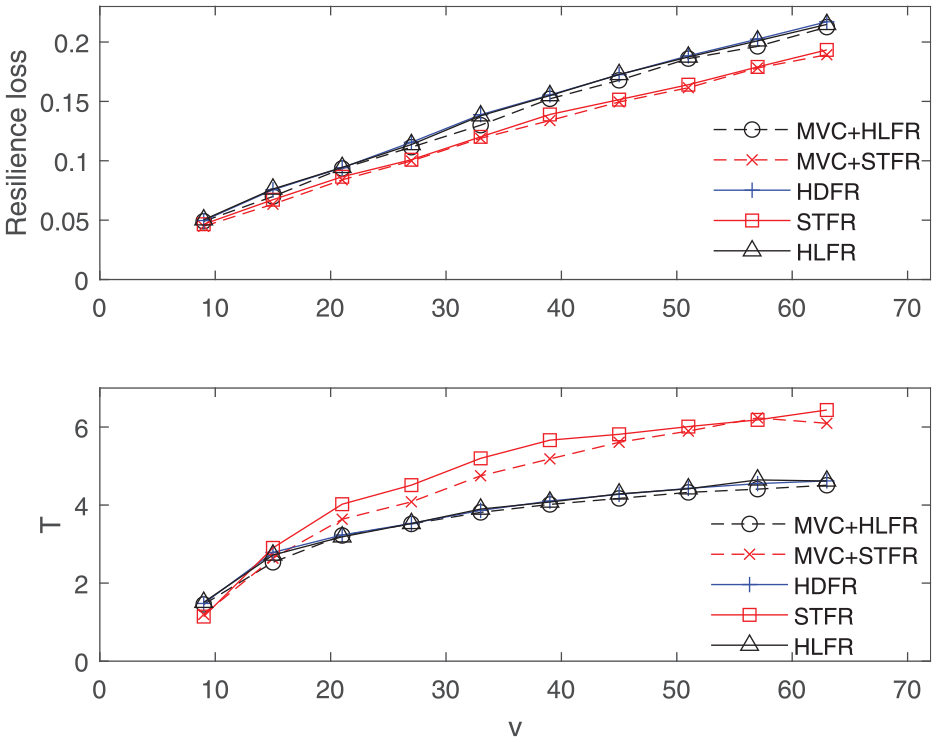
Average results of resilience loss and T as a function of the number of initial failed components v for the proposed recovery framework vs. existing maintenance strategies.
As shown in Figure 5, resilience loss increases as v increases because a larger number of initial randomly failed nodes triggers more dramatic cascading failures, which leads to more damage to the system performance. STFR shows better maintenance effects on reducing resilience loss than those of HDFR and HLFR. MVC + STFR method presents the best maintenance effects on mitigating resilience loss, and MVC + HLFR performs better than HLFR. T also increases as v increases, which is consistent with the changing trend of resilience loss,
Average results under different maintenance strategies.
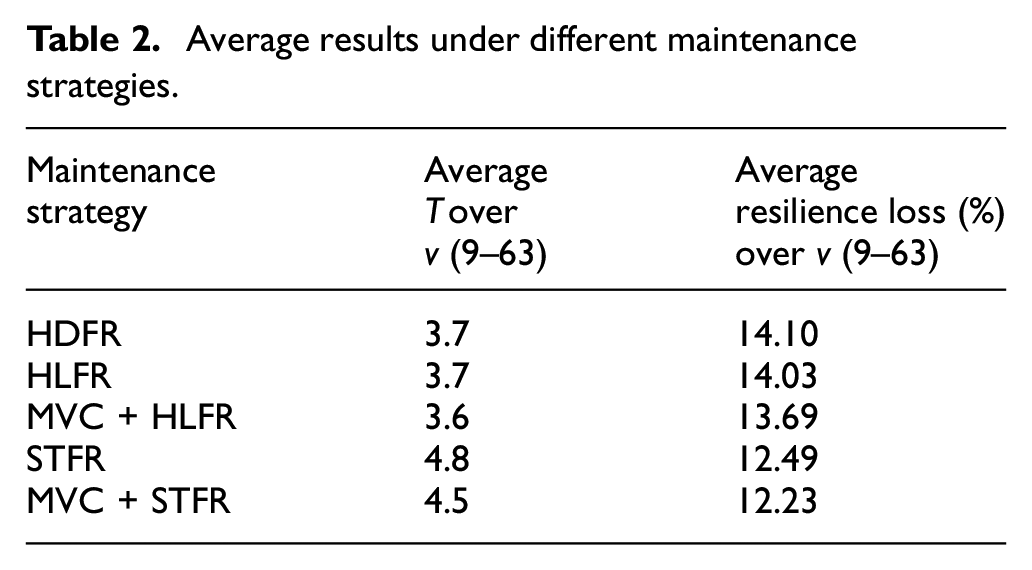
According to Table 2, MVC + STFR, which combining global network connectivity importance with repair time preference, performs better than STFR. MVC + HLFR method, which considers the importance of global network connectivity and transmission capability, has better maintenance effects than HLFR. These results indicate that the proposed recovery framework updating the maintenance priority by incorporating real-time MVC importance with other maintenance prioritizations has better maintenance effects on reducing resilience loss and shortening T than the existing strategies.
Experiments with the US Top 500 airport network
Disruptions of air transportation systems, caused by events, such as extreme weather and attacks, can lead to huge economic losses. 55 Studies have been conducted on the robustness of air transportation networks subject to interruptions. 56 A case study is conducted on the US top 500 airport network with the largest amount of traffic from publicly available data. 57 This real-world network system consists of 500 nodes and 2980 edges. Network nodes denote airports, and edges represent air routes between airports. Mixed cascading failures and maintenance are implemented into this system to investigate the maintenance effects of different strategies. Figure 6 depicts the US top 500 airport network using the visualization tool Gephi. 47 The darker colors represent the nodes with more significant degrees. Some hub nodes have larger degrees than other nodes.
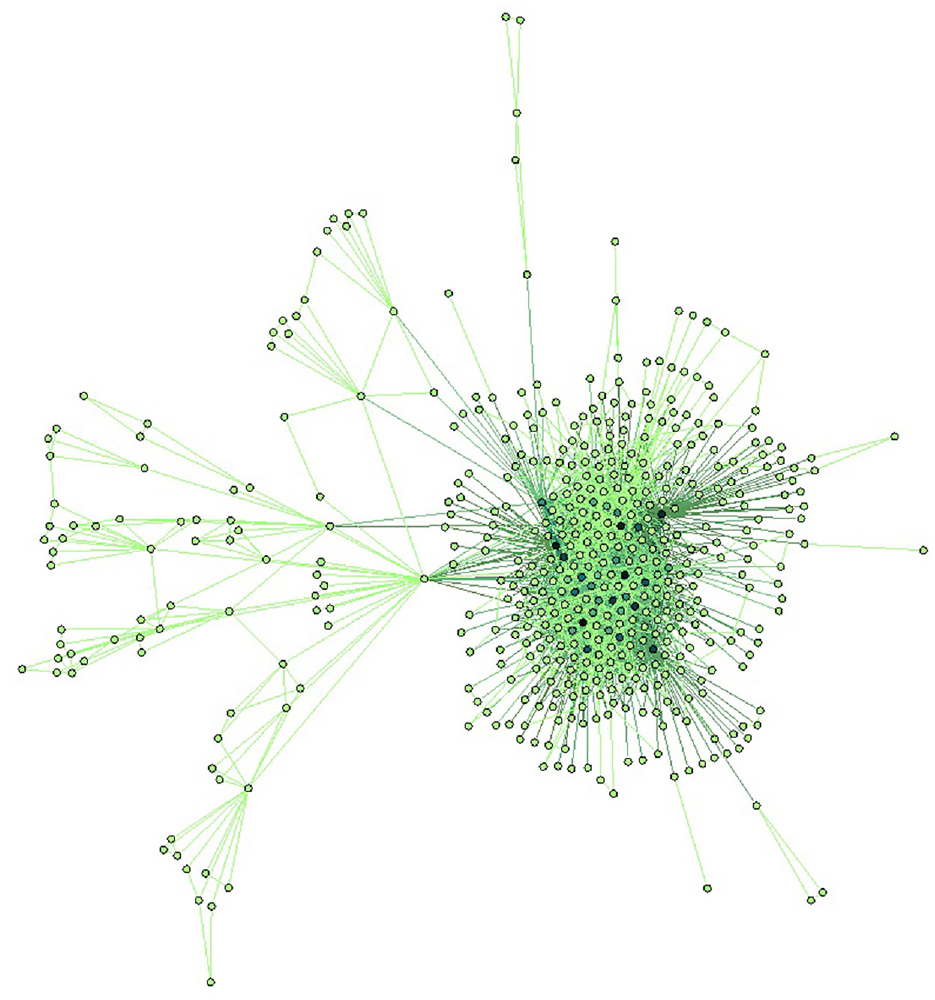
Visualization of the US top 500 airport infrastructure network.
MVC graph agent development and implementation
The authors generate 1000 training networks by randomly removing a part of the nodes from the original airport network. The number of nodes in the training networks ranged from 300 to 480 based on the observation of the number of functional nodes in the system during the recovery process. The number for different sizes of training networks is presented in Table 3.
The percentage of training graphs with different sizes.
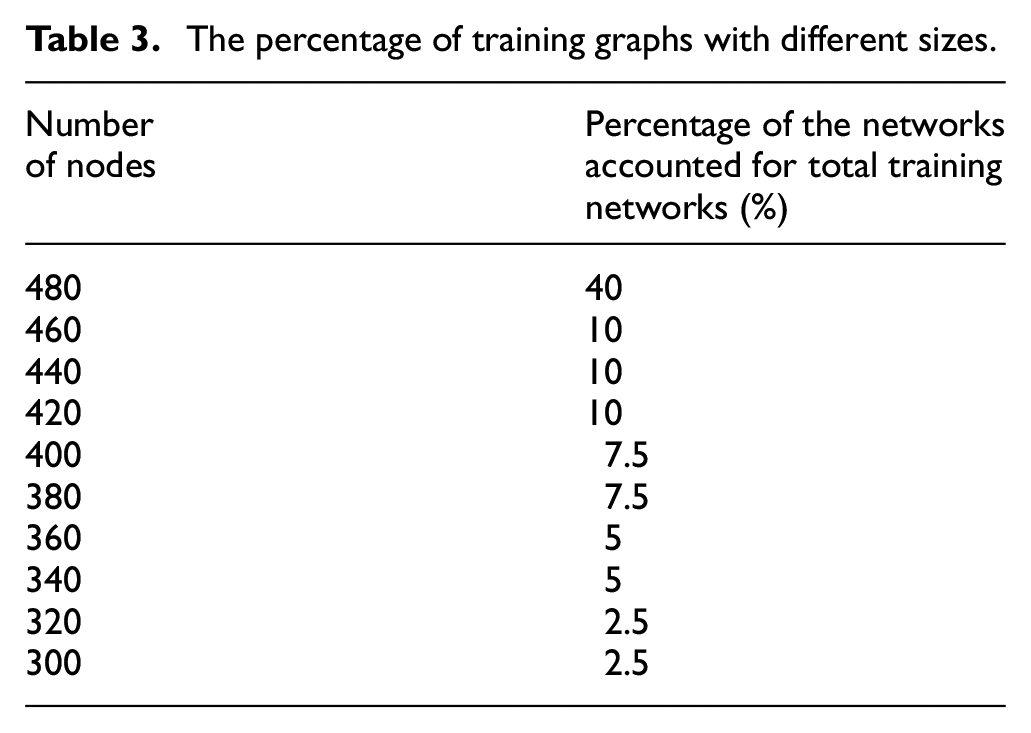
The average size of the MVC solution found by the trained agent (around 234) is better than that from the 2-opt solver in the networkX library (which is 294).
The maintenance actions are implemented once the cascading failures were triggered. MVC is calculated from the real-time BA network structure during the recovery process based on the trained MVC agent. Then, maintenance priority targets are updated according to the current MVC and the other maintenance preference that was considered.
Results and discussion
Similar to the previous case study, the values of parameter u are set to be top 10%, 30%, and 50%, respectively, for simulation in this case study. Figure 7 shows the average resilience loss
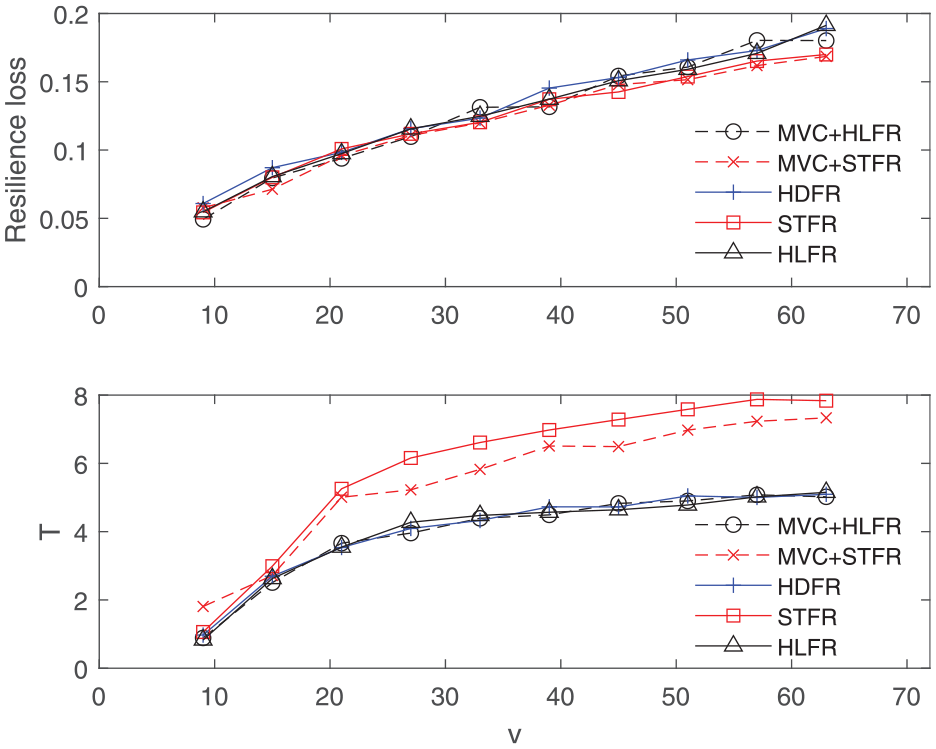
Average results of resilience loss and T as a function of the number of initial failed components v for different maintenance strategies.
Similar to what was observed from the results on BA networks, resilience loss
It also can be seen from Figure 7 that the growth rate of T is reduced when v exceeds a noticeable threshold. The threshold of v in the changing trend of T is around 20 (i.e. about 4% of the total network nodes). This finding is in accordance with the results in 34 under different repair strength and dependency strength. It indicates the robustness of the US top 500 airport network to cascading failures regarding recovery time. Table 4 presents the average results regarding D-size for different scenarios under the existing maintenance strategies and the proposed recovery framework incorporating MVC.
Average results under different maintenance strategies.
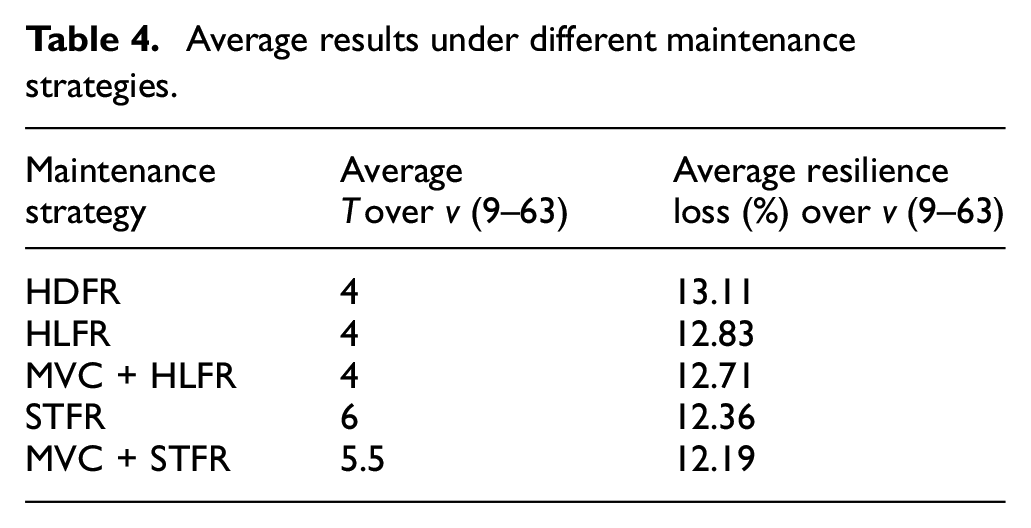
Based on Table 4, both MVC + HLFR strategy and MVC + STFR strategy show better maintenance effects compared with that of single HLFR or STFR strategy on reducing resilience loss
Conclusions
In this paper, the authors propose a network recovery framework that updates maintenance priority targets based on the changing importance of system components during the process of cascading failures and maintenance. The recovery framework incorporates global network connectivity importance represented by MVC to existing maintenance prioritization strategies to optimize the maintenance priority at each round of inspection. An efficient MVC calculation from the updating network structure is the key step, and the authors provide a desirable solution through OpenGraphGym with graph embedding and deep reinforcement learning.
Case studies are conducted on BA networks and the US top 500 airport network by employing the proposed recovery framework against cascading failures. MVC estimation is incorporated into two existing maintenance strategies with different maintenance prioritization weights. Maintenance effects in terms of resilience loss regarding network load and recovery time are remarkably improved by considering real-time MVC in the maintenance prioritization strategy, which demonstrates the effectiveness of the proposed recovery framework.
This work supports the necessity and significance of updating maintenance priority based on real-time importance of system components during system recovery. The recovery framework will be applied to other real-life network systems in future work and monetary costs and benefits will be included to make a real-world optimization problem. To make the framework more practical, quick detection of MVC in a large network system is one direction of the authors’ future work. How to determine the importance of MVC in the joint maintenance prioritization remains an unexplored question, which is complicated by extending to a general network topology. This question will be another direction of future research.
Footnotes
Declaration of conflicting interests
The author(s) declared no potential conflicts of interest with respect to the research, authorship, and/or publication of this article.
Funding
The author(s) disclosed receipt of the following financial support for the research, authorship, and/or publication of this article: This work was supported by the National Natural Science Foundation of China (No. 72101116), the Natural Science Foundation of Jiangsu Province (No. BK20210317), and the Fundamental Research Funds for the Central Universities (No. 30921012204).