
Abstract
Anecdotal evidence suggests that English professional football has changed substantially over the 6 seasons 1973–4, 1983–4, 1993–4 to 2023–4. The investment by satellite television has increased the financial rewards for success, leading to remarkable changes in the players’ fitness, body shape, age and risk of injury. The current aims of the study were to identify some of these changes such as the frequency of use of substitutes, players’ height, body mass, the reciprocal Ponderal index and age over the 6 seasons using data obtained from football year books. Results confirm that players continue to become taller and more linear identified using the reciprocal Ponderal index, a trend observed with goalkeepers and defenders rather than midfielders and attackers. The body mass of players has also declined over the past three decades. There has been a steady increase in the use of substitutes almost entirely due to frequent changes to the substitution rule, a trend where substitutes appear to be replacing defenders rather than midfielders or attackers. Successful teams also use less substitutes, preferring to play their first-choice players, compared with less successful teams. Players from successful teams remain consistently younger than players from less successful teams, a testament to the value of, and investment in, youth academies. In conclusion, top-flight teams continue to recruit taller and less heavy (ectomorphic) players, a trend that was only observed by successful teams in 2003 (the year of Arsenal's Invincibles) but is now recognised by all Premier League teams.
Introduction
Professional football has undergone significant transformation over recent decades, developing into a global, multi-billion-dollar industry. In 2019, global transfer spending by football clubs exceeded €10 billion, 1 more than tripling over the previous decade in line with rising revenues across Europe. 2 While recruitment through transfers remains vital, clubs also invest heavily in their youth academies, seeking to develop home-grown talent and identify players with the potential to progress into the first team. 3 The physical demands of top-flight football have also developed, with elite football matches being played at a higher intensity, with greater total distances covered, more high-speed running efforts, and increased sprint efforts and distances. 4
Changes in body shape and age
Differences in player anthropometry and body composition of professional footballers have been reported across various elite leagues, and this is frequently linked to playing position and the requirements of positional demands. 5 For example, there is evidence of trends toward taller defenders and forwards where height offers a distinct mechanical advantage in aerial duels and goal coverage. 5 Nevill et al. 6 analysed body size and shape of players in the top English division over five decades, using data from the 1973–74, 1983–4, to 2013–14 seasons. They found that although both height and body mass increased in a linear fashion, there were no differences between players from successful and less successful teams (with success defined as finishing in the top six of the division that qualified for European competitions, i.e., UEFA Champions League, UEFA Europa League and the UEFA Conference League). However, Nevill et al. 6 were able to identify that a key body-shape parameter, the reciprocal Ponderal index (RPI), was able to discriminate between players from the successful teams compared with players from the less successful teams. The RPI is calculated by dividing a player's height by their body mass (cm/kg0.333). Another body-shape characteristic, body mass index (BMI), may be a possible indicator of successful footballers. 6 In the general population, BMI is normally interpreted as a measure of excess body mass or adiposity. In athletes, however, especially power athletes such as middle-distance runners, BMI has been shown to be associated with lean body mass rather than fat mass. Building on earlier findings, Nevill et al. 6 reported that English top-division professional footballers are getting more angular and ectomorphic. They speculated that the decline in BMI and rise in RPI that they observed was due to improved quality of pitches and increased workload required by modern-day players.
The age at which players reach their ‘peak’ performance is a recurring topic of both anecdotal and academic debate. 7 A club's perception of when players peak influences decisions around contracts, transfer fees, and long-term squad planning, 7 and this has been highlighted in managerial practice. Former Arsenal manager Arsène Wenger, for instance, initially argued that a player's physical performance typically declined after the age of 30. 8 More recent evidence supports this, with Rey et al. 9 reporting that professional soccer players aged over 30 exhibit a significant decrease in a range of running performance measures compared with younger players. In their study exploring the height, body mass and ages of all players from the English top-division over the seasons 1973–4, 1983–4, 1993–4, 2003–4 and 2013–4, Nevill et al. 6 reported that age (being younger) was the only characteristic that consistently differentiated successful with less successful players/teams. Longitudinal studies are therefore a useful tool to determine which specific characteristics are associated with success, offering evidence-based guidance for recruitment and contract management strategies. In addition to his views on age, Wenger introduced a new focus on nutrition and conditioning, a philosophy exemplified during Arsenal's unbeaten ‘Invincibles’ season of 2003–04, in which the team recorded 26 wins and 12 draws. Wenger 10 later emphasised that nutrition is a crucial, yet often underappreciated, factor in elite performance. From a coaching perspective, the objectives of nutrition include ensuring players maintain optimal body composition, accelerating recovery after matches and training, and providing sufficient fuel to sustain high-intensity performance across the full duration of a game.
The use of substitutions
A major contributor to the evolution of the modern game is the deployment of substitutions. Substitutions have always played a crucial tactical role in football, 11 from their introduction in the 1965–66 season to the modern era of five substitutions plus concussion substitutes. Research shows that the shift from three to five substitutions in European leagues has transformed the substitutes’ role and allowed teams to better manage player fatigue, introduce fresh energy at key points during the game, and make more flexible tactical changes throughout matches. 12 These changes to the use of substitutions have been linked to match outcomes, with substitutes in winning teams having higher sprint distances and number of higher speed runs. 13 It has also led to more frequent half-time substitutions, delayed in-game changes to optimise second-half strategies, and greater opportunities for trailing teams to press offensively via introducing more offensive players. Importantly, the rule change introduced in the Premier League in 2023 increasing the number of allowed substitutes from three to five has also reduced the final score differences, suggesting enhanced competitive balance, as weaker teams can now use additional substitutions to challenge stronger opponents. 12 Overall, substitutions not only manage physical demands but also play a decisive role in altering match dynamics and outcomes. 12 Analysing the rate, timing, and characteristics (e.g., age, body size, RPI) of players substituted both on and off the pitch provides a mechanism for understanding coaching tactics and the relationship between the use of substitutions and team success.
Despite the acknowledged importance of evolving player characteristics (anthropometric and age-related) and the use of substitutions, there is limited understanding of how the characteristics of elite professional footballers and the use of substitutions in the English top-flight have changed over an extended period.
Hence, the purpose of this article is to identify how the use of substitutes have evolved over the past 6 decades, and to assess whether any key body size, shape and age characteristics of players from teams from the English top division might be associated with more successful teams and whether such characteristics might have evolved differently (between successful and less successful teams) over time.
Methods
Since the data used in this study were in the public domain (obtained from books and the internet), ethics committee approval and informed consent were not required.
The number of games played by Premier League players, either as the first choice starting eleven or substitutes, together with their body sizes (height and mass) and age were collected from English First Division or Premier League teams across the seasons 1973–4, 1983–4, 1993–4, 2003–4, 2013–4 and 2023–4. These data were obtained from Rothmans Football Yearbooks 1974–5, 1984–5 and 1994–5,14–16 the Sky Sports Football Yearbooks 2004–5, 2014–517–18 and the Utilita Football Yearbook 2024–5. 19 Note that age was available only for the four most recent seasons, 1993–4, 2003–4, 2013–4 and 2023–4. The data were directly reported from FA Premier League and Football League Clubs for compilation in the Football Yearbooks. A ten-year interval was chosen to avoid many players from being included in two overlapping data sets, i.e., we considered a ten-year gap to be sufficient time to allow the development of a new generation of players.
From the players’ height (m) and mass (kg) we were able to calculate their body mass index BMI (kg/m2) and reciprocal Ponderal index (RPI) (cm/kg0.333). The RPI is calculated by dividing a player's height by their body mass (cm/kg0.333), often referred to as the linear somatotype ‘Ectomorphy’. Individuals who have a high RPI tend to be thin, lean, with a light build, small joints and lean muscles. Such individuals are usually associated with success in sports such as long-distance running. 20
In the general population, BMI is normally interpreted as a measure of excess body mass or adiposity. In athletes however, especially power athletes such as middle-distance runners, BMI has been shown to be associated with lean-body mass rather than fat mass. 20 Nevill et al. 2010, 20 found that the BMI of male middle-distance runners and male squash players was negatively associated with adiposity (using the sum of skin folds) and hence, for these male athletes, BMI is positively associated with fat-free mass and/or muscle mass.
Statistical methods
The number of games played by top-flight English league players, either as the first choice starting eleven or as substitutes during the 6 seasons (1973, 1983, …. 2023), was analysed as a binomial proportion (p) as the response variable (see Nevill et al.)
21
(for example, in the 2023 season, Martin Odegaard played 35 out of a total of 38 games for Arsenal, p = 35/38 = 0.92) using a logit regression model (available using the probit analysis in SPSS). The logit model estimates the probability (p) or odds of an event, in our example being available and selected to play for Arsenal during the 2023 season, as follows:

Differences in body-size parameters (height and weight), shape parameters (BMI and RPI) and age were assessed using a three-way ANOVA (the fixed factors being the 6 seasons, the 5 players positions and whether the teams were successful or not, i.e., in the top 6 at the end of the season.
Results
The percentage of games played by players by position and the 6 seasons are given in Table 1. Goalkeepers play the highest mean percentage of games played per season (75%), followed by defenders (69.2%), midfielders (69.7%), strikers (67.8%) and substitutes (34.7%).
The percentage of games played by players by position over the 6 seasons.
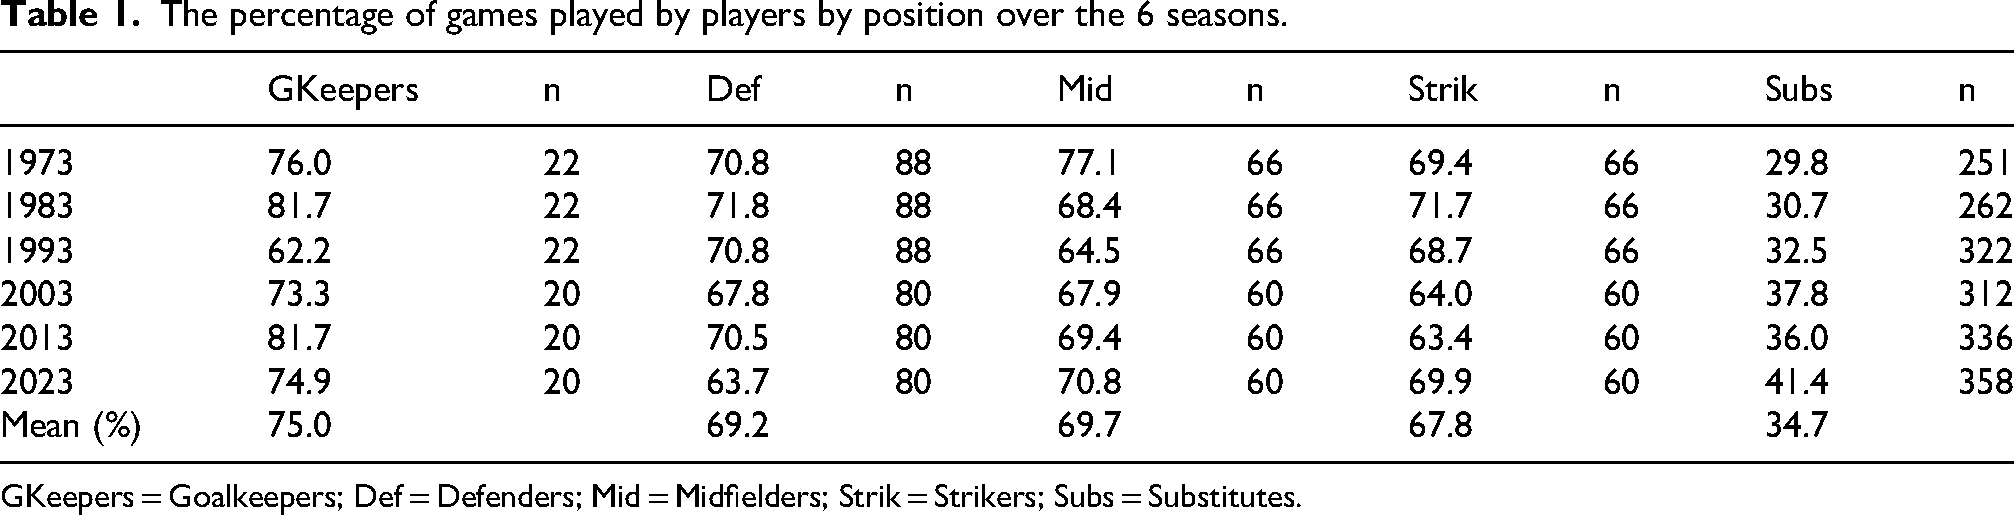
GKeepers = Goalkeepers; Def = Defenders; Mid = Midfielders; Strik = Strikers; Subs = Substitutes.
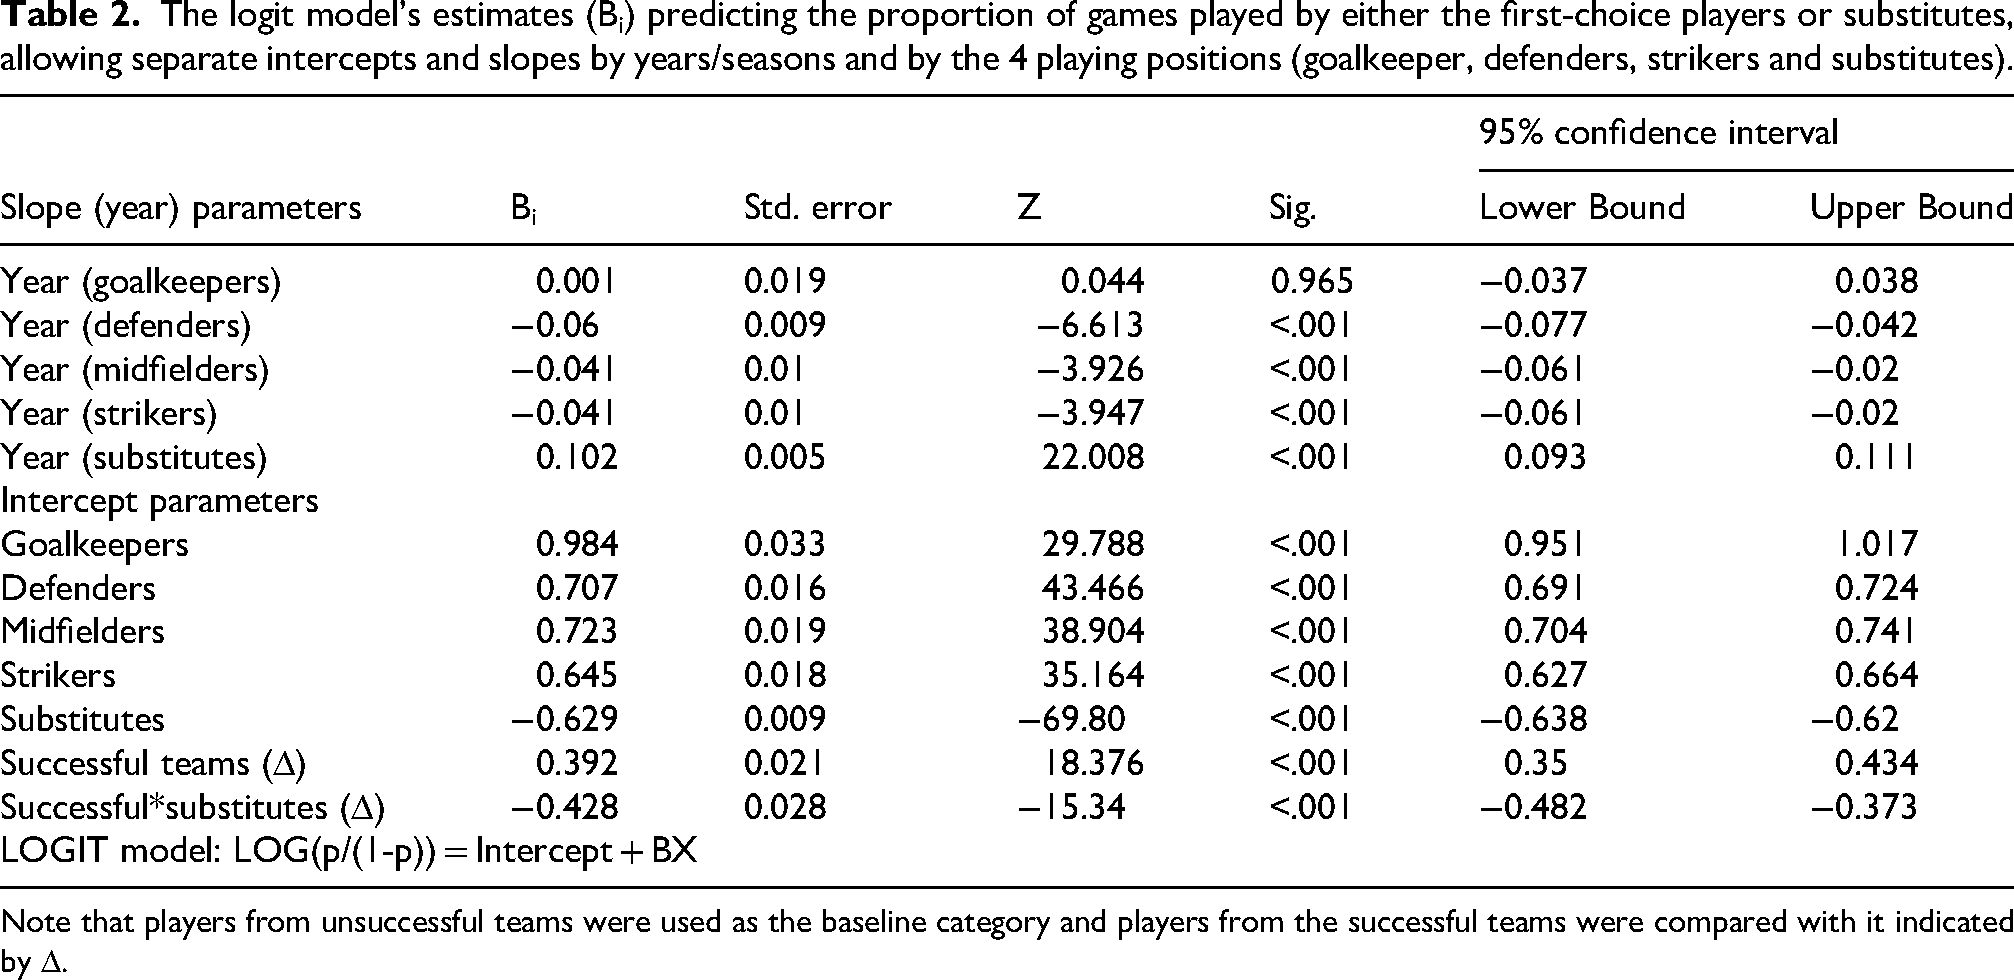
The variables incorporated in the logit model are,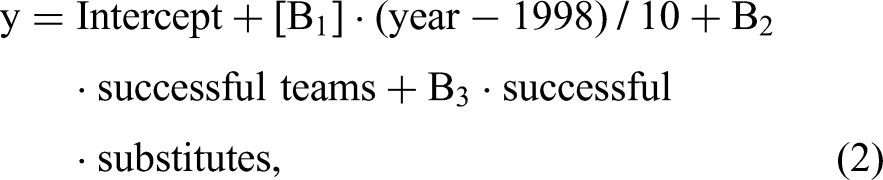
The logit model's estimates (Bi) predicting the proportion of games played by either the first-choice players or substitutes, allowing separate intercepts and slopes by years/seasons and by the 4 playing positions (goalkeeper, defenders, strikers and substitutes).
Note that players from unsuccessful teams were used as the baseline category and players from the successful teams were compared with it indicated by Δ.
The results of the logit model can be interpreted as follows using, for example ‘unsuccessful’ defenders in 2023, where the logit model is given by y = Defenders intercept + [Defenders slope] *(2023–1998)/10 = 0.707–0.06*2.5. The logit model predicts the proportion of games played by unsuccessful defenders in 2023 to be p = exp (0.707–0.06*2.5) / [1 + exp (0.707–0.06*2.5)] = 0.636. In contrast, for substitutes also playing in 2023, the logit model is given by y = Substitutes intercept + [Substitutes slope] *(2023–1998)/10. Hence, the logit model predicts the proportion of games played by substitutes in 2023 to be p = exp (−0.629 + 0.102*2.5) / [1 + exp (−0.629 + 0.102*2.5)] = 0.408, where the 2023 season is 2.5 decades above the mid-point year 1998. These trends are clearly seen in Figure 1(a). The logit model also identified two additional (B) covariates, i.e., (B2) that successful teams (top 6) used significantly higher proportion of first choice players and (B3) fewer substitutes, see Table 2 and Figure 1(b).
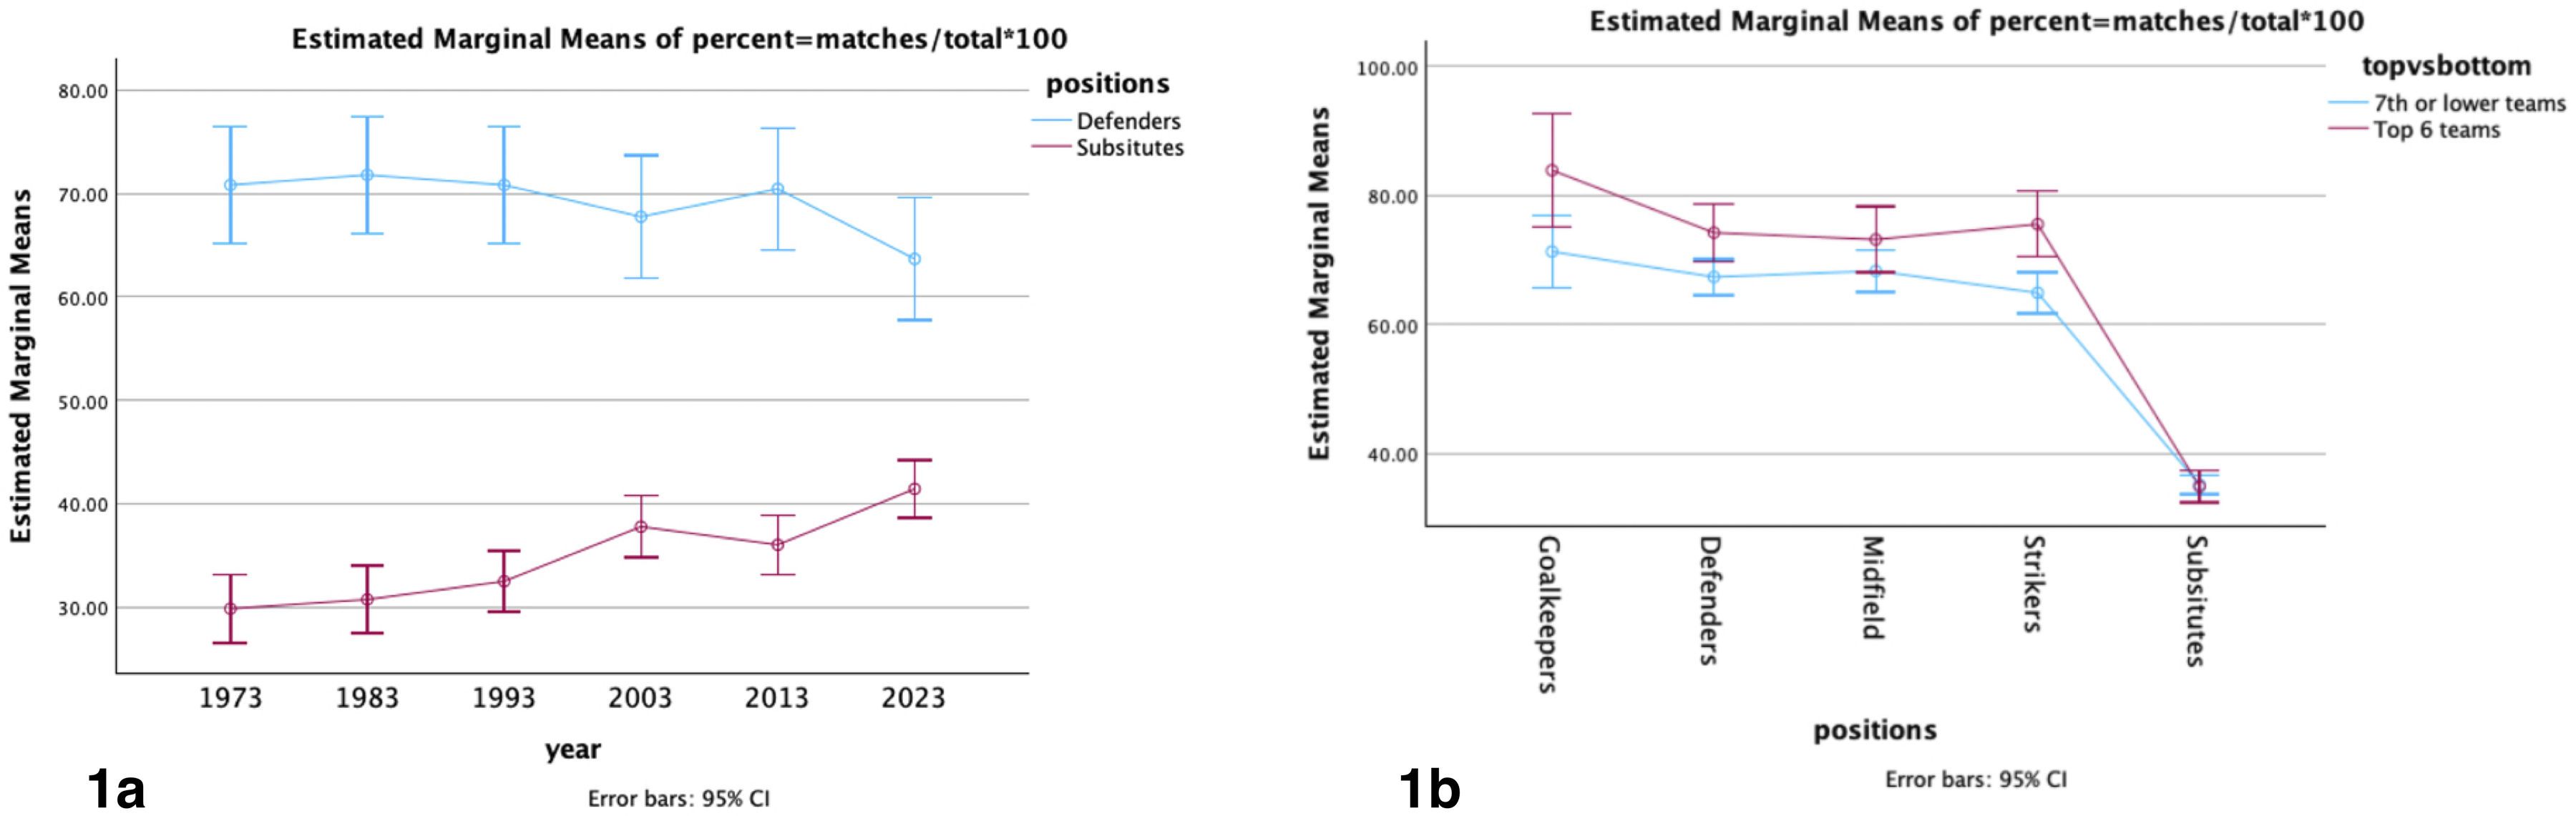
The percentage of games played, a) over the 6 decades/seasons by defenders and substitutes, and b) by successful vs less successful teams by playing positions.
By observing the logit slope and intercept parameters in Table 2 we can confirm that the use of substitutes has increased significantly over the past 6 decades, with a positive slope (0.102; P < 0.001) and a negative intercept parameter (−0.629; P < 0.001). Note that these substitutes appear to replace predominately defenders with a negative slope parameter (B = -0.060; P < 0.001) although to a lesser extent by midfielders and strikers with less steep slope parameters, both (−0.041; P < 0.001).
The three-way ANOVA of height revealed significant differences over time (decades) (P < 0.001), playing position (P < 0.001) (Figure 2(a)) and a time-by-position interaction (P = 0.002) (Figures 2(b)). The interaction identifies that goalkeepers and defenders continue to get taller at a faster rate, in contrast to midfielders and strikers whose height appears to plateau in more recent years. There was no difference in the height of players between successful vs less successful teams.
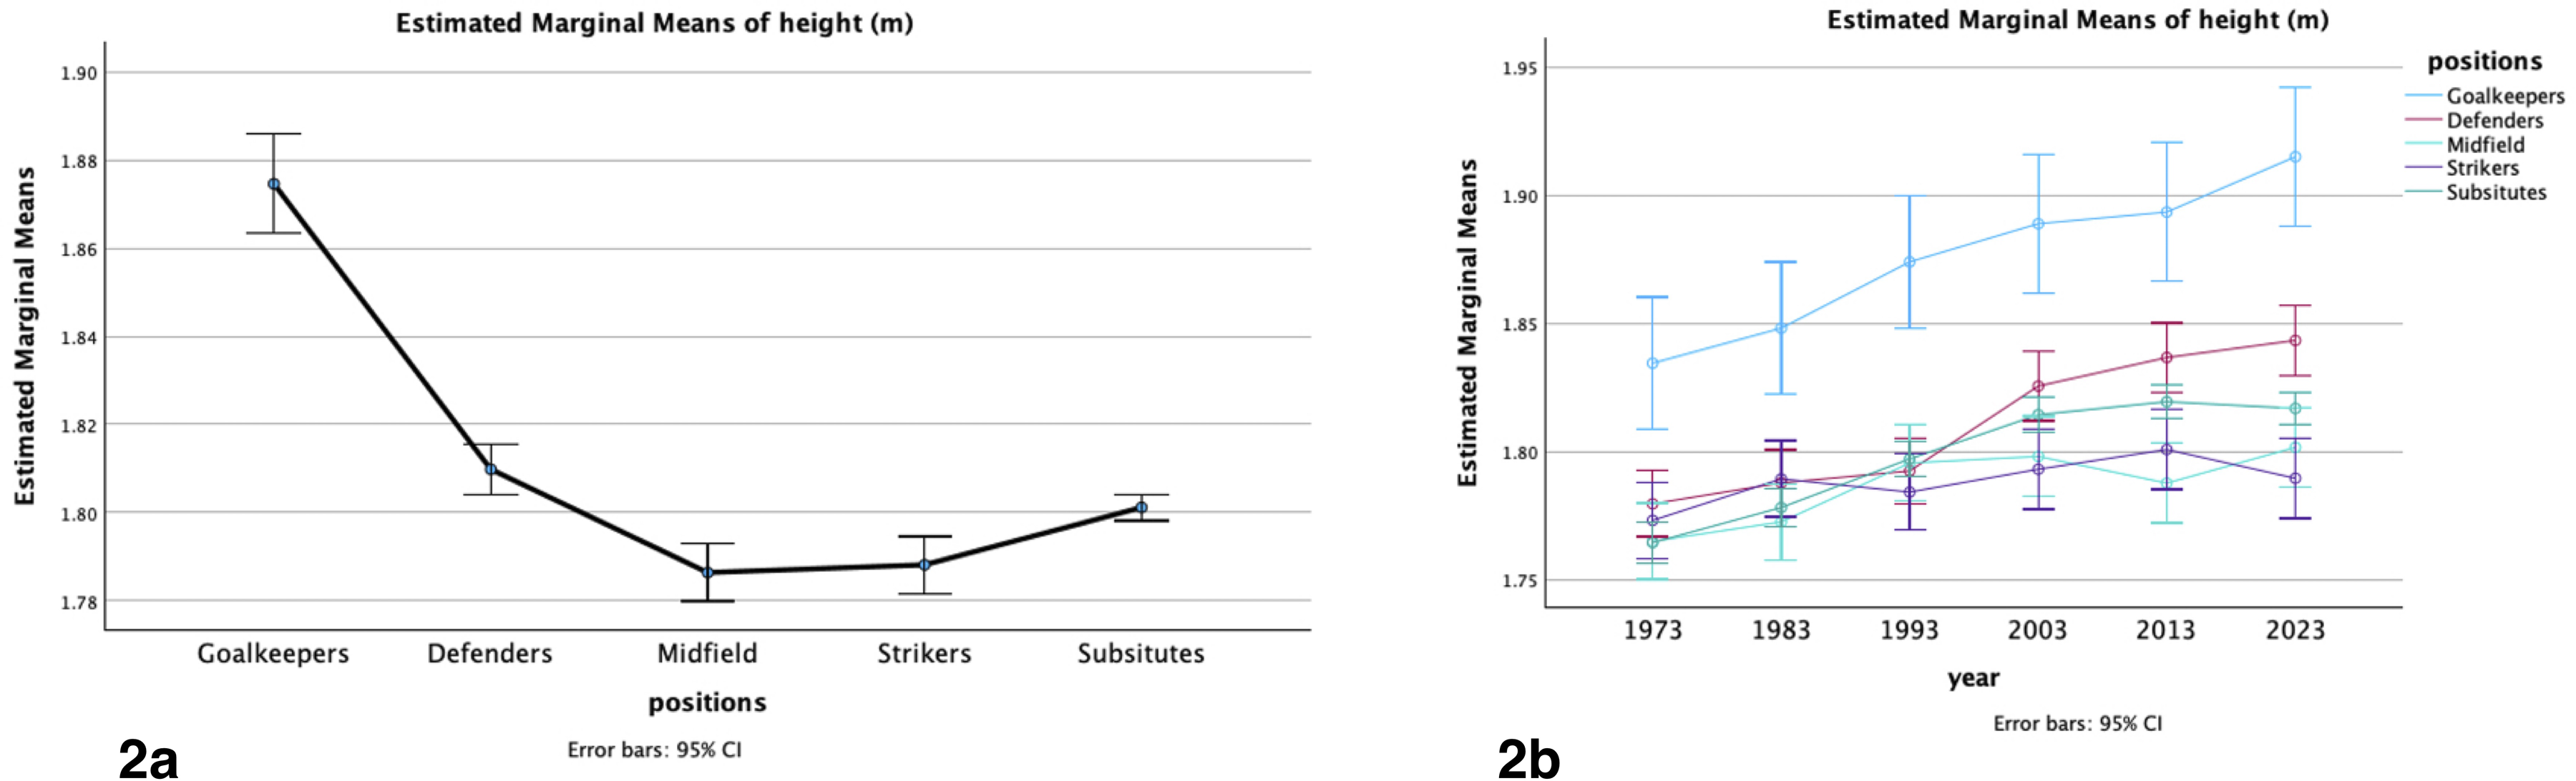
The height a) by playing position, and b) height by time/seasons and by playing position.
The ANOVA of body mass revealed significant differences over time (decades) (P < 0.001), position (P < 0.001) but no time-by-position interaction (see Figures 3(a) and (b)). There was no difference in the body mass between successful vs less successful teams.
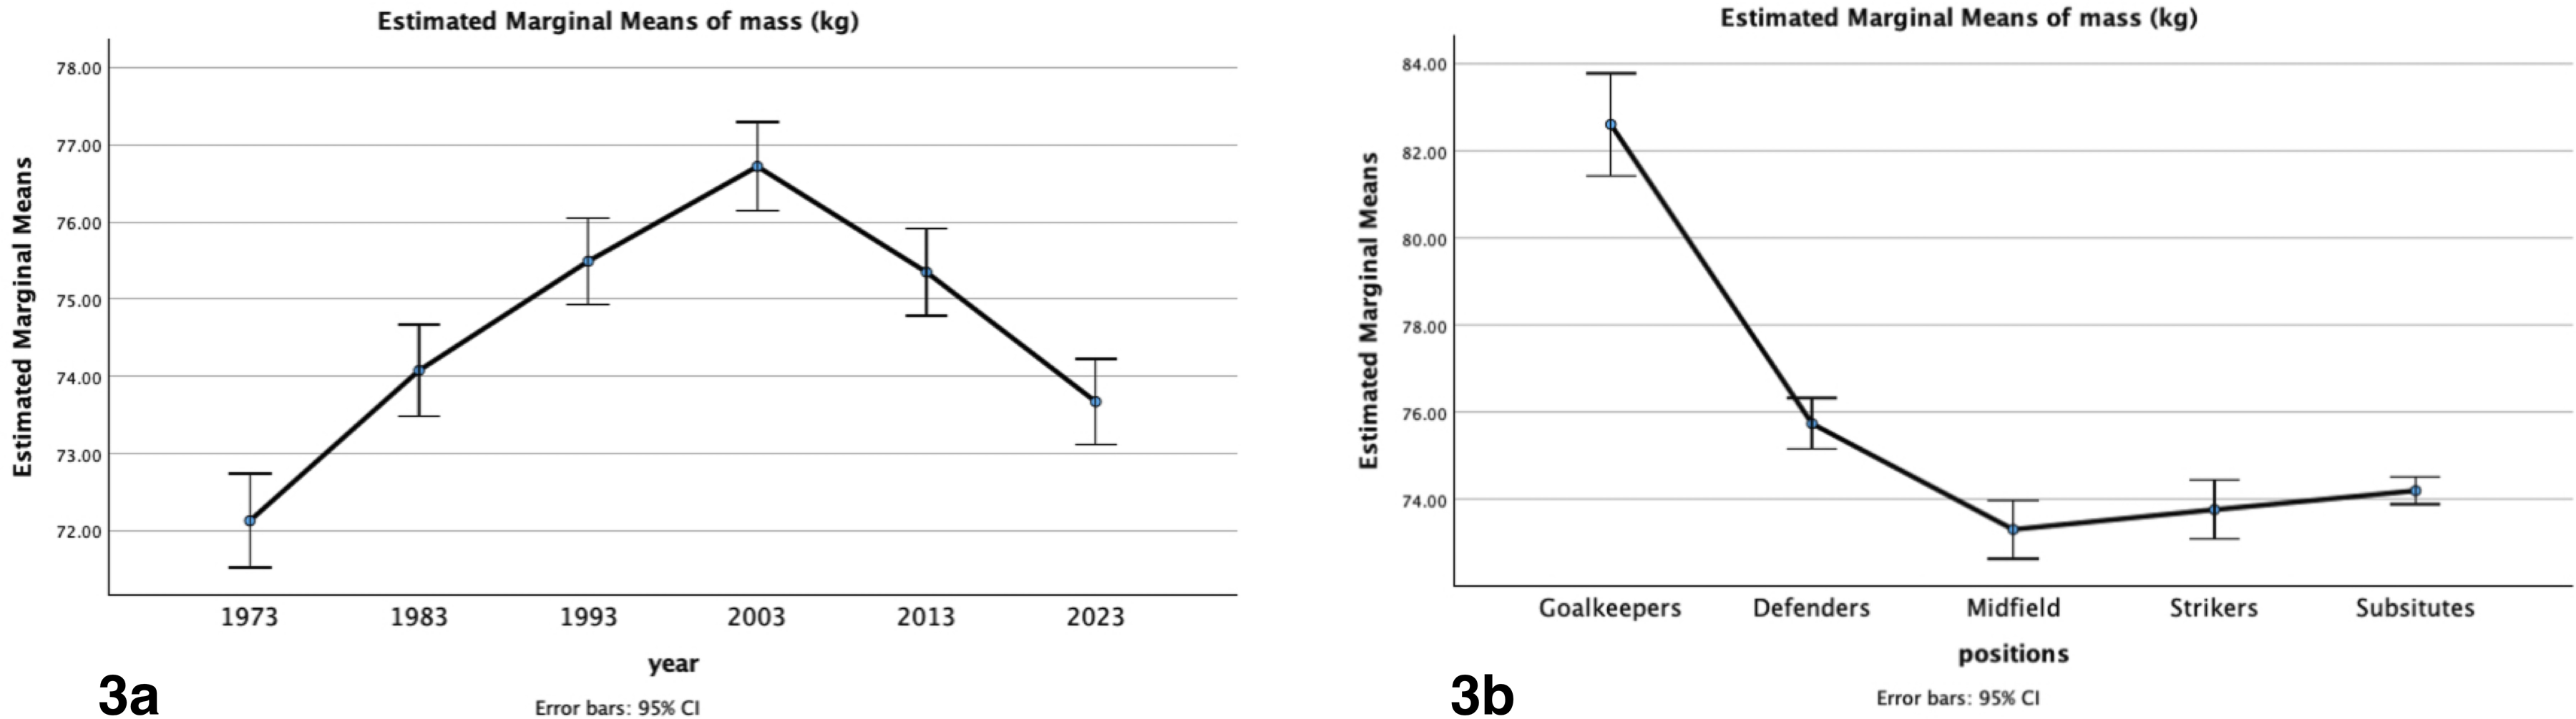
Differences in body mass a) by time/season, and b) by playing position.
The ANOVA of RPI revealed significant differences over time (decades) (P < 0.001) (see Figure 4(b)), position (P < 0.001) (Figure 4(a)) but no time-by-position interaction. Although there was no main effect difference in the RPI between successful vs less successful teams, there was a time-by success interaction (P = 0.011), where the players from more successful teams had greater RPI in the season 2003, see Figure 4(b).
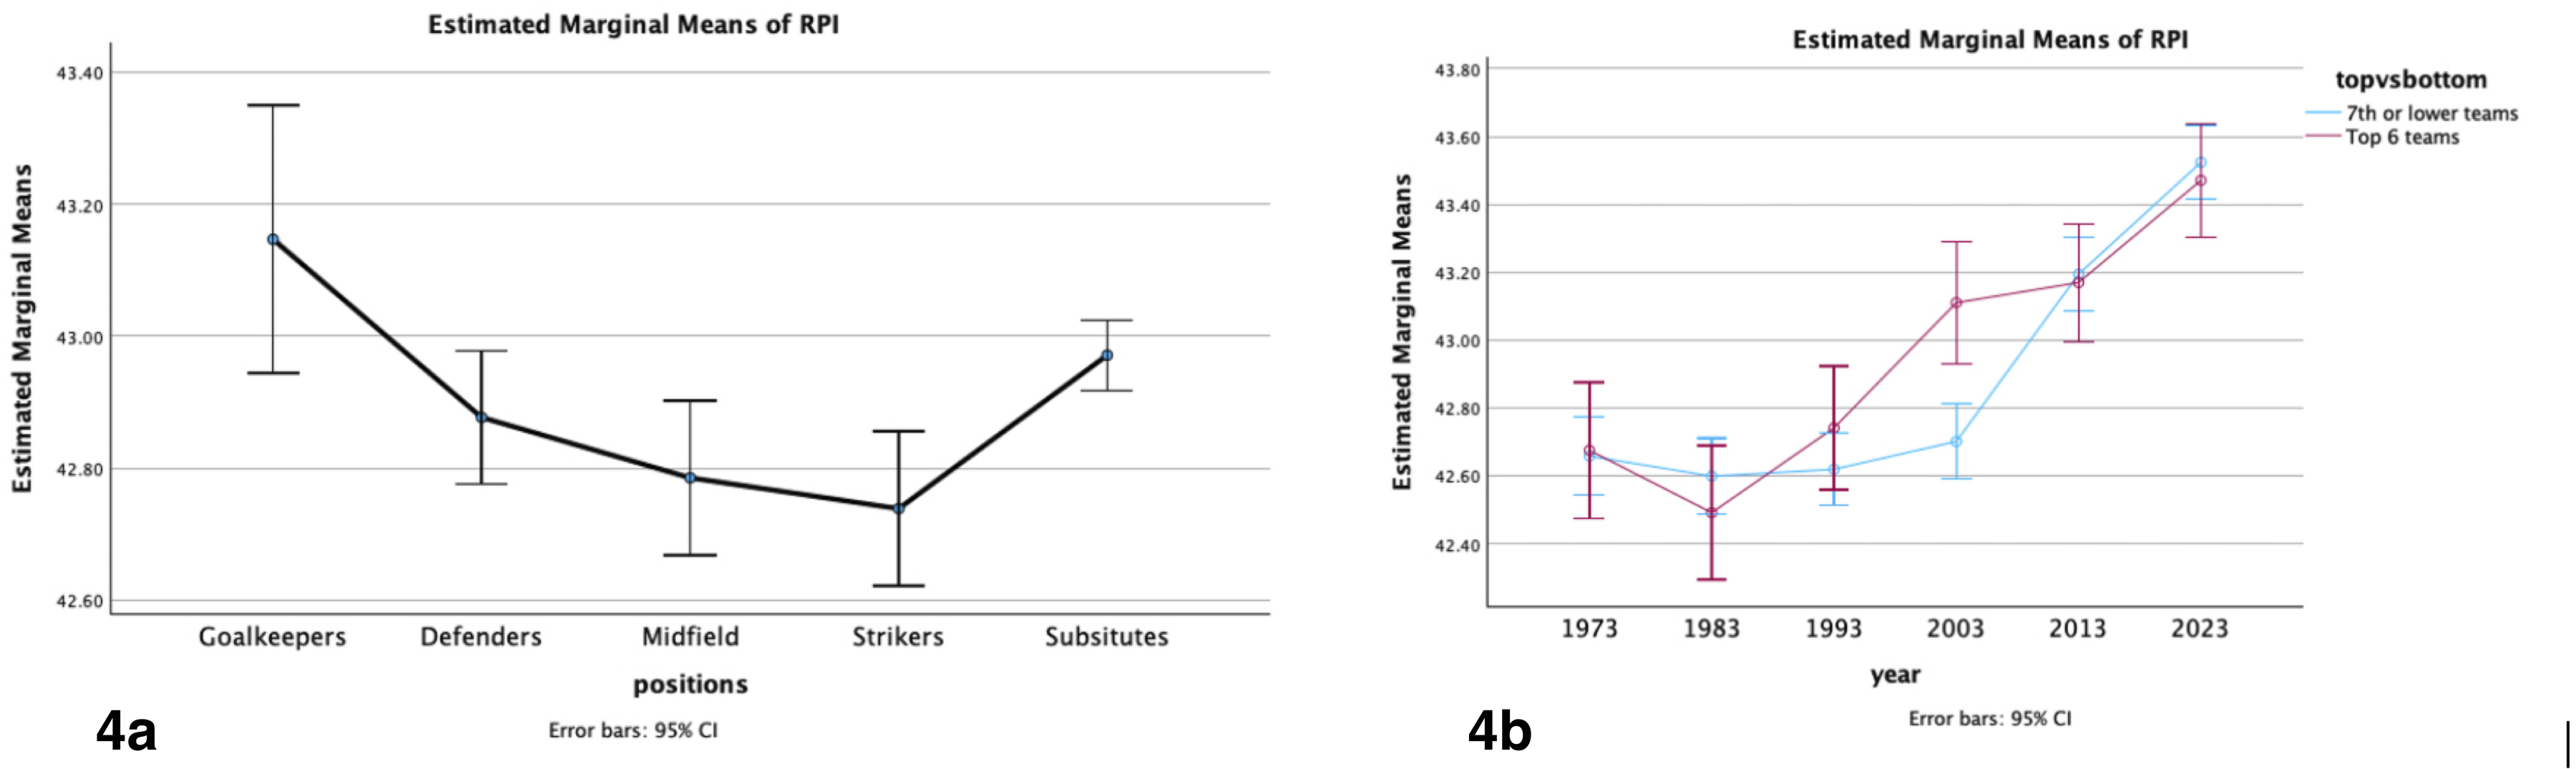
Differences in the reciprocal Ponderal index (RPI) (cm/kg0.333) a) by playing position, and b) due to the year/season-by-success (top 6 teams vs 7th or lower teams) interaction.
The ANOVA of BMI revealed significant differences over time (decades) (P < 0.001) (Figure 5(b)), position (P < 0.001) (Figure 5(a)) but no time-by-position interaction. There was a significant difference but small effect between the BMI of successful vs less successful teams (P = 0.044) but a time-by success interaction (P = 0.005), where the players from more successful teams had lower BMI in the 2003 season, see Figure 5(b).
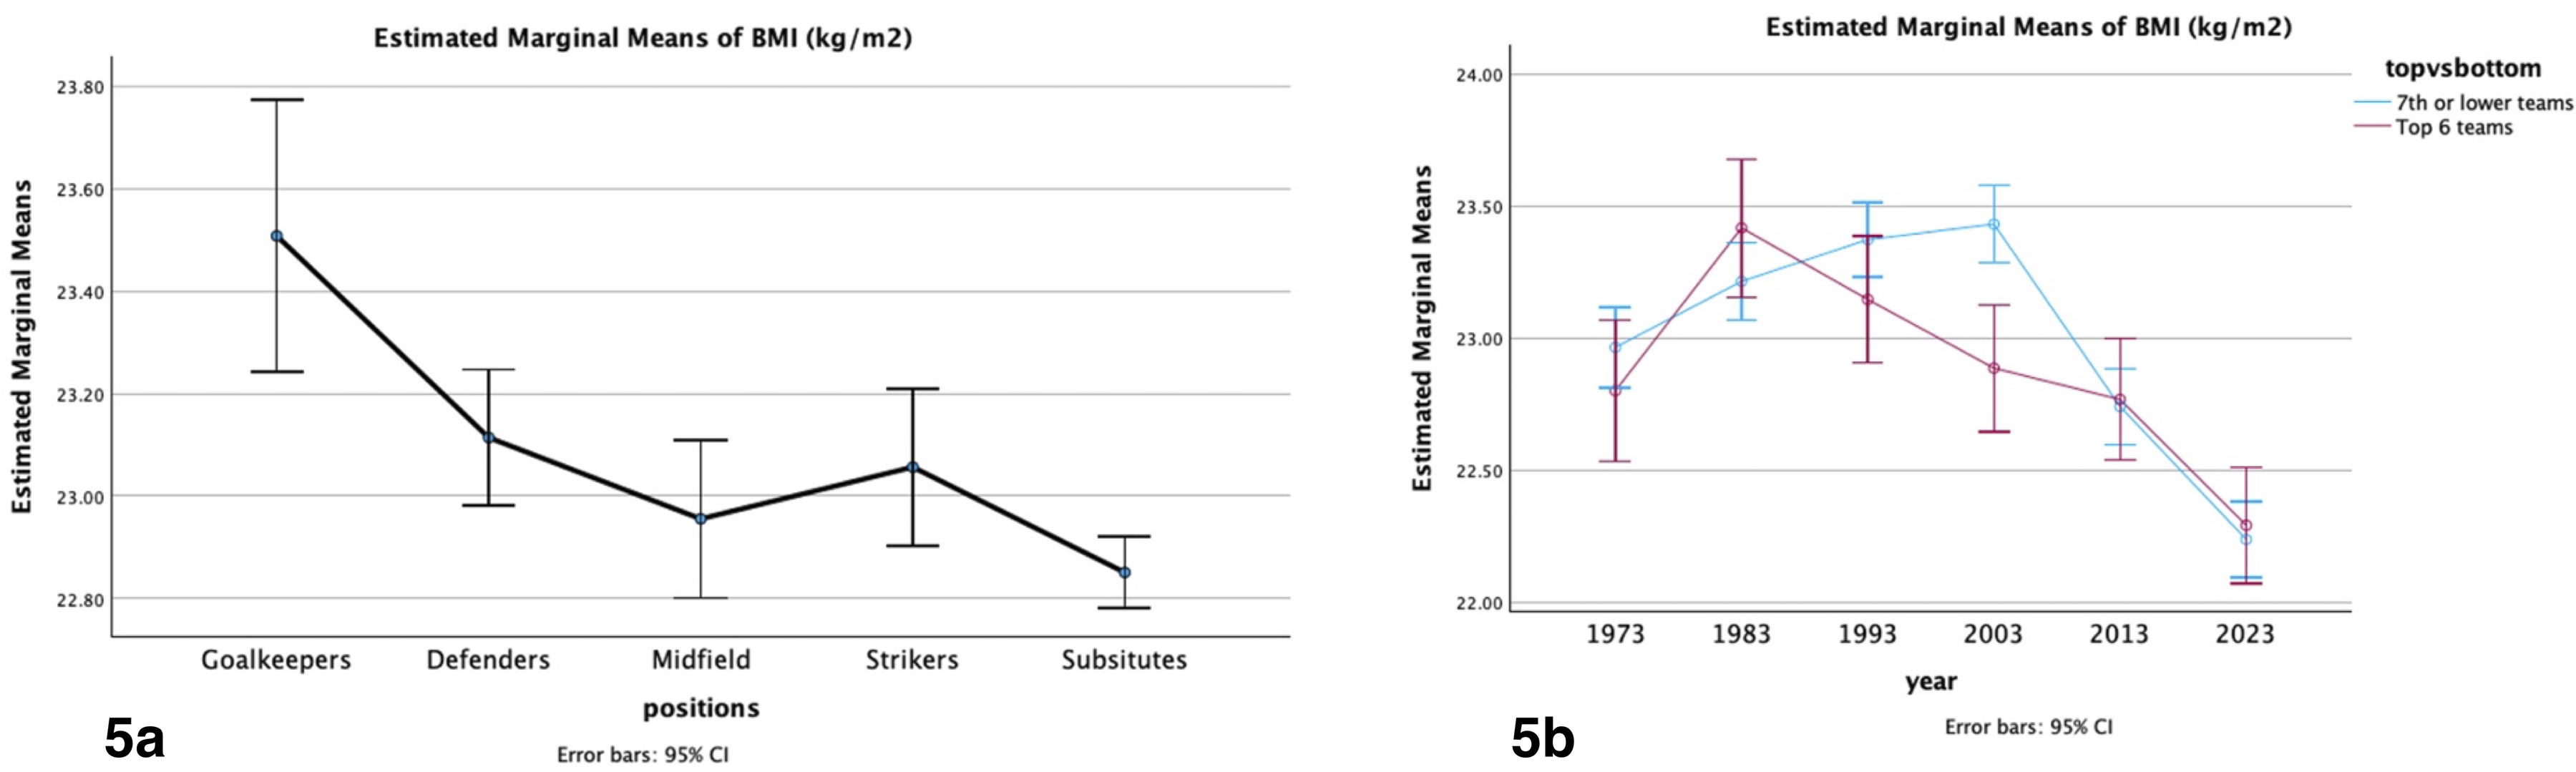
Differences in the body mass index (BMI, kg/m2) a) by playing position, and b) due to the year/season-by-success (top 6 teams vs 7th or lower teams) interaction.
Finally, the ANOVA of age revealed significant differences in all three main effects over time (4 decades; P < 0.001) (Figure 6(a)), position (P < 0.001) (Figure 6(b)), and success (Top 6 teams age = 25.812 yrs vs. 7th or lower teams age = 26.935 yrs, difference = 1.123 yrs; t = 5.55, P < 0.001; 95% CI 0.719 to 1.528), with no interactions (see Figure 6(a)).
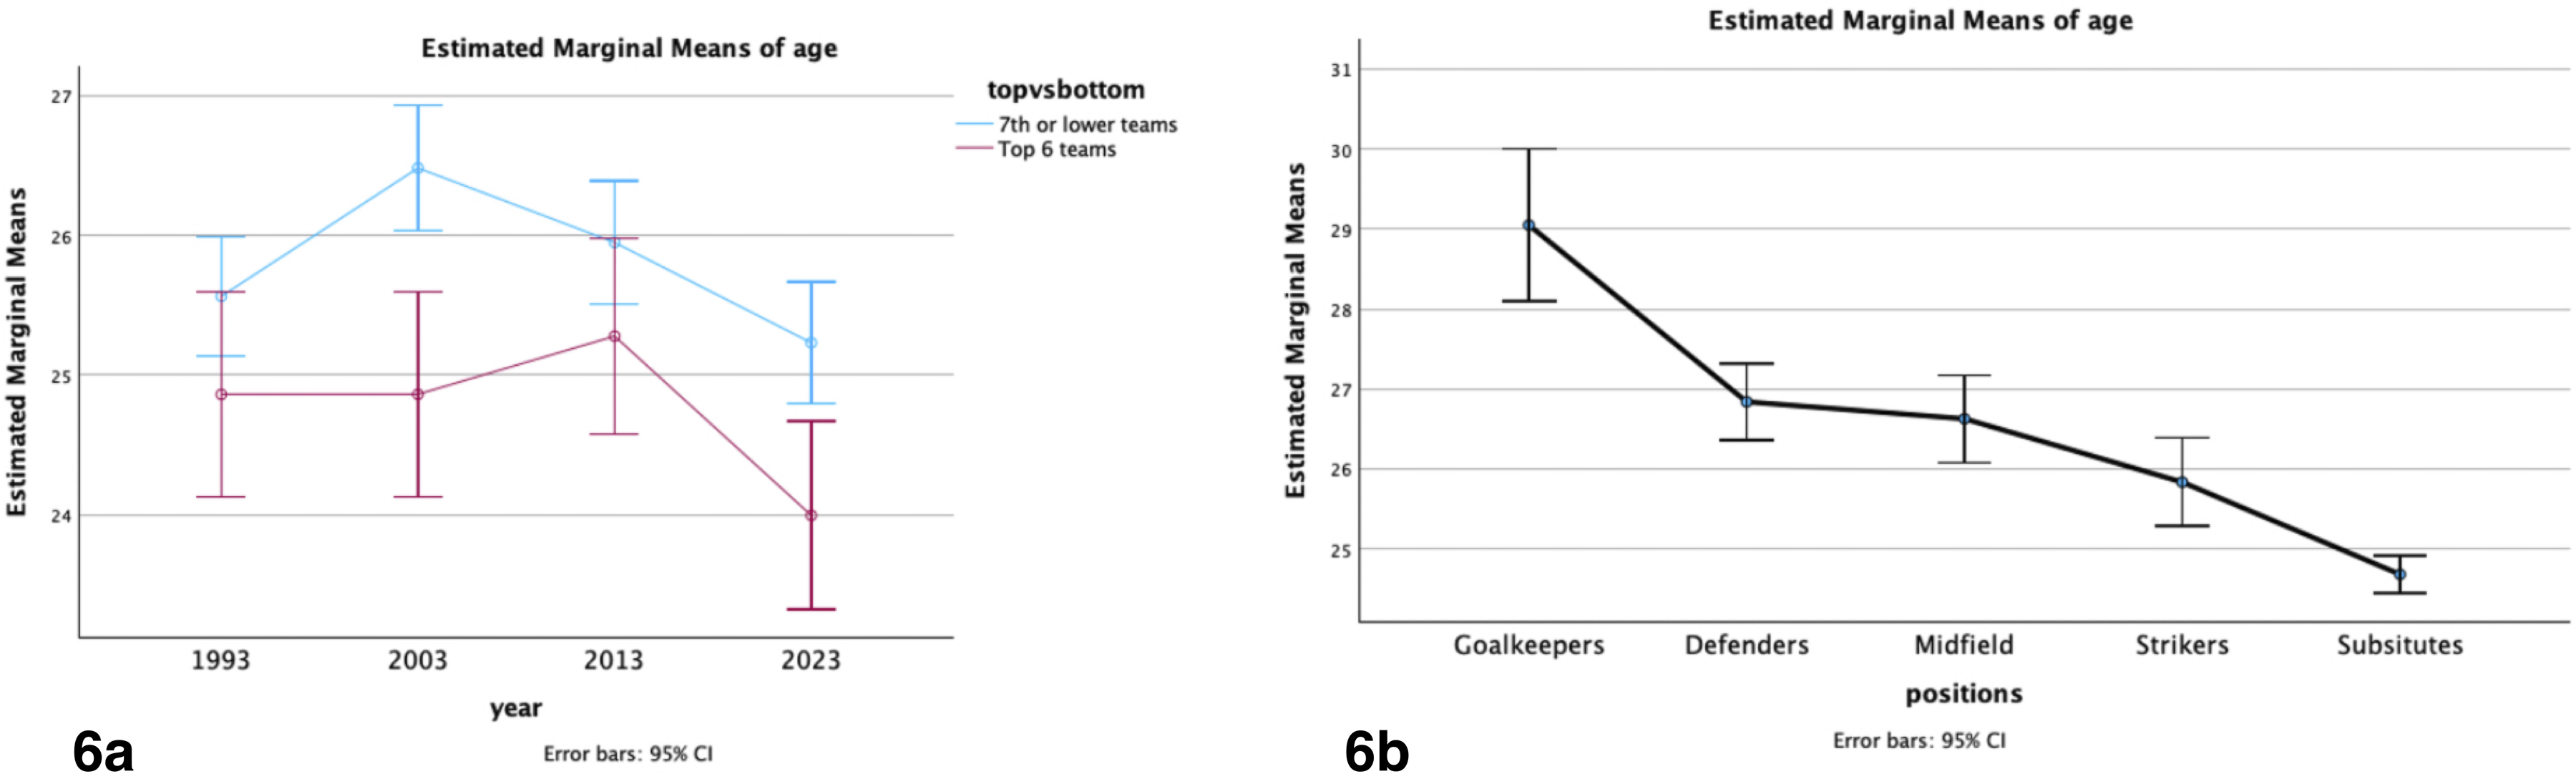
Differences in age (yrs), a) by year/season and by success, and b) by position.
Apart from identifying that successful teams are inclined to pick their first-choice players more frequently, age appears to be the only other consistent indicator between successful and less successful teams, i.e., more successful teams appear to have younger players.
Discussion
Unsurprisingly, our logit analysis identified that the percentage of games played by substitutes had increased significantly over the 6 seasons 1973–4, 1983–4, 1993–4 to 2023–4. Of course, this was due to the steady rise in the number of substitutes being made available to teams from just one substitute in 1973–4, to five substitutes being available in the season 2023–4. 22 However, our analysis was also able to confirm that these substitutes were being replaced by defenders rather than midfielders or strikers (see the slope parameters in Table 2). We speculate that the decision of managers/coaches to replace/substitute a defender more frequently than a midfielder or striker might be a positive/attacking tactic. If managers or coaches wanted to ‘play safe’ by shoring up their defence, we might have expected them to take off a striker and replace him with a more defensive player. Our results suggest the opposite. This pattern aligns with recent evidence on coaching behaviour, suggesting that while coaches recognise the tactical utility of substitutions, actual in-game decisions often prioritise maintaining defensive structure or sustaining high-intensity roles rather than simply ‘resting’ offensive players. 23
The logit analysis also confirmed that successful teams (Top 6) were using their first-choice players more frequently (in all four positions) and substitutes less frequently compared to less successful teams (7th or lower), see Figure 1(b). This suggests that managers/coaches of more successful teams are inclined to stick with their starting eleven players, thought to be a ‘winning’ combination. This behaviour may also reflect outcome bias, where coaches are inclined to persist with a starting eleven that has produced favourable outcomes, even if marginal adjustments could theoretically improve performance. This has been reported elsewhere in sport. 24
The ANOVA of height identified that players are still getting taller over time (6 seasons), but the time-by-position interaction suggests that it is the goalkeepers and defenders who continue to get taller, but the midfielders and strikers’ heights are beginning to plateau in the more recent years/decades (Figure 2(b)). Clearly, goalkeepers and defenders are consistently taller than midfielders and strikers (see Figure 2(a)).
Unlike height, body mass peaked in 2003 and has subsequently declined in more recent years (see Figure 3(a)). This is reflected in the trends in both the RPI and BMI over time/seasons. Because players are still getting taller but carrying less weight in more recent years, their RPI (cm/kg0.333) is steadily rising (see Figure 4(b)), a trend that is common for both successful and less successful teams except in the 2003 season when the more successful teams appear to have recognised the value of their players being leaner (Arsenal's ‘Invincibles’ under Arsène Wenger). Note that the Invincibles included key players such as Patrick Vieira (height = 192 cm and weight 82 kg, RPI = 44.25) and Robert Pires (height 187 cm, weight 75 kg, RPI = 44.4). This result confirms that Arsène Wenger's attitude to player recruitment and selection was probably ahead of his time. The same pattern was also reflected in the decline in BMI that reflects the trend in players becoming less muscular in more recent years, once again, a pattern that was recognised by more successful teams as early as 2003 (see Figure 5(b)).
As anticipated by Nevill et al., 6 the only characteristic that consistently discriminated between successful and less successful players/teams was age. The three-way ANOVA identified age to have a significant main effect (Top 6 teams age = 25.8 yrs vs. 7th or lower teams age = 26.9 yrs; difference = 1.123 yrs; P < 0.001; 95% CI 0.719 to 1.528) but with no higher order interactions, indicating that successful teams had younger players over all four decades studied (season 1993–4 to 2023–4) compared with less successful players/teams. Clearly, these results emphasize the importance of a) having a buoyant successful youth academy policy, and b) the need to recruit younger, less bulky, more linear/ectomorphic players. Both these characteristics appear crucial to the success of English top-division clubs via their youth academies, although successful European clubs like Barcelona, with their famous youth academy, appear to have already benefited from adopting such policies. Successful teams consistently field younger players than less successful teams, emphasising the importance of robust youth academy systems capable of producing tactically and physically prepared players for elite competition. 25
Limitations
The current study is not without its limitations. Like all data reported using such books (football yearbooks, cricket almanacs, etc.), errors can possibly occur. We did cross-check many observations using other on-line resources, especially if an observation looked erroneous. However, we recognise that a small number of such errors may still be present in our data set. 26 We also recognise a weakness associated with the ten-year interval, chosen to avoid most players from being included in two overlapping data sets. Furthermore, a small number of players will remain common to two consecutive data sets that will contradict the assumption of independent observations. This must also be acknowledged as a limitation. It is also worth noting that red cards can affect match dynamics and substitution strategies. These were not systematically recorded in our dataset, and we could not verify individual matches retrospectively. Consequently, substitutions in matches with red cards may reflect tactical adaptation to being a player down rather than performance- or fatigue-based decisions.
Conclusions
In summary, players continue to become taller and more linear (ectomorphic) identified by the reciprocal Ponderal index, a trend observed more with goalkeepers and defenders rather than midfielders and attackers. The body mass of players has also declined in more recent decades. We also observed a steady increase in the use of substitutes, a trend where substitutes appear to be replacing defenders rather than midfielders or attackers, likely influenced by recent changes to substitution rules that permit a greater number of in-game replacements.
Coaches from more successful teams also use fewer substitutes compared with coaches of less successful teams, relying on their first-choice players selected for the opening match at the beginning of the season. Players from successful teams remain consistently younger than players from less successful teams (confirmed using a sensitivity analysis where the definition of ‘top’ teams were allowed to vary from the top 4, top 5, top 6, top 7 and top 8 teams), a testament to the value of, and investment in, youth academies.
Footnotes
Acknowledgements
The authors would like to thank the reviewers for their helpful comments when revising our manuscript.
Ethical consideration
This study did not require institutional ethical approval because all data used were publicly available and contained no identifiable or sensitive personal information. In accordance with institutional and national guidelines, the use of publicly accessible datasets for secondary analysis does not fall under research requiring ethics review.
Funding
The authors received no financial support for the research, authorship, and/or publication of this article.
Declaration of conflicting interests
The authors declared no potential conflicts of interest with respect to the research, authorship, and/or publication of this article.