
Abstract
Cycling competition is highly interesting since the team ranking is based on the best performance of some subset of team members. The paper develops new inequality indicators, a methodology to construct them, and numerical illustrations allowing to provide operative arguments in their favor. The numerical illustrations subsequently deal with hierarchical ranking indicators of (female) cyclist teams, competing in multi-stage races. For the illustration, the 2023 editions of the most famous long races for females are considered: 34th Giro d’Italia Donne, 2nd Tour de France Femmes, 9th Vuelta Femenina. Several classical ranking indicators are recalled and adapted to the study cases. The most usual indicator,
Introduction
Rules have to be devised for providing a realistic hierarchy of choices.
Yet, the ranking methodology can lead to much debate,1–7 among many others in social choice considerations, as in the case of tournament ranking methods.1,8–14 In particular, sport activities seem to provide rather objective and quantitatively reliable data for academic studies. 15
Among these, it appears that cyclist races contain much interesting data. Indeed, one can focus on the role of individuals within a team, since team hierarchy is based on the best performance of a subset of members of the team. Within this framework, incentive must be provided to teams and team members for showing some interesting race competition. 16 Thus, relevant hierarchy indices are needed, - and somewhat tied to money awards.17,18
In the following, one considers the three most famous female races within the Union Cycliste Internationale (UCI) classifications: Giro d’Italia Donne, Tour de France Femmes, Vuelta Femenina.
According to UCI rules, the hierarchy of the teams, at the end of an
Thus, one may introduce an “adjusted team final time” measure,
Going beyond the above consideration, one may derive metrics that aim at measuring some team skill and also at attempting to quantify team global strategy, for a given race. For so doing, one proposes two new measures or indicators: (i) the “leadership gap index”, (ii) the “race temperature index”. The ranking of teams according to such indicators allow to observe the “crucial core” made of the most competitive teams.
In brief, these two so newly defined metrics complement the entropy approach 19 and hopefully develop previous works20,21 toward team management and coaching applications.
For completeness, let it be observed that this paper enters the framework of studies on cycling published in the International Journal of Sports Science & Coaching and other journals. Notice that most works pertain to the (physiological) characteristics of the cyclists.22–25 Closer to the present aim, O’Grady et al. discuss, after interviews, tactical strategies that professional riders and coaches prepare at training time for application in races. 26
In Section “Research questions”, one poses the Research Questions and mentions the Data sources. One displays the fundamental characteristics of the races.
In Section “Methodology”, one introduces the methodology, including the formulae for
In Section “Other indicators”, other hierarchy measuring indices are considered for readily comparison, i.e., some qualitative advantages and disadvantages of the newly proposed indicators.12,27–31 There exist fundamentally different approaches in ranking methodology. It is pertinently emphasised that changing the ranking rules, in a multi-stage race, may change some tournament metrics; see, for example, scoring and ranking simulation by Csató. 13
Here, two inequality indicators can be directly derived from the distribution characteristics in order to evaluate the dispersion of team “values”: the Atkinson index, 32 and the Coefficient of Variation. Three classical indicators of dispersion can be next considered: the Herfindahl-Hirschman index, the Gini coefficient, and the Theil index.33–35 These indicators show how dispersed the final times are, but are calculated without taking into account the ranking of teams. One may delve more into the hierarchy problem if one ranks the components. Moreover, one can calculate other ad hoc indicators: the Pietra-Hoover index, 36 and the Rosenbluth coefficient. 37
Section “Results and analysis” contains numerical results and some analysis. In Section “Discussion”, one deepens into team hierarchy, comparing teams in the various races. Conclusions follow in Section “Conclusions”, together with suggestions for further research due to obvious limitations of the present study.
Research questions
Due to the considerations outlined in the Introduction section, i.e., UCI unjustified shocking biased constraints on usual team value measures, one can select the following research questions as a guiding thread of the paper:
can one provide indicators with less biased constraints on team ranking? are they strategic or coaching features which arise in studying and measuring team “competition” hierarchy, in cyclist races? 34th Giro d’Italia Donne; 2nd Tour de France Femmes; 9th Vuelta Femenina.
For finding proper answers geared toward various disciplines but based on case studies the following top multistage races with complex data, are hereby used:
For the present exposé only a single year is examined: 2023.
For simplicity, the races will be called
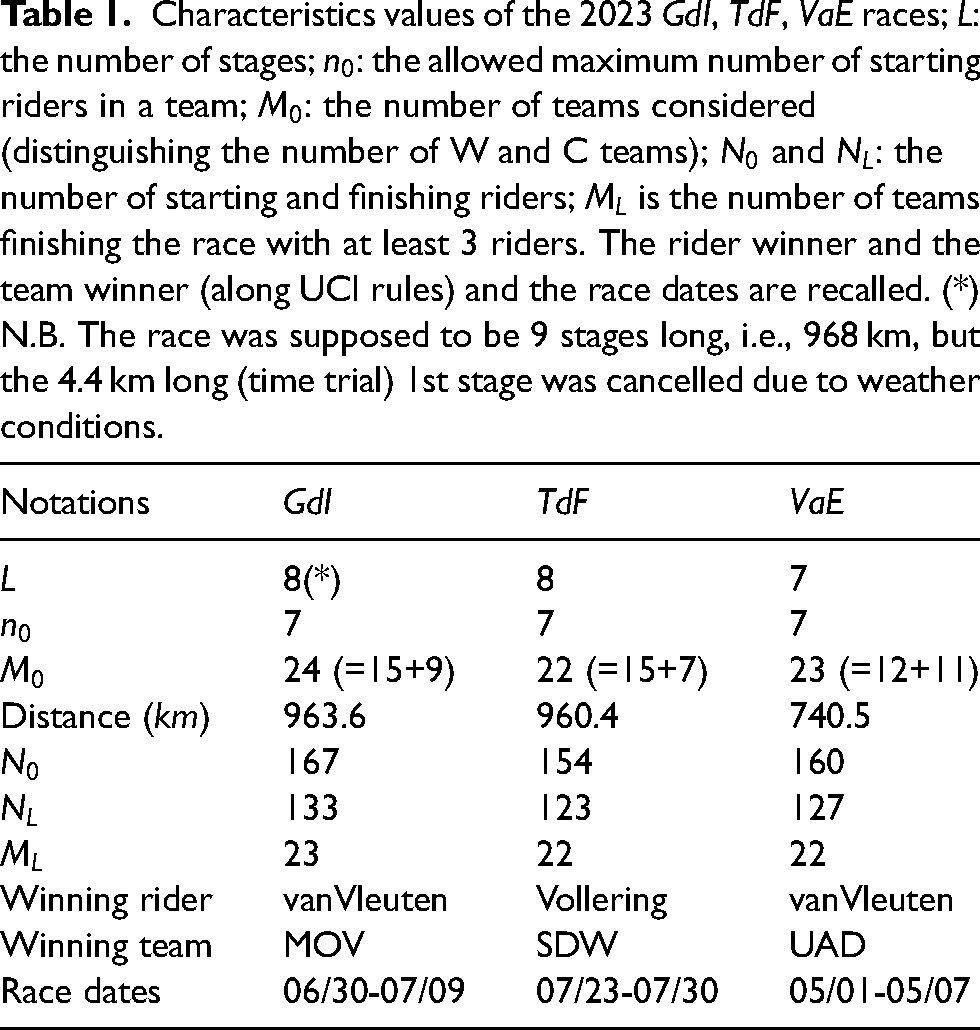
Characteristics values of the 2023
UCI acronym of team sponsors, for competing female teams in the 3 here considered main multi-stage 2023 races (
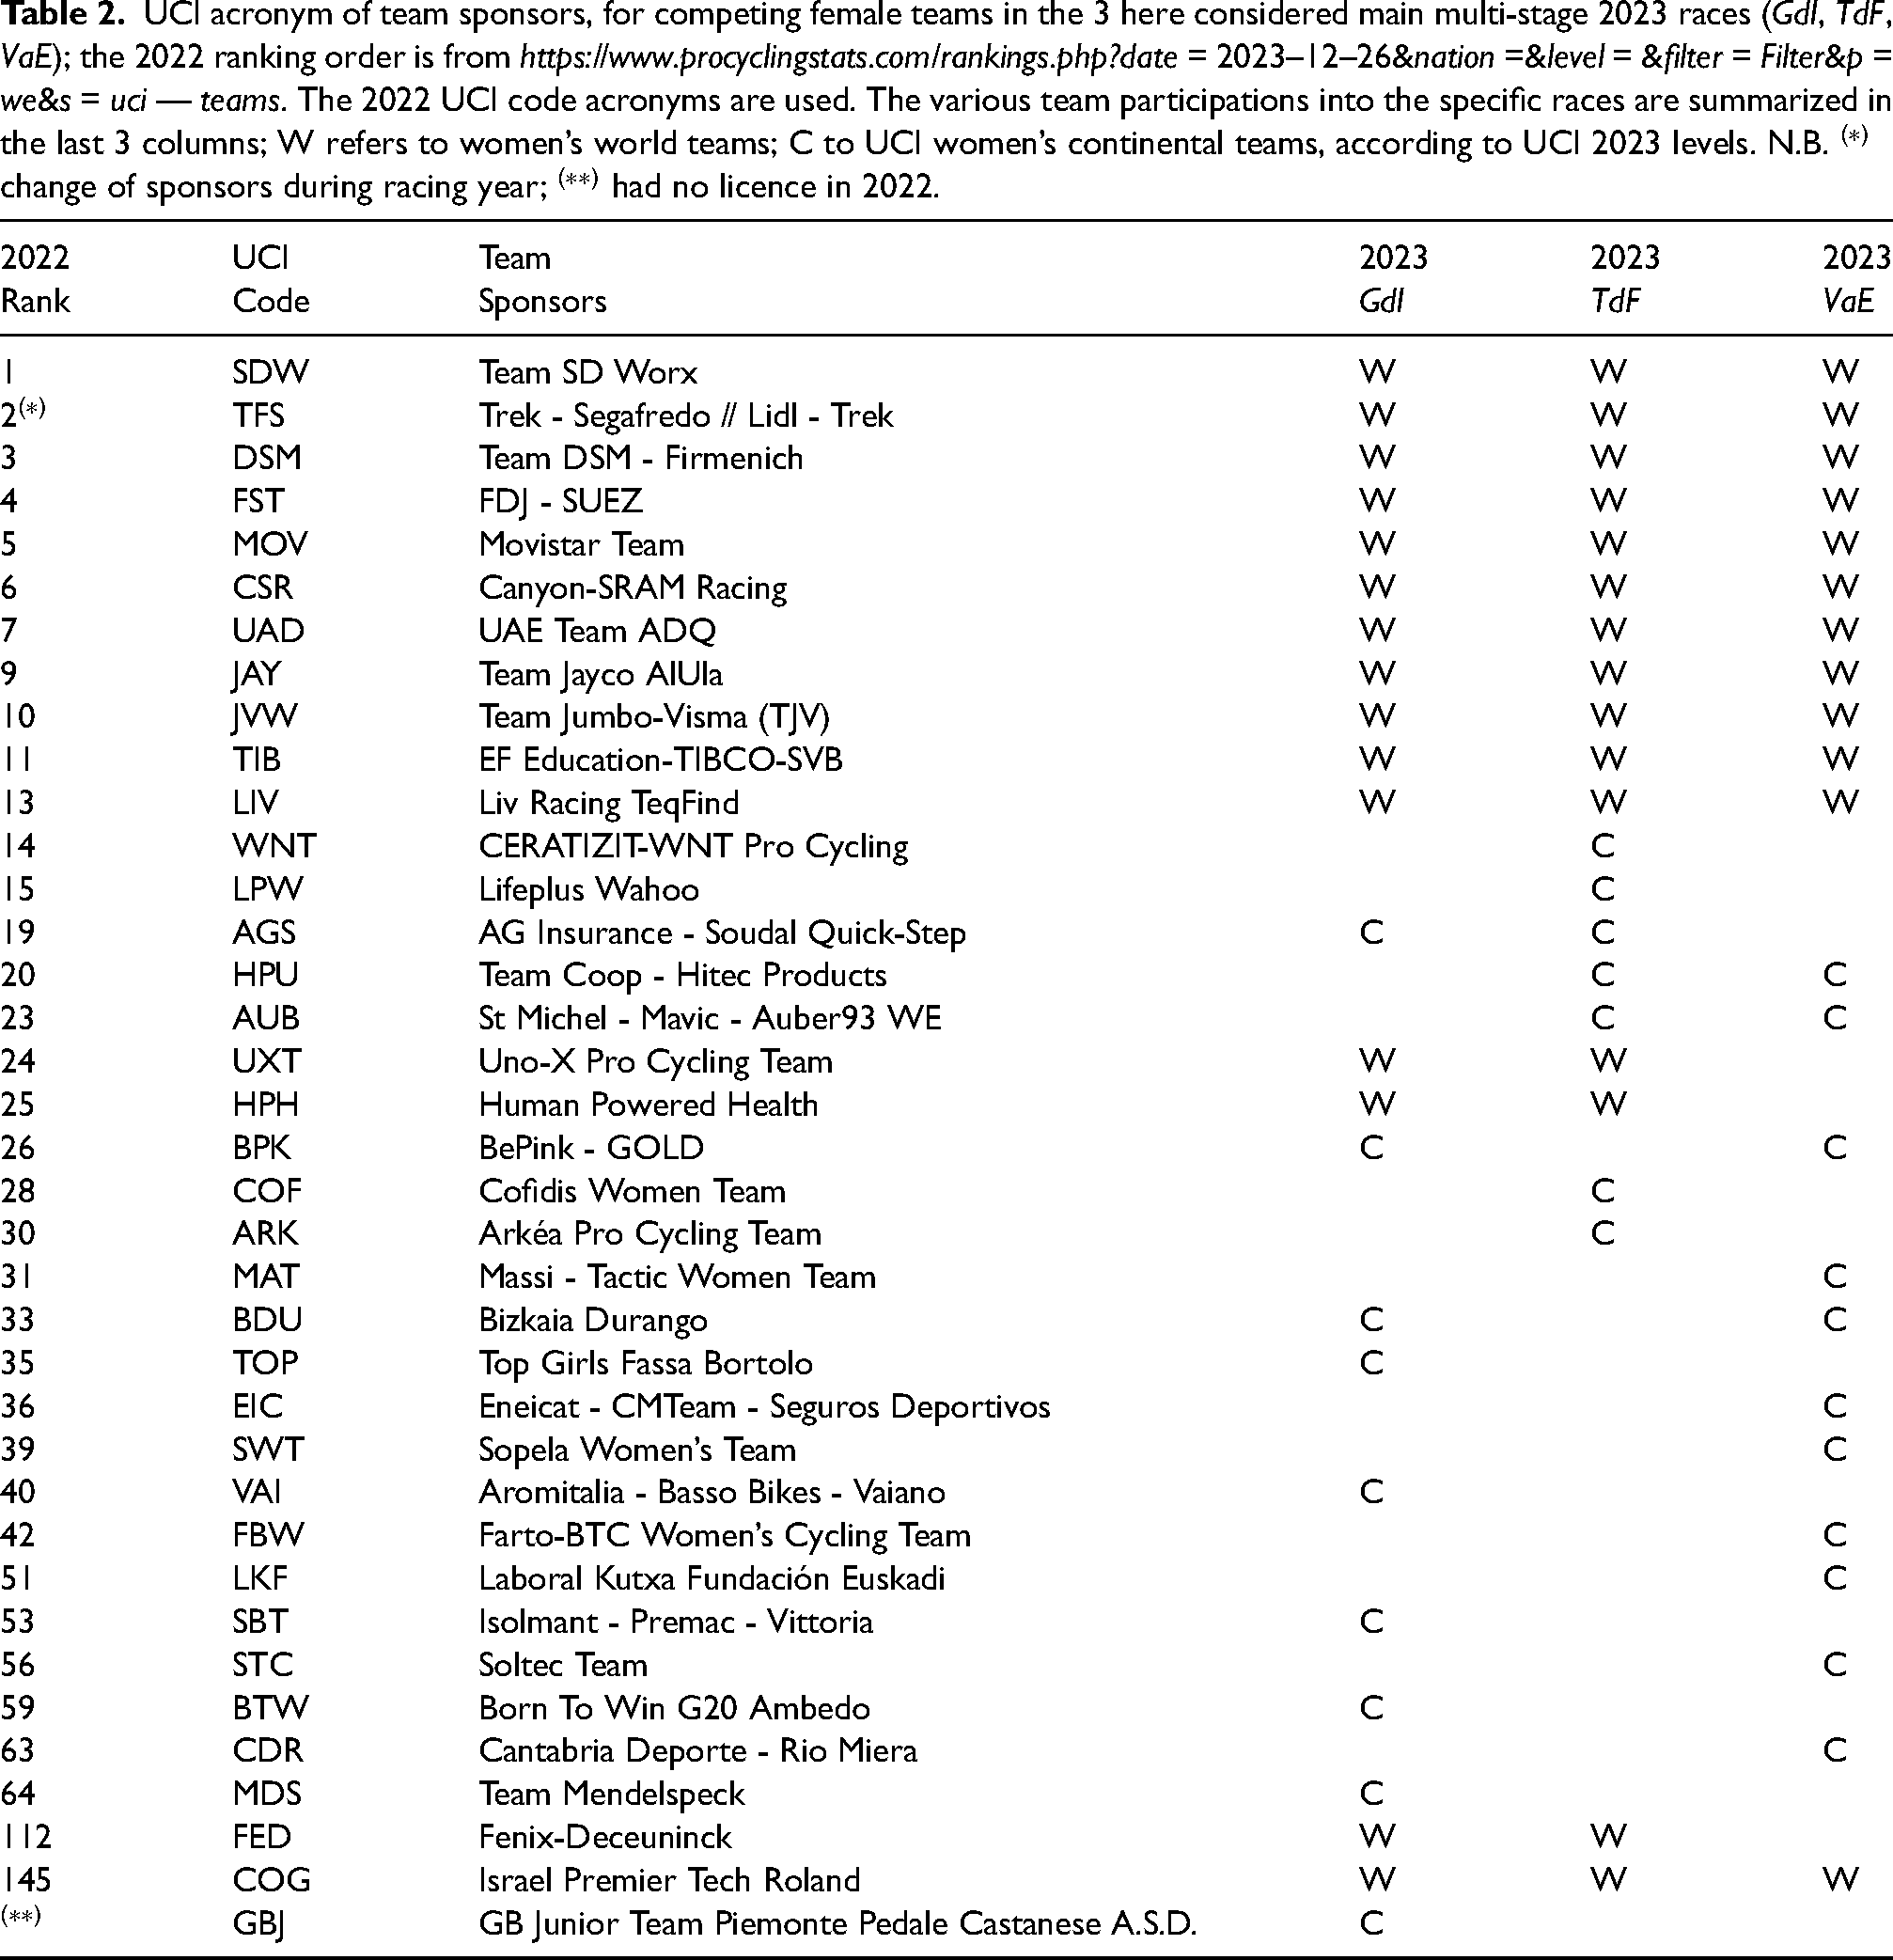
One can freely obtain relevant data from the organizers websites. However, they are not all provided in a consistent way. Therefore, it is best to rely on professional websites, e.g., https://www.procyclingstats.com. Nevertheless, data cross-checking must be systematically done; one chosen method has been to use
Methodology
One should recall that in a
It is re-emphasized that the fact that such riders do not necessarily finish the 
One complexity has to be emphasized: according to UCI rules, the final time of a
Therefore, the methodological path goes as follows:
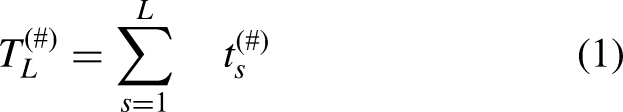
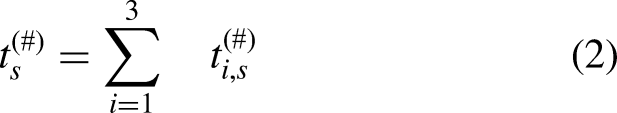
get each team rank riders in each team according to their true finishing race time, i.e., excluding bonuses and penalties (if they exist); select the 3 fastest riders overall in each team, for each daily stage, and add their cumulative times to get
One obtains the values and hierarchy displayed in Tables 3 to 5, in increasing time order. The statistical characteristics of the relevant finishing times distributions are reported in Table 6.
Table displaying the final ranking of the (
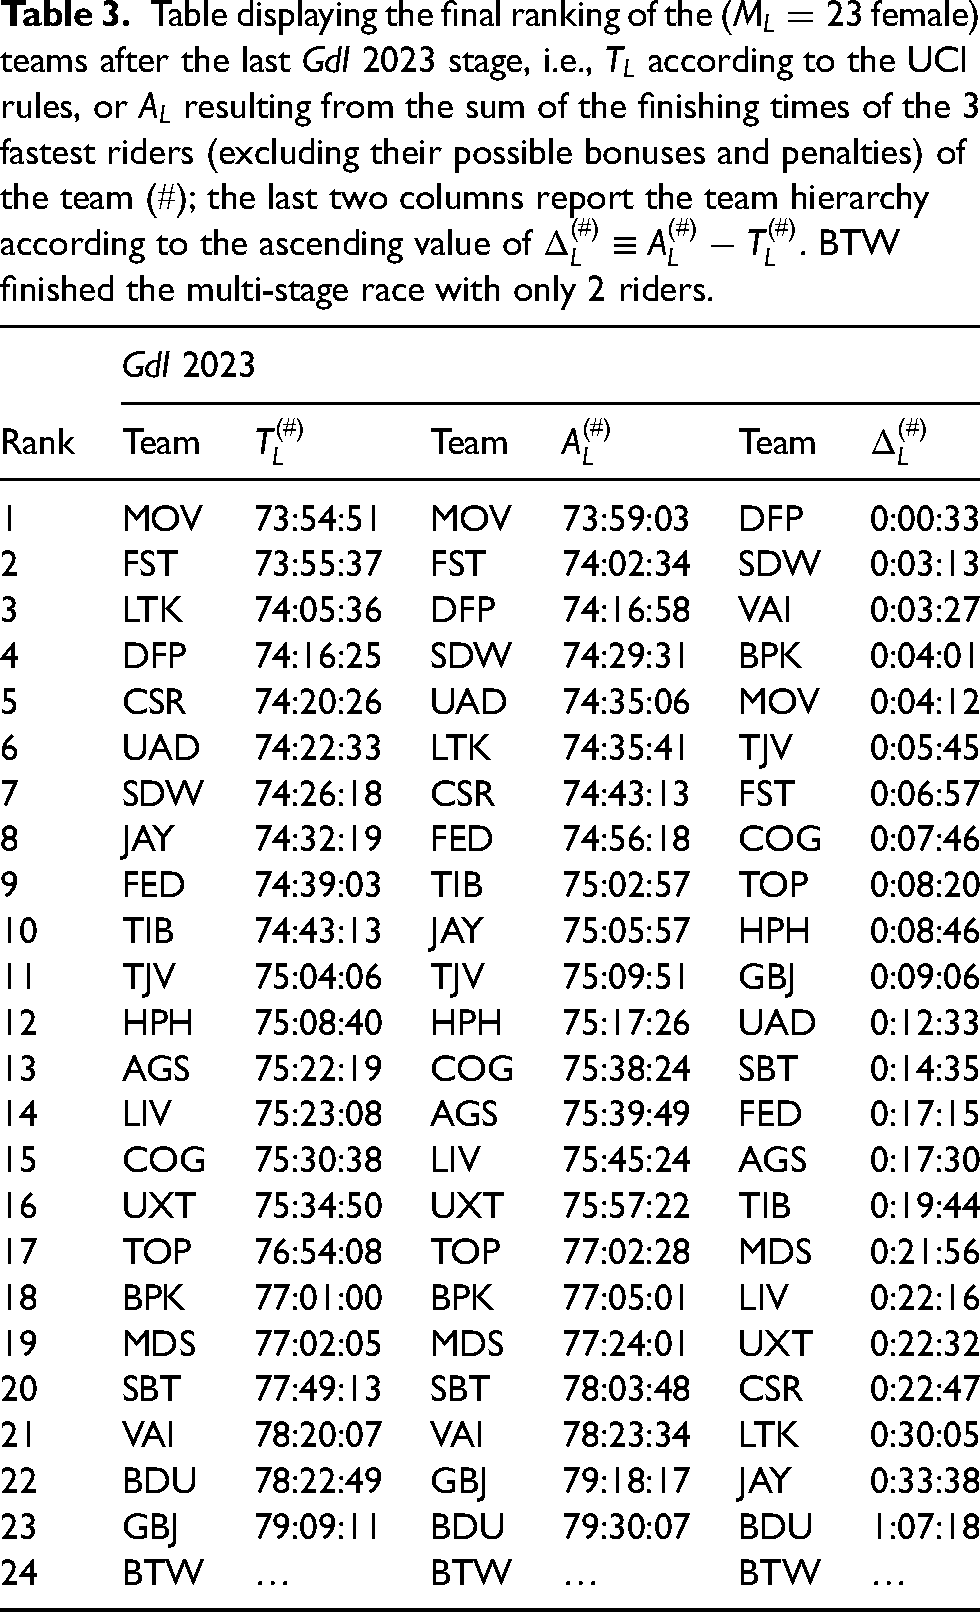
Table displaying the final ranking of the
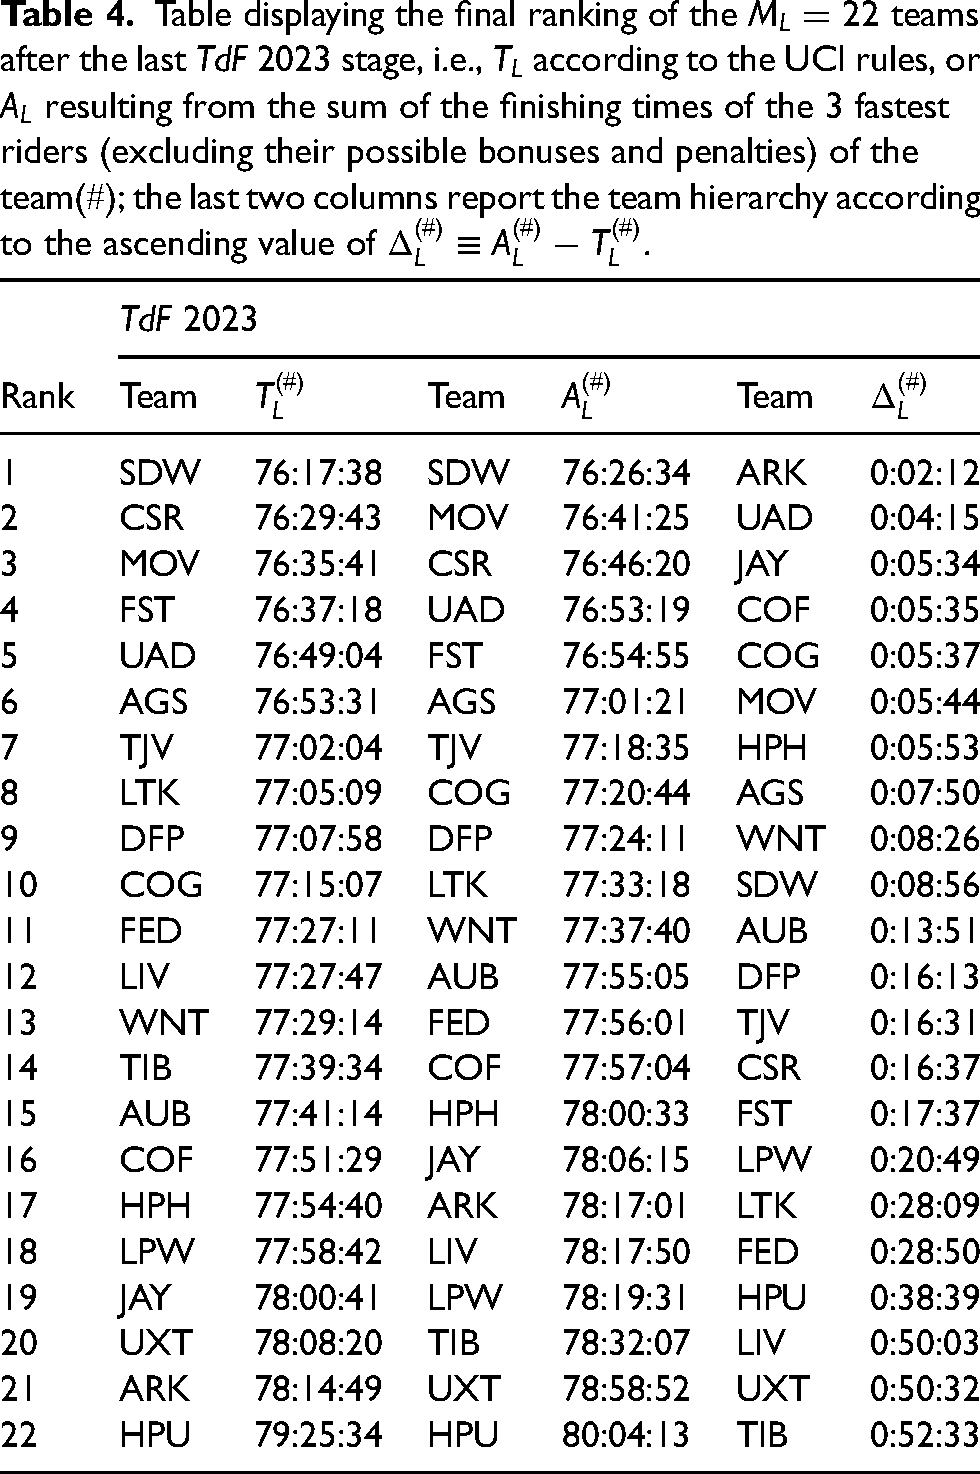
Table displaying the final ranking of the (
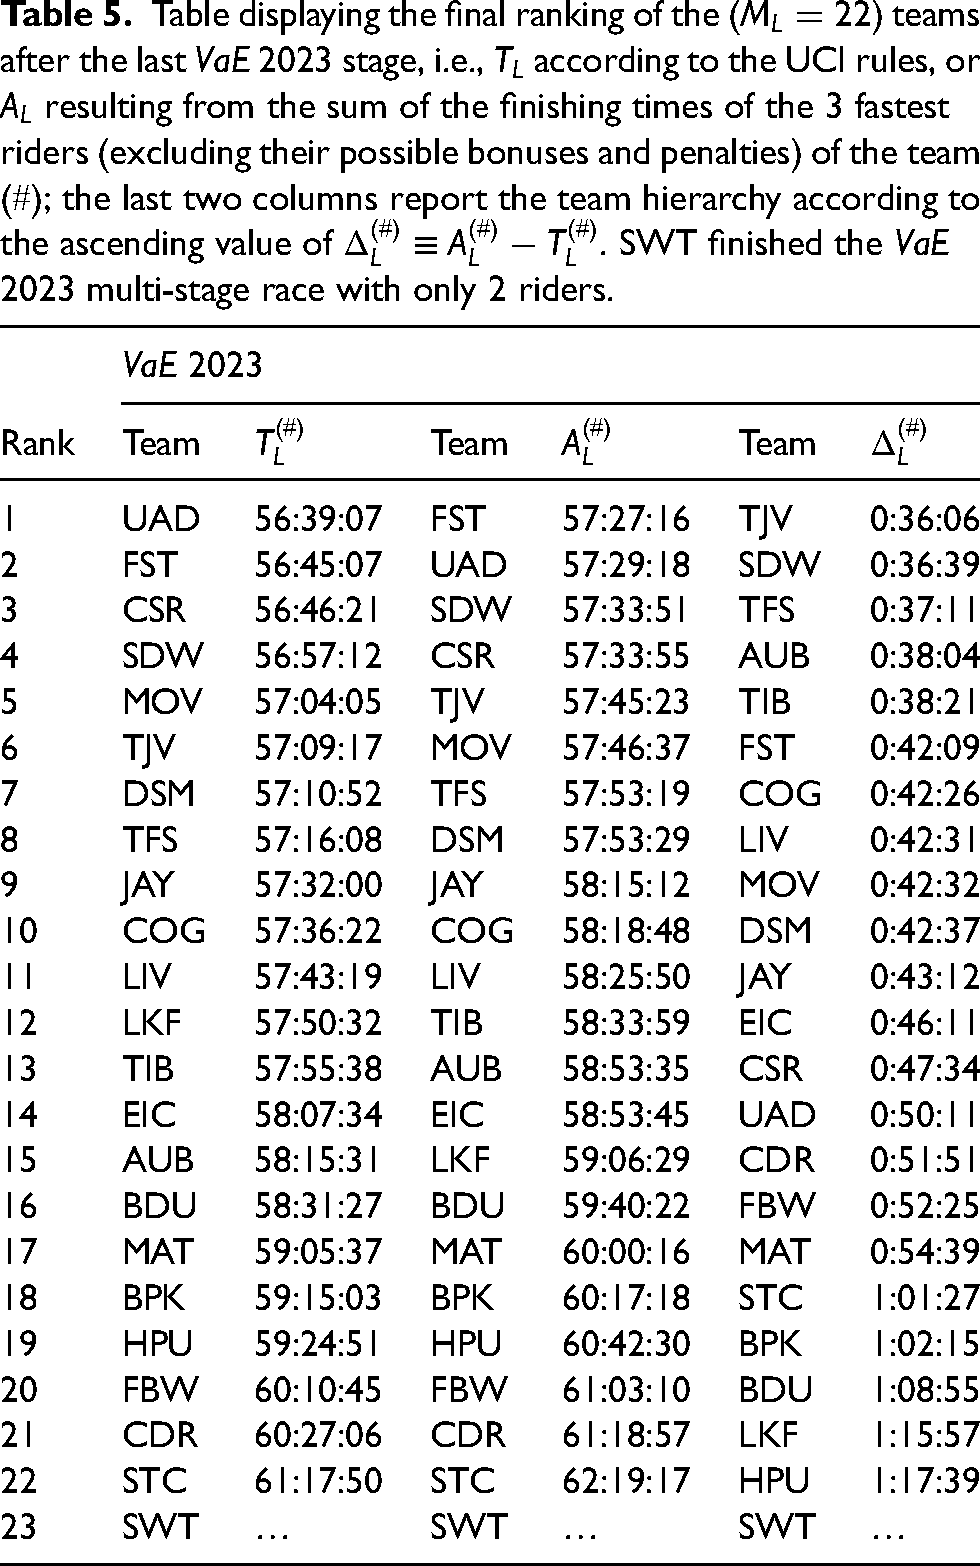
Table displaying a few statistical characteristics of the final times (as defined in the text) distributions of teams in the 3 races: all times in h:m:s;
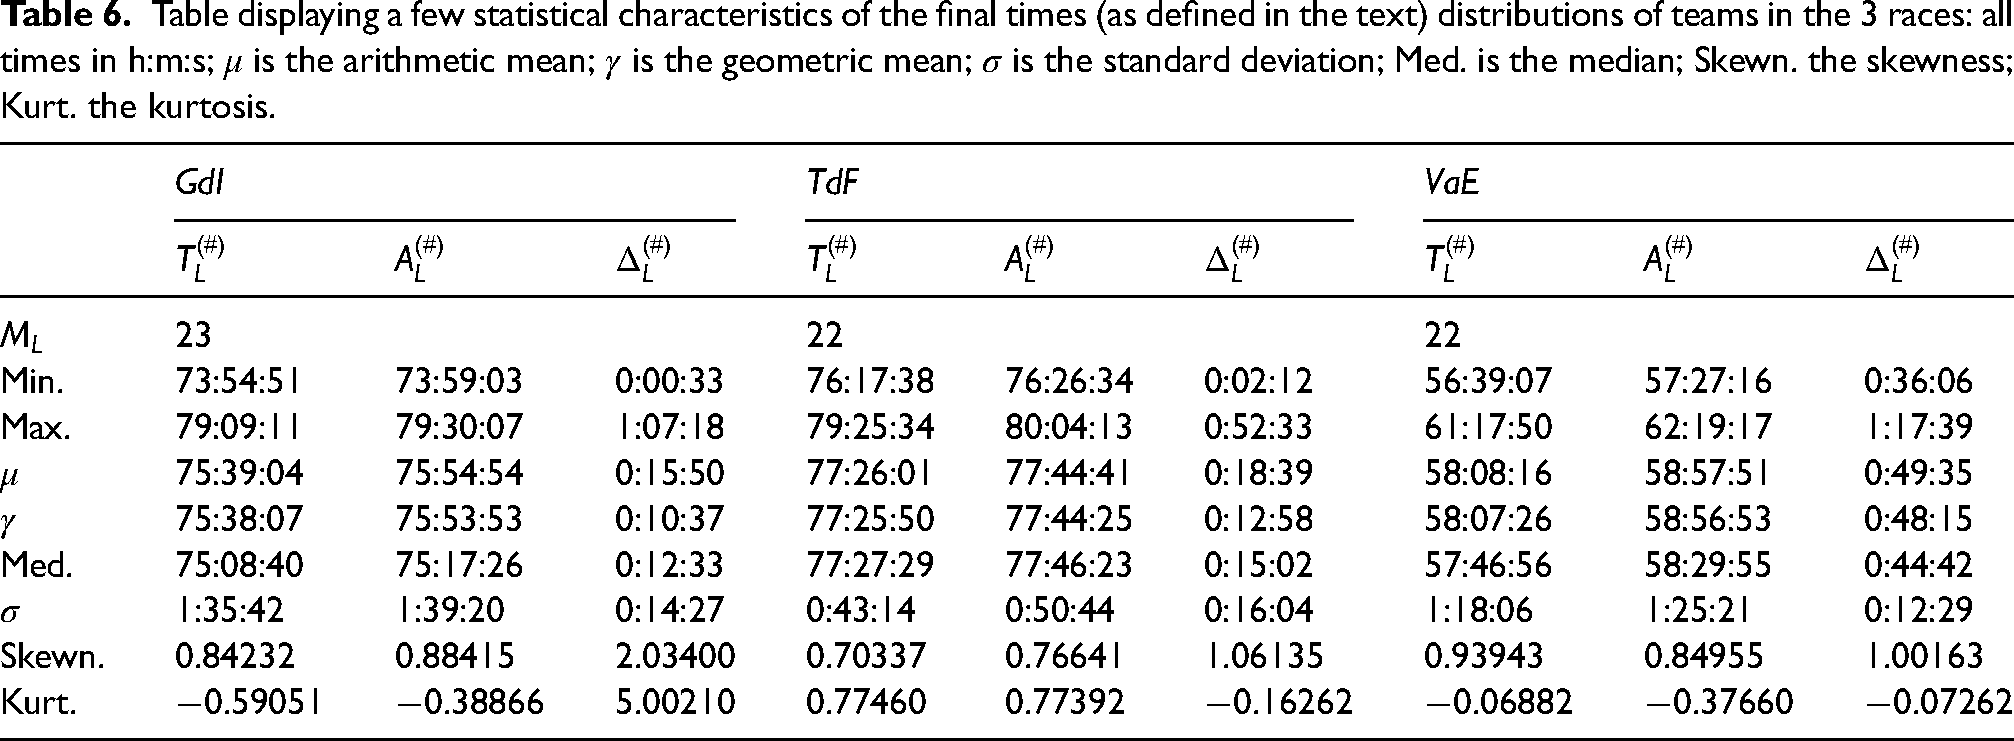
Together with Table 1, Table 6 a posteriori allows to compare race difficulties. It is easily observed that the time distributions of
Leadership gap index
Since the measures 
The values of
Indeed, the indicator reaches a large value if the riders are not much concerned by their final rank. In this case, the “team leaders” do not seem to be “pre-defined”. Thus,
Stage and race temperature index
Shannon and Boltzmann-Gibbs entropy are analogous measures of disorder in informatics and thermodynamics.38,39 The maximum entropy value corresponds to a state of maximum uncertainty, i.e., when all outcomes are equally likely, pointing to a lack of structure or even predictability because of the absence of disorder. Thus, the concept seems of interest for measuring some operational effect in sport results. 40
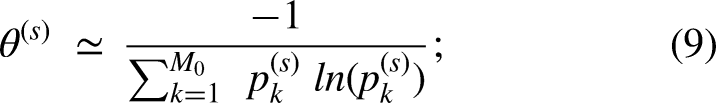
Let 

The average of such a 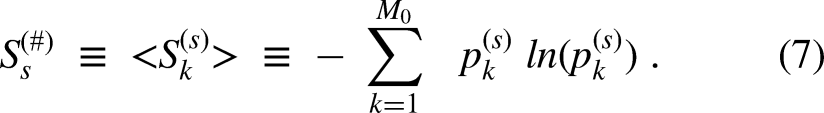
The whole race entropy
Thereafter, reconnecting the Shannon information entropy to the thermodynamic Boltzmann-Gibbs entropy, one can define a team dependent (“generalized”) temperature during the stage 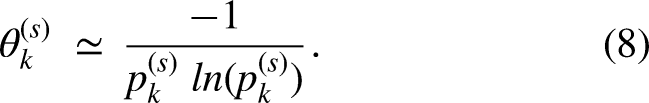
The “team temperature” is forecasted to be higher if the riders have much strategic freedom. It is readily expected that such a temperature is lower if leaders are well defined. In the present case, this occurs, as easily understood, if
The overall race temperature is of course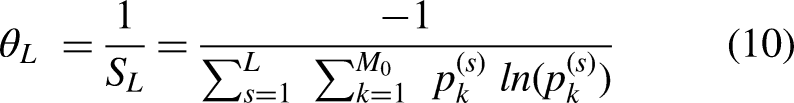
Again, one can justify the semantic validity for calling
Other indicators
Atkinson index
Thus, the Atkinson index 
Coefficient of variation
Among the indicators using statistical characteristics of distributions, the Coefficient of Variation (
Herfindahl-Hirschman index
One may also recall the Herfindahl-Hirschman index serving to measure the “amount of competition” between economic entities,44–47 - or for our examples, between teams. 18
The Herfindahl index, also known as Herfindahl-Hirschman index (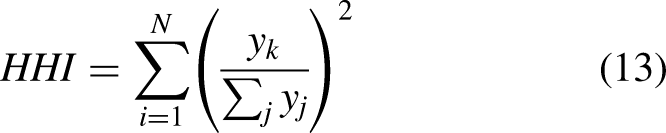
Adapted to the case of sport team ranking,
As an extreme example, - which sometimes occurs, if 3 riders of each team arrive together, whence have the same finishing time for a stage, all terms in the equation (13) sum are equal, whence
One sometimes says that the “number of effectively important competitors” is the inverse of the Herfindahl index.
A normalized 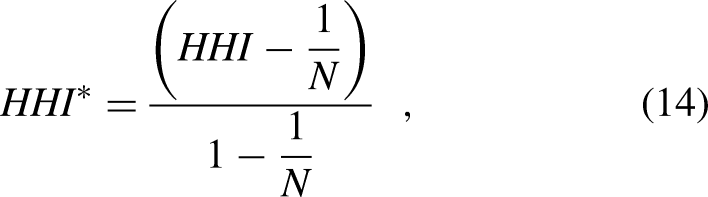
Gini coefficient
The most popular way for quantifying inequality levels, in socio-economic systems, is through the Gini coefficient (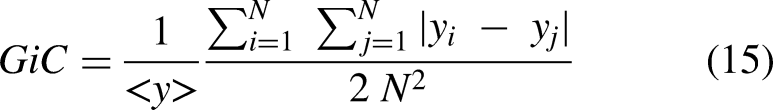
Theil index
For completeness, one can define the “final” Theil index. One has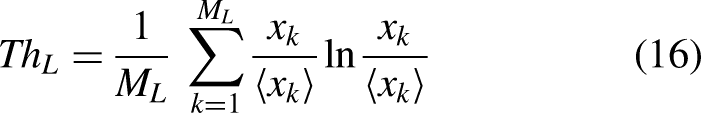
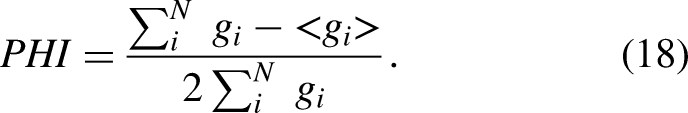
Pietra-Hoover index
It seems of interest, for emphasizing the structure, like the maximum position and the corresponding percentage of the relevant population, to display the data as the difference between the Lorenz curve (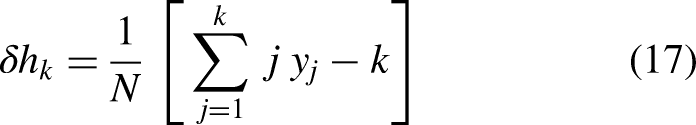
Rosenbluth coefficient
The Rosenbluth Coefficient is defined as
Practically, the Rosenbluth index assigns more weight to weaker competitors. Such a measure which weights each competitor by its rank rather than by its “share” seems very appealing for our purpose.
The Rosenbluth coefficient is related to the Gini coefficient through
Results and analysis
Numerical results should be examined along two perspectives: (i) one takes into account new indices based on imposing the constraint that a team evaluation and ranking depends on the members at the valuation time (here at the end of the race), but (ii) besides global statistical values, i.e., irrespective of the team rank, one distinguishes values taking into account team ranks, as a weight. The global values are found in Table 7, in the top and bottom respectively. Most of the outputs arise from freely accessing https://www.wessa.net/desc.wasp.
Table displaying a few concentration coefficients resulting from the final ranking of the (
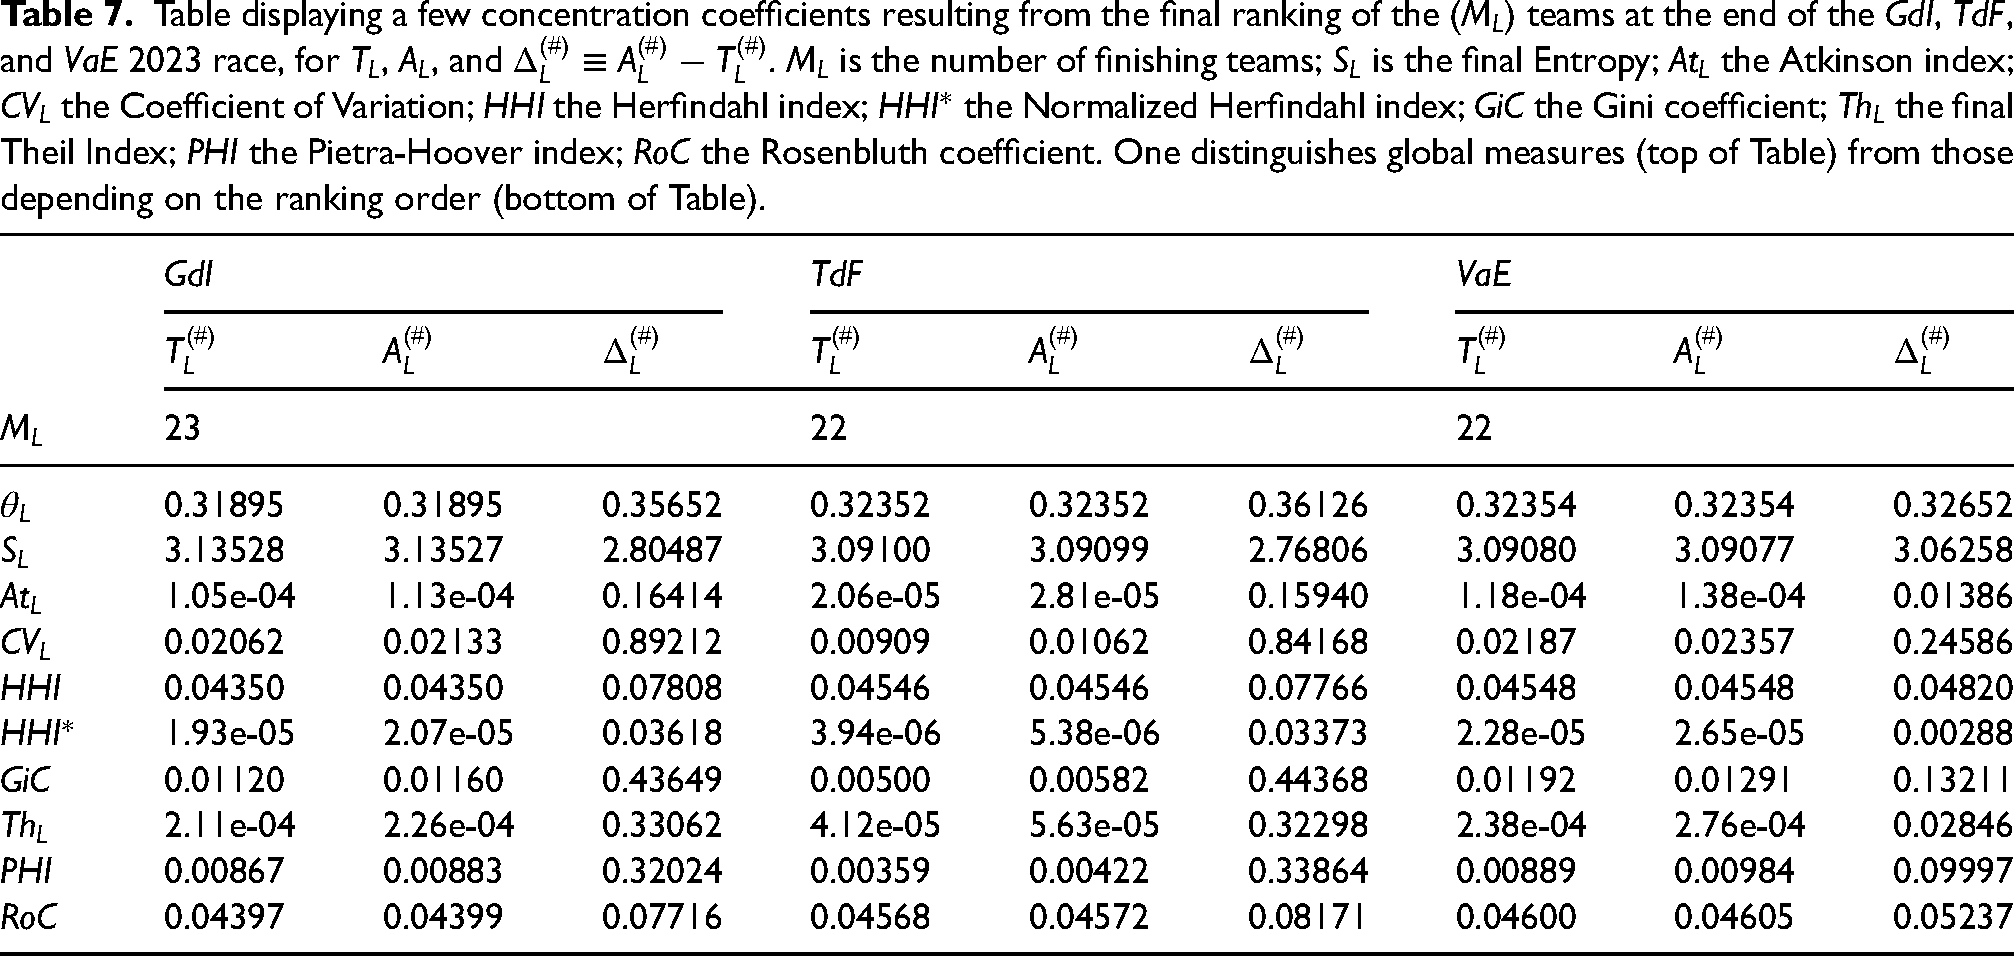
One can remark that the orders of magnitude for
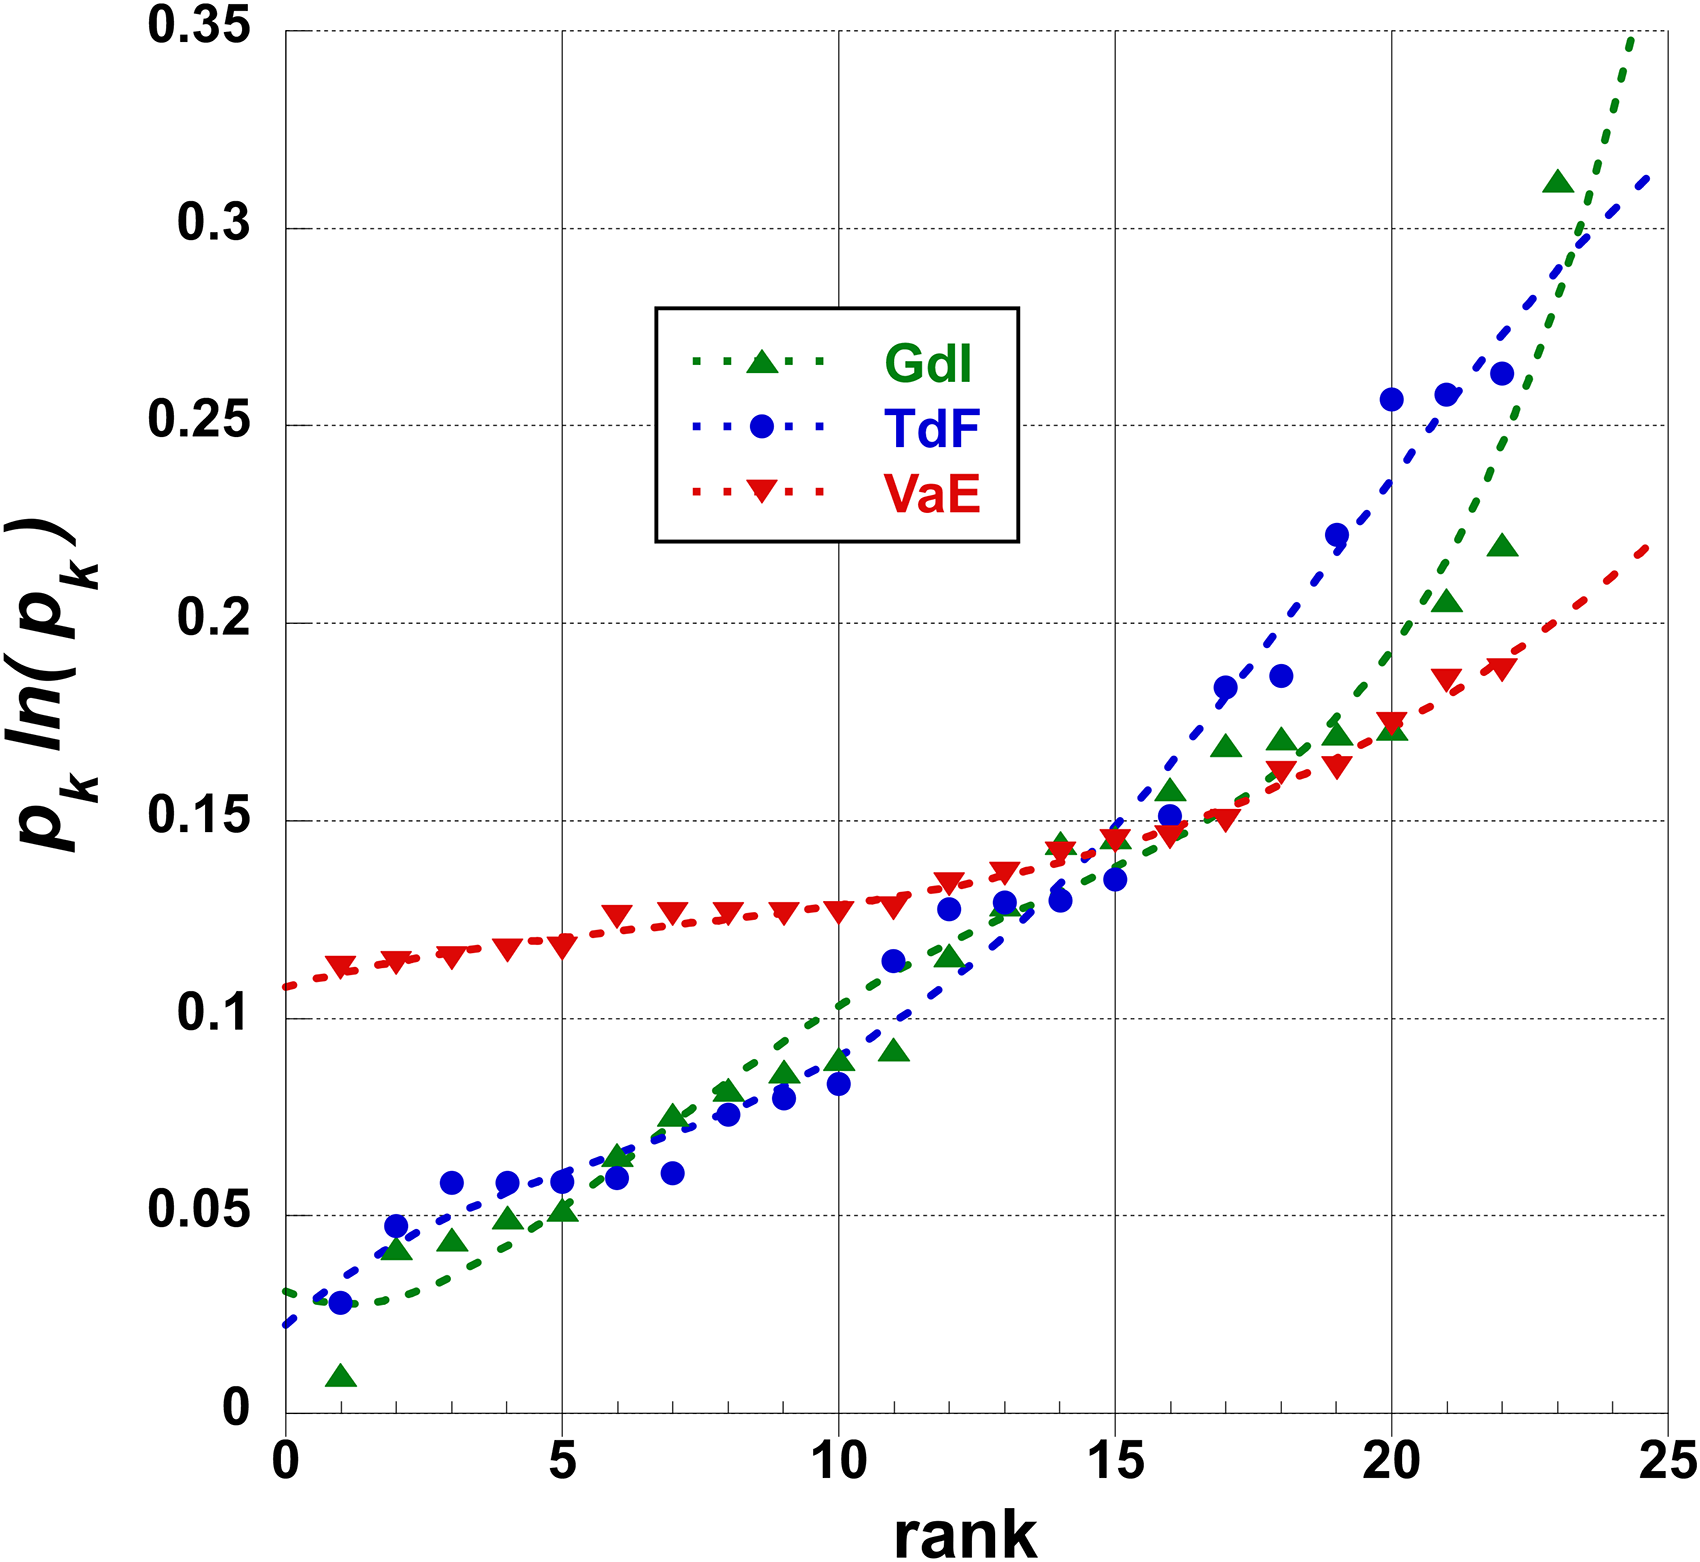
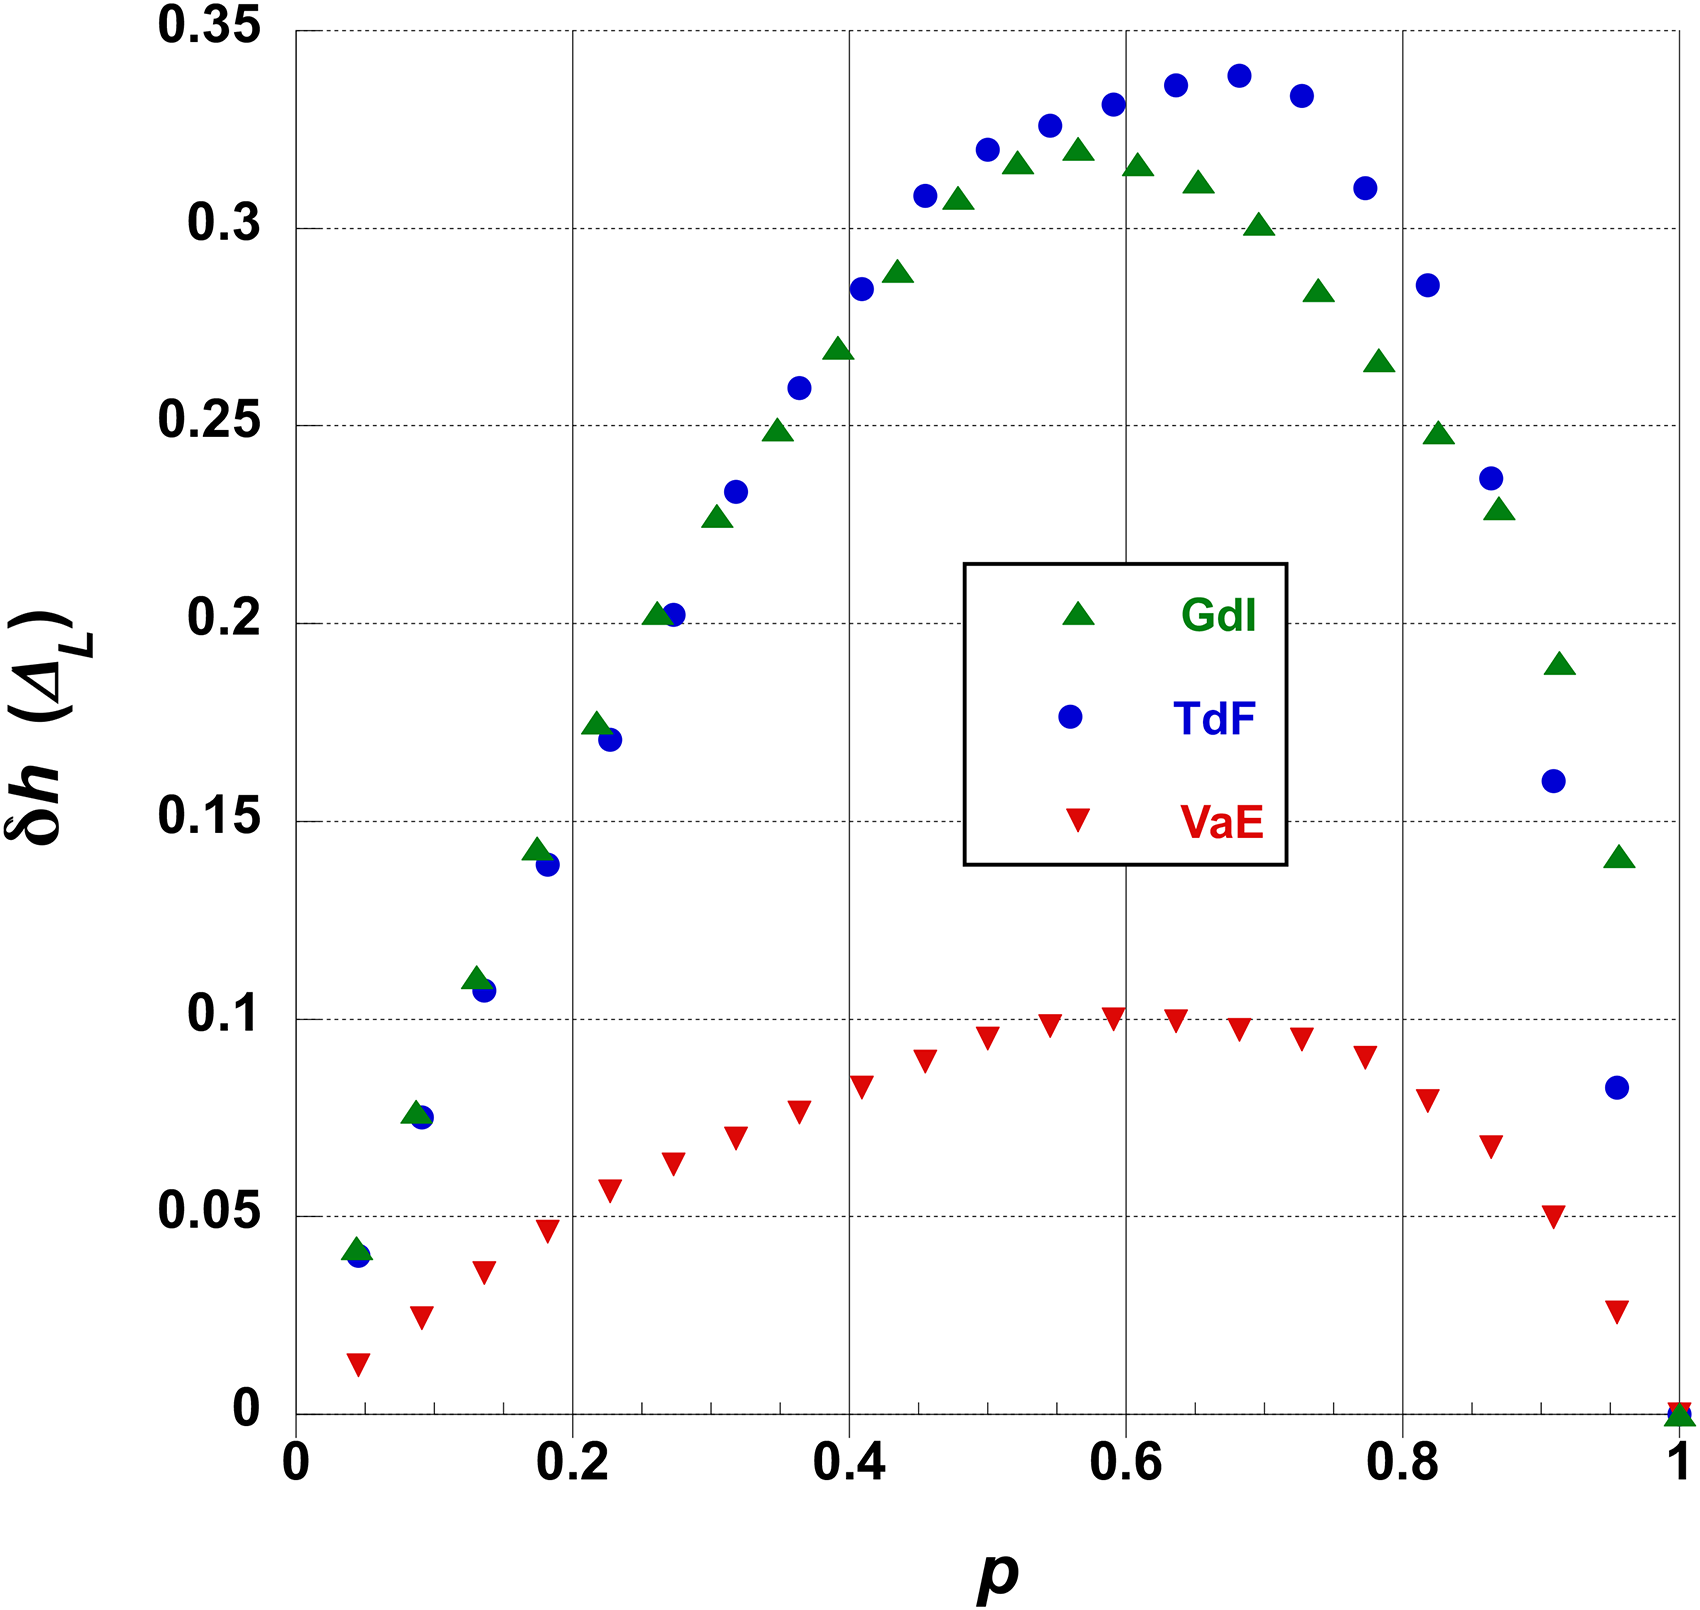
The first display of interest should be the new
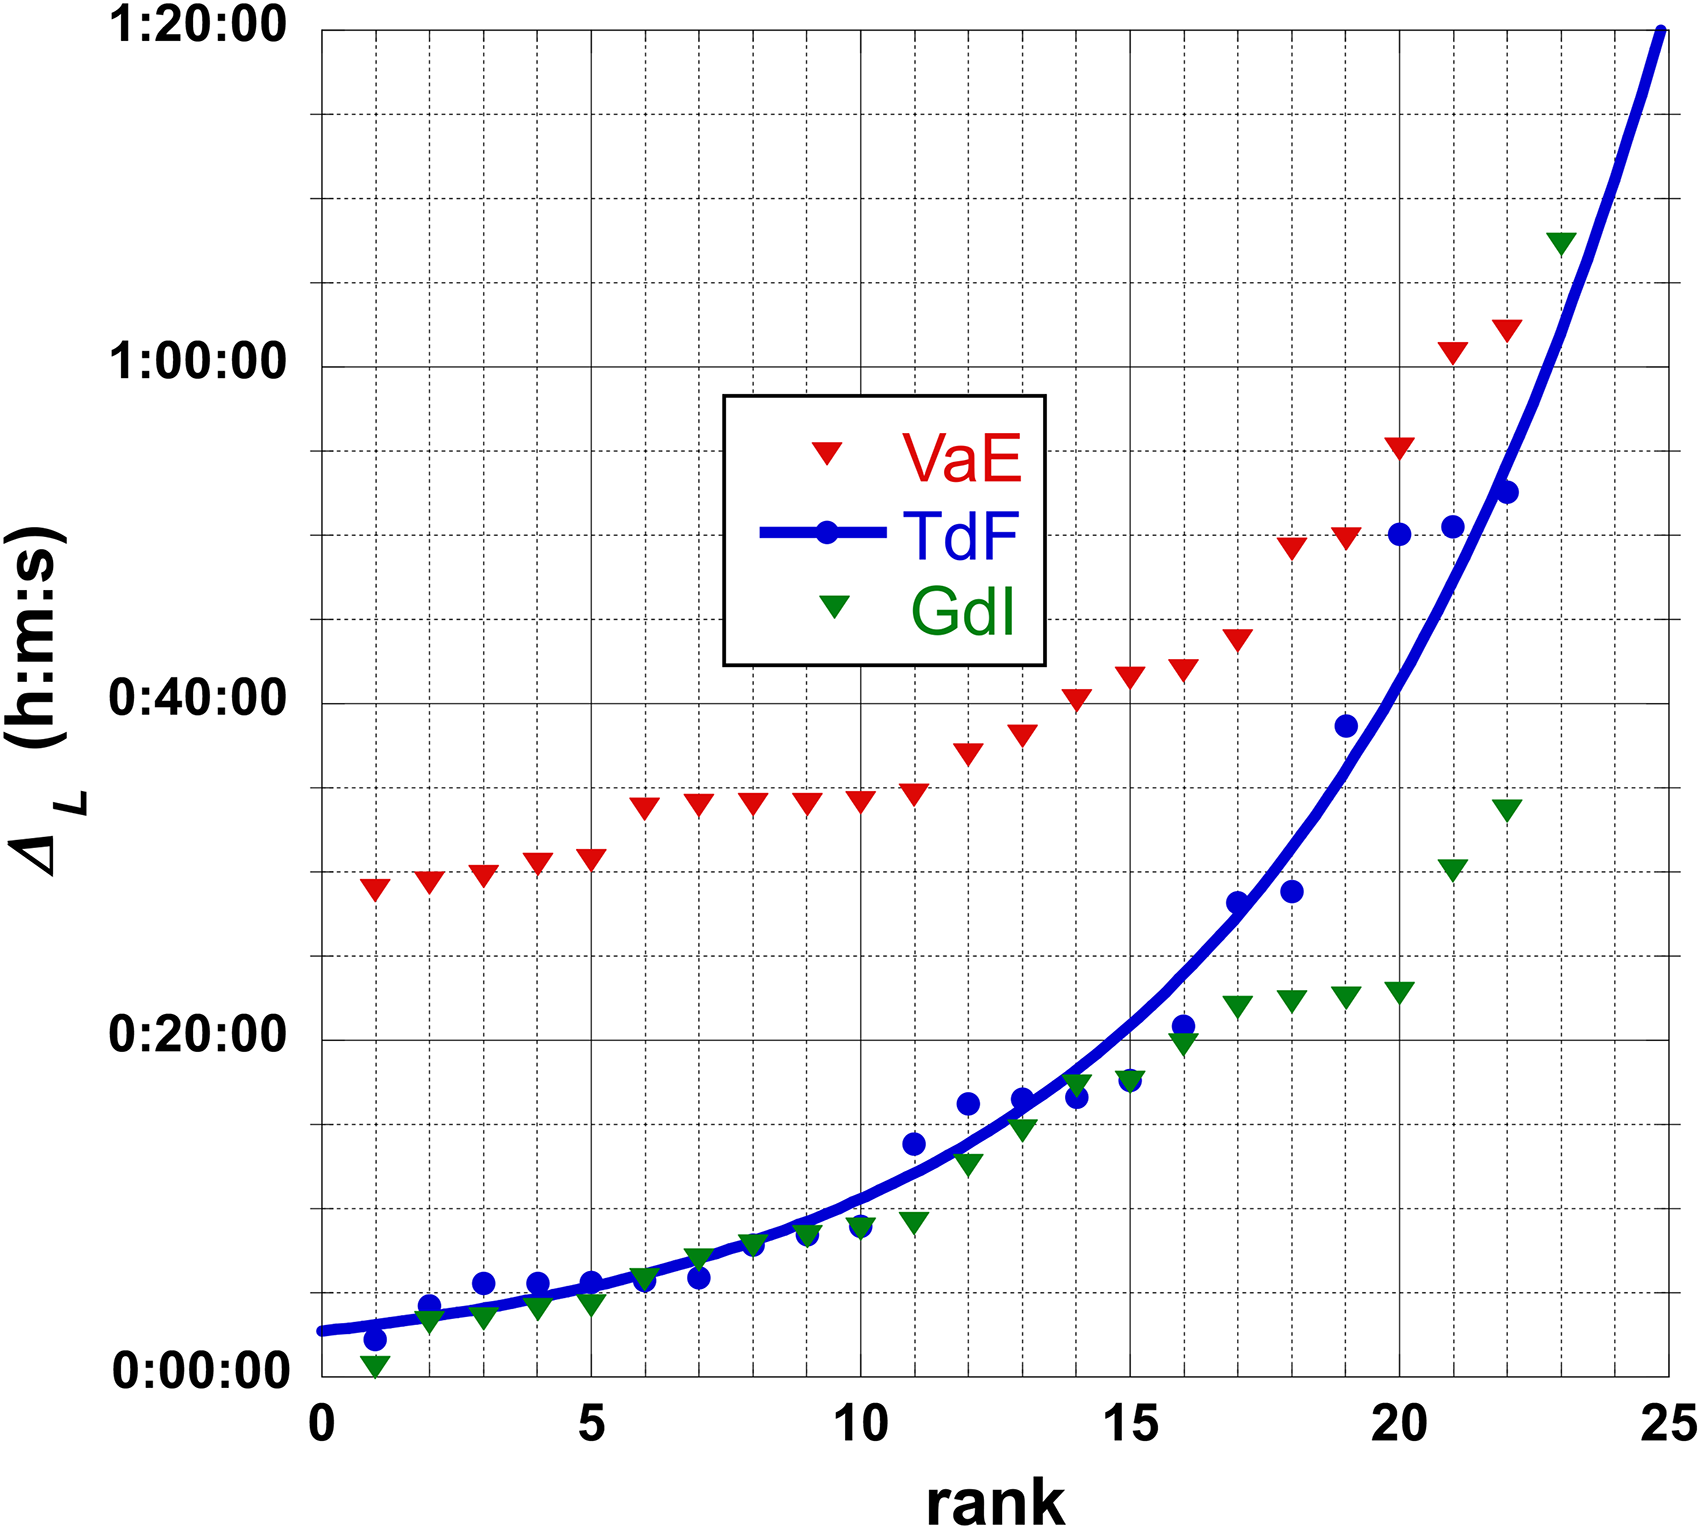
Plot of
For the best ranked teams (
Other new indicators imply the
Plot of the stochastic Shannon entropy of a team,
Similarly, one can study the contribution of each team to the Theil index through
Figure 3 shows the plot of the
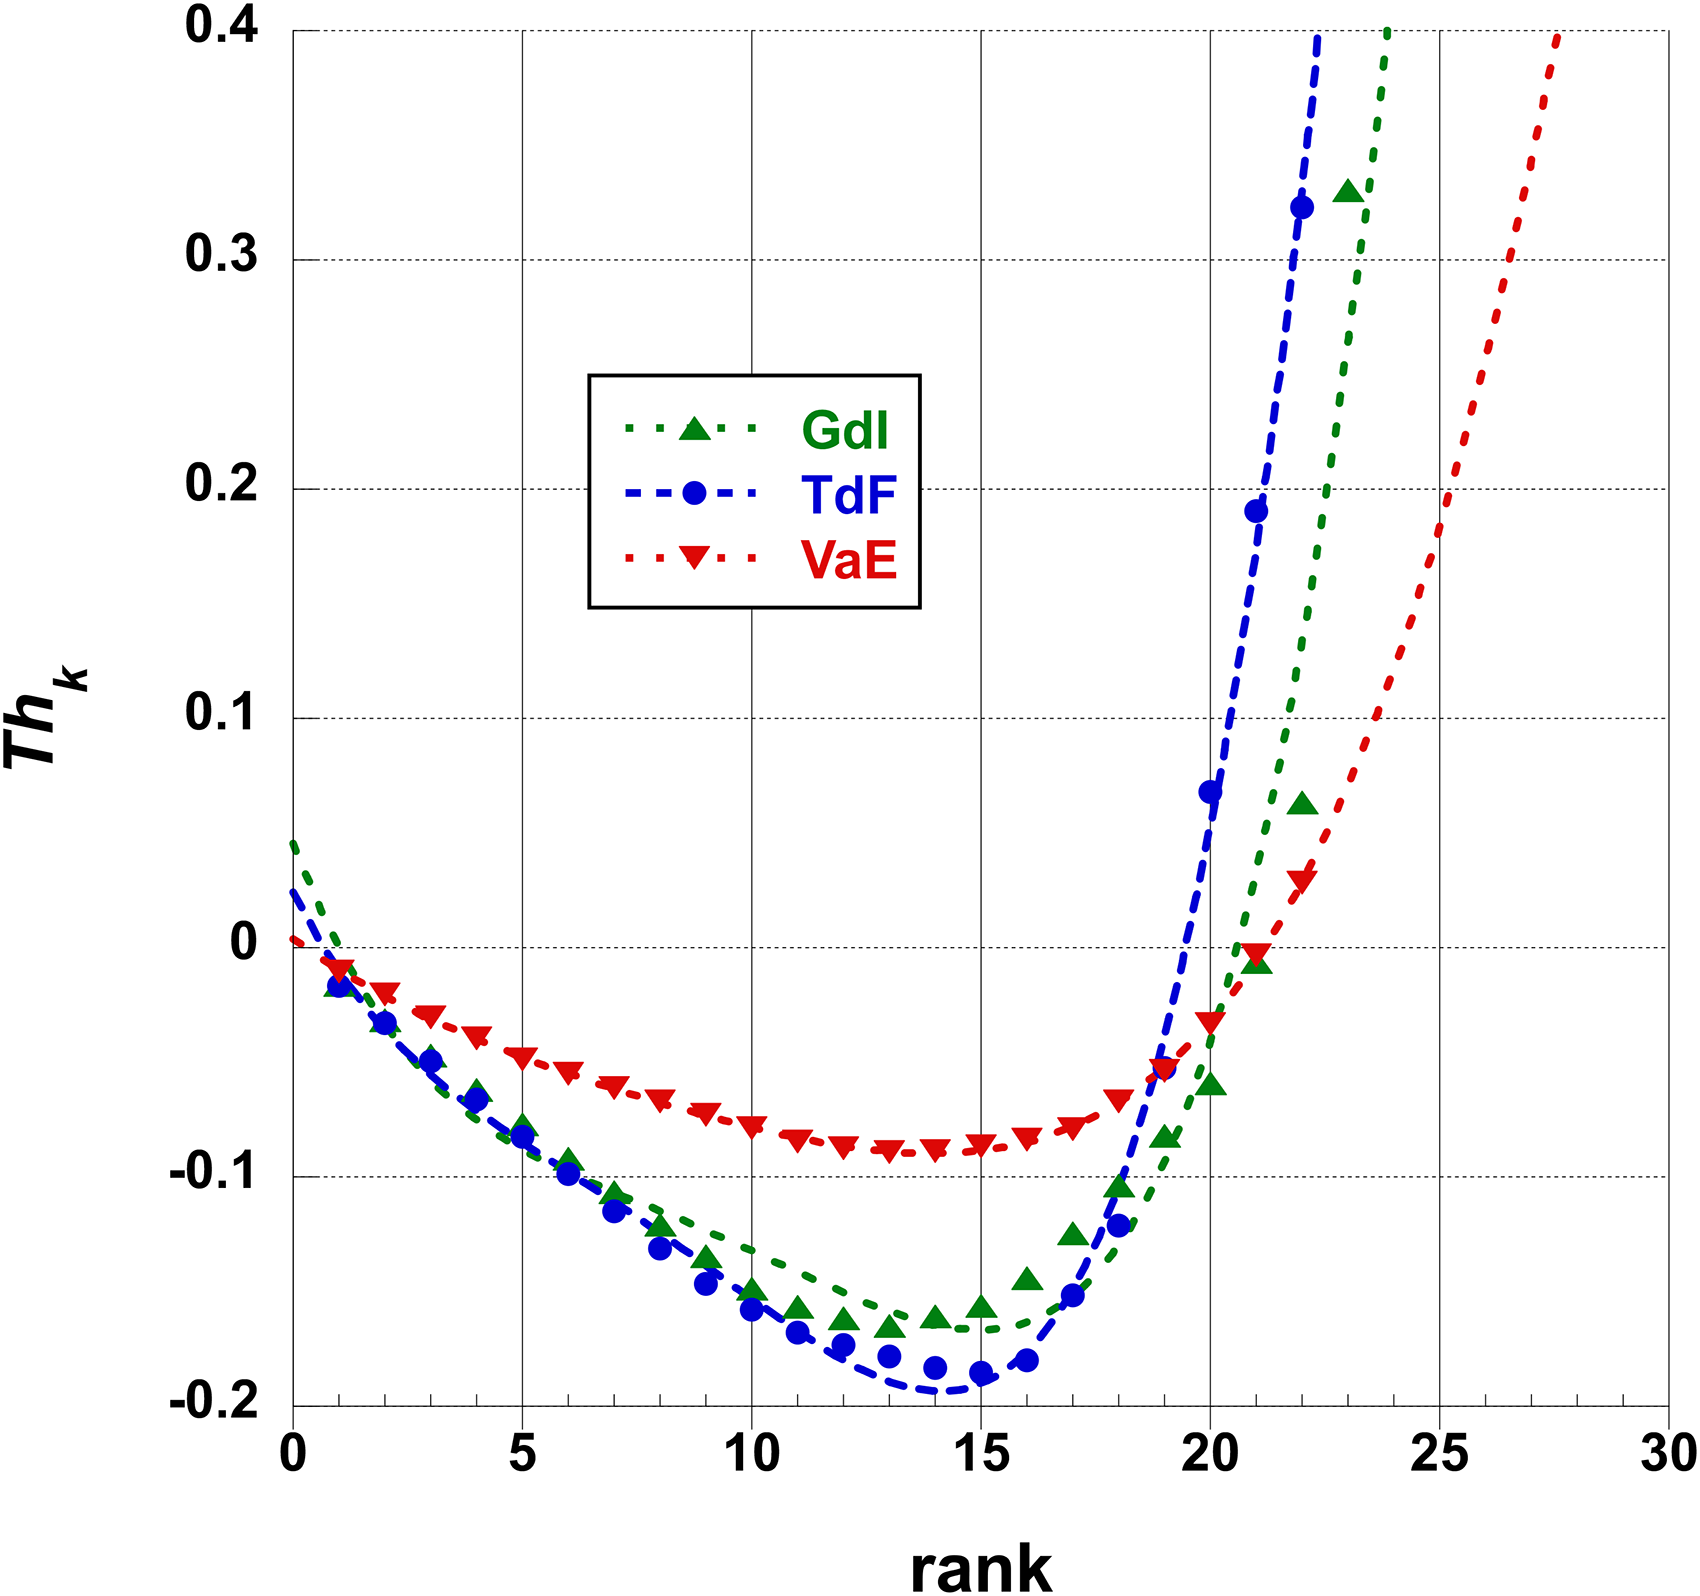
Plot of the team Theil index contribution,
The most classical indicator of inequalities is the Gini coefficient; it is often presented as resulting from the ratio of surfaces, - somewhat difficult to estimate at first sight. In order to provide a better vizualisation, one displays the evolution of the distance to the equality distribution line
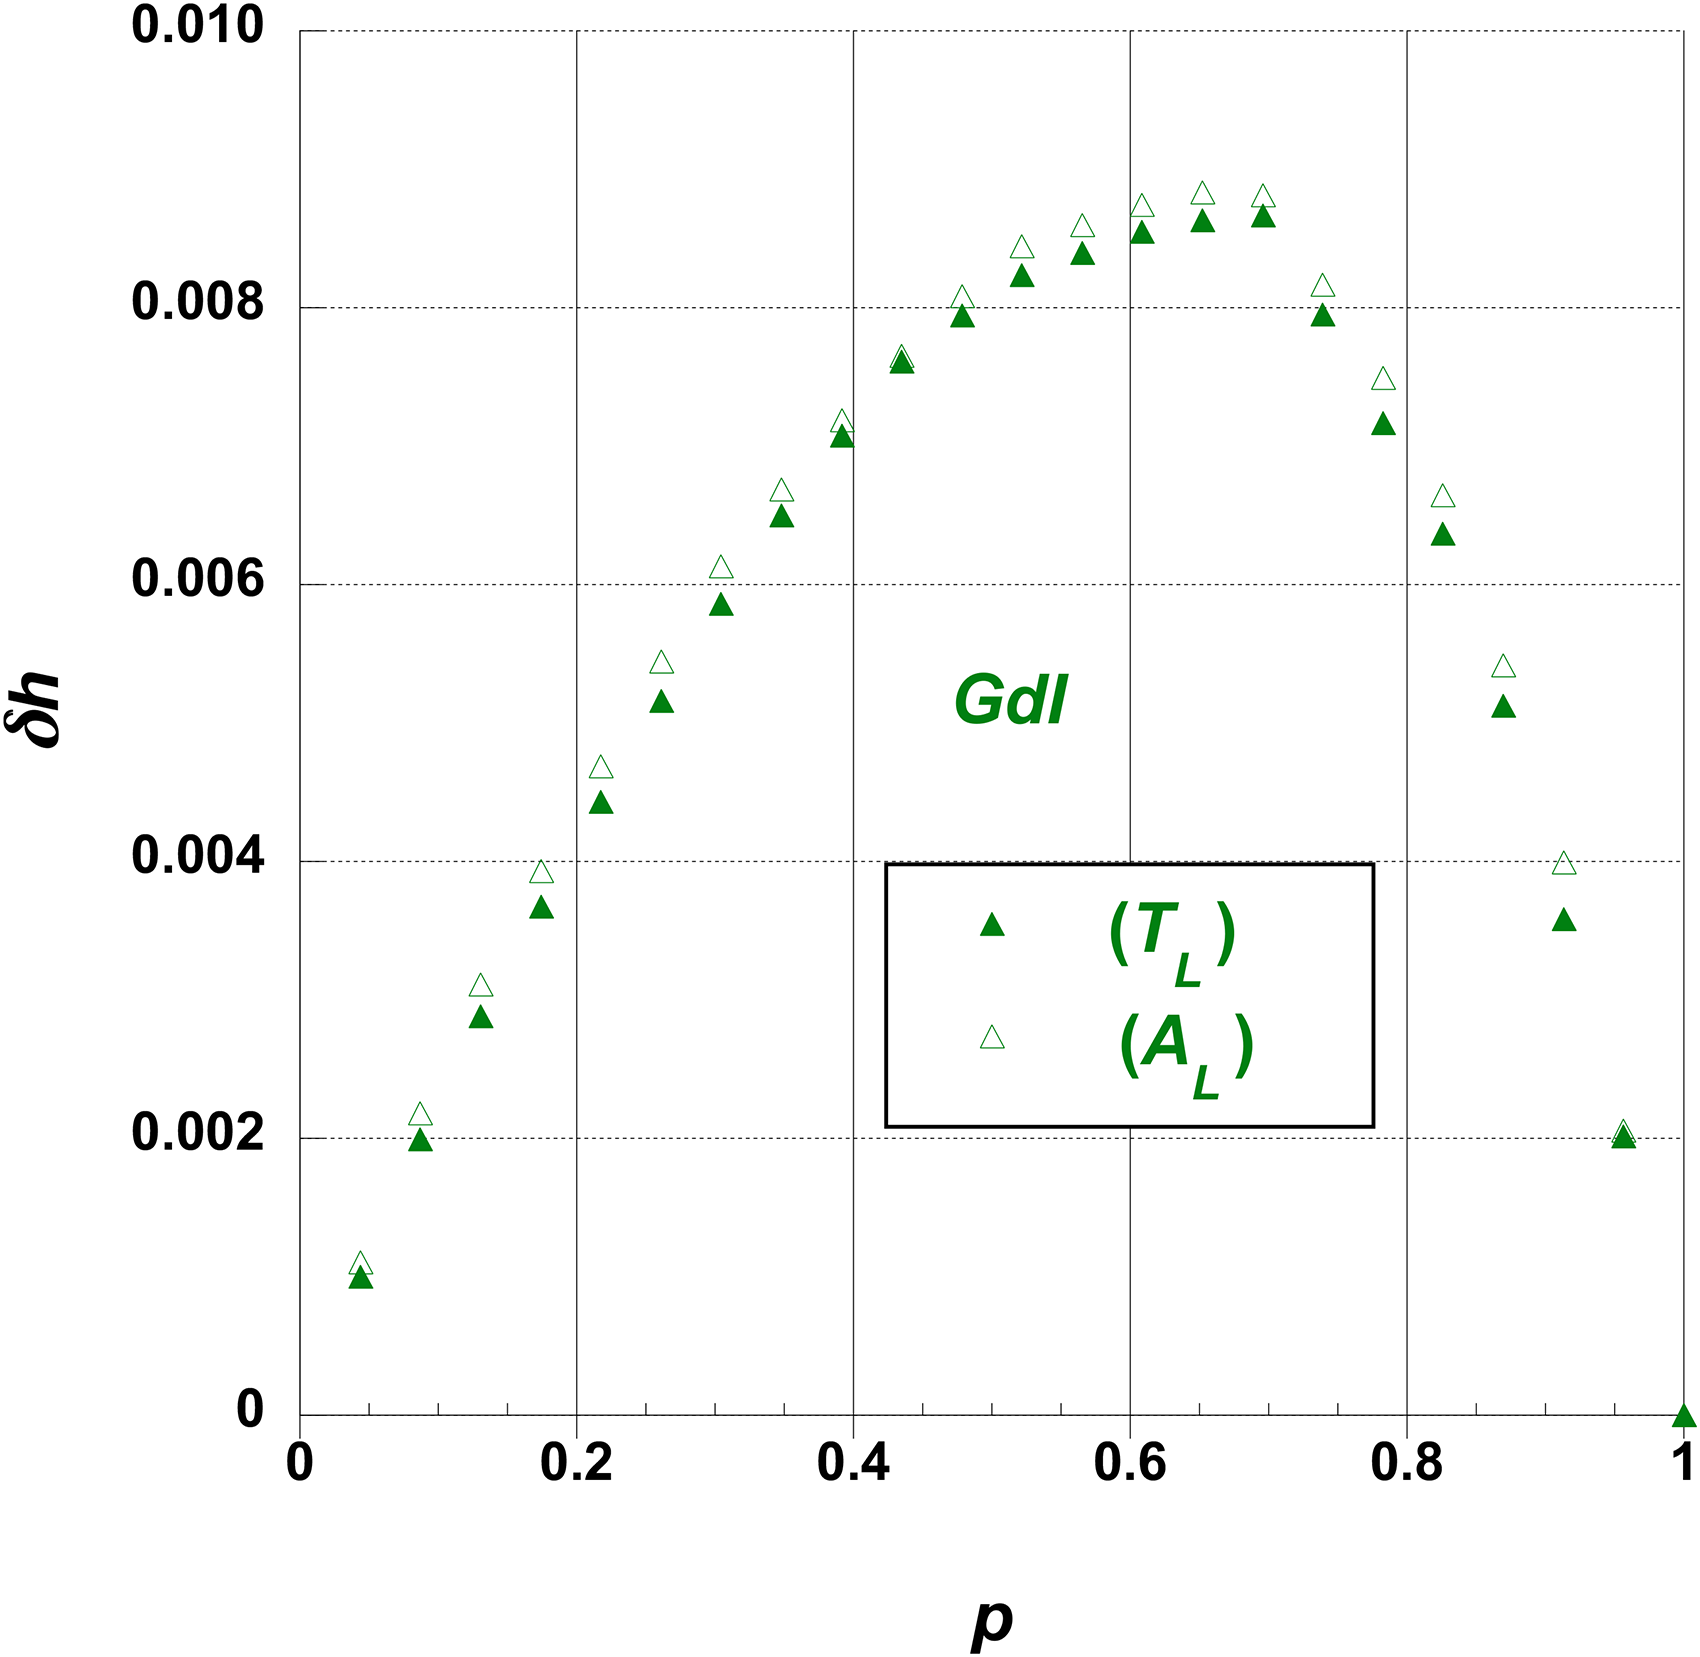
Display of the distance
Display of the distance
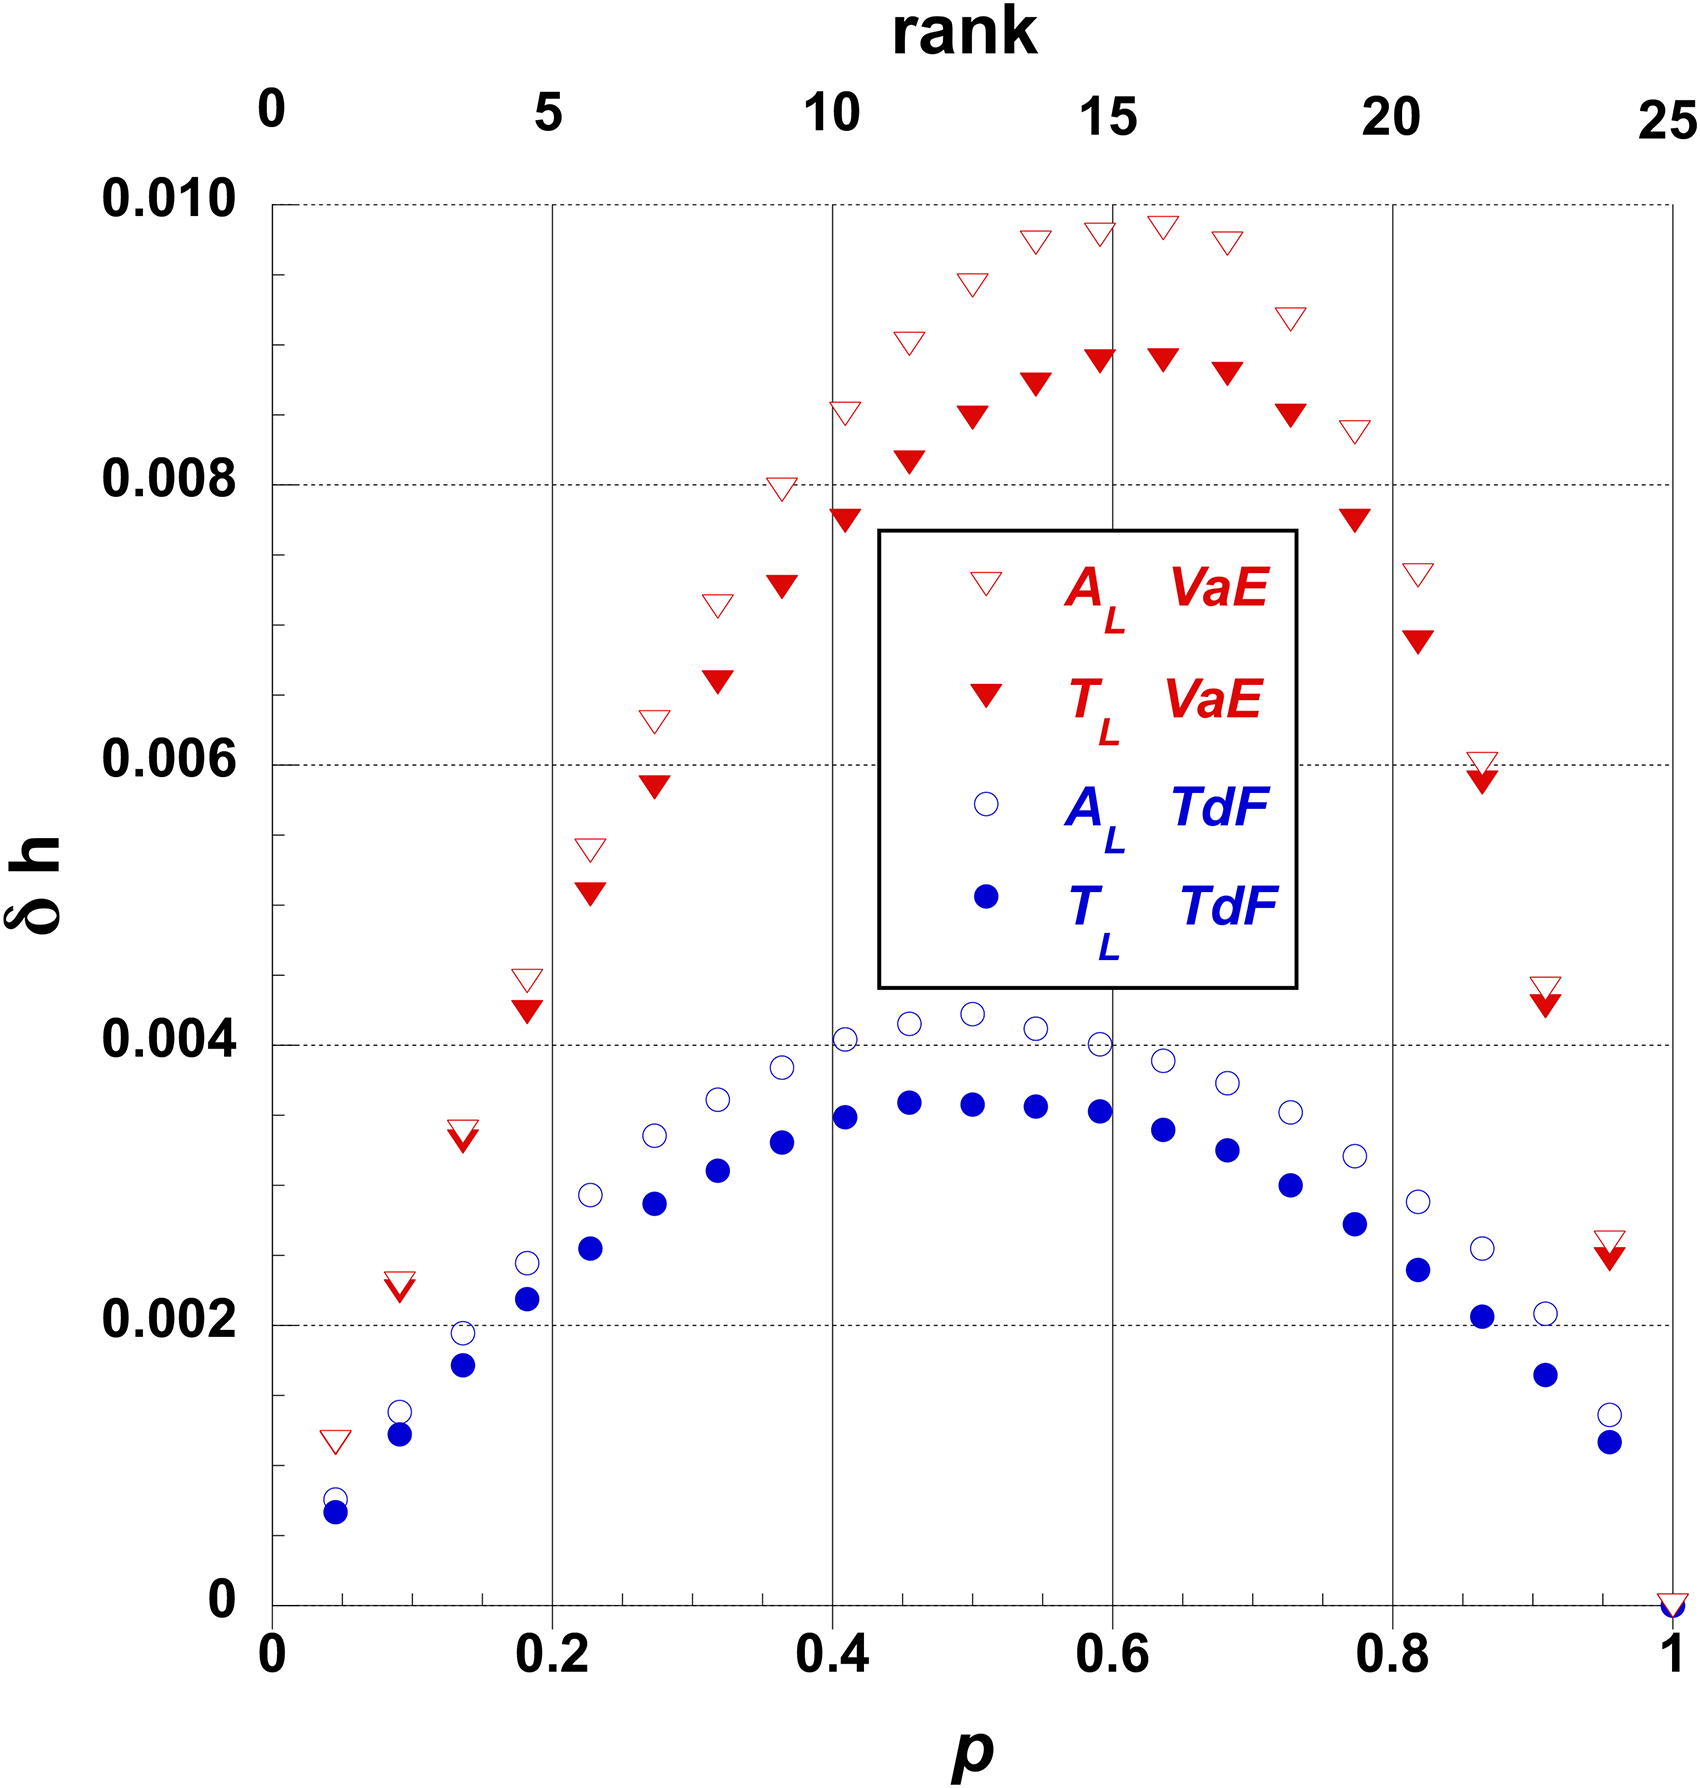
Figure 6 displays the distance
Display of the distance
One may propose some interpretation of a team core existence by analogy with an anharmonic oscillator. A few teams, the main ones, have definite goals and aims, with ad hoc team composition but the other teams anticipate or respond to the strategy of the leading teams which have well defined and expectedly well performing leaders. Beside the rider skills differences, whence anticipating different levels of performance, one can also imagine that the not-too-best teams response introduces some non-linearity in the overall race dynamics description.
In all these Figures, in particular in Figures 2 and 6, it might be noticed that the
Figure 7 is a plot of
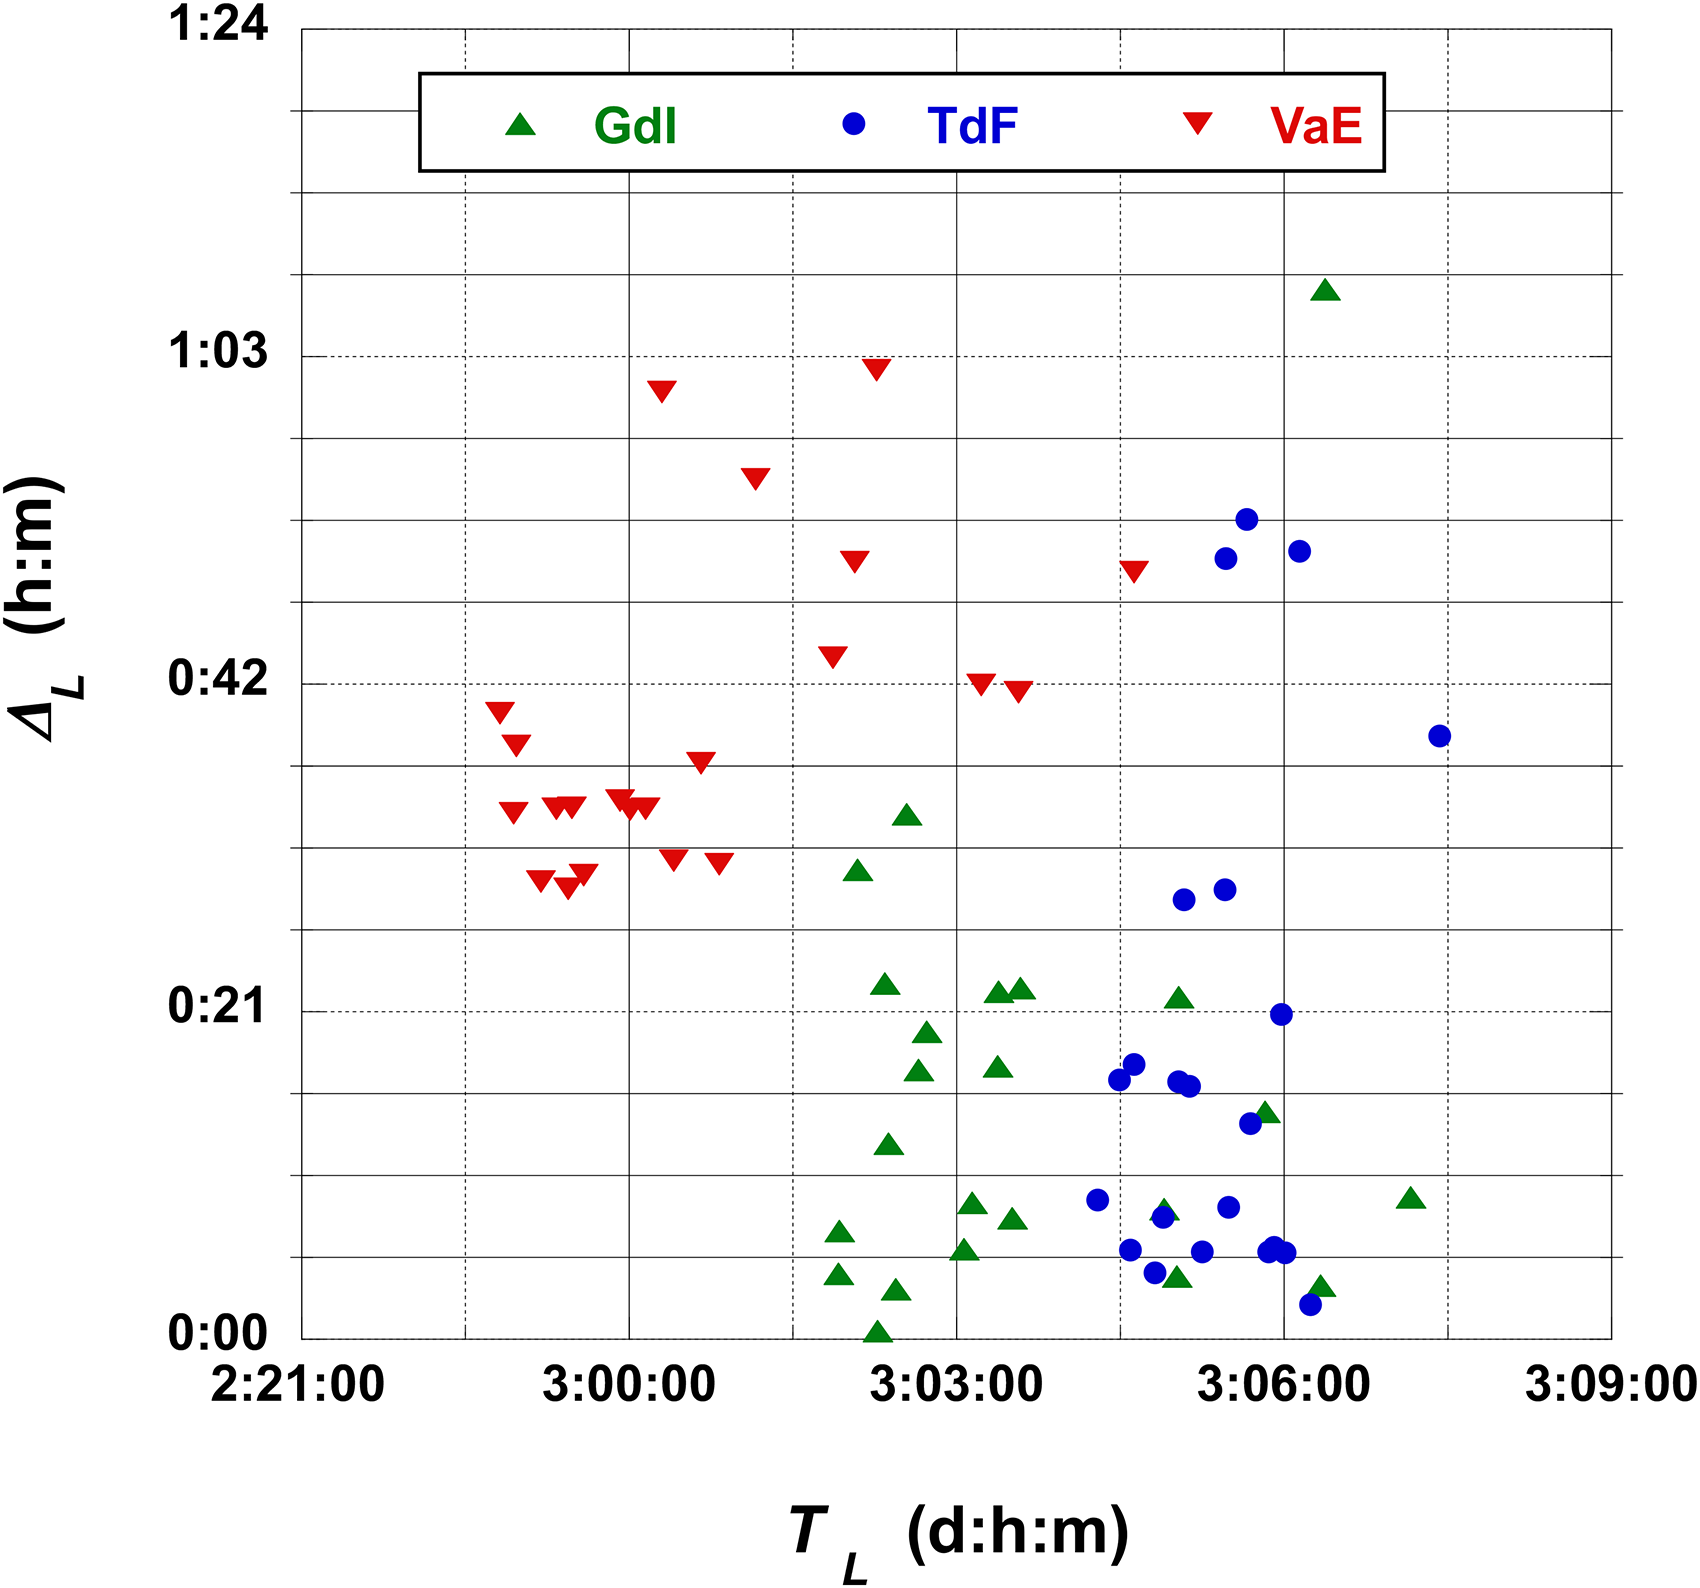
Scatter plot of
In the same line of thought, one could compare the differences in team ranks in
Observing the Tables and the Figures, one is rightly tempted to look for team clustering, within the perspective of this study.
In Tables 3 to 5, one can observe clusters, admitting rank swapping:
In Figures 1 and 7, one can observe clusters of teams for
but see also a step at
These observations remind of self-organized complex systems, often amounting to 3 clusters (high, medium, low ranks/classes) under collaboration-competition rules as found in many societies.55,56
Discussion
Before discussing features, let it be recalled that one looks for (new) indicators containing (new) filters, in particular for stressing the contribution input of team members to a team rank, - due to manager selections and strategies. Thus, one introduces the “leadership gap”
From all Figures and Tables, one can notice that the (new) indicators reflect different contents: the former makes more precise the role of team members through their entire participation in the hierarchical procedure, while the latter emphasizes the strength of the competition leading to the final ranking.
An additional contribution stems from the weight given by the ranking to the indicators, when displaying them as a function of the team ranks (Figures 1 to 6).
In fact, one observes the existence of clusters of teams, more explicitly in Figure 7 as in many examples of socio-economics populations: a high, a medium and a low class of teams. Further investigation might be pursued through a recently proposed cluster stability indicator, Unit Relevance Index (URI). 57
Let us recall that (alas) it is very difficult to move from one class to another, except through the introduction of external fields, - most likely money as the incentive. Inequalities and concentrations are inevitable but one can observe how extreme cases are concerned. As examples, one has noticed that the two best teams may interchange their rank according to the filtering, see Tables 3 to 5. Same for the worst teams. In both cases, very generally, the matter is very relevant for team management and race strategies. However, in order to maintain some form of competition, one has not to neglect the “middle class” as the needed ballast. Nevertheless, the most relevant features to be considered are those containing extreme values since they are expected to lead the search toward the main differences in team ranking, - and specifically here disentangling characteristics.
Whence one enters into the consideration about collusion, or competition-collaboration,
55
- which might change from stage to stage. Further studies should concern whether such collusions can be observed in each stage, in other words how the teams move in the range around the extremum in the displayed curves, particularly in the
Whence the study of “ranks resulting of strategies and skills” through the classical indices, but further taking into account the rank as weight, could add further values to the reliability of hierarchy findings, and promote attractive competition.
Conclusions
Therefore, before optimizing strategies, one should be convinced of the validity of efficiency criteria. In the present report, one focuses on team ranking when the valuation outcome depends much on the performance of a subset of team members. It is argued and demonstrated through data found in cycling races. It is suggested that new indicators be compared to classical ones. This leads to observe features, like inequalities, clusters, “amount of competition”, “race temperature”, i.e., measures which provide quantified meanings outlining possible strategic goals arising in many team competitions. It is interesting to point that one can one observe management strategies, through indicator values comparison in a given race or when comparing races. Thus, even within such case studies, quantitative measures suggest considerations for further empirical modeling.
In conclusion, the indicators based on (i) the concept of difference between the distributions of data points, and (ii) on a probabilistic reasoning take into account the team final competition measure in an information-like approach, - the Shannon entropy. The proposed methodology is practical, simple, and useful: the study emphasizes that the method is based on scientific rationality and logical principles. A desirable characteristic of inequality measures is the existence of a graphical analogy with the indicator. This can enhance interpretability and help communicate results to non-experts. The study reported here above presents such graphical characteristics allowing the valuation of team performance, - Figures 3 to 6. The new notion of “crucial core rank”, emphasising the main teams is well illustrated, and original.
In summary, the analyses of the proposed indicators point to a few practical features. For example, Tables 1 and 6 allow to envisage race difficulties differences. The displayed values emphasize that the time distributions of
In brief, the numerical values point to differences in team strategy and goals in a given race based on rider skill levels. Thus, it seems admissible that the indicators are new useful measures, but surely need to be further examined and developed.
Notice that the definition of
Finally, it might be interesting to further discuss the Stage and Race Temperature indicators, e.g., through illustrative examples in order to appreciate the practical and theoretical meanings of the “intensity” measures. It can be suggested, as further research, that one constructs hypothetical races with only a very small number of teams teams and choose sets of
The suggestion might clearly demand longer sets of investigations, in order to grasp a meaningful discussion on intensity sizes; this obviously demands several simulations covering several cases.
Nevertheless, races with only a few competing teams are not common. World Rally Championship (WRC) competitions might be of interest, - but the teams ranking rules are very different from those in cyclist races.
Thus, last but not least, even though the paper contains an original contribution to a special type of sporting activity, the lessons learned can be of more general use for many other activities, i.e., as long as the outcomes depend not only on the team effort but also on the performance of a subset of members of the team. Open questions remain on the collaboration-competition aspect of such races.
Footnotes
Acknowledgements
Thanks to reviewers and editor for their patience and comments. Thanks to Prof. J. Miśkiewicz for much help on coding.
Ethical considerations
Not applicable.
Data availability
Data is freely available, see text.
Declaration of conflicting interests
The author(s) declared the following potential conflicts of interest with respect to the research, authorship, and/or publication of this article: Neither relevant financial nor non-financial competing interest has to be mentioned.
Funding
The author(s) disclosed receipt of the following financial support for the research, authorship and/or publication of this article: Work was partially supported by the project “A better understanding of socio-economic systems using Quantitative Methods from Physics”, funded by the European Union—Next generation EU and the Romanian Government under the National Recovery and Resilience Plan for Romania, contract no.760034/23.05.2023, code PNRR-C9-I8-CF 255/29.11.2022, through the Romanian Ministry of Research, Innovation and Digitalization, within Component 9, “Investment I8”. Moreover, P.K. acknowledges the support of ‘Digital Finance - Reaching New Frontiers’ (Horizon Marie Sklodowska-Curie Actions Industrial Doctoral Network), Ref. Number 101119635.
Appendix A
Considerations on the Kendall
How teams are ranked might have a substantial effect: in sport, the prize money is higher for the first teams than for the others. Sometimes the last teams face relegation and may loose sponsors. Thus, a swap in positions, due to different ruling, may be crucial.
The difference in hierarchies, including the scattering of the results, derived from ranking rules, can be classically measured through the Kendall
In order to weight the position of discordant pairs, Csató has proposed a hyperbolic function:
For completeness, one can observe the number of concordant
Notice that practically, in order to compare the ranks of pairs of teams, it is first useful to organize the teams in alphabetical order, giving them the appropriate rank for a given indicator. In all studied cases in the main text, the ranking chosen is that corresponding to
Notice that the indicators distances are necessarily ordered:
Appendix B
Considerations for extensions to daily stages.
One can sketch how to specify the main text considerations toward a daily ranking mechanism, within a multi-stage race.
Recall that
For the first stage,
After the 3rd stage,
Next, consider the adjusted team time after two stages
This seems to represent better the team time evolution and leads to avoid Cipollini-like effects. 21