
Abstract
Models of training intensity distribution, such as polarised, pyramidal, and threshold, often have varying interpretations in the literature. Despite observational research into the practices of elite endurance athletes and a growing body of experimental research into the application of intensity models, insights into how and why coaches prescribe these models are lacking. Therefore, this study explored the practices and perceptions of cycling coaches concerning their use of fitness testing, intensity zone generation, and periodisation within their programming. 117 cycling coaches completed an online survey focused on their coaching background, use of testing and test protocols, training monitoring practices, and perspectives on training intensity distribution. We found that coaches mostly used functional threshold power testing to determine intensity zones, with the number used depending on the measure, e.g., power or heart rate. Respondents defined the polarised model as 80.8 ± 4.6% (low), 3.3 ± 6.1% (moderate), 17.4 ± 4.7% (high), the threshold model as 44.5 ± 16.7% (low), 44.0 ± 13.8% (moderate), 13.2 ± 7.6% (high), and the pyramidal model as 67.5 ± 10.4% (low), 23.4 ± 8.6% (moderate), 9.1 ± 4.0% (high), by time in zone. Most respondents (94%) would change the intensity distribution depending on the phase of the season. While polarised was the most common model overall, moving from a pyramidal to a polarised model towards racing was the most common periodisation strategy. This study builds on observational research to provide a unique insight into the rationale behind coaches’ intensity distribution model prescriptions and periodisation.
Introduction
The determinants of road cycling performance include a high maximal oxygen uptake (
Measures of training load in cycling include external measures such as distance, work performed (kJ), and Training Stress Score (TSS), as well as internal measures such as heart rate (HR) and rating of perceived exertion (RPE), which reflect the physiological impact on the body. 6 Coaches often prescribe training using external load measures, which elicit an internal load, to generate the stimulus for adaptation. 7 However, research has shown there is often a discrepancy between the coaches’ intended RPE, and the RPE reported by cyclists in practice.8,9
TID is generally expressed in relation to a physiological landmark such as the first and second lactate (LT1, LT2) or ventilatory (VT1, VT2) thresholds. 10 This method generates three intensity zones (low, moderate, high), which are commonly used to quantify TID in scientific research. 10 However, for training purposes, additional zones are often used to allow more precise programming. 11 The number of zones used in coaching practice varies. Factors such as the mode of exercise and physiological basis for the zones (e.g., HR, blood lactate, or RPE) influence the number of zones used.11,12 TID may be classified using either the time in zone method (TIZ), where the percentage of time spent in HR or power zones is recorded, or by session goal (SG), where each session is designated as low, moderate, or high intensity, based on the target of the session, or working intervals. 13
The most common TID models identified in research are the threshold (THR), polarised (POL), and pyramidal (PYR) models. 14 Definitions are often inconsistent between studies, but broadly, the THR model emphasises a focus on moderate intensity training, often > 35% spent between LT1 and LT2. 15 The POL model is defined as either comprising mostly low intensity, with some high intensity, while avoiding moderate intensity, 14 or combining the moderate and high intensity to form ∼20% of the training. 16 Finally, the PYR model features a decreasing volume, or number of sessions, in each ascending zone. 17 However, as agreement on a fixed definition of each model is lacking, overlap is common between the various interpretations of each. For example, a POL distribution by SG was described by Neal et al. as 80% (low), 0% (moderate), 20% (high), 18 but a POL TIZ distribution can range from 68% (low), 6% (moderate), 14% (high) 19 to 93% (low), 6% (moderate), 1% (high), 20 with the latter also meeting the broad criteria for a PYR distribution as they feature decreasing time in ascending zones. The issue of unclear definitions and terminology is widespread in training monitoring and prescription. 21 For example, LT1 and LT2 may be used to delineate intensity zones and, in turn, the TID model definitions and quantification, but there is widespread variation in both the definition of ‘thresholds’ used 22 and the test protocols used to generate those thresholds. 23 This introduces more room for disparity, which limits the possible comparisons between research into different models and the application of research to coaching practice.
Numerous studies describe the observed TID across various endurance sports, including cross-country skiing, 10 swimming, 24 running, 25 and triathlon. 26 However, understanding TID in cycling is of particular importance given the large volumes of training undertaken, high race frequency, 11 and the importance of balancing overload through managing intensity. There has been growth in the literature exploring TID in cycling in recent years, with much of the work focusing on world-class cyclists. For example, Gallo et al. observed the training of three top-5 Giro d'Italia finishers over the 22 weeks before racing, and reported a mean volume, including training and racing of 16.9 h.wk-1, with an average TID by power output of 87.2% (low), 8.7% (moderate), 4.1% (high) across the three riders. 27 Despite some variability, all three riders displayed a PYR distribution, which shifted closer to POL during their competition phase. A similar PYR distribution was also seen in two top-5 Tour de France finishers over a slightly longer period, with higher average weekly volumes (18.2–22.5 h.wk-1). 28 Since recreational and trained cyclists have much lower training volumes, the applicability of these findings to the broader cycling population is unclear, and is further compounded by the variability in TID quantification methods and definitions.
Understanding how cycling coaches use TID and how they define TID models is essential for understanding practice outside of scientific studies. While research has described the variation across the cycling season, 6 it is unclear how and why cycling coaches decide to prescribe this variation in TID. Current research is focused on the outcome of training prescription, both in terms of race results, and the observed TID/volume, rather than the reason for training prescription and the coaching process. 29 Given this gap in the research, our study aimed to explore the practices and perceptions of a large sample of cycling coaches regarding testing, the quantification of intensity zones, TID, and training prescription for cyclists throughout a training cycle, rather than generate specific guidance. 30
Methods
Study design and recruitment
A cross-sectional survey was used to establish the practices and perceptions of cycling coaches regarding training prescription and TID, specifically around fitness testing, determining intensity zones, and periodisation of intensity distribution across a season. The survey (Microsoft Forms, Redmond, WA, USA) was open to coaches aged 18+, who provide individualised coaching and was open between the 27th of February and the 20th of June 2024. Coaches were recruited through social media (snowball sampling) and email contact, with addresses obtained via online cycling coach directories (British Cycling, ABCC, USA Cycling, TrainingPeaks coach finder, and UCI team directories). In total, 757 coaches and 55 teams/cycling federations were contacted directly. Approval from Teesside University's ethics committee was sought prior to study commencement, with data collected in accordance with the Declaration of Helsinki. Respondents provided informed consent by completing the survey introduction page. All data were anonymous, with no personal details or identifiable information provided.
Survey design and development
The survey consisted of a mixture of numerical, multiple-choice, and short-answer questions, along with free text response options, which allowed coaches to expand on their reasoning for training programming choices. Structured in a logical, progressive order and broken down into three sections: coaching background, training monitoring practices, and their perspectives on TID. Questions covered the coaches’ years of coaching experience, the number of cyclists they currently coach, and the performance level of the cyclists. Followed by questions on their use of fitness testing, test protocol, intensity zone generation, the number of intensity zones they use, and how they incorporate different zones (e.g., HR and power). The perspectives on TID section determined coaches’ familiarity with the POL, PYR and THR TID models, and how they would define them using their chosen terminology in a free-text response. They were also asked to consider the effectiveness of different TID models, and how they periodise TID over the season. Prior to distribution, the survey was pilot tested with five cycling coaches/academics to assess content validity, with minor changes made to questions to enhance readability and collect additional information on TID definitions. No formal reliability or test-retest assessment of the survey was performed prior to distribution.
Data analysis
All responses were downloaded from Forms to Excel (Excel 365, Microsoft, Redmond, WA, USA) and manually tidied to remove any outlying responses or obvious mistakes. Numerical responses were analysed using descriptive statistics to calculate means and standard deviations. Where questions permitted multiple selections, frequency counts were used. Percentages were calculated based on the number of responses to each specific question. Free-text responses were analysed using a deductive content analysis approach. All coding was performed manually in Excel by a single researcher (PS). An initial codebook based on expected responses was further refined through multiple readings of the responses to balance sufficient detail and merge overlapping codes. Codes were generally assigned to words or short phrases within each response, e.g., “step” for the responses identifying a step test or incremental protocol used as part of the fitness testing.
Results
Respondents
A total of 117 (male n = 103, female n = 14) coaches completed the survey, with most respondents from the UK (29.9%), followed by the USA (12.8%), France (6.8%), Spain (6%), then Belgium, Canada, The Netherlands (each 5.1%). The mean coaching experience was 13.2 ± 7.7 years, with the number of riders each respondent coached being 13.0 ± 10.7. Most coaches (94.9%) had a qualification in coaching, sports science or a related area. Sorted by the highest level of academic qualification, 9.4% held a doctorate, 32.5% a master's, and 18.8% an undergraduate degree. In total, 70 respondents held a national governing body coaching certificate. This was the highest level of qualification for 32.5% of respondents.
Coaching level and competitive level
Most of the coaches have a competitive cycling background, 43.6% were actively competing, with 48.7% no longer active at the time of responding. As Table 1 shows, the coaches generally competed at a lower level than their cyclists.
The performance level of cyclists and coaches.
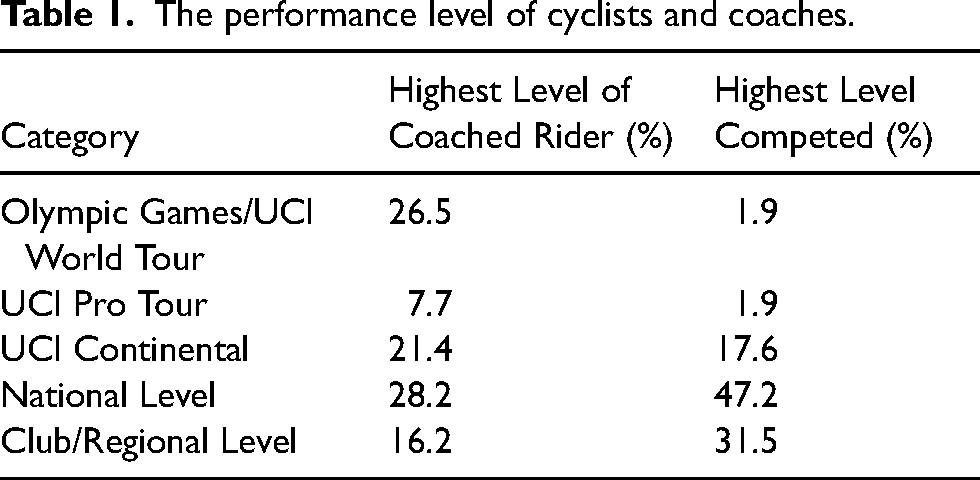
A count of responses (multiple answers possible) revealed most of their coached riders compete in road racing (112), time trials (98), and circuit racing (74), with the off-road events closest to road cycling, cyclocross (70) and gravel (69) next most frequent responses.
Fitness testing
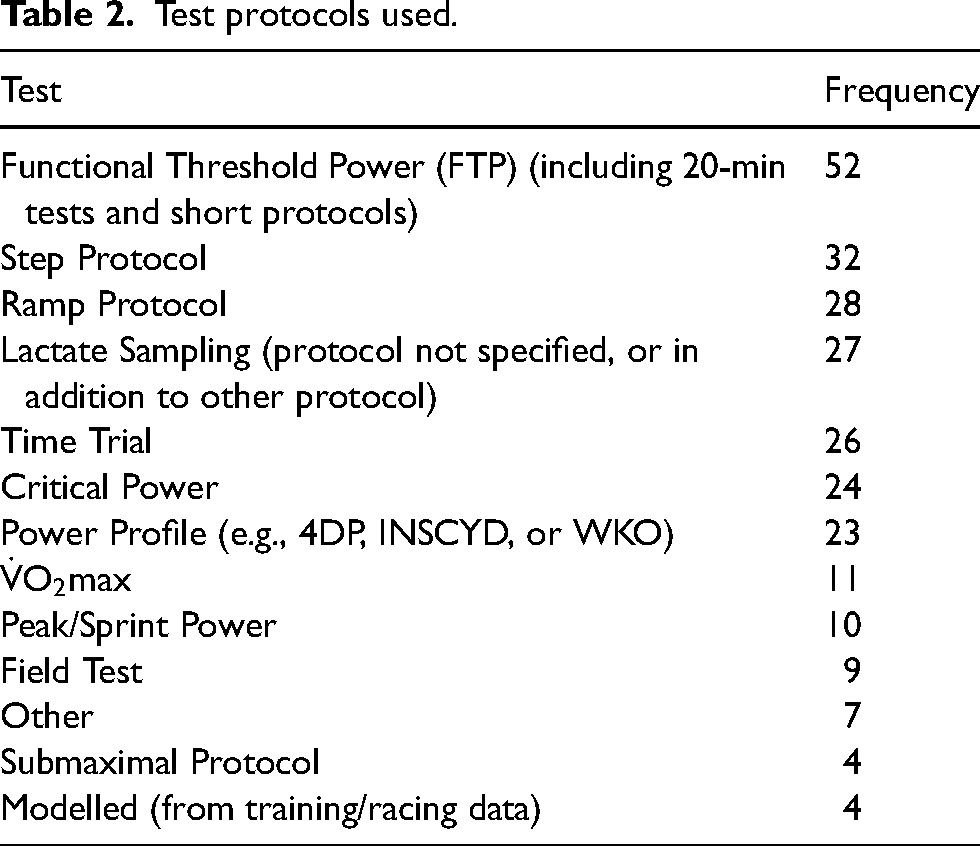
Most coaches (98.3%) conduct regular fitness testing with their cyclists. The most common frequency to test was quarterly/each phase of the season (63.2%), followed by ‘other’ at 15.8% (often coaches explaining it varied by rider, or somewhere around every eight weeks), then monthly (10.5%), and yearly (8.7%), only 1.8% of coaches tested every week. Test protocols were coded from free text responses into the categories displayed (Table 2). Multiple answers could be coded depending on the level of detail given.
Test protocols used.
Nearly half of the coaches (41.9%) considered lab and field testing equally useful. The coaches (33.3%) who preferred lab testing cited accuracy (19), control (12), reproducibility (4), objectivity (3), and ease (1) as their justification. In contrast, the 24.8% that preferred field testing expressed concerns about the ecological validity of lab testing (17), especially the impact of being indoors and on an ergometer rather than their usual bike. Cost/lab access was highlighted (11), followed by concerns about the specific test protocol (6), and stress to the athlete from blood sampling (3).
Intensity zones
Nearly all (96.5%) coaches used the testing to generate intensity zones. The most common way to generate zones was by using a percentage of functional threshold power (FTP) (59), followed by using a physiological marker (34), measured power durations (14), critical power (11), and a software calculation (10). The measure used to set zones was most commonly power (117), followed by (and often in combination with) HR (91), RPE (52), and blood lactate (38). The mean number of zones used was 6.2 ± 1.1 (range 3–9), the most frequently used number of zones were five (26), six (37), seven (35), and the nine-zone system from WKO iLevels (5). HR users tended to use the 5-zone model, while those using power typically used six to seven zones.
A total of 61.7% of coaches reported using different zones (e.g., based on different measures) depending on the aim of a training session. There was a preference to monitor both HR and power, if possible, with around a third of respondents also monitoring RPE. Typically, HR was used as the primary measure, or an upper limiter, mostly for recovery, endurance, and sometimes threshold (∼LT1-LT2) intensities. Power was used as the primary measure above threshold intensity, as coaches discussed issues with cardiac drift, which limits the use of HR as interval durations decrease. HR monitoring was also used during training as a marker of readiness/fatigue. For very short-duration efforts or maximal intensity tests, RPE was typically used.
Intensity distribution models
Respondents’ awareness of common TID models was high (POL 89.7%, THR 79.4%, PYR 75.2%). Those aware of a model were asked to define it with a free-text response, specifically using the TIZ approach. Responses were then coded to align with the 3-zone model of TID quantification for consistency (Figure 1).
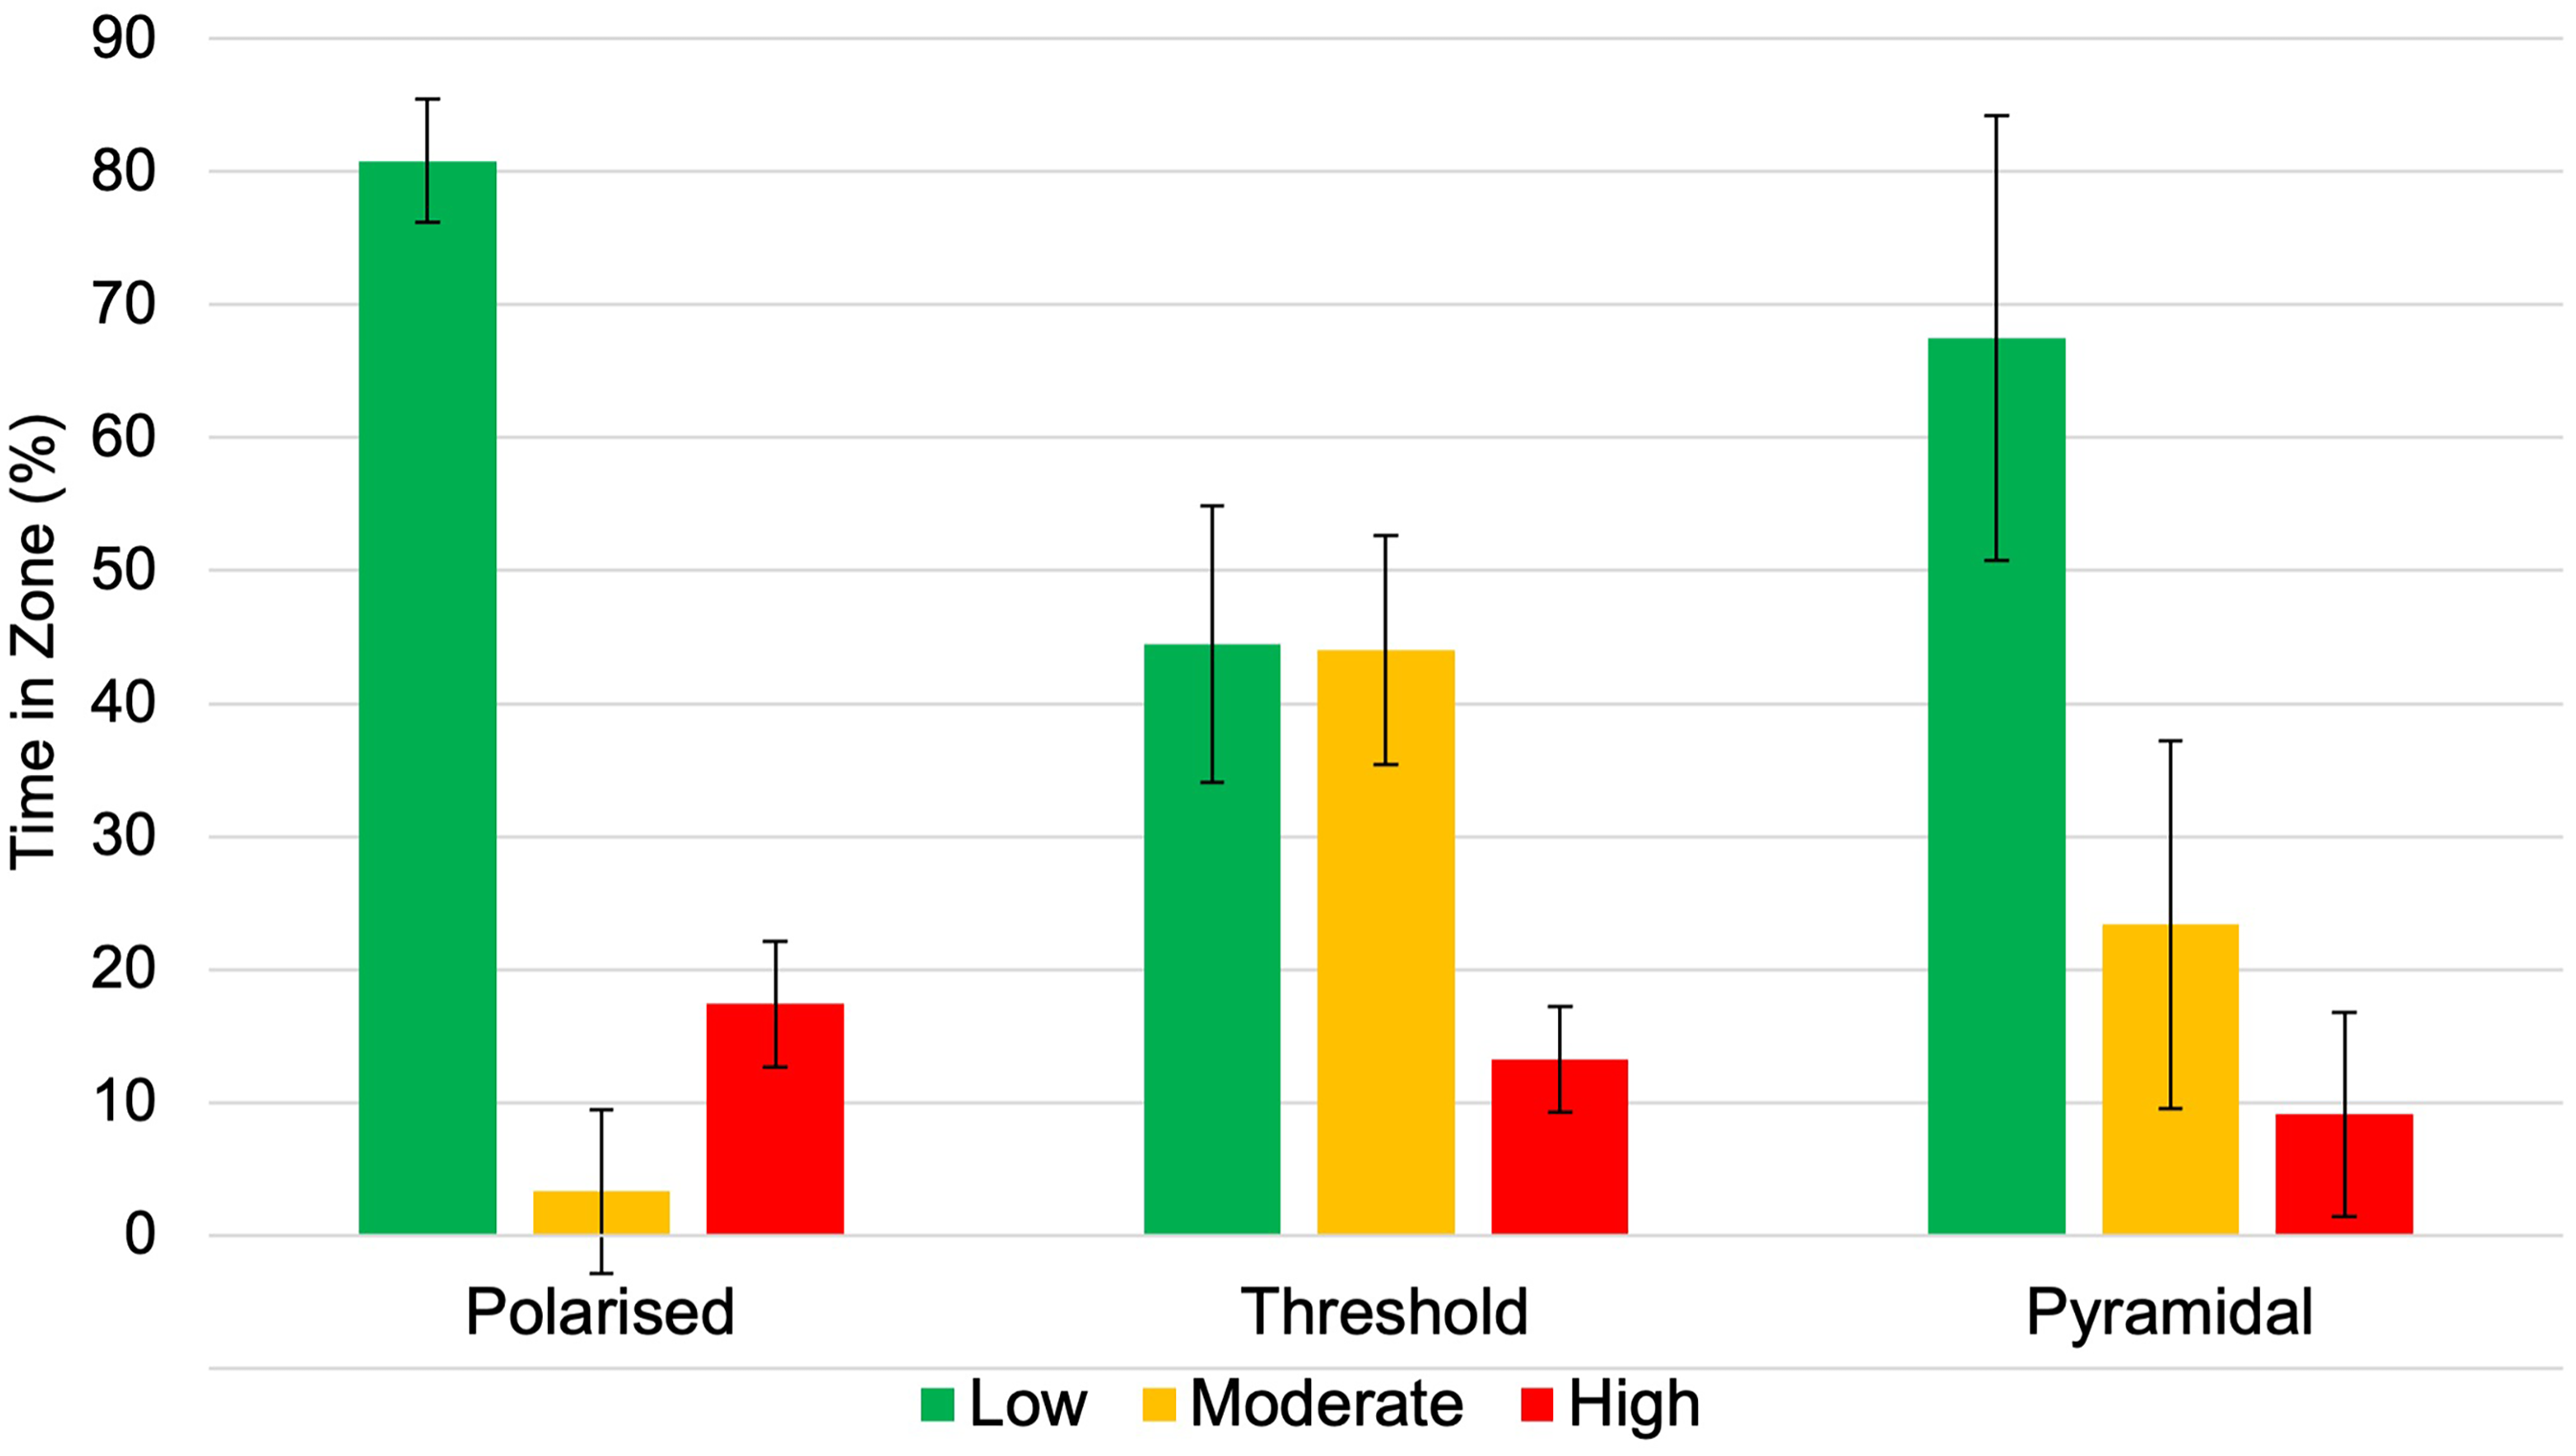
Respondents’ definition of POL, THR, and PYR models.
35% indicated an awareness of additional TID models. The most frequently mentioned were HIIT (6), which they defined as a focus on the interval, HIT (3), which was focused on the accumulation of high-intensity volume, regardless of the means to accumulate it. Long steady distance was identified by eight respondents. Other TID models mentioned were reverse POL (1), reverse PYR (2), block (1), and reverse periodisation (1).
Coaches generally (78.6%) compared how TIZ varies depending on the measure used. Some common themes emerged; coaches identified that HR response lagged, while power changes were instantaneous. Factors such as cadence, temperature, altitude, and fatigue were identified as affecting HR at a given power output. Twelve coaches mentioned that power and HR only align at low intensities, with the upper intensity HR and power aligned suggested to be anywhere from zone 2, to zone 4 (using the 5 + zone system). Four coaches noted that while HR lags in response to increases in power, it also lags decreases in power. Three coaches noted this can make a session appear more steady state, and two coaches specifically stated that a POL power distribution results in a PYR distribution by HR, due to the lag.
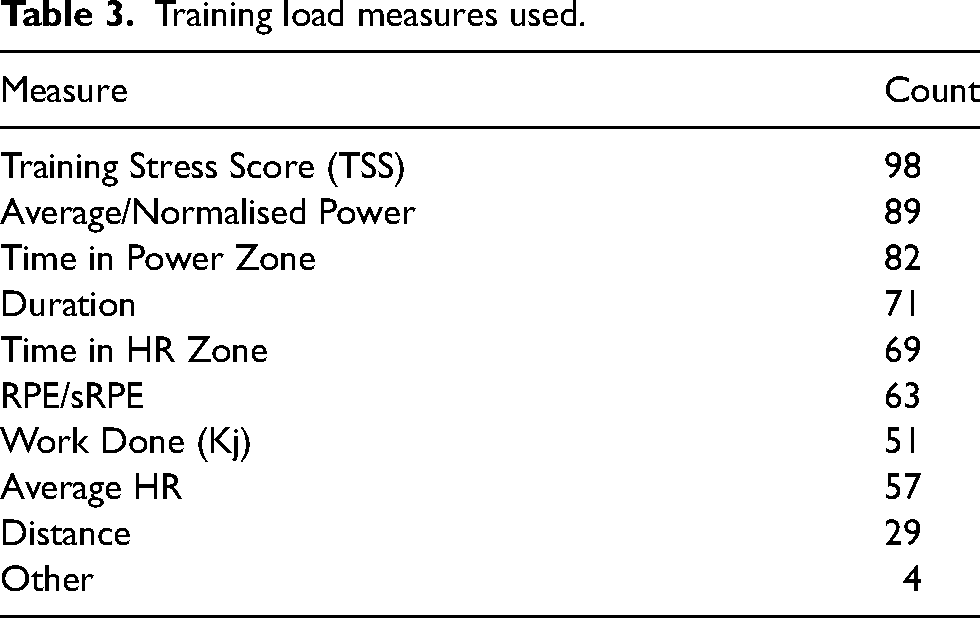
To track training load over time, coaches were asked to select the measures they use. They could also add any additional measures not already listed (Table 3).
Training load measures used.
Coaches generally (61.5%) did not have a preferred TID model. From those that did, 61% preferred POL, 25% PYR, and 14% THR. Issues respondents identified with TID models included concerns about the intensity and volume. Some felt POL required a higher training volume and might not work as well with a lower training volume. The number of coaches concerned with the high volumes of moderate and high intensity across all intensity models, but especially PYR and THR was notable. Differences in target events altered coaches’ preferred models. One coach stated that 3 km pursuit times were improved with a POL model, compared to a THR model. Another stated that time trialists would be given more THR intensity work.
Coaches overwhelmingly (94%) stated they would change the TID depending on the phase of the season. 26 respondents said they would increase intensity as they moved towards racing. Generally, this increase in intensity was often combined with an increase in specificity and a drop in volume. Only one coach specifically mentioned including more volume towards racing, although it was unclear if a change in the TID model might also include more volume.
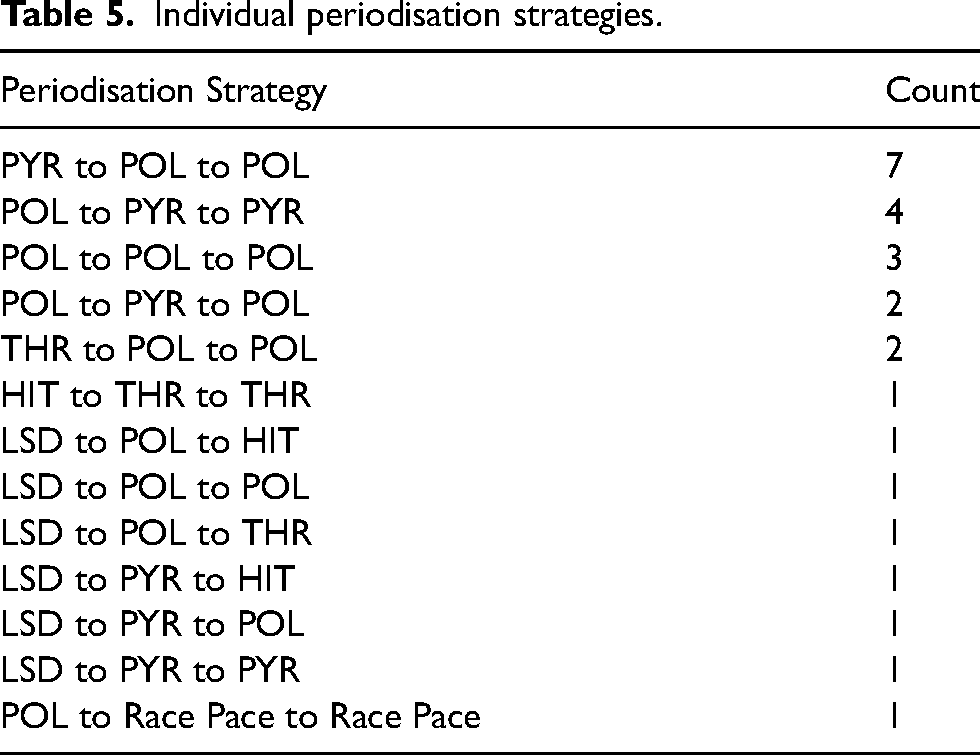
Due to variable terminology, mainly around the periods of the season, coding was complex. Suitable responses could be coded into out-of-season/pre-season, early-season/build, and the in-season/race phase. A count of the preferred TID model in each phase of the season is displayed in Table 4. Examining the individual periodisation strategies found that moving from a PYR approach in the off-season to a POL in the early/race season (7) was more common than using a POL to PYR strategy (4). Two coaches used a POL to PYR to POL periodisation. Table 5 shows a count of each coach's periodisation strategy when responses could be coded to each phase of the season.
Preferred TID model periodisation.
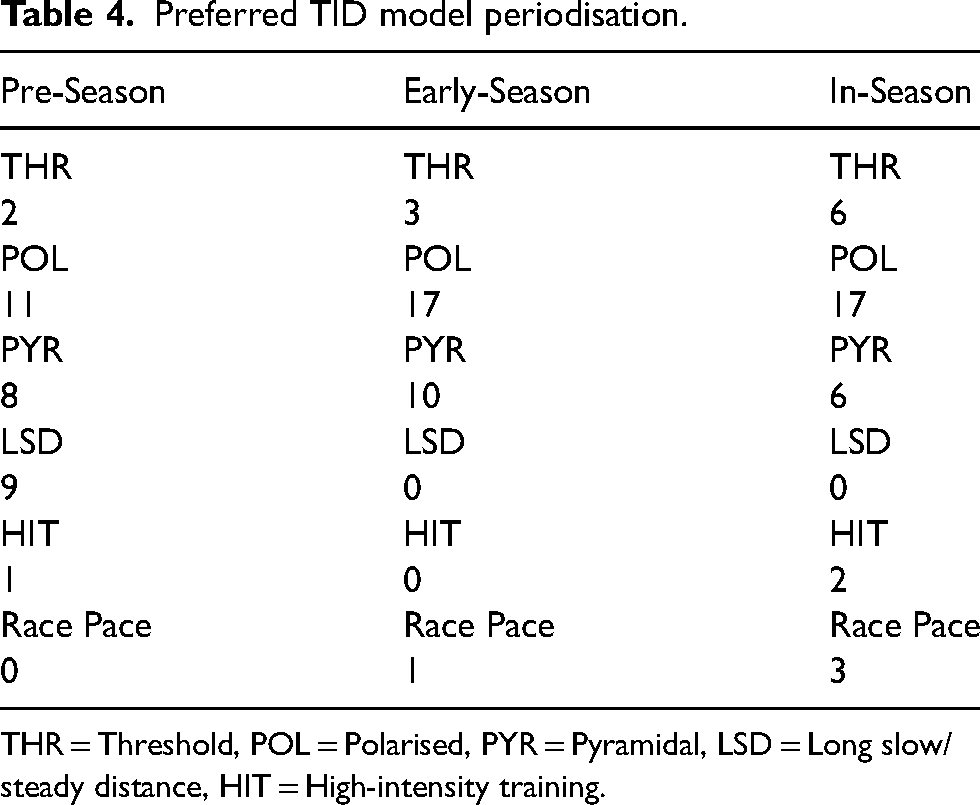
THR = Threshold, POL = Polarised, PYR = Pyramidal, LSD = Long slow/steady distance, HIT = High-intensity training.
Individual periodisation strategies.
Coaches felt cyclists adhered either somewhat well (52.1%), or very well (47%) to their prescribed training intensity. The reasons for high adherence were careful intensity management (36), using up-to-date intensity zones from either recent test data or record power outputs, and strong communication (33) through regular contact and educating their cyclists about the reasoning behind the training prescription. The cyclist's commitment to training was identified as an important factor (20), followed by a manageable training load (12), a build-up of ‘momentum’ in training (12), a plan personalised to the cyclist (11), and using goal setting (8).
Discussion
This study aimed to establish the practices and perceptions of coaches regarding their intensity zone determination, TID, and training prescription. Specifically, understanding how coaches interpreted, defined and used TID models was a key objective of this study. Our findings indicate that coaches place a strong emphasis on fitness testing to generate training intensity zones, but use a variety of intensity measures to monitor TIZ, i.e., power and HR. It was noteworthy that testing mode and frequency varied across coaches. Of relevance, 61.7% of coaches used multiple intensity measures (typically power and HR), either switching between or monitoring both at once, depending on the target intensity of the session. With regards to the TID models, the POL model was most familiar to coaches and defined by them as 80.8 ± 4.6% low intensity, 3.3 ± 6.1% moderate intensity, and 17.4 ± 4.7% high intensity. Coaches varied in their definition of the THR model. Respondents defined this model as 44.5 ± 16.7% low intensity, 44.0 ± 13.8% moderate intensity, and 13.2 ± 7.6% high intensity, while the PYR model was defined as 67.5 ± 10.4% low intensity, 23.4 ± 8.6% moderate intensity, and 9.1 ± 4.0% high intensity by coaches. Periodisation strategies differed throughout the season and between coaches. Overall, the POL model was most common in every period, with increased usage from off-season to early season, to race season, potentially due to it being the most well-known TID model. In contrast, the PYR models’ usage increased from off-season to early season, before declining in race season. The preference for a POL model is likely due to it being the most recognised TID model and widely researched. Despite systematic reviews showing mixed conclusions regarding the superiority of a POL approach over other TID models, POL appears to be at least as effective at improving
Defining training intensity distribution models
The coaches’ definitions of the TID models can be compared to those used in research, Figure 2 highlights the variation within and between models. For example, Filipas et al. 17 defined a POL TID as 79.6% (low), 6% (moderate), 14.4% (high). This was quite similar to our respondent's definition. However, the PYR intervention used by Filipas et al. 17 consisted of 77.1% (low), 16.4% (moderate), 6.4% (high), which differed from our respondent's definition, especially for low and moderate intensity and Treff et al. 20 varied further still, given their very high volume of low intensity. The definition of the THR model provided by coaches here broadly met the overview of PYR (i.e.,“Z1 > Z2 > Z3”). 17 However, the respondents’ THR definition had the highest standard deviations of all models, suggesting a lack of consensus. This is also seen across studies, with the THR models in Figure 2 differing. This lack of consensus limits the discussion of coaching practice and the application of new training strategies when the underpinning details are not known. While we did not specifically ask coaches to relate TID to training volume, Festa et al. 32 definition was closest to our respondents, and reported a total volume of 24.8 ± 2 h over eight weeks (3.1 h·wk-1). Röhrken et al. 33 reported a volume of 10 ± 2.7 h·wk-1, and Pla et al. 34 15–18 h·wk-1, with both including much higher low intensity training. This suggests despite a threshold focus, increasing volume must be paired with an increase in low intensity training to keep the overall load sustainable. Given all THR distributions, other than Festa et al. 32 incorporate a greater percentage of low intensity than moderate intensity, they could also be categorised as PYR, which suggests a more specific definition or method of categorisation, like the index used to quantify a POL TID, is required. 35
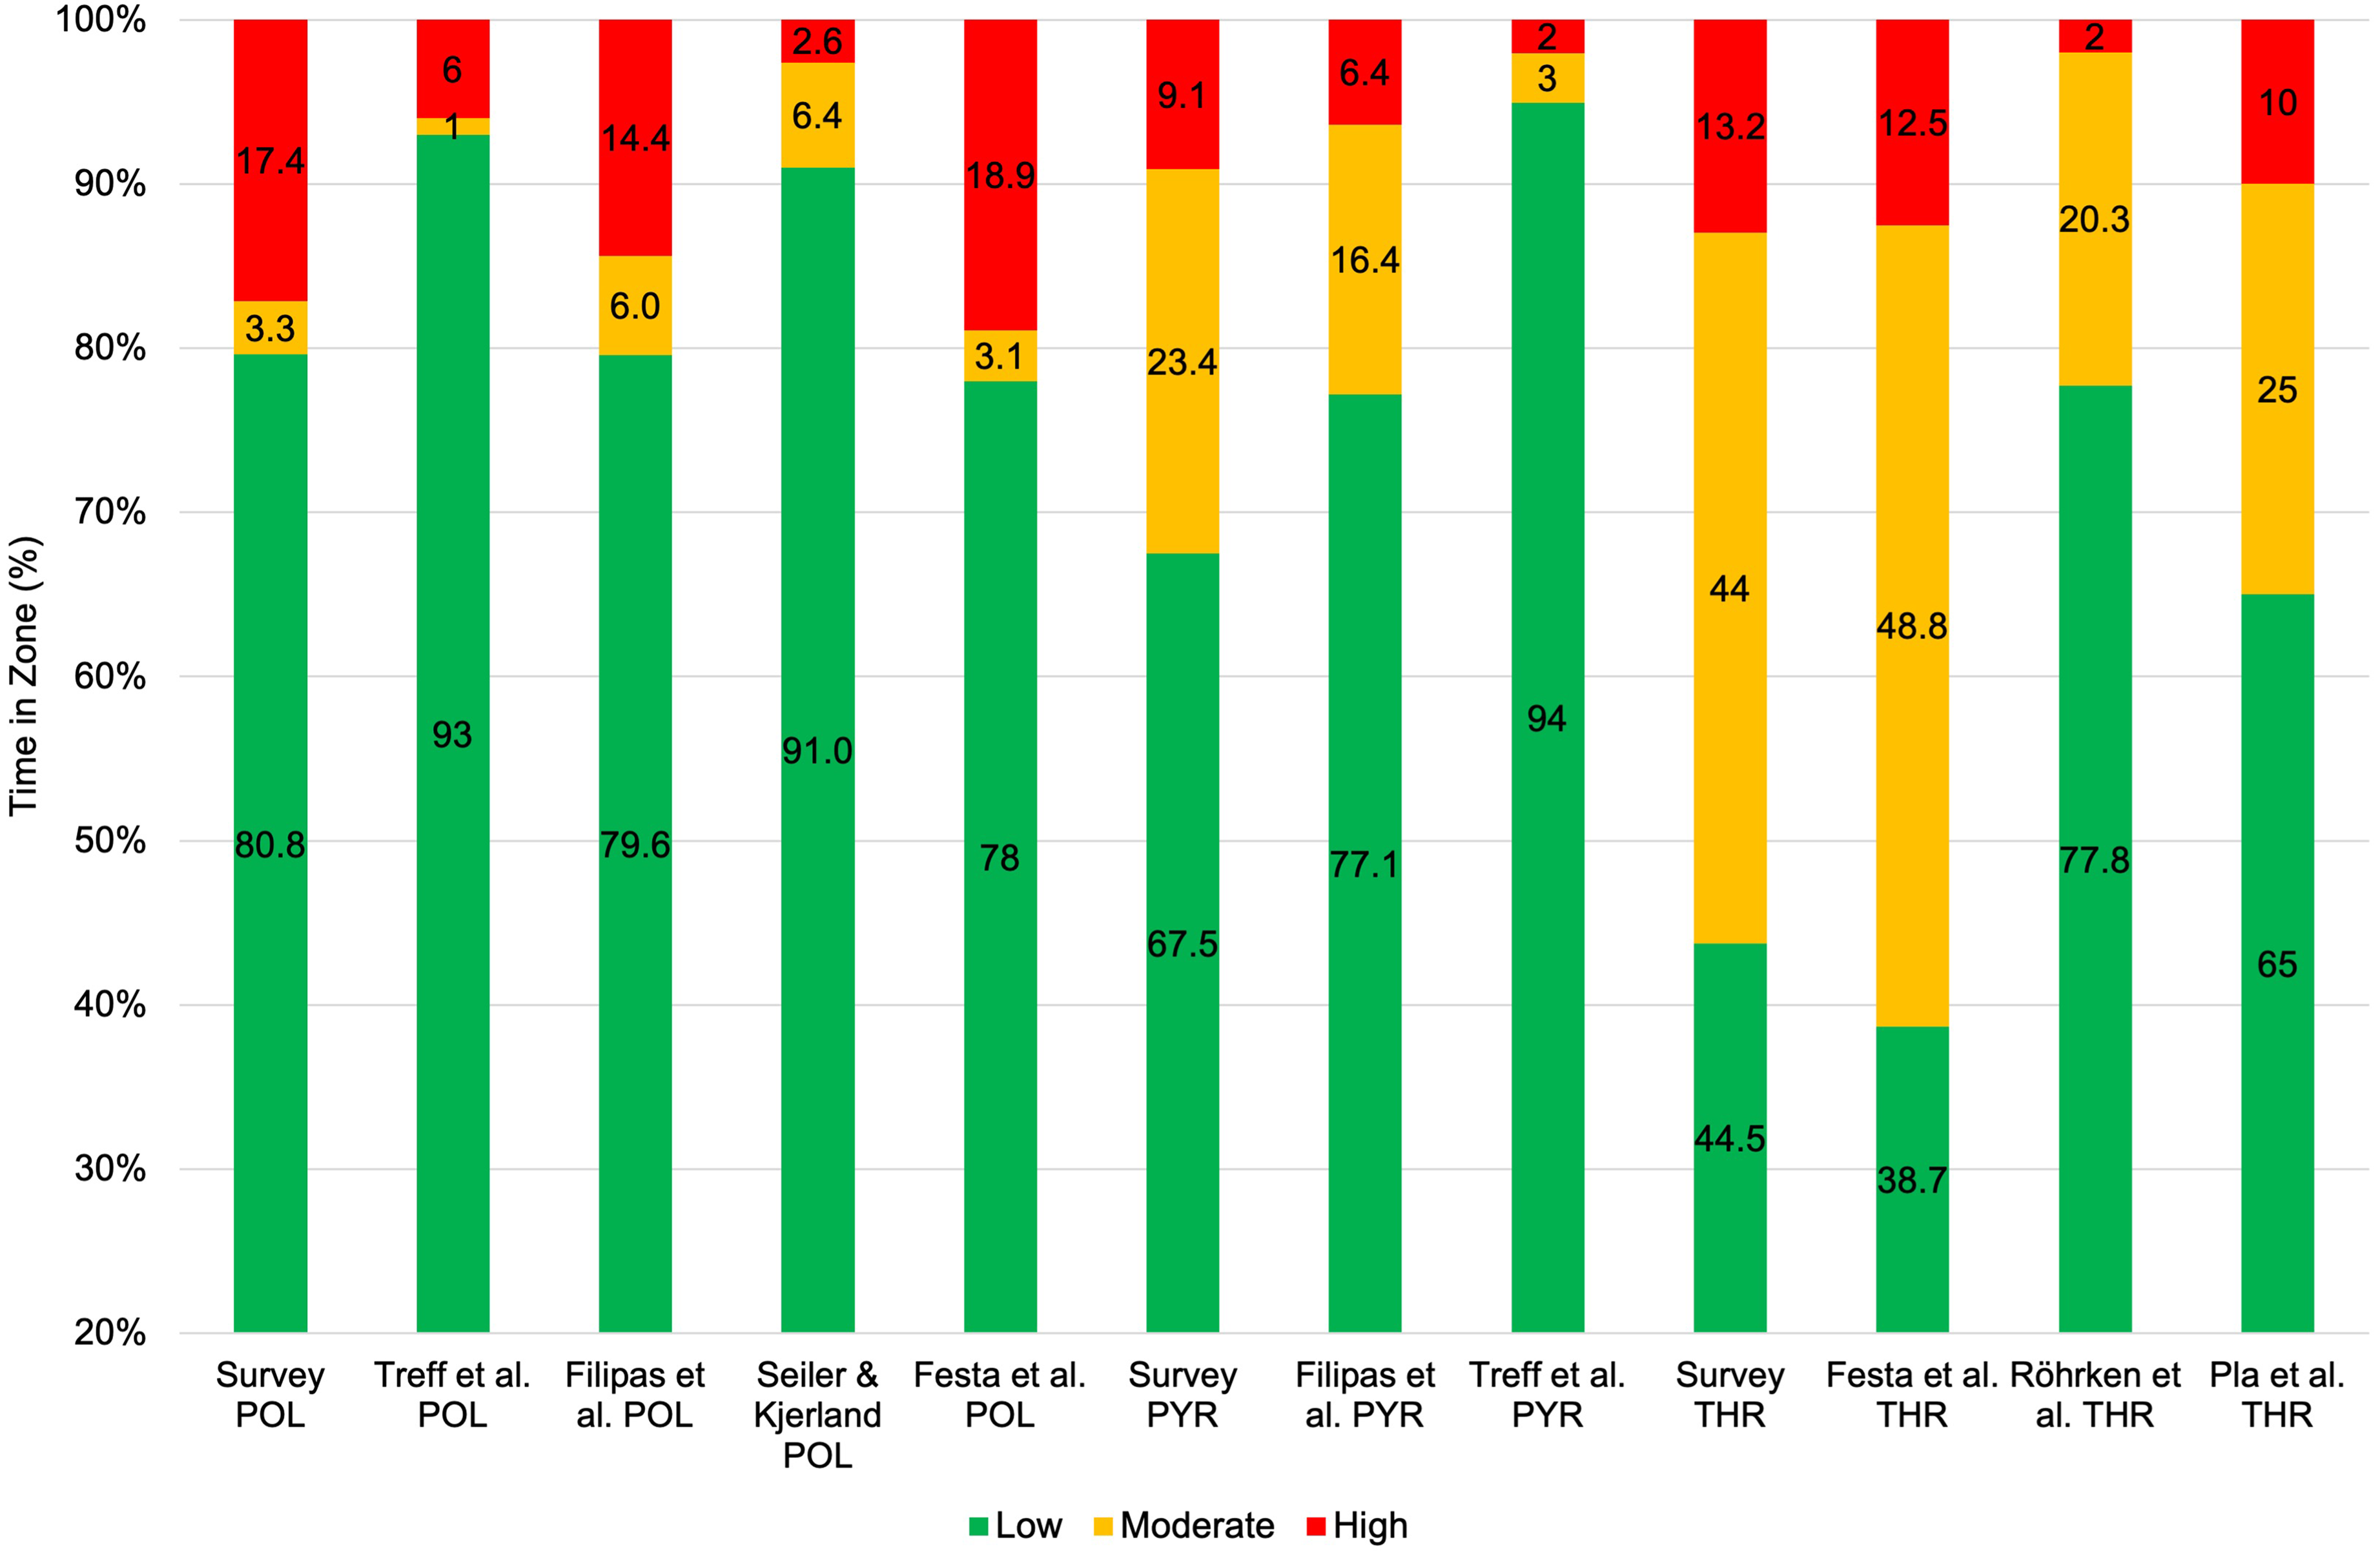
Respondents’ definitions compared to other TID definitions by TIZ. This survey's POL, PYR, and THR definitions are compared to the TIZ from Treff et al., 20 Filipas et al., 17 Seiler & Kjerland, 10 Festa et al., 32 Röhrken et al., 33 and Pla et al. 34 All display TIZ by HR, other than Pla et al., who use TIZ in swimming velocity bands.
Within the literature, it is debated as to whether moderate and high intensity are considered separately or combined within the POL model. Sanders et al. 16 approximate POL as ∼80% low intensity, with ∼20% across moderate and high intensity. However, when we examine their citations using the TIZ model, as our respondents used, Munoz et al. observed a HR TID of 68 ± 14% (low), 28 ± 13% (moderate), 4 ± 3% (high), 36 and Seiler and Kjerland observed a HR TID of 91% (low), 6.4% (moderate), 2.6% (high). 10 This highlights a large difference in the TIZ for low and moderate intensity training between those two studies. POL and PYR models could have an identical TIZ depending on the method (SG or TIZ) used to quantify them. A model definition that is too broad may overlook minor adjustments to the TID made by coaches during the season, leaving the choice of model seemingly unchanged. As these differences are likely due to the use of TIZ or SG, it is vital to clarify which system is being used and to maintain consistent usage for accurate monitoring.
Since power output was the most common measure used by our respondents, the resulting TIZ could be skewed when compared to the studies mentioned above, which use HR to calculate TIZ. When coaches discussed if and how they monitored TIZ variation by measure, the HR lag was often noted. HR and power were often thought to align only at low intensities (12), with some noting the lag between a decrease in power output and a decrease in HR. Four coaches suggested this lag causes a POL power distribution to appear PYR by HR. This is likely affected by the type of session the cyclists were performing. In steady-state, low-to-moderate intensity exercise, the TIZ by power and HR might be similar (some coaches suggested anything from low intensity, to FTP to be the upper limit of alignment), while interval sessions may differ. Despite respondents monitoring RPE less frequently (63), previous research 16 has reported significant differences between HR and power TIZ at low intensity (HR 86.8 ± 5.9%, power 79.5 ± 7.3%) and high intensity (HR 4.4 ± 2.0%, power 11.5 ± 2.5%), and differences between RPE and both in all zones (RPE 44.9 ± 27.4% (low), 29.9 ± 12.8% (moderate), 25.2 ± 24.9% (high)). The resulting TID could be classified as POL by power distribution, PYR by HR distribution, and THR and PYR by RPE distribution, depending on the definition. As RPE is assigned as a session average, complications are introduced due to the known differences between TIZ and SG methods.13,37 The lack of consensus between TIZ and SG methods limits the ability of a coach to directly compare different methodologies when determining which TID model to prescribe to cyclists. Further research is required to examine the impact of TID models across a range of training volumes to determine a sustainable upper limit to moderate and high intensity training with an increase in training volume.
Periodisation strategies
Intensity distribution was manipulated by nearly all coaches (94%) across a season. This was usually done by increasing intensity and specificity towards the competition phase of the season. It was more common for coaches to use a POL approach than a PYR, regardless of the period of the season. However, the use of a POL model increased between the off-season to the early season, then remained stable into the competition period. The reported PYR use increased slightly into the early season and dropped again towards competition. Individual analysis shows seven coaches periodised from a PYR to POL distribution, but only four moved from POL to PYR. Concern was expressed about the volume of moderate and high-intensity training in the PYR and THR models, especially those performing a high training volume. However, research observing top-5 Tour de France finishers 28 found a PYR distribution using TIZ in all but one week of training, which extended over six months. Some coaches cited the study by Filipas et al. 17 as their rationale for moving from a PYR to POL over the season. However, this is the only long-term intervention study to confirm the superiority of a PYR to POL periodisation strategy, and was conducted in runners, where the weight-bearing nature of the sport may influence programming and limit replication in cycling.
Few coaches discussed the specifics of their periodisation of TID towards a target race, although some examples were given. One coach said they found POL was more effective than THR for improving 3 km pursuit times. However, this contrasts with research in world-class team pursuit riders, 38 who reported a mostly PYR distribution (by both power and HR) in the 36-week build-up to their 2018 world record. Another respondent suggested that those training for time trial races would be prescribed more time at THR. In theory, this matches the specificity principle, as Padilla et al. 39 found short TTs (< 40 km) were contested at 95 ± 7% of HR at the Onset of Blood Lactate Accumulation (OBLA) and long TTs (> 40 km) averaged 89 ± 5% of HR at OBLA, which would suggest they were mostly at a moderate intensity. However, Sanders and Heijboer 1 found grand tour TT stages were mostly spent at high intensity, by power and HR (> LT2). This leads to uncertainty around the inclusion of race pace specificity within existing models, especially as cyclists typically compete in numerous races with varying demands throughout the season. Given the sparsity of interventional studies comparing the periodisation of TID models, more research is needed to justify a particular strategy over another.
Fitness testing
Coaches placed a strong emphasis on fitness testing to generate intensity zones. It was noteworthy that the testing mode and frequency varied largely across coaches. Most respondents (96.5%) reported calculating intensity zones from test data. As FTP was the most common test protocol, zones were typically calculated based on a percentage of FTP. Both the 3-zone model and the 6/7-zone model can be calculated from this data. The 3-zone model can be determined using FTP as the zone moderate/high border and 80% 40 or 85% of FTP as the zone low/moderate border, 27 or the seven-zone model using a wider range of percentages of FTP. 41 The widespread use was unsurprising given the popularity of FTP across training software and e-cycling platforms, and good reliability (power; CV = 2.9%, ICC = 0.97, HR at FTP; CV = 2.6%, ICC = 0.97) in competitive cyclists. 42 Additionally, 27 respondents mentioned lactate testing, and 34 used a measured physiological marker to determine zones. However, the specific marker (e.g., LT2 or Dmax) used to determine intensity zones could result in significant variability, with further variance possible with differences in the test protocol, such as the stage length in an incremental protocol. 43 Despite the difference in TTE at FTP across training levels, the justification for FTP testing and FTP-based zone determination remains strong, given that it is so widespread in cycling practice.
Training load monitoring
Power was not the sole measure of intensity amongst respondents. 61.7% used multiple intensity measures (typically power and HR), either switching between them, or monitoring both simultaneously, depending on the session aims. For long-term monitoring, coaches listed training load measures they track. The most popular external load measures were TSS, average power, and work done (kJ), and time in HR zone, and sRPE, the most common internal load measures. van Erp et al. 44 found near-perfect correlations (r = 0.95–0.97) between training load measures, including sRPE and kJ, TSS and kJ, and TSS and sRPE, which suggests that for training load monitoring, the specific measure used may not be as important. However, Sanders et al. 45 found iTRIMP to show the strongest relationship (r = 0.81) with changes in aerobic fitness. However, for TID determination, there is likely to be a disparity between the resulting TIZ from power, HR, and RPE. While our survey specifically asked about measures coaches used for load monitoring, Wells et al. 46 found triathlon coaches most often prescribed training using subjective measures (RPE/sRPE), but mostly monitored the resulting load using objective measures (time, distance, or pace, power, TSS, or TRIMP), and less frequently RPE/sRPE. Despite evidence that prescribed RPE from coaches can differ from the actual RPE performed.8,9
A lack of consensus in terminology
An issue identified in the survey was the lack of clarity as to what constitutes a TID model. When asked to identify additional TID models, some coaches identified reverse versions of existing TID models (POL and PYR), along with reverse periodisation and block periodisation. Terminology, especially ‘block’, is inconsistently used in research. Hebisz et al. 47 defined block training as an 11–17 day block of only one type of training. In contrast, Rønnestad et al. 48 designed a block intervention as an initial week of high-intensity intervals only, followed by three weeks of mostly low intensity with one HIT session per week to match a comparison group across the 4-week intervention. As Issurin 49 defines ‘block’ as “a training cycle of highly concentrated specialised workloads”. Therefore, the periodisation described above is either two distinct blocks of training, a HIT block, also known as a shock microcycle, 50 followed by regular training. This brings into question the appropriate definition of a ‘block training approach’ and the time frame TID should be examined (e.g., weekly, monthly) to be classified as following a particular model. Wells et al. 46 found that Australian triathlon coaches most often viewed and interpreted athletes’ training load on a weekly and daily basis, although they mostly communicated with athletes about their training load on a monthly basis. This suggests training load and TID may be manipulated over shorter periods, but examined over longer durations to allow for the effects of accumulated training. This lack of clarity among coaches likely reflects the lack of consensus around TID models in the literature. It highlights the need for more clarity within the research and more effective dissemination of findings to practice, avoiding confusion for coaches. Coaches must ensure they know the underpinning TID within a particular TID model, given the variation we have highlighted.
Limitations
Our survey provides novel insights from a large sample, however, it is not without limitations. The open-ended, free-text nature of several questions meant that respondents could provide as much or as little detail as they wished. Consequently, there were instances where responses lacked detail or were difficult to code into distinct categories. For example, the test protocols (Table 2) were coded based on the answers provided by coaches, but they were often short and lacking detail, which would limit replication. Terms such as ‘step’ and ‘ramp’ lack sufficient detail and are in practice, often used interchangeably. ‘
When coaches defined TID models, many chose to use the 3-zone system. Those who described it in alternative ways had their answers converted to the 3-zone system to allow for comparisons. It was quite common for coaches to only define one zone in the whole model (e.g., THR is 50% moderate intensity). Consequently, the final average for each model slightly exceeds 100% (range 100%-101.7%). This variation stems from the incomplete reporting of specific zones rather than issues with the data itself. Including these responses provides context for how coaches define TID models and highlights the diversity in their perspectives. Despite the valuable insight into the perceptions and applications of coaches, the deeper context may be limited due to the use of a survey over a focus group or expert coach interviews, which would permit follow-up questions to gain a deeper understanding of the ‘why’ behind the test protocols, intensity zone determination, and periodisation of TID in particular. Additionally, the survey did not ask coaches to discuss quantitative data, e.g., test results, to understand the training adaptations and performance improvements from following particular TID models or periodisation strategies. Self-reported data may overestimate adherence or reflect idealised practices, rather than the actual implementation. Future studies could validate these findings with objective data from training logs from their coached athletes.
Conclusion
Cycling coaches had a more consistent definition of the POL model, but less agreement around the PYR and THR models. As respondents defined the POL model as limiting moderate intensity, our definition aligns with Cejuela and Selles-Perez. 14 Periodisation strategies varied, but increasing the use of the THR and POL models as the season progressed towards racing was evident, while PYR usage peaked in the early season. The move from PYR to POL was slightly more common than the reverse, often justified by the research on the topic. 17 Since research groups and coaches often have preferred test protocols, we caution readers to carefully consult the methods sections to understand the exact testing protocols, intensity zone determination methods, and the TIZ vs SG variation. It should be understood that there may be a trade-off between a strict definition of a TID model, which would allow for comparisons, and a broader generalisation of a model, which would permit more flexibility in training programming and switching between different methods of data monitoring, e.g., training on bikes with and without a power meter.
Practical applications
For simultaneous comparison with research and practice, cyclists and coaches should consider using FTP as the basis for intensity zone determination, as it has demonstrated good test-retest reliability. 42 To align with the 3-zone model 80/85% of FTP, and 100% of FTP can be used in place of LT/VT1 and LT/VT2.28,40
For training prescription, consider using the 6-7 zone power model or the 5-zone HR model 41 for precise intensity targeting. However, caution should be used as TTE at FTP may vary based on cycling experience. As our respondents often did, prioritising HR monitoring for low intensity training can limit excessive internal load, while power should be used at moderate to high intensity when HR lag prevents precise intensity monitoring.
The training volume should be carefully planned in conjunction with TID prescription. Some respondents sometimes expressed concern that a POL model might require high training volumes to be effective. Conversely, increasing or maintaining the proportion of moderate and high intensity training, when total training volume rises, may increase the risk of overtraining.
As respondents identified, strong communication with regular contact and taking the time to educate cyclists on the importance of intensity management and the justification for the training programme are key to ensure athlete adherence. Coaches should explain how all the intensity zones have a role in training, but the focus may shift depending on the phase of the season and the goal of the session.
Utilising live monitoring of power and HR can ensure athlete self-regulation of intensity during training. Further combining with RPE helps contextualise internal and external load, and provides a backup in the case of technological malfunctions.
Replicating the PYR to POL periodisation strategy used by our respondents and backed by research 17 serves as a strong template for annual planning. This could be further refined to consider training the specific demands of a target event in the pre-season or competition phases.
Supplemental Material
sj-docx-1-spo-10.1177_17479541251362199 - Supplemental material for A survey exploring the programming practices of cycling coaches: How are intensity zones and intensity distribution models used?
Supplemental material, sj-docx-1-spo-10.1177_17479541251362199 for A survey exploring the programming practices of cycling coaches: How are intensity zones and intensity distribution models used? by Phillip A Smith, Nicolas JA Berger and Jonathan M Taylor in International Journal of Sports Science & Coaching
Footnotes
Declaration of Conflicting Interests
The authors declared no potential conflicts of interest with respect to the research, authorship, and/or publication of this article.
Funding
The authors received no financial support for the research, authorship, and/or publication of this article.
Data availability statement
The data that support the findings of this study are available on request from the corresponding author. The data are not publicly available due to privacy or ethical restrictions.
Ethics approval statement
This study was approved by the Teesside University School of Health and Life Sciences Research Ethics Committee (approval ref. 19295 Smith) in January 2024.
Supplemental material
Supplemental material for this article is available online.
References
Supplementary Material
Please find the following supplemental material available below.
For Open Access articles published under a Creative Commons License, all supplemental material carries the same license as the article it is associated with.
For non-Open Access articles published, all supplemental material carries a non-exclusive license, and permission requests for re-use of supplemental material or any part of supplemental material shall be sent directly to the copyright owner as specified in the copyright notice associated with the article.