
Abstract
Our aim was to identify the underlying physical and technical skill traits associated with success in 3v3 small-sided soccer games. We quantified the sprinting, dribbling, and passing performances of 41 individual youth footballers from an elite club that plays in their local, state and national competitions. In addition, we quantified their performances across a series of 3 v 3 games (n = 12–26 matches per player), and by calculating each player's average net goals scored per game we provided a single metric of game success. We predicted that those individuals with better performances in the isolated technical tests would have higher success in the 3v3 matches. An individual's average team net goals was significantly predicted by the best fitting model (F4,31 = 4.94; adjusted R2 = 0.31; P = 0.003); and overall passing (t = 2.35; P = 0.025) and dribbling (t = 2.35; P = 0.03) were the only significant predictors of average individual net goals per game. Players with higher net goals per game were significantly more likely to have higher attacking (R2 = 0.39; P < 0.0001) and defensive scores (R2 = 0.21; P < 0.0001). Players with higher dribbling performances were also more likely to have higher attacking (R2 = 0.46; P < 0.0001) and defensive scores (R2 = 0.21; P = 0.003). Closed-skills that are statistical predictors of success under the complex conditions of match play should be a key element of talent identification protocols, especially when taken in conjunction with metrics of performances derived from small-sided games.
Introduction
The ultimate aim of youth talent identification programs is to select those individuals that are most likely to become successful professional adult players.1–5 Selected players are provided with many additional benefits to aid their transition to professional players, including focused and specialised coaching attention, and the investment of additional money, equipment and time. 6 Professional clubs that can recruit players from their youth ranks obviously save money by not having to buy players from other clubs and can also gain financial rewards if they wish to sell their players on to others. The most common approach for recruiting promising individuals into youth soccer academies is via the subjective opinions of coaches and talent scouts of players observed in competitive matches or small-sided games.6,7 However, all talent scouts can be affected by internal biases in their selection processes, which can lead to repeated errors and misjudgements when done in isolation.3,6 A more objective, scientific approach to talent identification that complements the strengths of scouts could be of enormous benefit to talent identification programs. However, despite the obvious benefits, there has been limited uptake of any specific quantitative protocols of talent identification in soccer.4,8,9
Quantifying individual performances in small-sided games provides an obvious starting point for developing a robust scientific protocol for identifying talented junior players.10,11 Although small-sided games are not simply scaled-down versions of 11-a-side matches, and the frequency of tactical behaviors, types of interactions, and density of actions differ significantly from formal matches, small-sided games do impose similar challenges in terms of a reliance on player's technical skills, physical performances and decision-making. Thus, one should expect high performers in small-sided games to be more likely to be high performers in 11-a-side matches. Indeed, many talent scouts provide their initial assessments of players based on their observed performances in small-sided games12–15 and they are frequently used in Brazil for identification of talented players during training sessions and competitions. However, developing a protocol that quantifies individual performance in team sports like soccer is notoriously difficult1,2,14,16,17 because games are tactically complex and the performance of individuals is dependent on the actions of the collective. To assess an individual's performance from the complexities of a team game, one must use a methodology that can separate an individual's performance from that of their team-mates and opponents. Recently, Wilson et al. 11 developed such a protocol for measuring the performance of individuals across a series of small-sided games, in which individuals are randomly assigned into new teams and against new opponents for each game. When enough games are conducted – based on the total group size, number of players in a game, and average number of goals per game – one can calculate an individual's average number of goals scored, goals scored by teammates, goals conceded, and their net team goals per game. These metrics of success are consistent across days and repeatable across different groups of players, and thus allows one to rank each player's match effectiveness from best to worst performer. 11 The metric of overall success for an individual from this design is their “net team goals” per game as this represents a player's direct match effectiveness in helping their team to succeed and is independent of a player's position (i.e., defender, midfielder, striker). Positive scores indicate the magnitude of an individual's average net benefit to their team, while negative score means they cost their team on average. An individual with an average score of +2 net team goals per game indicates that their team benefits by the presence of that individual by an average of +2 goals per game, regardless of how the individual attains their success (e.g.,. scoring or preventing goals). Because small-sided games with 3 individuals allows coaches and scouts to easily obtain a repeatable metric of individual performance, it provides an important advance in the objective selection of players using a method that can complement the processes of scouts.
Although quantifying individual performance based on the methods of Wilson et al. 11 can improve the objectivity and reliability of selection processes, there remain several weaknesses with using this method for talent identification. First, metrics of individual performances derived from team competitions are not comparable across different groups of players because individual performances will be dependent on those that they are competing with and against. An outstanding player may have a high relative performance score when competing against average players but lower when competing against other high-level players. Thus, scores derived from different groups are not comparable. Second, individual performances from small-sided games are likely to be highly dependent on each individual's age, size, and biological maturity relative to others they are competing with and against. Older players are more likely to be recognised as better performers in small-sided games simply because they are bigger and more physically developed.18,19 This bias – known as the relative age effect (RAE) – leads to relatively older players being over-represented within any given age-cohort of selected “talented players”.18–20 In fact, relatively older players are not only more likely to be identified as talented, but are often given greater access to coaching, facilities and competition, which further inflates the advantage of age.20–23 One potential avenue for solving these two issues is to obtain metrics of performance that are: (i) entirely independent of other players, and (ii) can be corrected for age, size, sex and biological maturity. Isolated metrics of technical skill and physical performances can satisfy both of these criteria, and taken in conjunction with metrics of individual performance derived from small-sided games, could represent an important step in identifying talented players using both objective match-realistic conditions (small-sided games) and independent metrics that could be corrected for biological maturity (isolated tests). But which isolated performance tasks should be utilised for talent selection programs? Because Wilson et al.'s 11 methodology allows one to obtain a single metric of overall individual performance under match-realistic conditions, one can identify which technical or physical traits are best predictors of this match performance. Thus, by discovering which isolated technical or physical traits underlie success in small-sided competitions, one can use metrics of performance that are independent of other players, and comparable to those individuals from other teams, competitions, or countries.
In this study, our aim was to identify the underlying technical and physical traits associated with success in 3v3 small-sided soccer games. We used participants from the U12 and U13 groups in a Tier 1 football academy in Brazil that competes in their local, state and national competitions. We first quantified each individual's sprinting and dribbling performances along four different paths, 24 passing performance using four different rebound board tests,25,26 and passing accuracy with their dominant foot. 14 The validity and repeatability of each of the technical skill tests has been reported in multiple previous studies.14,24–28 Tests of dribbling performance used in this study have been associated with 1v1 attacking performance, 24 goal scoring success against a defender and a goalkeeper, 27 defending success, 28 and overall performance in 11-a-side matches. 14 In addition, individual passing performance tests used in this study have been previously associated with variation in player's abilities to maintain possession in 3v1 25 and 4v3 26 games. In addition to the skill tests, we assessed each individual's performance in small-sided games using a series of 3 v 3 games and by calculating their average net goals scored per game, as per Wilson et al. 11 We used 3v3 games because metrics of individual success from these games are more statistically reliable than games with larger numbers of individuals (e.g., 4v4, 5v5) when conducted over 1-2 training sessions and more complex than games with fewer individuals (e.g., 2v2). 11 Because individuals were randomly assigned to teams and opponents for each game, no one individual played with the same pair of players or against the same team of opponents more than once. To determine which match tasks were associated with success in the 3v3 games, we also quantified each individual's average number of possessions, completed passes, unsuccessful passes, tackles, interceptions, goals and assists, and losses of possession. We predicted that those individuals with better performances in the technical skill tests would have higher success in the 3v3 matches. In addition, we predicted that individuals from the U13 team would have higher average performances in the technical skill tests and match performances than those from the U12 team.
Methods
Subjects
The participants in this study had an average age of 12.3 ± 0.7 years (range 10.6–13.2 years), height of 1.56 ± 0.10 m (range of 1.40–1.77 m) and mass of 45.8 ± 8.5 kg (range of 31.0–66.0 kg). All players and parental and legal guardians gave consent to be involved in the study, which was in accordance with ethical protocols for the University of Queensland, Australia, and University of Sao Paulo, Brazil (#2019-001398). All data were analysed anonymously. No activities or movements beyond those regularly utilised by the players in their training sessions were involved in the study design.
Design
In March 2020, we tested player performance and individual success during matches over three different training sessions in one week, with one day of rest between each session. All u12 and u13 players in the club that were injury-free were involved in the study. Testing occurred during the early stages of their season, which extends from February until November. In session 1 and 3, we ran a series of 3v3 matches and in session 2 we tested the player's sprinting and dribbling speeds, passing and control performance using rebound boards, and kicking accuracy with their dominant foot. Before each session, players proceeded through their normal 15 min warm-up routine with their coaches and this involved dynamic stretching with increasing intensities of activity.
Dribbling and sprinting performance along curved paths
The dribbling and sprinting performance of each player was measured along four different 30 m long paths that varied in curvature, as in.24,28 Each path consisted of a 1 m-wide channel with outer boundaries marked with 6 mm black and yellow plastic chain (Kateli, Brazil). Paths consisted of a series of straight sections that were interspersed with turns that were always 1 m in diameter and either 45
For dribbling, each player started with the ball behind the starting position and proceeded through the circuit as fast as possible, keeping the ball inside the path. If the ball went outside the path, then the test was stopped and the individual repeated the trial after a minimum of 30 s rest. We quantified each player's dribbling speed by dividing the distance traversed (30 m) by the total time they took to dribble the football through each path. Players moved between different paths in groups of three or four, and all members of a group completed testing along a single path before moving to the next. Players always progressed through paths in the same sequence: Path 1, then Path 3, Path 2, and then Path 4 but because each group was randomly assigned a starting station, the order of testing differed among them. Players completed 3 trials on each path, and the average of these trials was their measure of dribbling performance for that path.
After a dribbling test, each player sprinted along that path (curvature range: 0.63 to 1.37 radians.m−1), and their time was recorded to calculate their sprint speed over the 30 m. The testing protocol was identical to that described for dribbling above except that players’ feet (rather than ball) had to remain within the path bounds. Players completed 2 trials on each path, and the average of these 2 trials was their measure of sprint performance for that path.
We used principal component analysis (PCA) based on a correlation matrix of the data to characterise patterns of variation among correlated measures, creating a multivariate measure of dribbling (PCD) or sprinting (PCS) performance. For dribbling, the first component of the PCA (PCD1) explained 79.9% of the variation observed in the data (Appendix Table 1); because all vectors loaded in the same direction, and larger positive values indicated higher dribbling speed over all paths, PCD1 can be thought of as a measure of overall dribbling performance. The second component of the PCA (PCD2) explained 11.9% of overall variation (Appendix Table 1). For sprinting, the first component of the PCA (PCS1) explained 55.5% of the variation observed in the data (Appendix Table 1); because all vectors of PCS1 loaded in the same direction, and larger positive values were indicative of higher sprinting speed over all paths, PCS1 represents overall sprinting performance. The second component of the PCA (PCS2) explained 34.5% of the variation (Appendix Table 1).
Passing and control with rebound boards
We assessed a player's ability to receive a pass by bringing the ball under rapid control and execute a subsequent pass with accuracy and speed. These tests are described in more detail by Wilson et al.25,26 We assessed four different passing tests: (i) passing the ball between two rebound boards at 90 degrees to each other with the centre focal point (where the player stood) 4 m from each of the rebound boards, (ii) passing the ball between two rebound boards at 90 degrees to each other with the centre focal point 8 m from each of the rebound boards, (iii) passing the ball between two rebound boards at 135 degrees to each other with the centre focal point 4 m from each of the rebound boards, and (iv) passing the ball between two rebound boards at 45 degrees to each other with the centre focal point 4 m from each of the rebound boards. Each player's performance was assessed twice in each test. Players were split into groups of three or four, with groups rotating through each testing station. All groups progressed through stations in the same sequence, but because each group was randomly assigned an initial station, the order of testing differed among them. Players were allowed a brief period to familiarize themselves with each task.
Passing technique # 1: The player passed the ball toward the rebound board to the player's right side with their right foot. The player then received the rebounded ball with their left foot and turned with the ball to set up another pass with their left foot toward the rebound board to the player's left side. The player then passed the ball toward the rebound board with their left foot and subsequently received the rebounded ball with their right foot and turned with the ball to set up a pass with their right foot. This was then repeated and each player was given 45 s to complete as many passes as they could using this technique. The total number of passes completed using this specific technique was recorded as a player's score. If the ball missed the rebound board, then a new ball was immediately passed to the player to recommence the test. If the player missed the target on five occasions then the trial was immediately stopped and that was their final score. Time was not stopped when waiting for a replacement ball but a ball was replaced within one second.
Passing technique # 2: Identical to passing technique #1 except the boards were 8 m from the centre focal point.
Passing technique # 3: Identical to passing technique #1 except the boards were 135 degrees from each other.
Passing technique #4: The player passed the ball toward the rebound board to the player's left side with their left foot. The player then passed the rebounded ball toward the rebound board to their right side with their right foot using a first-time pass. The player then played a first-time pass with their left foot towards the left rebound board. This was then repeated, and each player was given 45 s to complete as many passes as they could, using this specific technique. The total number of passes completed using the correct technique was recorded as a player's score. If the ball missed the rebound board, then a new ball was immediately passed to the player to recommence the test. If the player missed the target on five occasions then the trial was immediately stopped and that was their final score. Time was not stopped when waiting for a replacement ball but a ball was immediately served in.
For passing, the first component of the PCA (PCP1) explained 49.8% of the variation observed in the data (Appendix Table 2); because all vectors of PCP1 loaded in the same direction, and larger positive values were indicative of better passing/control ability over all tests, PCP1 can be thought of as a measure of overall passing/control performance. The second component of the PCA (PCP2) explained 27.5% of overall variation, with positive values associated with better passing between the 135 degree angled passing test (technique 3) and negative values associated with better passing in the 45 degree first-time passing test (technique 4)(Appendix Table 2).
Kick accuracy
Players self-reported which was their dominant foot and then used this foot for the kick accuracy task. Using a size 5 soccer ball, players executed three rounds of 10 passes (side of the foot) at a wooden target (1.1 m × 0.5 m) from a distance of 15 metres (total of 30 passes). Players rested between rounds while others in their group executed the task. Fifteen metres from the target, two cones were placed 4 metres apart to designate where the ball should be passed from. Two additional cones were placed 10 metres from the target, also 4 metres apart. Players were instructed to pass the ball and hit the target, but for a pass to be considered a hit (1 point), the ball must hit the target AND must rebound back between the cones 10 metres from the target. This ensured players kicked the ball firmly at a game relevant speed. If the pass hit the target but did not rebound beyond the 10 metre cones it received only 0.5 points. Passes that missed the target received zero points. Our metric of passing accuracy was a proportion, calculated as:
3v3 games
We assessed each individual's performance across a series of 3 vs 3 games, as per Wilson et al. 11 All games were held on a 30 m long by 25 m wide field with a 2 m by 1 m high goal at each end and without goalkeepers. A total of 185 games were played using different combinations of players each time, so that no teams were identical across different games. By mixing up the composition of each team, the performance of each individual could be averaged across games they played, such that an individual's average performance in the matches was unlikely to be dependent on any particular or combination of team-mates. 11 Each game lasted 4 min and was controlled by a timer.
Each individual played between 12 and 26 matches across the 185 games (average 20.4 ± 1.3 games). Players were allowed to rest for 1–5 min between games, depending on whether they played in the game immediately preceding or whether they waited for the next game. There were five playing fields set up so that five games were run simultaneously, such that 30 players at any one time were playing and the remaining players were ready for the following game. No player missed two games in a row. Because up to 20 games on each field were conducted in one training session, we expected that the natural effects of fatigue to affect the performance of individuals and their teams across the session. A team was chosen at random to start with the ball.
For each match, we quantified each individual player's total number of possessions, total number of completed passes, total number of unsuccessful passes, total number of tackles, total number of interceptions, total number of goals and assists, and total number of losses of possessions. A possession was defined as whenever a player had control over the ball, which afforded them the opportunity to try to pass to a team-mate or keep the ball using their body or dribbling. A successful pass was one where an individual passes the ball to a team-mate who ends up with possession of the ball, as defined above. An unsuccessful pass was one where an individual passes the ball towards a team-mate but none of their team-mates end up with possession of the ball, regardless of whether the loss of possession could be due to the poor control of the receiver. A tackle was defined as when a player takes possession of the ball from an opponent. An interception was when a player gains possession when an opponent is attempting a pass to a team-mate (this also includes interceptions where the ball rebounds directly out of play). An assist was defined as the last pass before a team-mate scores a goal. In addition to these individual measures of activity within matches, each individual was given a net team goal score from each match in which they competed (team goals – opponent goals). Because all of these variables were clearly defined, and easy to observe and record, there was an inter-rater reliability of greater than 0.95 (Cohen's Kappa).
Based on the metrics of activity within each match outlined above, we calculated for each individual metrics of attacking, defending, possession, passing, and ball retention performances. Attacking performance was taken as the sum of an individual's goals and assists for each match. Defending performance was taken as the sum of interceptions and tackles for each match. Possession was taken as the total number of possessions in each match as outlined above. Passing performance was taken as the percentage passing success (100×successful passes divided by the sum of successful and unsuccessful passes). Ball retention success was the total of unsuccessful passes and ball loss via tackling.
Statistical analyses
Correlations among performances were conducted using Pearson's product moment correlations. We used linear mixed effects models to determine how the curvature of each sprinting or dribbling path affected performance, with random intercepts fitted for each player, and assessed differences between specific paths with Tukey's contrasts and a single-step correction to adjust p-values. We used the same process to determine how different passing techniques affected overall passing performance. We used a linear model to determine how passing, dribbling and sprinting affected attacking activity, defensive activity and ball loss in the 3v3 matches. We also used a linear model to determine how passing, dribbling, sprinting, attacking activity, defensive activity and ball loss affected an individual's net goals per game. We also assessed whether there were differences in the performance, match traits and summary match traits between the teams using an analysis-of-variance (ANOVA).
Normality of residuals was assessed using the Shapiro-Wilk test and visual inspections of Q-Q plots using R. We used power analyses to determine if we had sufficient statistical power to detect significant effects for both continuous traits (regression) and among groups (ANOVA). 29 We assumed a medium effect size in each case, an alpha level of 0.05, and power of 0.80. Results indicated we had sufficient statistical power across all analyses.
To determine which performance traits predicted success in the 3v3 games, we first ran a linear model estimating the effects of overall passing (PCP1), dribbling (PCD1), sprinting (PCS1) and passing accuracy on an individual's average net goals, including all main effects and two-way interactions. Prior to analysis, each predictor variable was rescaled to a mean of zero and standard deviation of one to better compare their relative effect. Then, using the MuMIn library in R 29 we estimated the parameters of all possible sub-models, including the null. For each sub-model, this method generates an Akaike weight, which describes the likelihood that model explains the data better than all other models. To reduce the number of terms, we then ran the linear model again only including terms from the top four most likely models.
To determine which match activities predicted success in the 3v3 games, we first ran a linear model estimating the effects of attacking, defending, passing success, possession, and ball loss on individual average net goals, including all main effects and two-way interactions. Then, using the MuMIn library in R, 29 we determined no models were clearly better than all the others based on Akaike weights. Because none of the interactive terms approached significance, we then ran a simplified model to explore the data that only included all main effects.
All analyses were carried out in R. 29 Data are reported as means ± standard deviations.
Results
Dribbling and sprinting performance along curved paths
Dribbling speed significantly differed with path curvature (F3,144 = 1076; P < 0.0001), decreasing from a maximum of 5.13 ± 0.39 m.s−1 on the straightest path to a minimum of 2.44 ± 0.14 m.s−1 on the curviest path. Dribbling speeds significantly differed between all paths (Appendix Table 3). Sprinting speed significantly varied with path curvature (F3,144 = 604.7; P < 0.0001), decreasing from a maximum of 6.09 ± 0.41 m.s−1 on the straightest path to a minimum of 3.78 ± 0.25 m.s−1 on the curviest path. Sprinting speeds significantly differed among all paths except the two curviest paths (Appendix Table 4).
Passing and control with rebound boards
The number of successful passes completed by a player was significantly affected by the type of passing test undertaken (F3,144 = 187.3; P < 0.0001). Players completed significantly more passes when using rebound boards at 90 degrees to each other from 4 m (19.2 ± 2.7 passes) than when 8 m from each board (t = -2.66; P = 0.04) (7.7 ± 1.5 passes) (Appendix Table 5). Players completed 16.3 ± 3.6 passes when using rebound boards at 135 degrees to each other from 4 m and 24.8 ± 4.1 passes when using first-time passes with boards 45 degrees to each other. Passing performances significantly differed between all pairs of techniques (Appendix Table 5).
Kicking accuracy
Players hit the target with a success of 51.1 ± 10.7%, with a range of 23% for the poorest individual to 65% for the best.
3v3 matches
In the 3 v 3 games, there was an average of 39.3 ± 8.4 passes (range 21–67) and an average number of possessions of 54.7 ± 8.6 (range 32–81) per game. There was an average of 3.5 ± 1.7 goals (range 0–9) in each four-minute game. The average number of successful passes for an individual per game was 5.84 ± 1.00 and the average number of unsuccessful passes was 0.72 ± 0.20 per game. The average number of goals for an individual was 0.58 ± 0.25 per game, though players varied from 0.16 (poorest) to 1.2 (best) goals per game. In terms of defensive activities, the average number of successful tackles for an individual was 0.70 ± 0.26 per game and the average number of interceptions was 0.72 ± 0.27 per game.
We calculated each individual's success across a range of activities in the 3v3 matches. The average attacking performance score (goals and assists) was 1.00 ± 0.31 per game, ranging from a lowest of 0.42 to highest of 2.13 per game. The average defending performance score (tackles and interceptions) for individuals was 3.0 ± 1.4 per game, ranging from 0.71 to 5.2 per game. The average number of possessions was 5.9 ± 1.0 per game, while the passing success was 88.9 ± 3.1%. The average number of possession losses was 1.4 ± 0.4 per game, ranging from 0.84 to 2.73 per game.
Players with higher dribbling performances (PCD1) were more likely to have higher attacking scores (R2 = 0.46; P < 0.0001) and defensive scores (R2 = 0.21; P = 0.003) but not ball loss scores (R2 = 0.02; P = 0.74) (Figure 1). Faster sprinters (PCS1) were more likely to have higher attacking scores (R2 = 0.14; P = 0.015) but not defensive activity scores (R2 = 0.03; P = 0.14) or ball loss scores (R2 = 0.06; P = 0.076) (Figure 1). Players with better overall passing performances (PCP1) were more likely to have higher defending scores (R2 = 0.31; P = 0.0002) but not attacking scores (R2 = 0.10; P = 0.14) or ball loss scores (R2 = 0.06; P = 0.082) (Figure 1). Players with more accurate kicking with their dominant foot were not significantly more likely to have higher attacking activity scores (R2 = 0.027; P = 0.780), defensive activity scores (R2 = 0.21; P = 0.003) or ball loss scores (R2 = 0.019; P = 0.55).
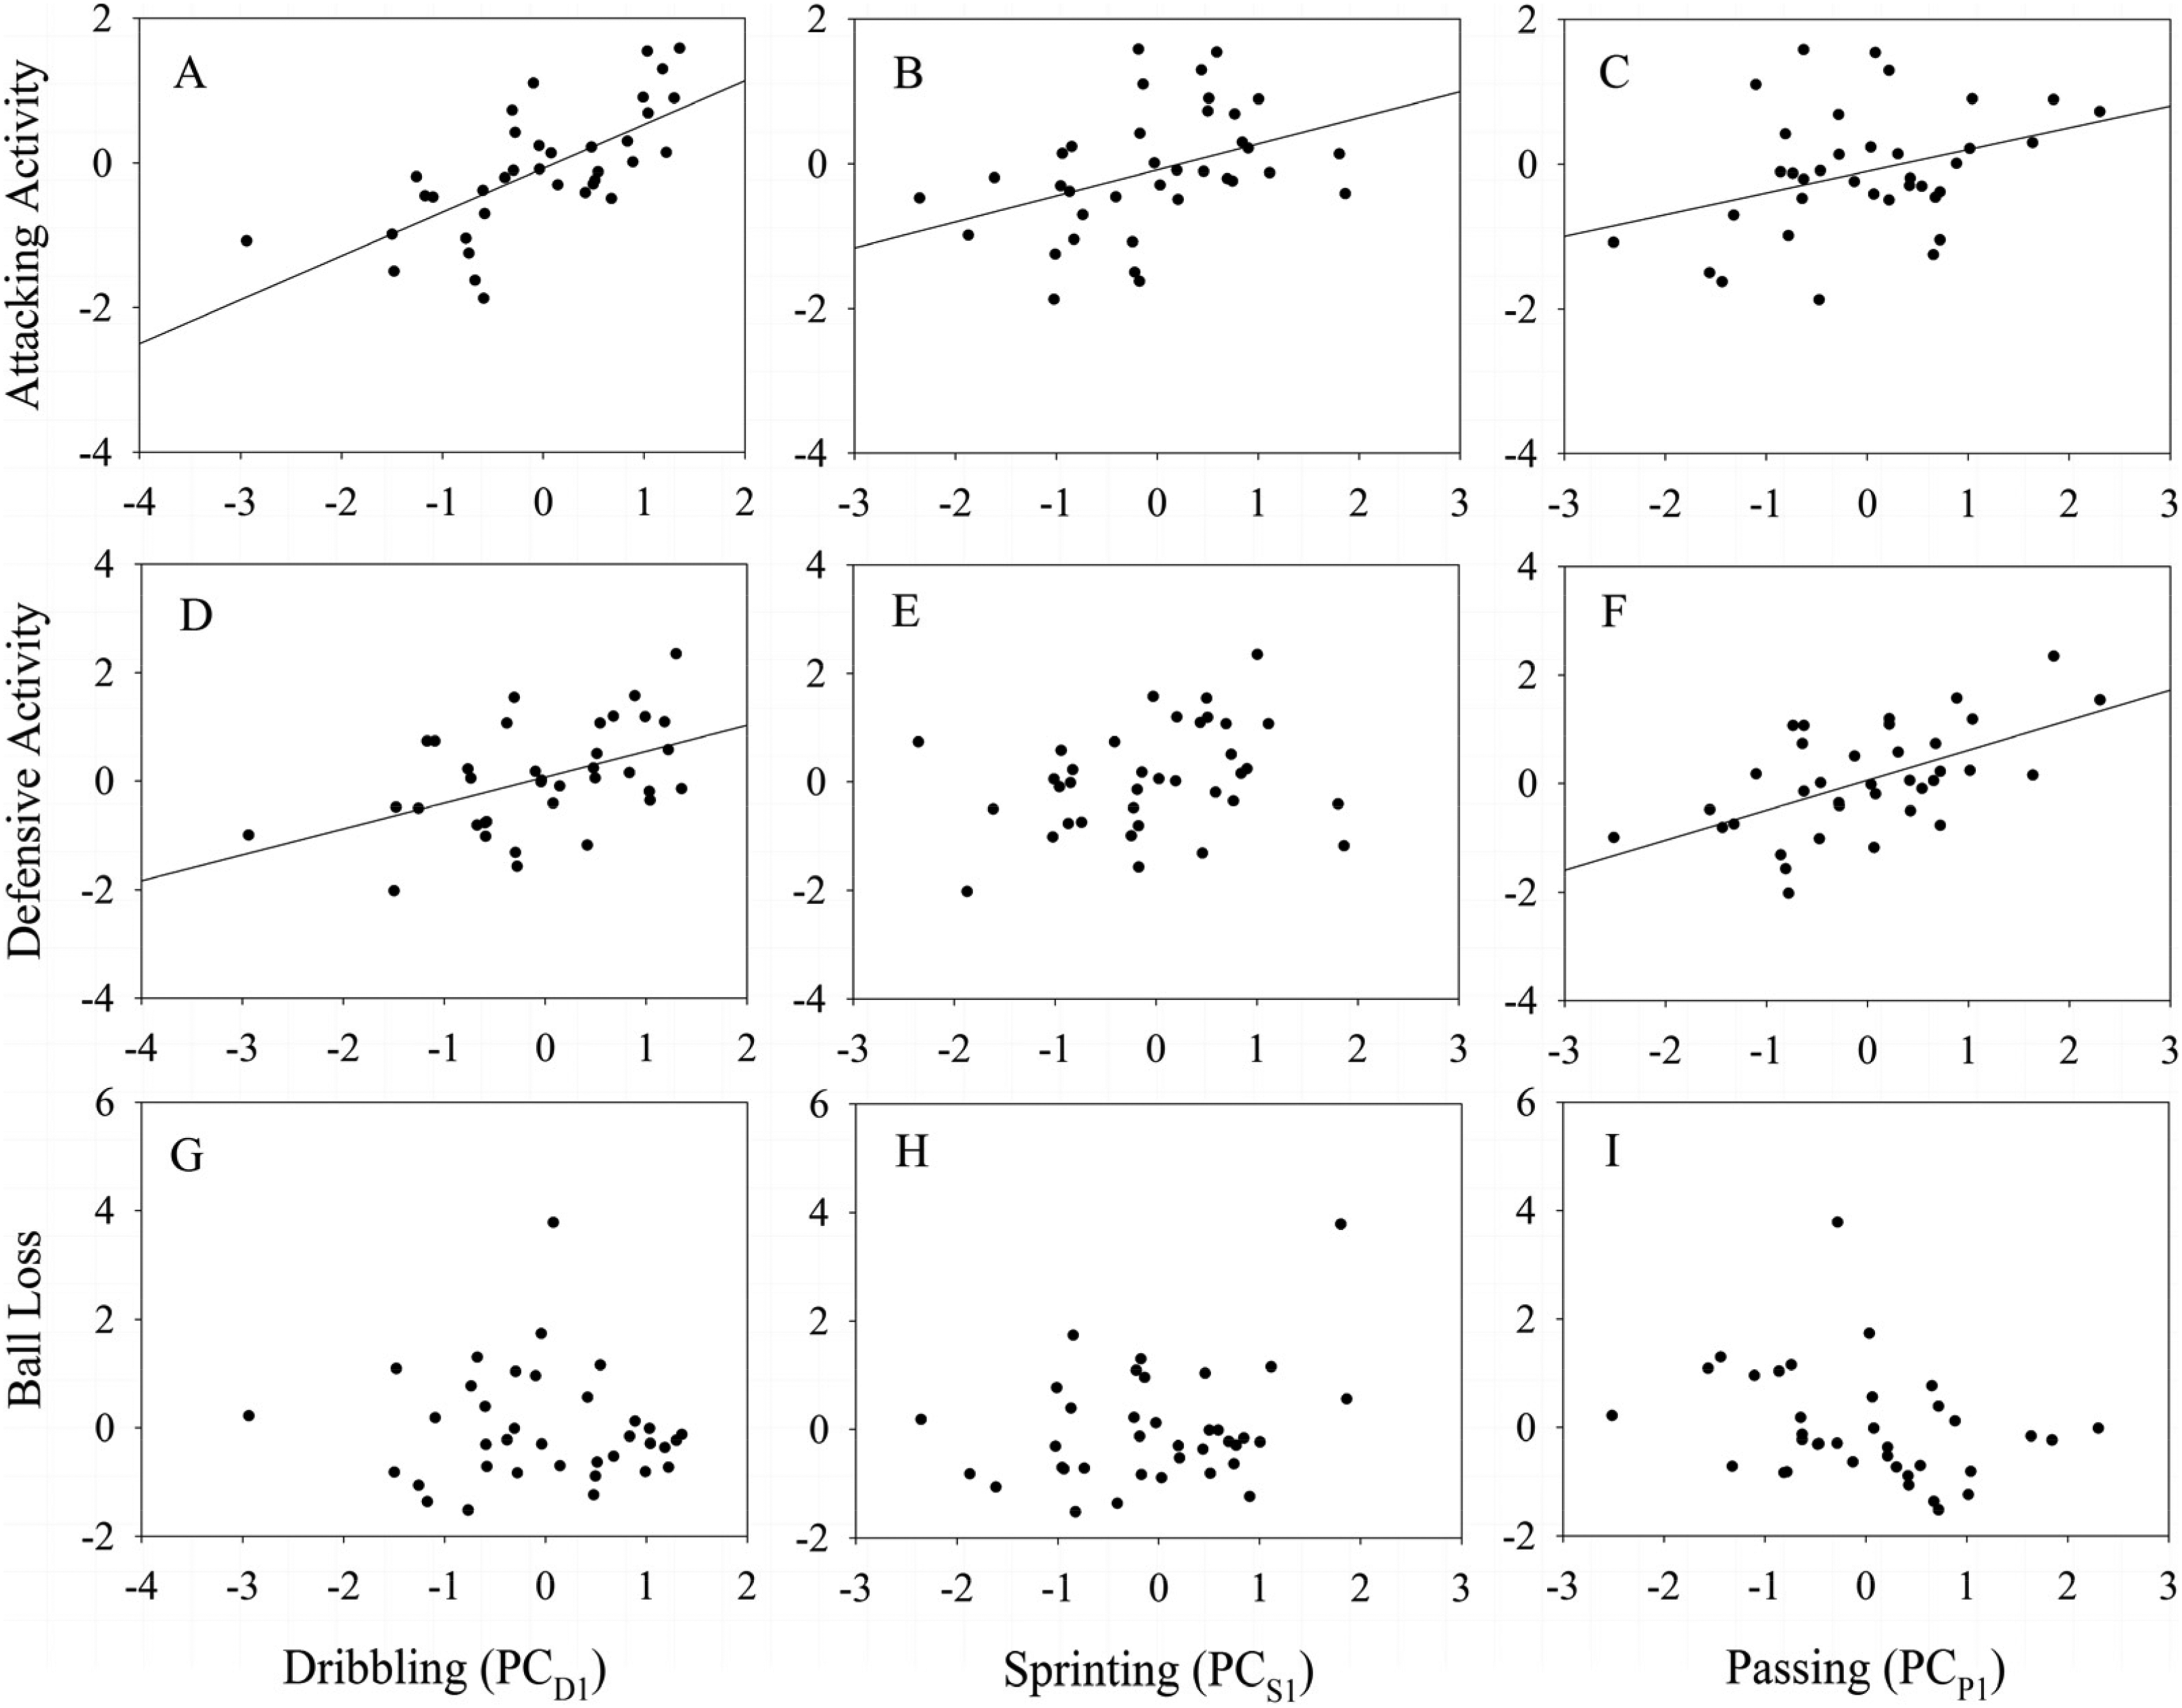
The relationship between overall dribbling speed (PCD1), overall sprint speed (PCS1), and overall passing and control performance (PCP1) on an individual's attacking (A, B, C, respectively), defending (D, E, F, respectively), and ball loss scores (G, H, I, respectively) in the 3v3 games. All correlations with a linear line are significant.
Average number of net goals scored for each individual was significantly associated with dribbling (R2 = 0.25; P = 0.0013) and passing performance (R2 = 0.26; P = 0.0009), but not with either sprinting performance (R2 = 0.003; P = 0.34) or kicking accuracy (R2 = 0.007; P = 0.27) (Figure 2).
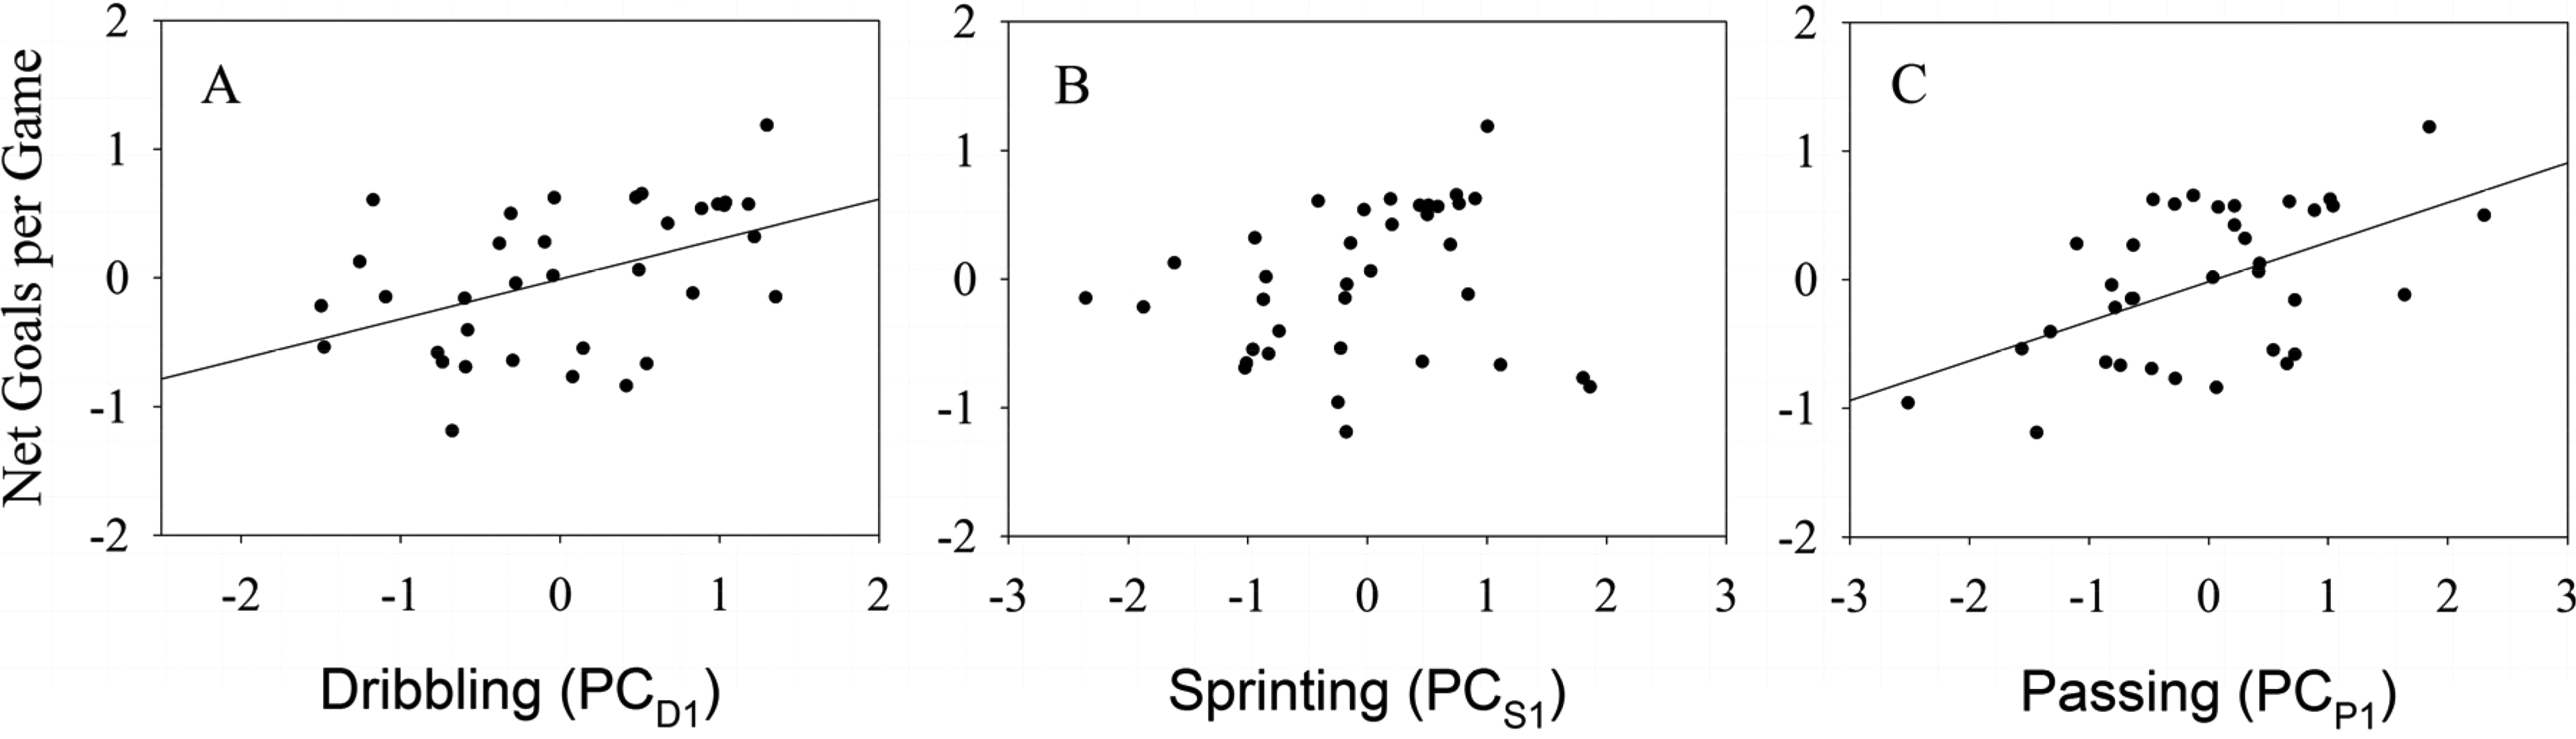
The relationship between an individual player's net goals per game in the 3v3 matches and their overall (A) dribbling speed (PCD1), (B) sprint speed (PCS1), and (C) performance on the rebound board passing tests (PCP1). All correlations with a linear line are significant.
Players with higher attacking scores were significantly more likely to have higher individual net goals per game (R2 = 0.39; P < 0.0001)(Figure 3). Players with high defensive scores (R2 = 0.21; P < 0.0001) and lower ball loss scores (R2 = -0.22; P = 0.001) were also significantly more likely to have higher individual net goals per game (Figureure 3). Percentage passing success rate (R2 = 0.05; P > 0.05) and possessions per game (R2 = 0.001; P > 0.05) were not significantly related to individual net goals per game (Figure 3).
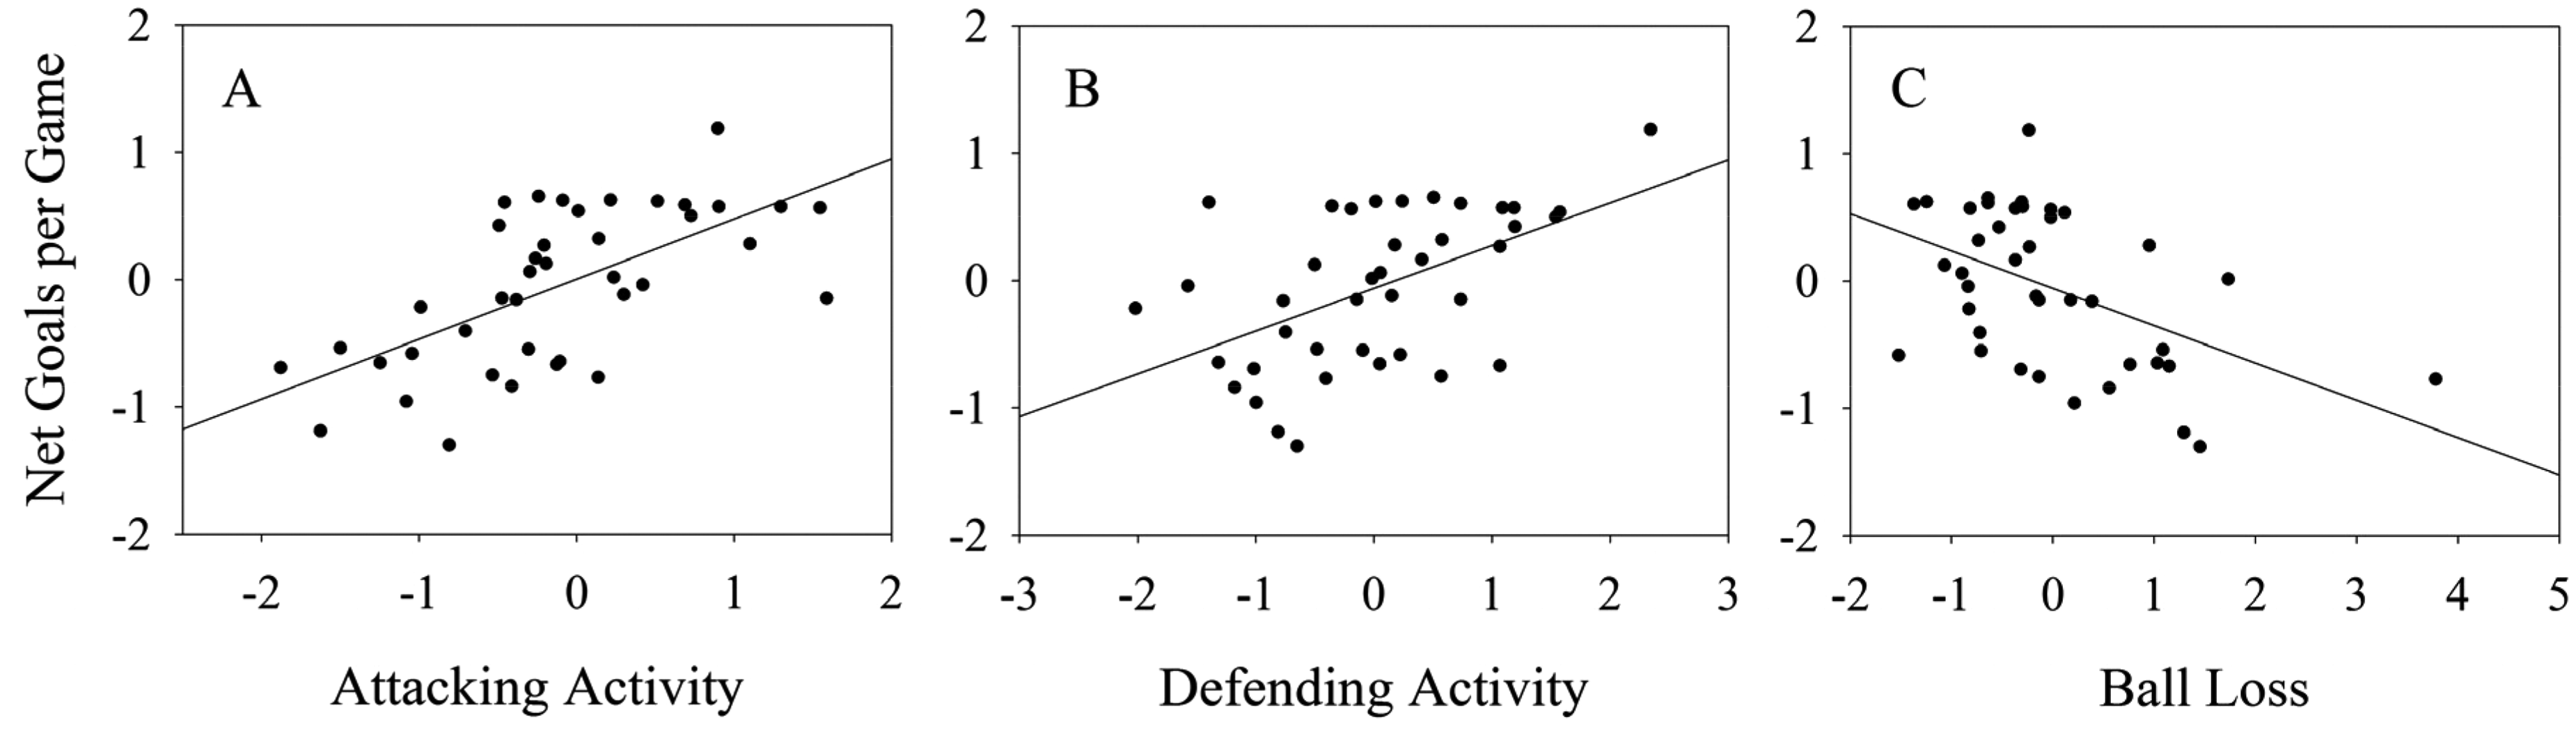
The relationship between an individual player's (A) attacking, (B) defending, and (C) ball loss scores and their net goals per game in the 3v3 matches. All correlations are significant.
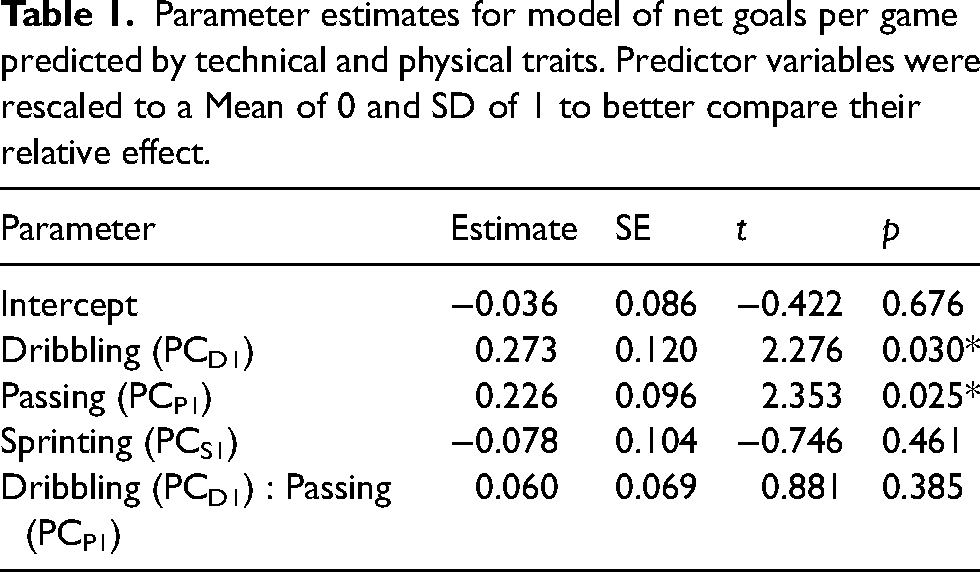
All performance traits—passing (PCP1), dribbling (PCD1), sprinting (PCS1) and passing accuracy—were considered in a multivariate analysis of success in the 3 v 3 games (individual average net goals). Based on Akaike model selection, PCP1, PCD1, PCS1 and the interaction between PCP1 and PCD1 were all included within the top four most likely models to describe variation in an individual's average team net goals (Appendix Table 6); and within the model, overall passing (PCP1) (t = 2.35; P = 0.025) and overall dribbling (PCD1) (t = 2.35; P = 0.03) were the only significant predictors of average individual net goals (F4,31 = 4.94; adjusted R2 = 0.31; P = 0.003) (Table 1).
Parameter estimates for model of net goals per game predicted by technical and physical traits. Predictor variables were rescaled to a Mean of 0 and SD of 1 to better compare their relative effect.
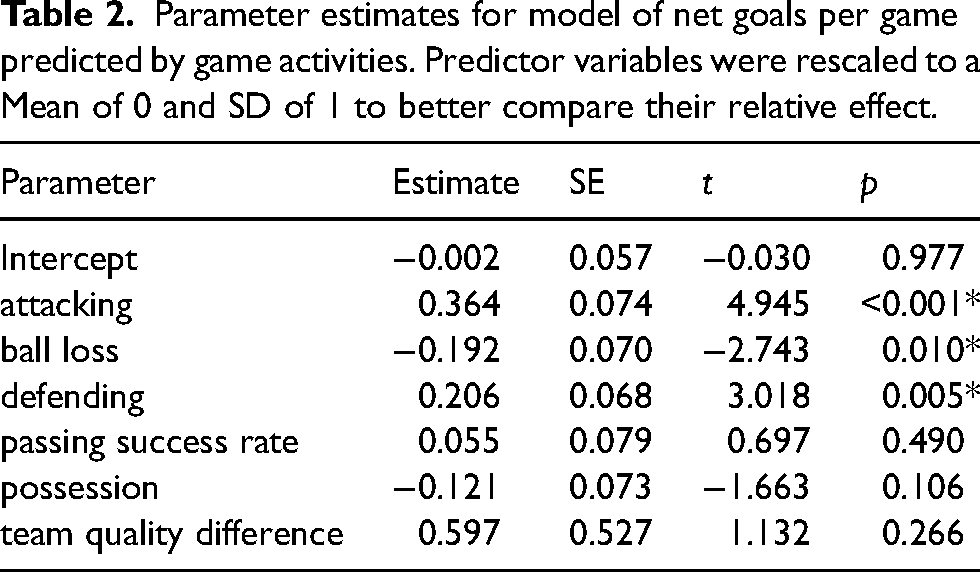
All match activity scores—attacking, defending, passing success, possession, and ball loss—were considered in a multivariate analysis of success in the 3 v 3 games (individual average net goals). Based on Akaike model selection, none of the models were more likely than any other to be the best descriptor of the data. The parameters of our statistical models of individual net goals estimated by multi-model inference, which include statistical significance for each factor and interaction, can be seen in Appendix Table 8. Because none of the interactive effects of any of the parameters were significant, we then relied upon the simplest model to explore the data that only included each of the independent traits (i.e., the main effects) (Table 2). An individual's average net team goals was significantly predicted by this model (F6,33 = 14.09; adjusted R2 = 0.67; P < 0.0001); and within the model, attacking activity score (t = 4.95; P < 0.0001), defense score (t = 3.02; P = 0.005), and ball loss score (t = −2.74; P = 0.01) (Table 2) were significant predictors.
Parameter estimates for model of net goals per game predicted by game activities. Predictor variables were rescaled to a Mean of 0 and SD of 1 to better compare their relative effect.
Differences between teams
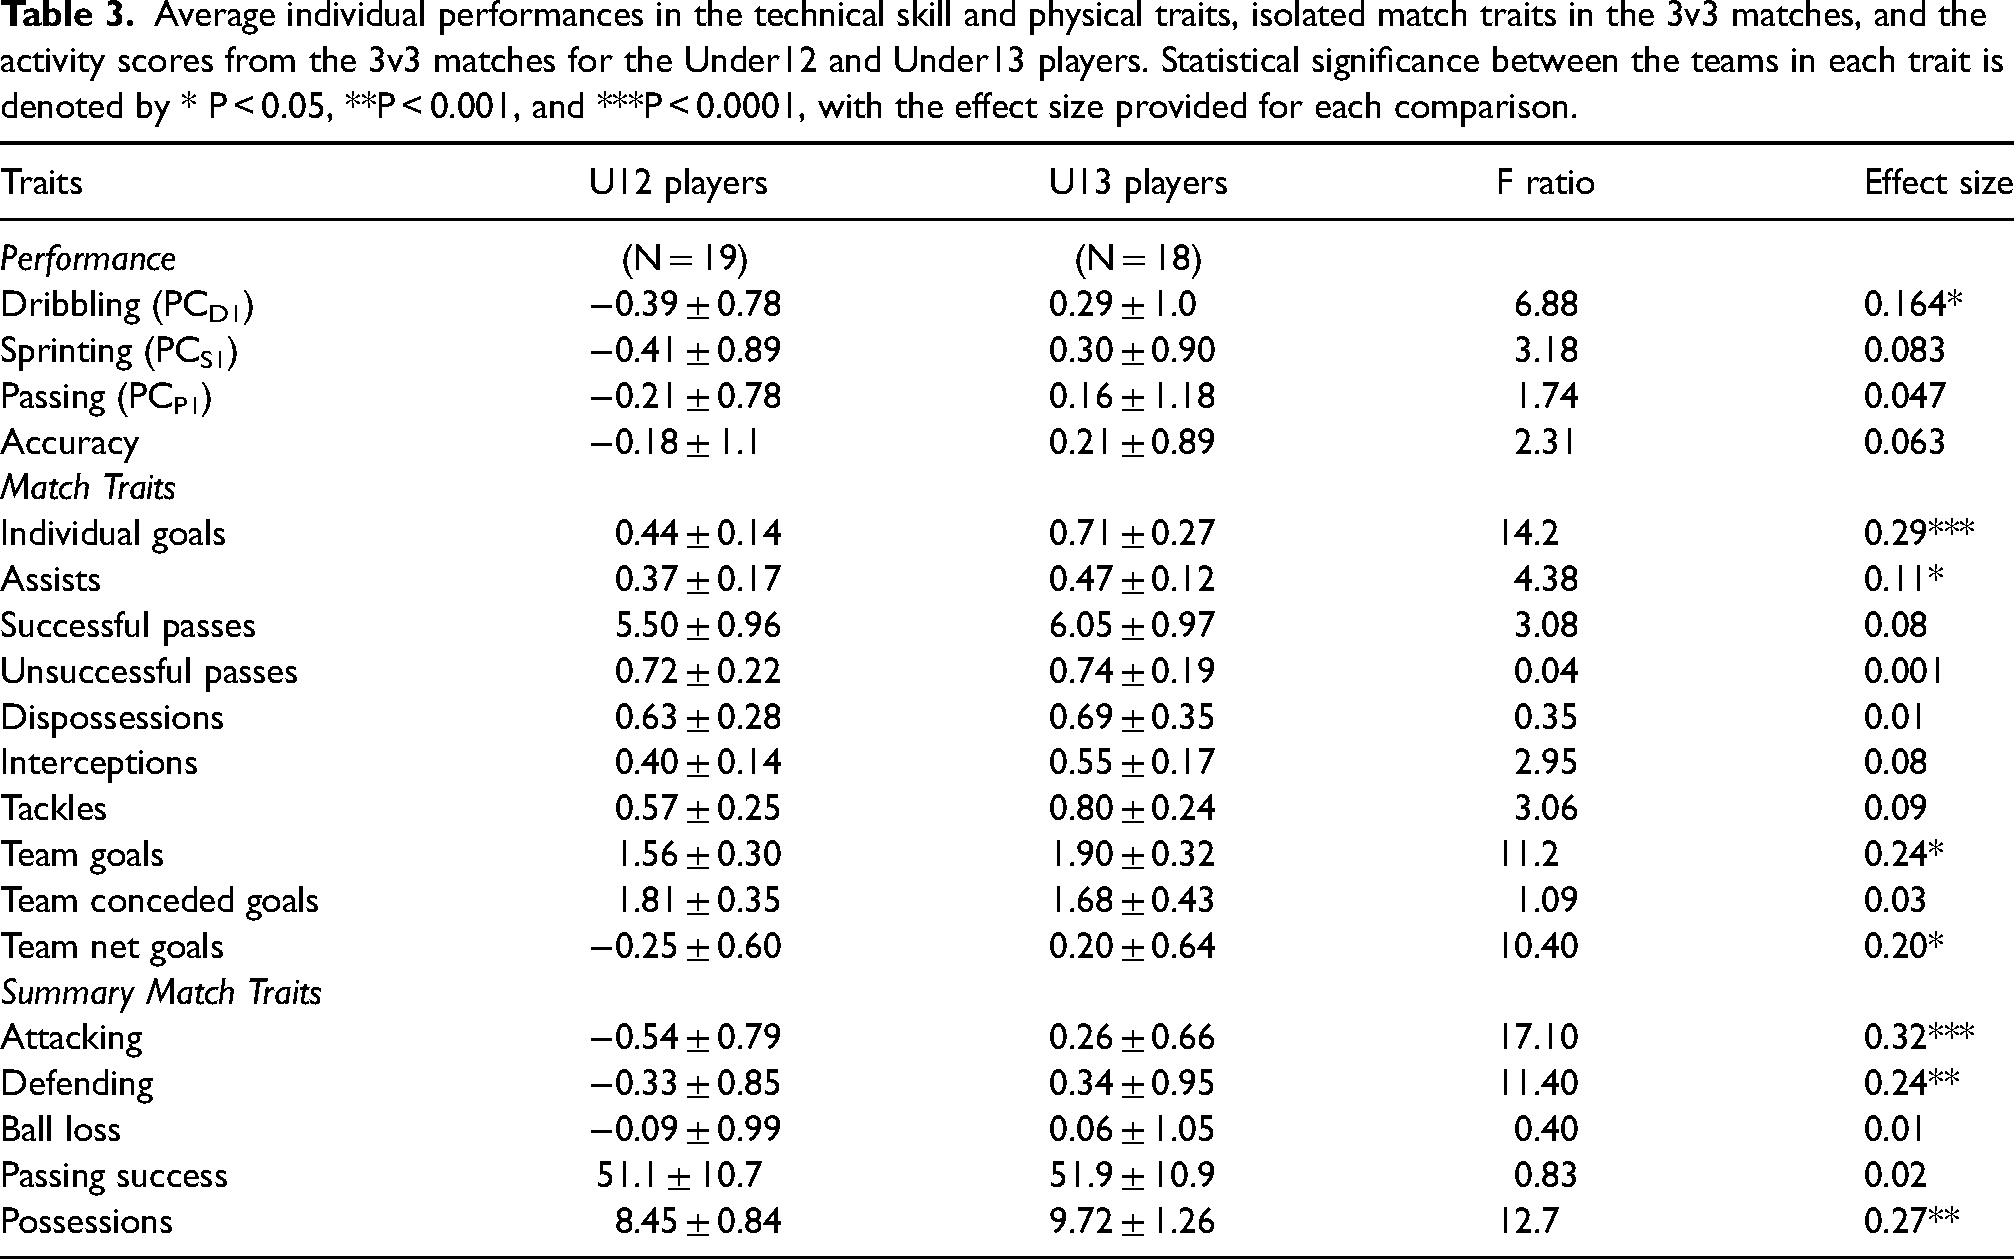
Dribbling performances (PCD1) significantly differed between the U12 and U13 players (F = 6.88; P < 0.05) but the groups did not differ in passing performance (PCP1), sprinting performance (PCS1) or kicking accuracy (Table 3). Of all the match traits that were examined for the players in the 3v3 matches, only an individual's number of goals (F = 14.2; P < 0.001), assists (F = 4.38; P < 0.05), total average team goals (F = 11.2; P < 0.05) and net goals (F = 10.4; P < 0.05) differed between the age groups (Table 3). For the match activity scores, attacking score (F = 17.1; P < 0.001), defensive score (F = 11.4; P < 0.01), and average number of possessions (F = 12.7; P < 0.01) differed between the U12 and U13 players (Table 3).
Average individual performances in the technical skill and physical traits, isolated match traits in the 3v3 matches, and the activity scores from the 3v3 matches for the Under12 and Under13 players. Statistical significance between the teams in each trait is denoted by * P < 0.05, **P < 0.001, and ***P < 0.0001, with the effect size provided for each comparison.
Discussion
Our aim was to identify the underlying technical and physical traits associated with success in 3v3 small-sided soccer games. We found metrics of dribbling and passing performances were the best predictors of success in the 3v3 small-sided games. Because there are multiple ways that players can be successful in football, any quantitative protocol for talent identification needs to be flexible to these characteristics. Importantly, we found players could achieve equally high success in the 3v3 games (net goals per game) by being good attackers (sum of individual goals scored and assists) or good defenders (sum of interceptions and tackles). Furthermore, players that lost the ball on fewer occasions also could achieve high game success. Considering these three game activities together, we found player's attacking, defending and ball loss performances explained around 70% of the variance in their net team goals per game. Our metrics of technical and physical traits were also associated with success in attacking, dribbling and ball loss in the 3v3 games. Individuals that were better dribblers, sprinters and passers were more likely to be better attackers, while individuals that were better dribblers and passers were more likely to be better defenders. We also found most of our closed skill tests and match performances could reliably discriminate between the two age groups in our study. For example, the U13 players had higher dribbling, sprinting and passing performances than the U12 players, and the U13 players had higher individual goals, assists, team goals, and team net goals than the U12 players.
Based on our multivariate models, we found an individual's physical and technical performances explained around 30% of the variance in success in the small-sided games. One could interpret these models as being insufficient descriptions of player match success to be usable. However, it is important to recognise that these 3v3 small-sided games are inherently complex systems with multiple interacting agents where one should expect a high amount of unexplained variance in the models. Ultimately, describing around one third of variance in individual game success based on only two closed-skill tests (dribbling and passing performance) provides good evidence that these traits have high and valuable predictive capacity. Indeed, both of these metrics of dribbling and passing performance have also been associated with match-realistic training games across multiple studies. Individual variation in dribbling performance is associated with 1v1 attacking performance, 24 goal scoring success against a defender and a goalkeeper, 27 defending success, 28 and overall performance in 11-a-side matches. 14 In addition, individual passing performances are associated with variation in player's abilities to maintain possession in 3v1 25 and 4v3 26 games. Because these isolated closed skill tests also allow independent comparisons among individuals and groups, they are excellent target traits upon which to base talent identification protocols. Studies exploring how age, size, and maturity affect these closed skill traits represent an important starting point.30,31
Performance in tests of closed skill should not be considered as simple causal determinants of match performance, and their worth for identifying talented players should not be judged on this basis. Instead, closed skills should be considered as statistical predictors of match success. Undoubtedly, false positive associations will still occur when using closed skills to identify talented players. That is, some individuals will perform well in isolated tests but perform poorly under match conditions. However, false negatives - where individuals perform poorly in a task under isolated training conditions but perform well in the task under match conditions - are far less likely to occur. Given some closed skills can predict among individual variation in match success, and there are unlikely to be false-negative tests, closed skills offer important traits upon which talented players can be selected.1,9,32 Because the dribbling test used in our study predicts among individual variation in 1v1 contests,24,27 1v1 defensive performance, 28 goal scoring success, 27 and success in 3v3 matches (this study), this closed skill offers a likely candidate upon which to base talent selection protocols. Dribbling performance as tested in isolation does not determine success under the conditions of matches but it allows one to predict success with a certain degree of probability. This underlies the utility of closed skill tests in the context of predicting match performances. In this specific case, there is little doubt that having precise ball control in isolated settings is essential for effective dribbling in match scenarios. However, improvements in technical dribbling through training do not necessarily translate directly into enhanced attacking performance against opponents. This presents a key limitation of our study. Dribbling speed along curved paths has been linked to an individual's attacking and defensive abilities in one-on-one situations,24,27,28 but the causal relationship between our dribbling metric and real-game activities remains uncertain. While we anticipate that faster dribbling along our test paths will correlate with better attacking and defensive skills in realistic match conditions, this hypothesis has yet to be confirmed. Additionally, our assessment of dribbling is based on closed-skill execution, which has been criticized for removing skills from their real-game context.1,4,6
A significant challenge in talent identification programs for youth football is that older players within an age group are often perceived as better simply due to their greater physical maturity and strength. As a result, football academies worldwide tend to be dominated by players born in the first half of the year. 33 This selection bias, known as the relative age effect, is one of the most subtle yet persistent forms of discrimination in team sports. Future studies should explore how age, size and maturity affect these closed skills to develop normative data of dribbling and passing performances for assessing the quality of players relative to a high achieving group of young individuals. Selection of talented players on the age- and size-corrected closed skills also offers a potential avenue for minimising the relative age effects where relatively older players are more likely to be identified as talented. Implementing methods that enhance the chances of identifying talented players—regardless of their younger age or lower physical development compared to their peers—could provide a major advantage for clubs that adopt such strategies. Soccer-specific skill tests, such as those assessing dribbling and passing, as used in this study, could serve as a valuable foundation for creating an objective and data-driven assessment tool that can counteract age and size biases in youth selection. Utilizing performance metrics that account for both age (in days) and physical size could provide more equitable, reliable, and precise evalulations.
Conclusion
Closed-skills that are statistical predictors of success under the complex conditions of match play should be a key element of talent identification protocols. Taken in conjunction with metrics of individual performances that are derived from small-sided games, 11 coaches and scouts can obtain a robust assessment of individual player quality. In addition, longitudinal testing of closed-skills can also allow one to test among alternate coaching programs aimed at developing these technical skills, providing a more rigorous basis to the training of technical skill and its associated performances in games.
Supplemental Material
sj-docx-1-spo-10.1177_17479541251346902 - Supplemental material for Dribbling and passing performances predict individual success in small-sided soccer games
Supplemental material, sj-docx-1-spo-10.1177_17479541251346902 for Dribbling and passing performances predict individual success in small-sided soccer games by Robbie S Wilson, Andrew H Hunter, Thiago V Camata, Charles SP Foster, Gabriella R Sparkes, Paulo RP Santiago, and Nicholas MA Smith in International Journal of Sports Science & Coaching
Footnotes
Acknowledgements
We thank all the volunteers that helped with the collection of the data and Amanda Niehaus for writing assistance. RSW was supported by an Australian Research Council Fellowship (FT150100492) and PS was supported by grant #2019/17729-0 from the São Paulo Research Foundation (FAPESP). We thank all the coaches and players involved in this study.
Declaration of Conflicting Interests
The authors declared no potential conflicts of interest with respect to the research, authorship, and/or publication of this article.
Funding
The authors received no financial support for the research, authorship, and/or publication of this article.
Supplemental material
Supplemental material for this article is available online.
References
Supplementary Material
Please find the following supplemental material available below.
For Open Access articles published under a Creative Commons License, all supplemental material carries the same license as the article it is associated with.
For non-Open Access articles published, all supplemental material carries a non-exclusive license, and permission requests for re-use of supplemental material or any part of supplemental material shall be sent directly to the copyright owner as specified in the copyright notice associated with the article.