
Abstract
This paper investigates unforced errors in tennis which is facilitated by a rich dataset. Descriptive analyses are carried out which studies the distribution of unforced error rates across professional tennis players, the identification of players with high and low rates, the relationship between rates and match winning percentage, the relationship between rates and aggressiveness (via hitting winners), the relationship between rates and touch number, and the study of rates versus time. Methods are then developed to assess the impact of unforced errors which are applicable to any racquet sport. We demonstrate the approach in the context of professional tennis with an investigation of the longstanding rivalry between Roger Federer and Rafael Nadal. The value of the approach is that we can provide estimates of the points lost, games lost, sets lost and matches lost due to unforced errors. The methods are based on a bootstrapping procedure which also yields standard errors for the estimates. The approach is valuable in terms of player evaluation, and can also be used for training purposes where it is possible to assess the quantification of improvement based on fewer unforced errors.
Introduction
The term “unforced error” is often mentioned in sport. It is a mistake made by a player or by a team that is viewed as unnecessary and caused entirely by the player or the team. For example, in American football, a coaching staff has complete control over the assignment of players on the field, and therefore, the penalty “too many men on the field” would be regarded as an unforced error. Since unforced errors are controllable, they are regrettable, and are often discussed and criticized. In racket sports, an unforced error is typically regarded as shot that a player ought to have executed, but a mistake has been made whereby the shot is not put “in play”.
Despite the widespread acknowledgment that unforced errors ought to be minimized, the analysis of unforced errors is a topic that has received minimal attention in the sports analytics literature. In the rare instances of the analyses of unforced errors, it has primarily been in the context of racquet sports. In badminton, 1 considered 30 singles matches in university matches, and observed that match winners had significantly fewer unforced errors than losers. Again in badminton, 2 considered 57 men’s singles matches from the 2016 Olympic Games, and observed that match winners had significantly fewer unforced errors than losers. In tennis, 3 outlines how players can reduce unforced errors by adhering to various principles of physics. Also in tennis, 4 provide a theoretical framework for studying unforced errors. They suggest that the minimum number of additional points needed to win a game given an unforced error is a measure of the impact of an unforced error. Given varying match circumstances (i.e., the score), unforced errors have impacts of varying magnitude.
We suggest that there are two reasons for the paucity of sophisticated studies involving unforced errors:
The determination of whether a mistake was an unforced error or a forced error is often subjective, and typical datasets do not provide the distinction. It is not always obvious how to evaluate the impact of an unforced error. Had the unforced error not occurred, what follows in the match is a counterfactual. That is, without the unforced error, it is unclear how the remainder of the match would have unfolded.
In this paper, we consider unforced errors in tennis. Extensive descriptive statistics are provided which analyze unforced errors. Then, methods are developed which permit the quantification of the impact of unforced errors. Fortunately, we have access to a dataset that categorizes tennis errors as either forced or unforced. The categorization is carried out by trained volunteers who watch video recordings of matches. The training aspect is important as it reduces subjectivity and improves the reliability of the datasets. In our methods, we overcome the counterfactual problem by simulating the remainder of a match following an unforced error using a bootstrapping procedure. In the absence of a parametric statistical model, bootstrapping is a nonparametric procedure, which facilitates estimation by sampling outcomes from the observed sample and treats the bootstrap sample as though it were a sample from the population (Efron and Tibshirani 5 ). We utilize the probabilities of what may have happened had the unforced error not occurred. By repeatedly simulating the remainder of the match by removing the unforced error, we obtain the expected impact of the unforced error. Further, we can investigate “what-if” scenarios. For example, we might pose the question, how would a player have fared in a match had the player reduced their unforced errors by 10%? Answers to these types of questions are valuable in terms of player evaluation and player development.
Although unforced errors do not appear to have been analyzed extensively in tennis, tennis has seen an upsurge of work in analytics. One of the first serious statistical contributions to tennis analytics was the work by Klassen and Magnus. 6 It concerned an investigation of the iid assumption that points are independent and identically distributed. They concluded that there is a positive correlation between successive outcomes and that servers are less likely to win a point in important situations.
Baker and McHale (Baker and McHale7,8) used the classical Bradley-Terry model to compare the performance of tennis players. McHale and Morton 9 employed the same model for the purpose of forecasting tennis matches. 10 investigate player characteristics in relation to to the length of the rally. A comprehensive text on tennis analytics for Wimbledon is given by Klassen and Magnus. 11
Sports analytics has been assisted by the availability of tracking data. With tracking data, player and ball locations are recorded with high frequency (i.e., spatio-temporal data), and these detailed datasets have contributed to explorations of many sporting problems that were previously unimaginable. Gudmundsson and Horton 12 provide a review on spatio-temporal analyses used in invasion sports where player tracking data are available. In tennis, there are a growing number of papers that provide statistical analyses that rely on tracking data. Tea and Swartz 13 investigate serving tendencies which allows a player to anticipate the nature of the opponent’s serve. The approach relies on hierarchical models in a Bayesian framework. Kovalchik and Albert 14 also used a Bayesian framework where they investigate serve returns by introducing a semiparametric mixture model. Other papers that use tracking data but focus exclusively on the serve include Mecheri et al. 15 and Wei et al. 16 The text by Albert et al. 17 provides a flavour for sports statistics across major sports.
In Section “Tennis data”, we describe the data and associated issues. In Section “Methods”, we describe the proposed bootstrapping methods that permit the quantification of the impact of unforced errors. Specifically, we provide estimates of the expected points lost, games lost, sets lost and matches lost due to unforced errors. In Section “Analyses”, we explore some descriptive statistics and we illustrate the proposed methods in the context of a match between tennis professionals. We conclude with a short discussion in Section “Discussion”.
Tennis data
The data utilized in this paper are taken from the nearly 1.5 million serves in the men’s (ATP) and women’s (WTA) professional tennis matches. The data are available from the Match Charting Project (https://github.com/JeffSackmann/tennis_MatchChartingProject) maintained by Jeff Sackman. The data involve matches from 1970 through 2022 and contain shot-by-shot outcomes involving 710 distinct men and 489 distinct women. This public dataset provides information on shot type, shot direction, depth of returns, types of errors, and more. The data were collected by trained volunteers after watching the video recordings of matches. To the best of our knowledge, there is no other source of publicly-available data of this type. At present, these data appear to be underutilized with respect to statistical analyses.
The data cover matches from all the major Grand Slam events, the Davis Cup and many minor tournaments. The best players of this time period are included in the dataset. Since the charting of matches was at the discretion of volunteers, data are skewed in favour of later years. Also, better players have a higher representation since they frequently reached the latter rounds of tournaments.
Data management issues
When analyzing data, it is obviously important that the data are accurate. Therefore, we carried out various procedures to check data accuracy.
In the MatchChartingProject dataset, rows correspond to points awarded. Therefore, we augmented the dataset to include all serves. For example, whenever a second serve occurred, this implied that there was a first serve that resulted in a fault, where no point was awarded.
We observed minimal numbers of obvious data entry errors. One example concerns the rallyCount variable where there were five non-numeric characters in the ATP data. We simply removed the corresponding rows when this occurred. We remind the reader that there is an element of subjectivity in deciding whether an error was unforced or forced.
Methods
Consider a match or a series of matches between player A and player B. We wish to consider the impact of the unforced errors committed by player A in these matches. We carry out the analysis via simulation. Note that we only define unforced errors as those that lead directly to a point obtained by player B; therefore first serve faults by player A are not considered unforced errors.
In the following three simulation procedures, we sample serves from historical serves. Since the outcome associated with a sampled serve is dependent on the server and the serve number, we categorize the serves and their subsequent rally outcomes into four datasets according to:
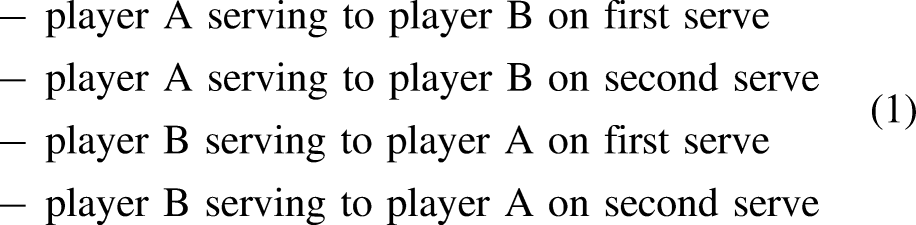
Therefore, as a simulated match progresses, we recognize the status of the match (i.e. the server and the serve number) and we sample from the appropriate dataset above.
For each of the four datasets in (1), rows correspond to a serve and the subsequent rally. The relevant fields (columns) for each row are player name, opponent name, date of the match, the score, the server, fault (yes/no), point scored by the server (yes/no), number of touches in the rally, and the final touch (winner, forced error or unforced error).
Simulation scenario (i) – unforced error rate unchanged
We first consider a simulation scenario where player A commits unforced errors at the same rate (probability) that occurred in the observed data. We consider this scenario to verify that the simulation results are comparable to the actual results. We also use this scenario as a building block for the more interesting “what-if” simulation scenarios in Sections “Simulation scenario (ii) – unforced errors eliminated” and “Simulation scenario (iii) – unforced error rate reduced”.
We do not provide the details of scoring in tennis but note that players accumulate points which leads to games won which leads to sets won which leads to matches won. The bootstrapping algorithm for this scenario (i) is easily described and begins with one of the players initiating service in Game 1 of Set 1.
For each serve in a simulated match, the simulation proceeds as follows:
based on the previous results of the simulated match, the server and the serve number are identified according to the rules of tennis; this determines the relevant dataset for sampling as listed in (1) randomly sample one serve from the relevant dataset; record the outcome from that serve as a simulated serve result
To illustrate the algorithm, suppose that a match begins (score 0-0) with player B serving. Therefore, we sample a serve from the third dataset given in (1). For the simulated match, we then record the result of the sampled serve; it will either be a fault by player B, a point for player A, or a point for player B. The result is used to update the simulated match, and we then proceed to the next simulated serve.
Without loss of generality, recall that our interest concerns unforced errors made by player A. The algorithm is simple and allows us to simulate a hypothetical match where player A has made unforced errors at the same rate as in the datasets. We can then repeat the algorithm over many matches to obtain the expected points won by player A, the expected games won by player A, the expected sets won by player A and the expected matches won by player A.
Simulation scenario (ii) – unforced errors eliminated
We now consider a second and unrealistic scenario (ii) where player A does not make unforced errors. This permits the calculation of the same expected values as before. Therefore, the differences in the expected values between scenario (ii) and scenario (i) provide a quantification of the overall impact of unforced errors. Scenario (ii) involves no unforced errors by player A, and provides a baseline for the maximum amount of improvement that the player can achieve. Again, it is unrealistic to assume that player A could eliminate their unforced errors completely. However, this analysis demonstrates the massive importance of unforced errors in tennis.
For each serve in a simulated match, the simulation proceeds as follows:
based on the previous results of the simulated match, the server and the serve number are identified according to the rules of tennis; this determines the relevant dataset for sampling as listed in (1) sample a serve from the relevant dataset – if the subsequent rally does not involve an unforced error by player A, record the outcome from that serve as a simulated serve result; otherwise, use Table 1 to simulate an outcome based on the table probabilities (this provides an imputed counterfactual outcome as though player A had not committed the unforced error)
Estimated probabilities of player A winning the point given that player A does not make an unforced error on touch
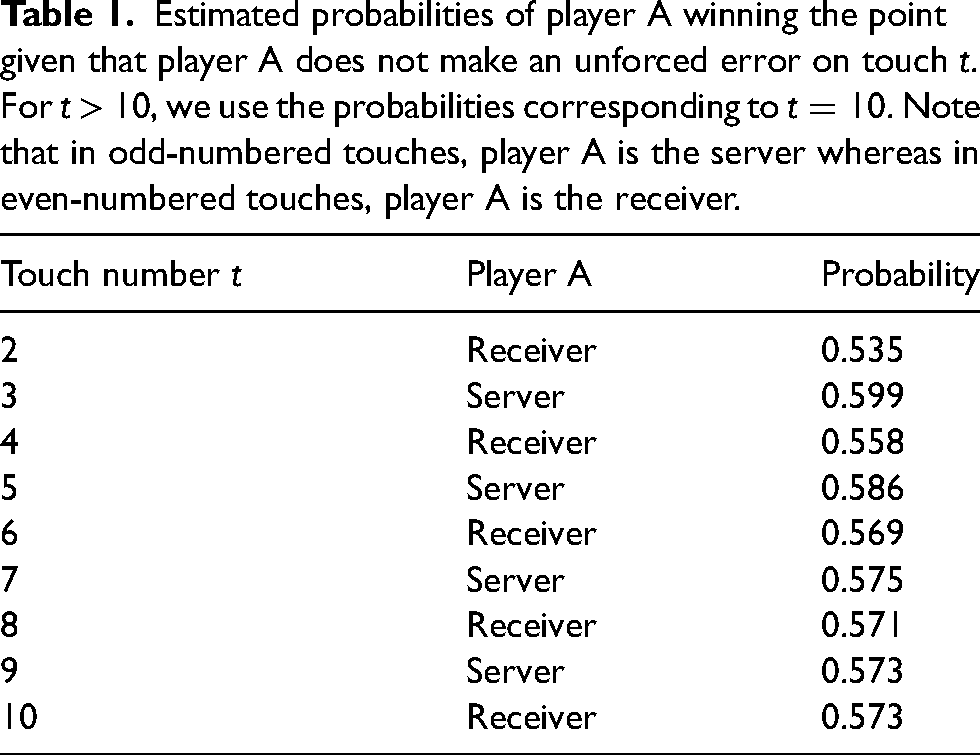
The simulation algorithm in scenario (ii) is slightly more complicated than in scenario (i). Recall that we want to eliminate unforced errors by player A. When we sample a serve that involves an unforced error by player A, it is unknown who would have won the point had the unforced error not occurred. This is why the simulated result is referred to as a counterfactual outcome.
To impute the counterfactual outcome, we first observe the touch number
Table 1 provides player point probabilities derived from the work of Epasinghege Dona.
10
The probabilities correspond to player A winning the point given that A does not make an unforced error on touch
Simulation scenario (iii) – unforced error rate reduced
Scenario (ii) allows us to quantify the overall impact of unforced errors in terms of recognizable tennis statistics. However, we are also able to carry out what-if analyses for training purposes. Specifically, we can assess the impact of unforced errors by player A were they able to reduce their unforced error rate. For example, it may be interesting to observe how player A may improve if they were able to reduce unforced errors by a given rate, say
This introduces a modification of the previous simulation algorithm. For each serve in a simulated match, the simulation proceeds as follows:
based on the previous results of the simulated match, the server and the serve number are identified according to the rules of tennis; this determines the relevant dataset for sampling as listed in (1) sample a serve from the relevant dataset
if the subsequent rally does not involve an unforced error by player A, record the outcome from that serve as a simulated serve result if the subsequent rally does involve an unforced error by player A, record the outcome from that serve as a simulated serve result with probability
In the above algorithm, 100
As pointed out by one of the reviewers, this analysis is based on the assumption that a player is able to retain the same level and style of play while simultaneously reducing their unforced error rate. For this reason, we suggest only minor considerations of rate reductions, say 5% or 10%. With minor reductions that eliminate truly bad mistakes, a player will not need to adjust their playing strategies such as hedging their shots further away from sideline boundaries or reducing the speed of their shots. With the observational data available to us, it would be most difficult to get at the causal effects related to strategy and unforced errors. Related to our approach, 18 consider shooting decisions in basketball and address the causality issues in more detail. For example, shot clock constraints in basketball affect shot selection, and the authors study the impact of shot selection via simulation.
Analyses
Descriptive statistics
As the topic of unforced errors in tennis has not received much attention in the academic literature, it is instructive to first explore our dataset using some simple descriptive techniques. In what follows, we observe some features of unforced errors that have not previously been investigated.
To begin, we consider all serves in the ATP and WTA datasets except for first serve faults. Recall that we do not regard first serve faults as unforced errors since they result in a second serve opportunity.
Accordingly, consider a rally that involves
In Figure 1, we provide histograms for the unforced error rate for players in the ATP tour and the WTP tour. These histograms consider only players who have played at least 10 matches. We observe that for most players, the unforced error rates in tennis lie in the interval (5%,12%). It seems that the unforced error rate is similar for men and women.
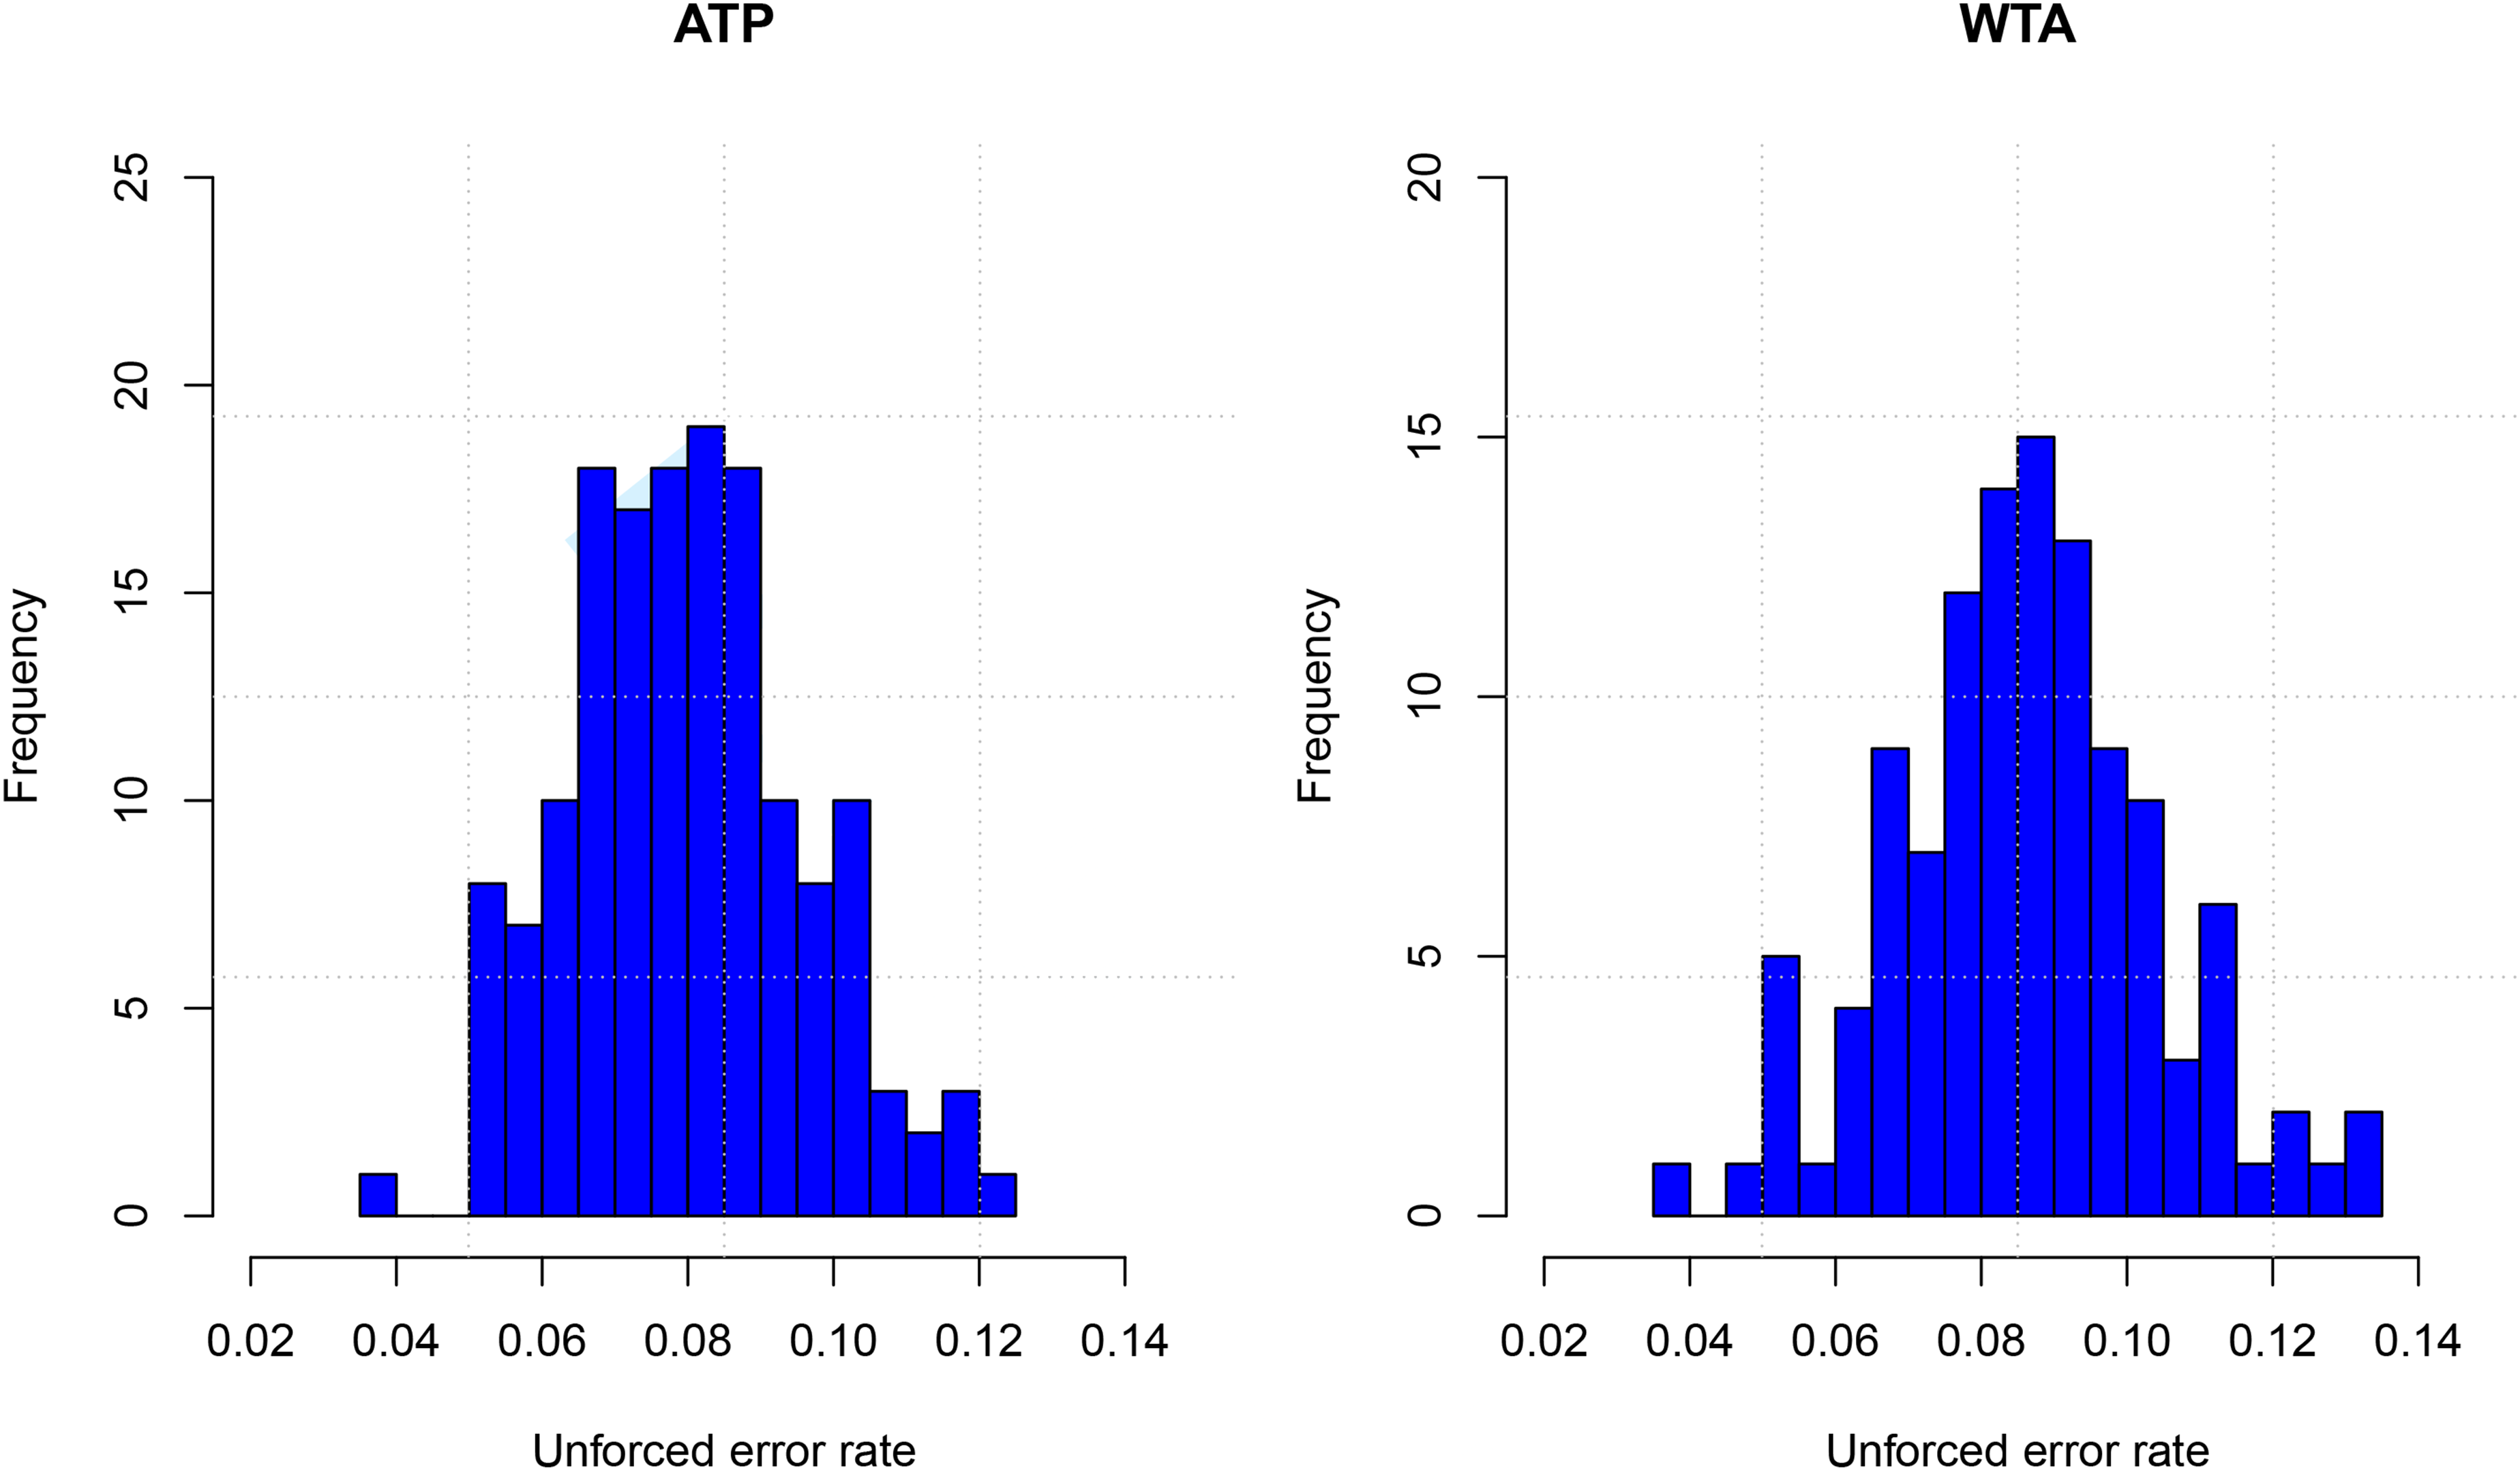
Histograms of unforced error rates for players on the ATP tour and the WTA tour.
From Figure 1, we also see that on average, the unforced error rate across players is roughly 8.0% (ATP) and 8.6% (WTA). As significant as this statistic may appear, unforced errors may be viewed as even more detrimental to success in tennis. Recall, every point must terminate with either an unforced error, a forced error or a winner. When we look at the number of serves in tennis that end by an unforced error, the rates are 30.3% and 32.9% on the ATP and WTA tours, respectively.
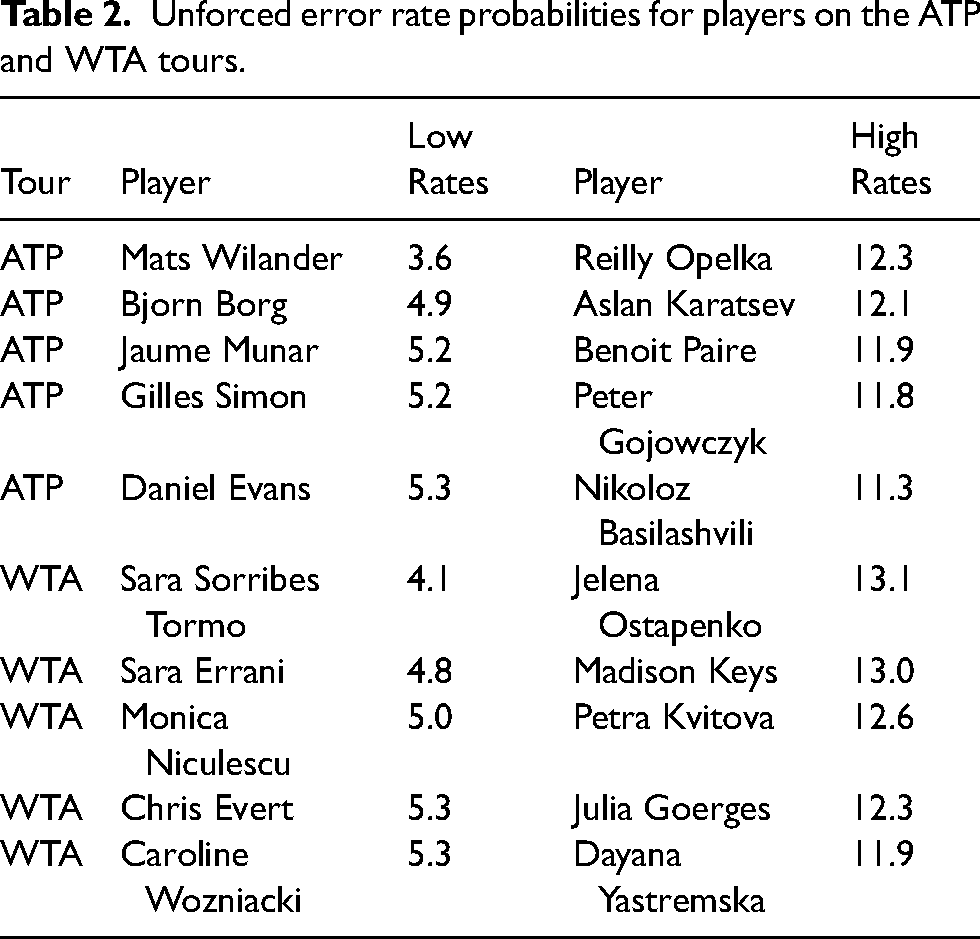
In Table 2, we provide the five players with the lowest unforced error rates and the five players with the highest unforced error rates. This is done for both the ATP and WTA tours. On the ATP tour, we observe that the five players with the highest unforced error rates have not experienced great success. On the other hand, we observe that five players with the lowest unforced error rates include some famous players including Mats Wilander and Bjorn Borg. We also note that Rafael Nadal has the sixth lowest unforced error rate of 5.4%. This provides evidence concerning the importance of minimizing unforced errors. Furthermore, amongst the 153 players in the ATP dataset, the 16 players with the most matches all had unforced error rates less than 8.2%. If a player has played a lot of matches, then they have experienced sustained success. This again emphasizes that low unforced error rates are related to success. The same general patterns are observed on the WTA tour where prominent players Chris Evert and Caroline Wozniacki appear on the low rate list.
Unforced error rate probabilities for players on the ATP and WTA tours.
Extending the analysis in Table 2, Figure 2 provides scatterplots of the rate of winning matches versus the unforced error rate. This is done for both the ATP and WTA tours where we have restricted attention to players that have played at least 10 matches. Our intuition was that forced error rates would be negatively associated with winning. However, the association is not pronounced, where the sample correlations are
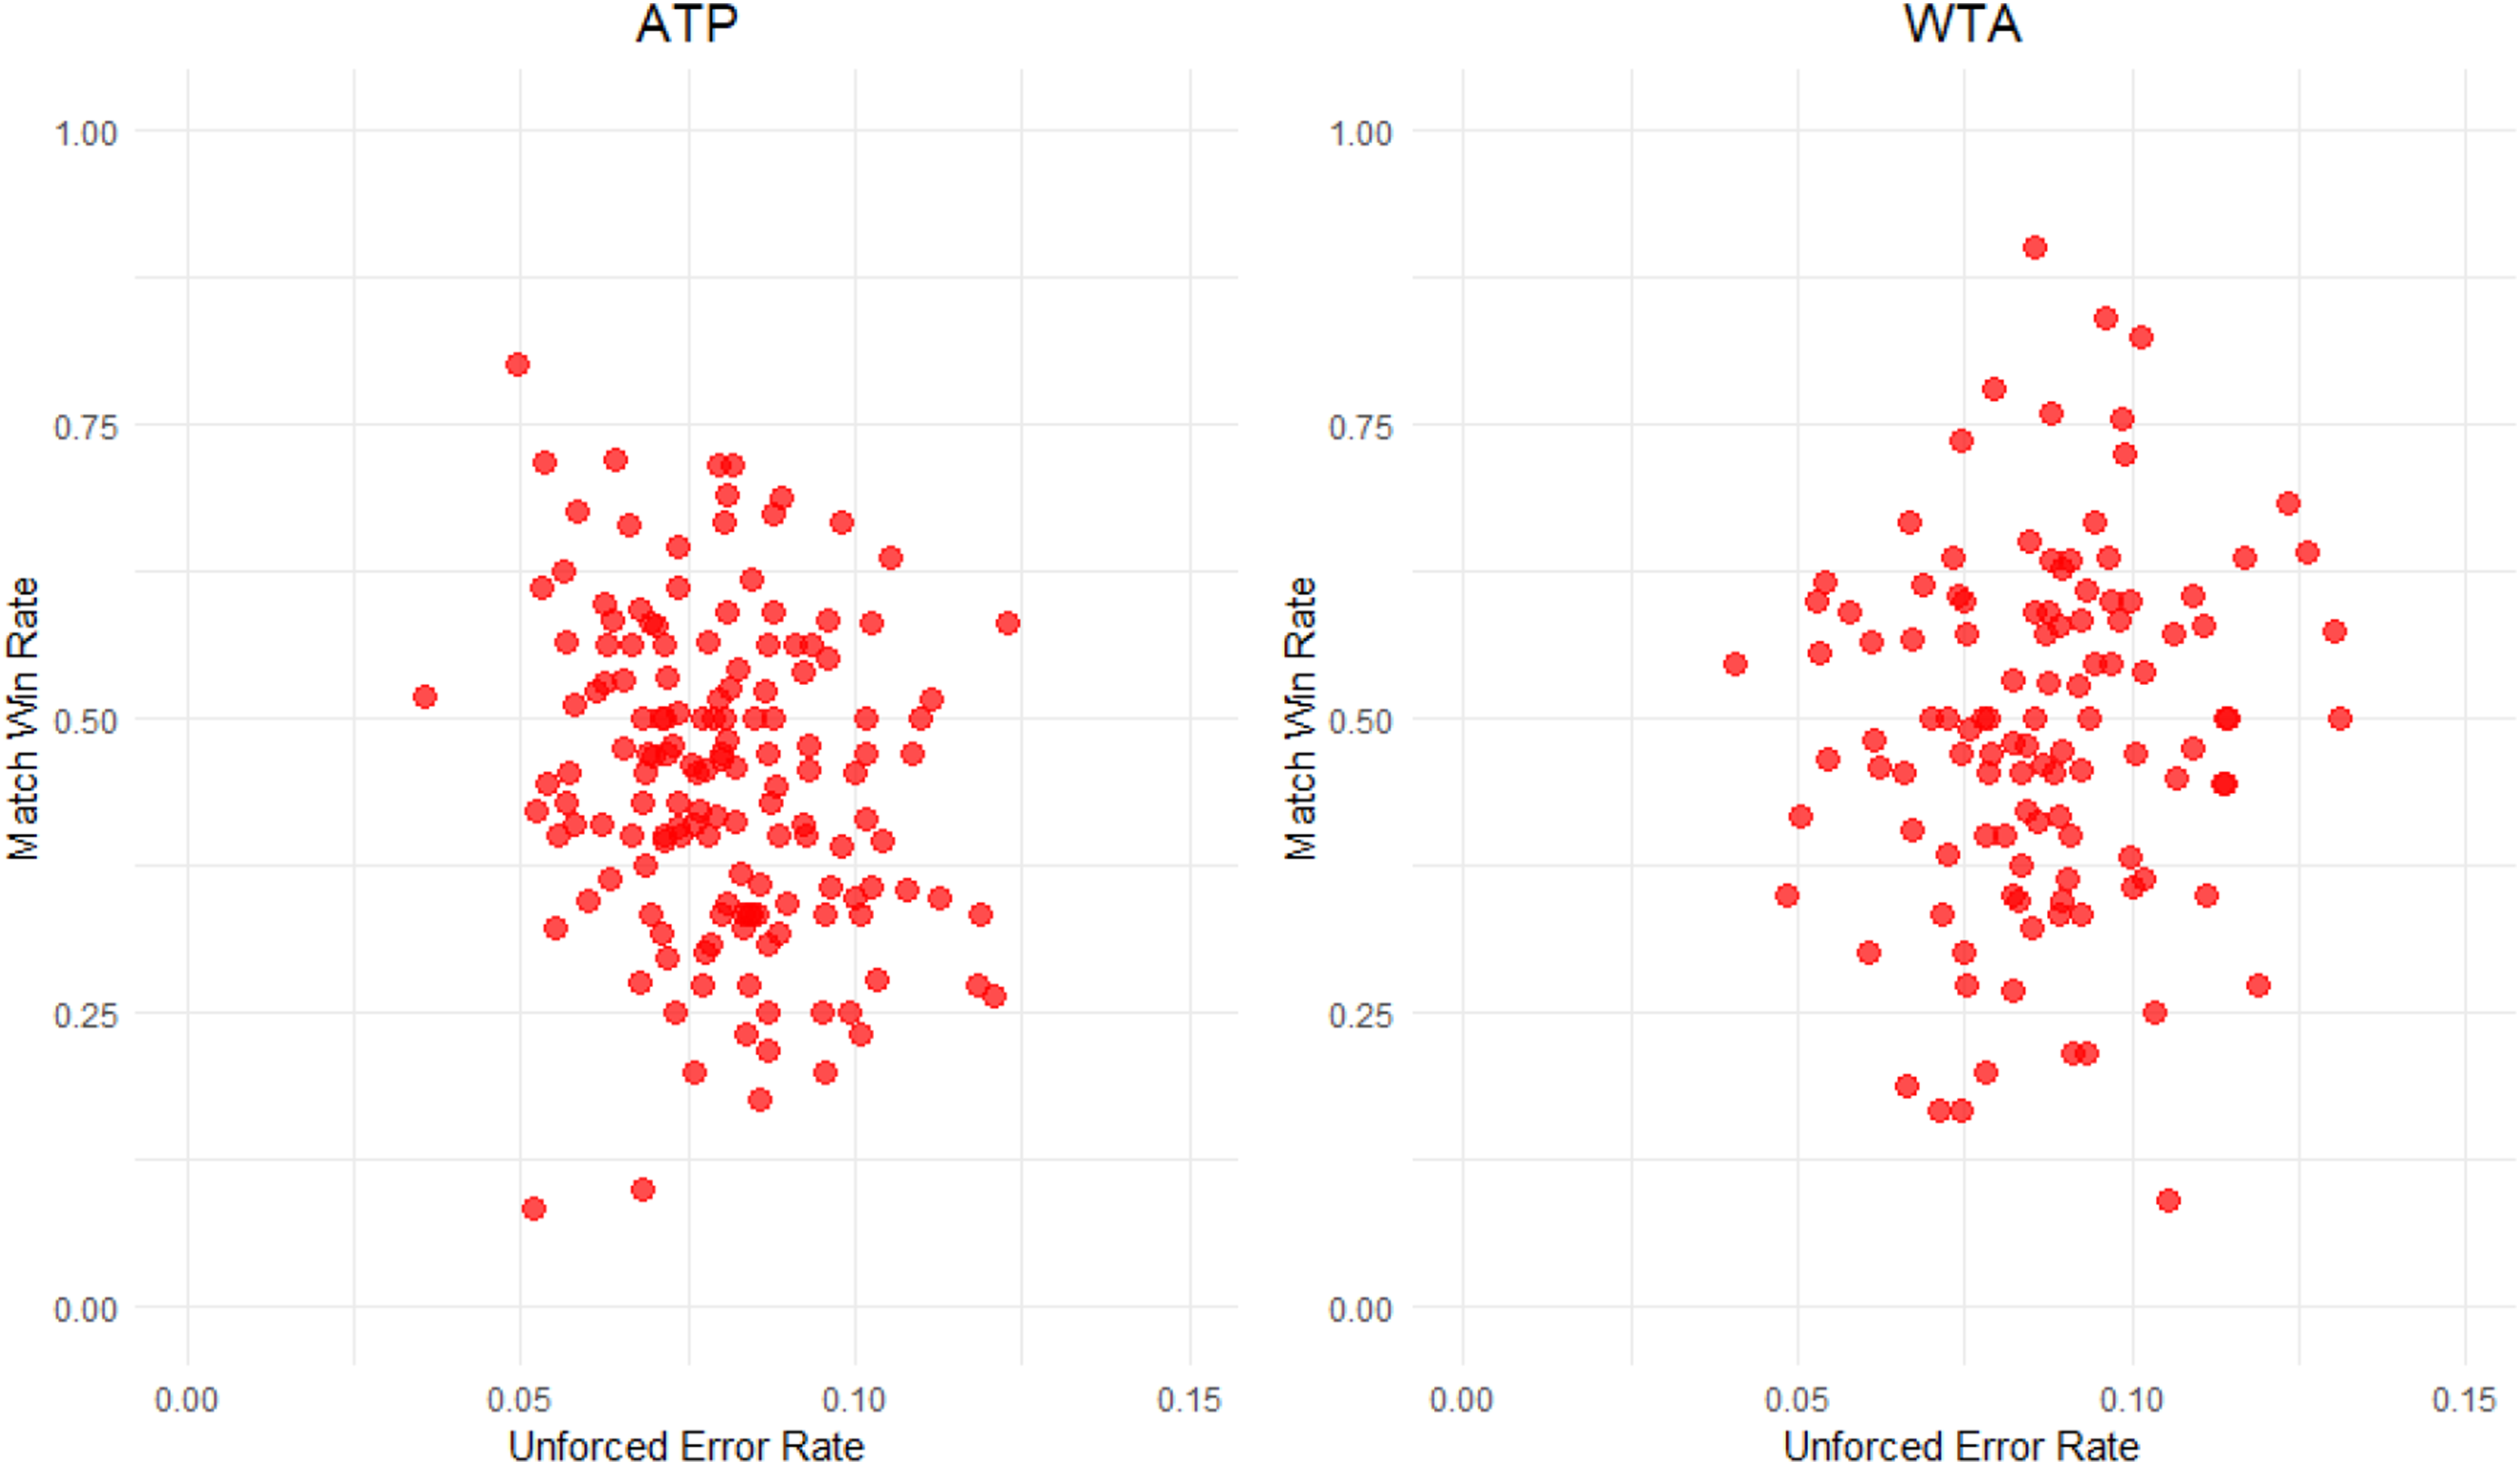
Scatterplots of match win rate versus the unforced error rate.
It is possible that there may be a tradeoff between unforced error rate and aggressive play. Accordingly, some investigators are interested in the difference between the rate of hitting winners (i.e. shots that result in points that are not touched by the opponent) and the unforced error rate against the match win rate. The associated scatterplots are given in Figure 3. The rate of hitting winners is obtained by taking the number of winners hit by a player and dividing by their total number of shots. This is done for both the ATP and WTA tours where we have restricted attention to players that have played at least 10 matches. We observe that there is a pattern whereby the larger the difference between hitting winners and committing an unforced error, the greater the rate of winning matches.
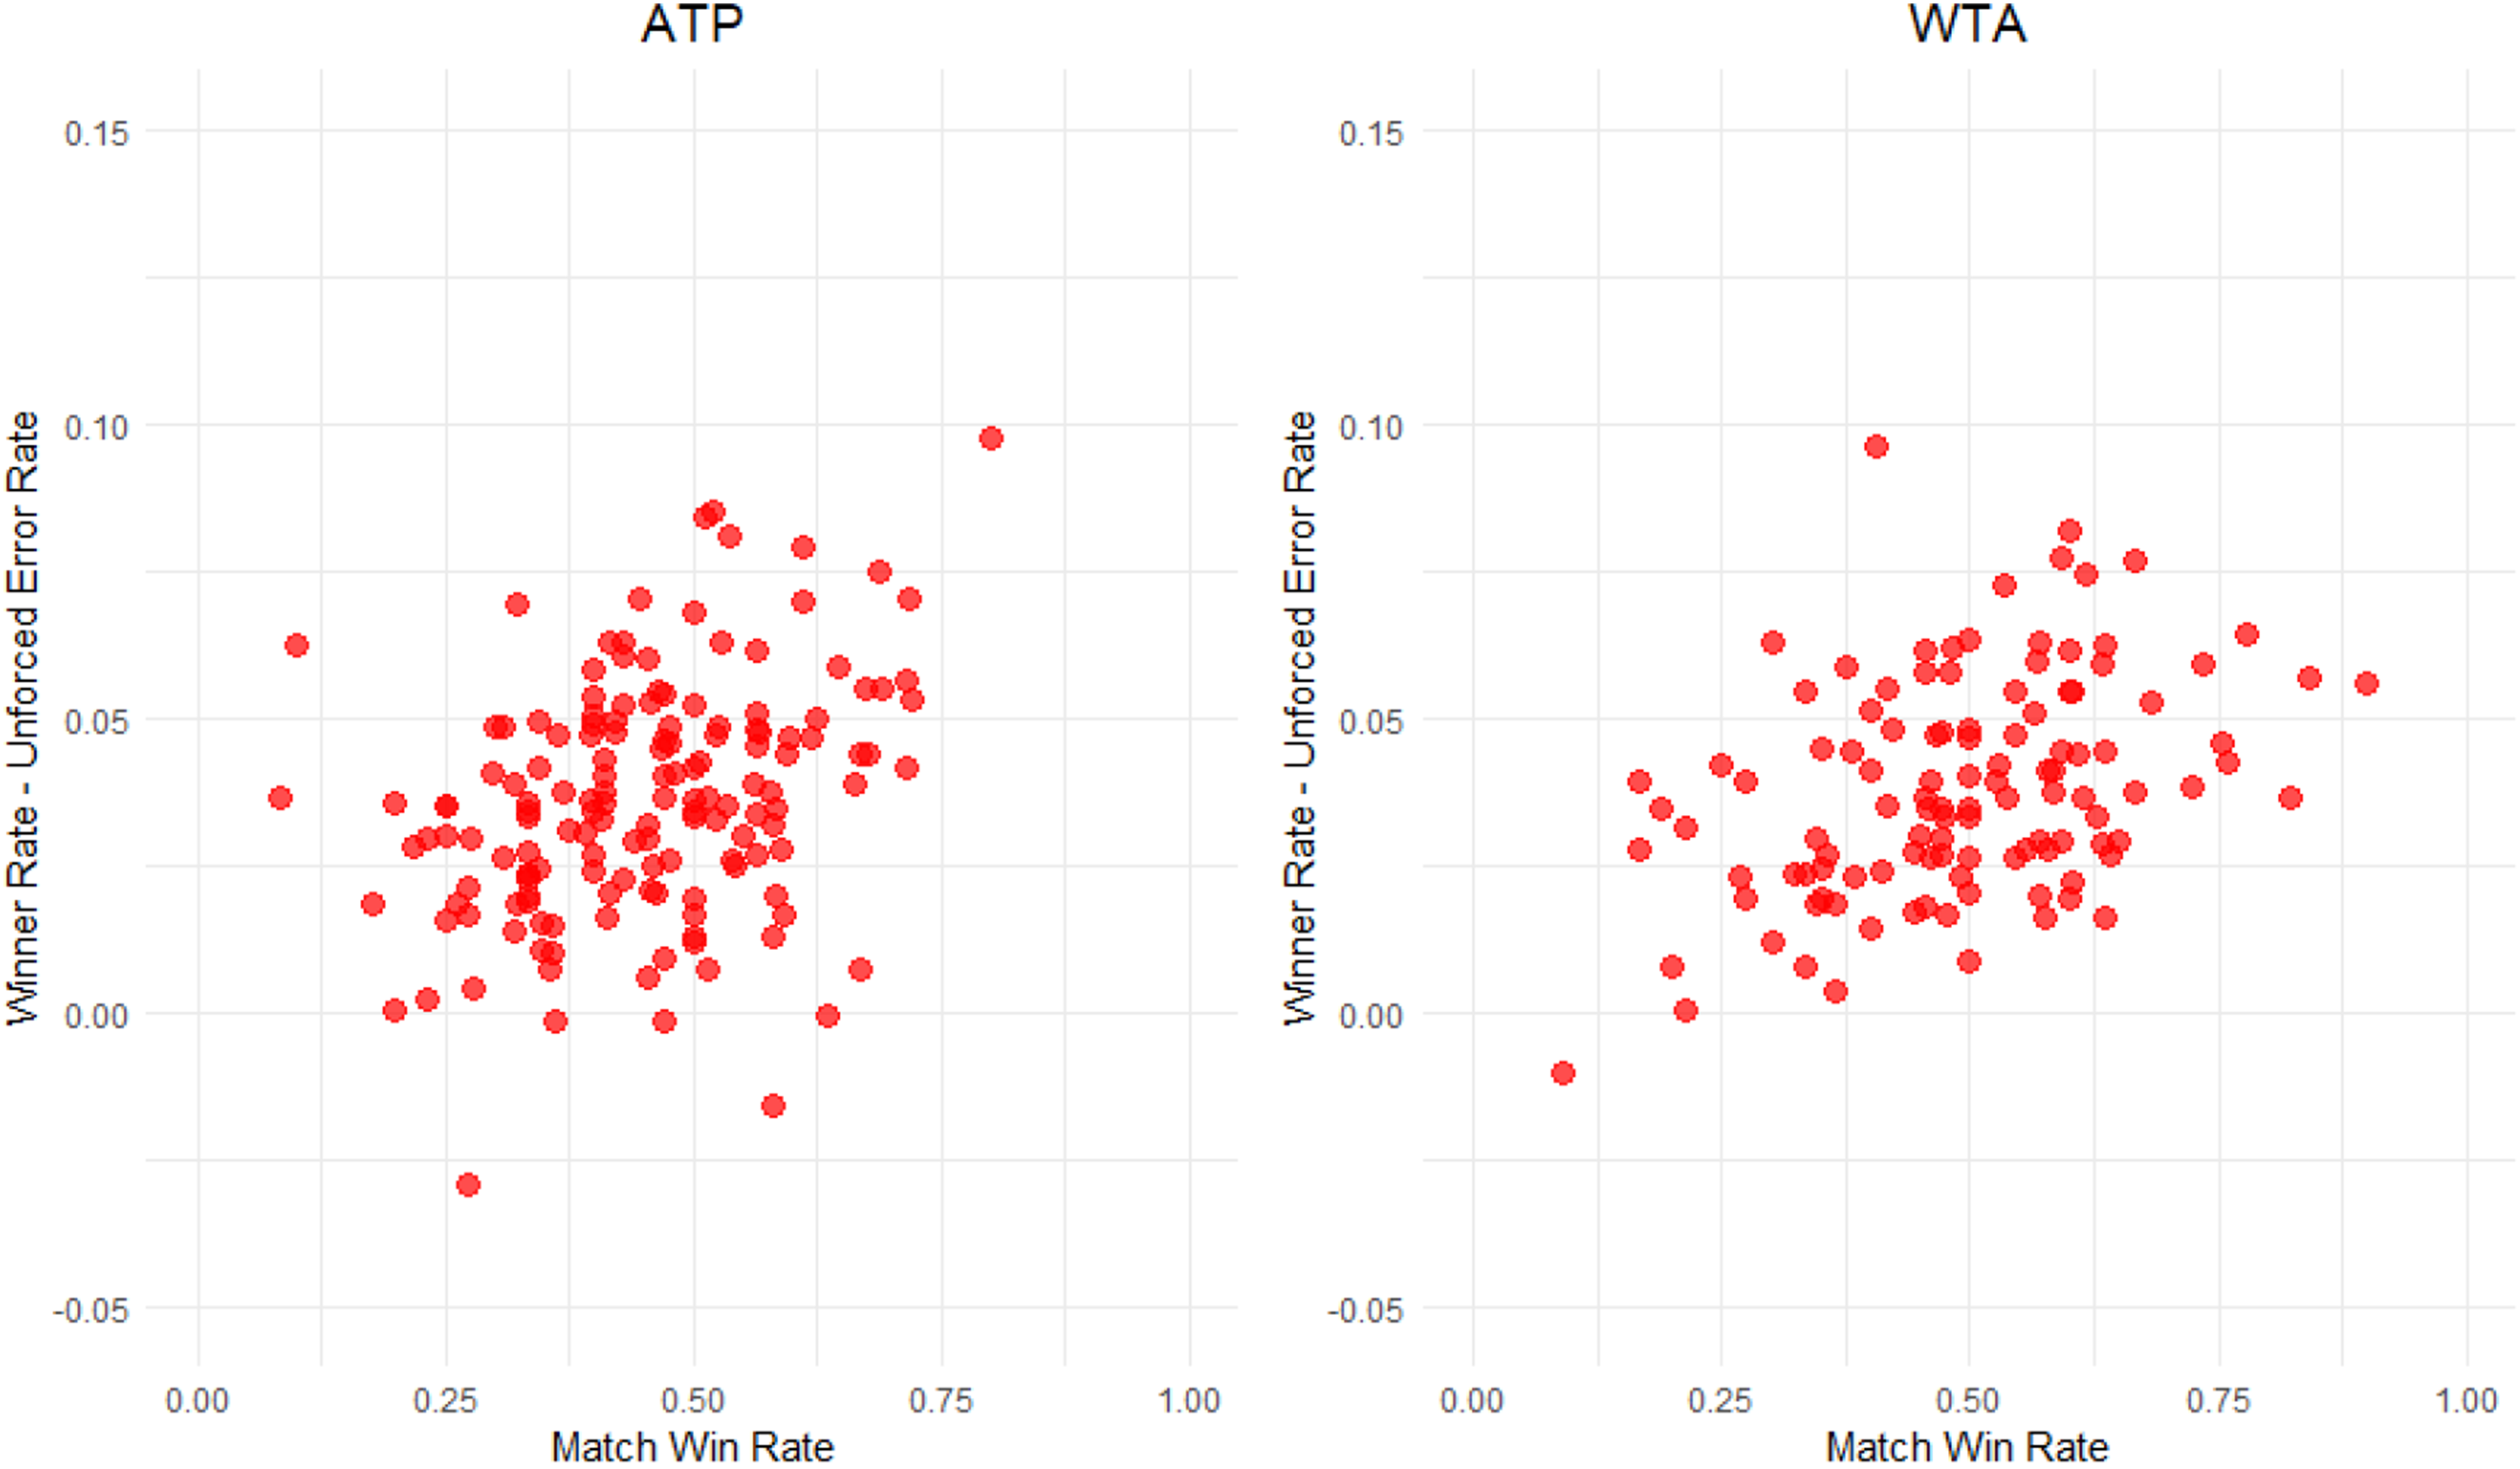
Scatterplots of winner rate less unforced error rate versus match win rate.
To investigate the tradeoff between unforced errors and aggression further, Figure 4 provides scatterplots the rate of hitting winners versus the unforced error rate. We observe interesting patterns whereby the correlation on the ATP tour is 0.14 and the correlation on the WTA tour is 0.53. For the WTA tour, there is a strong suggestion (p-value
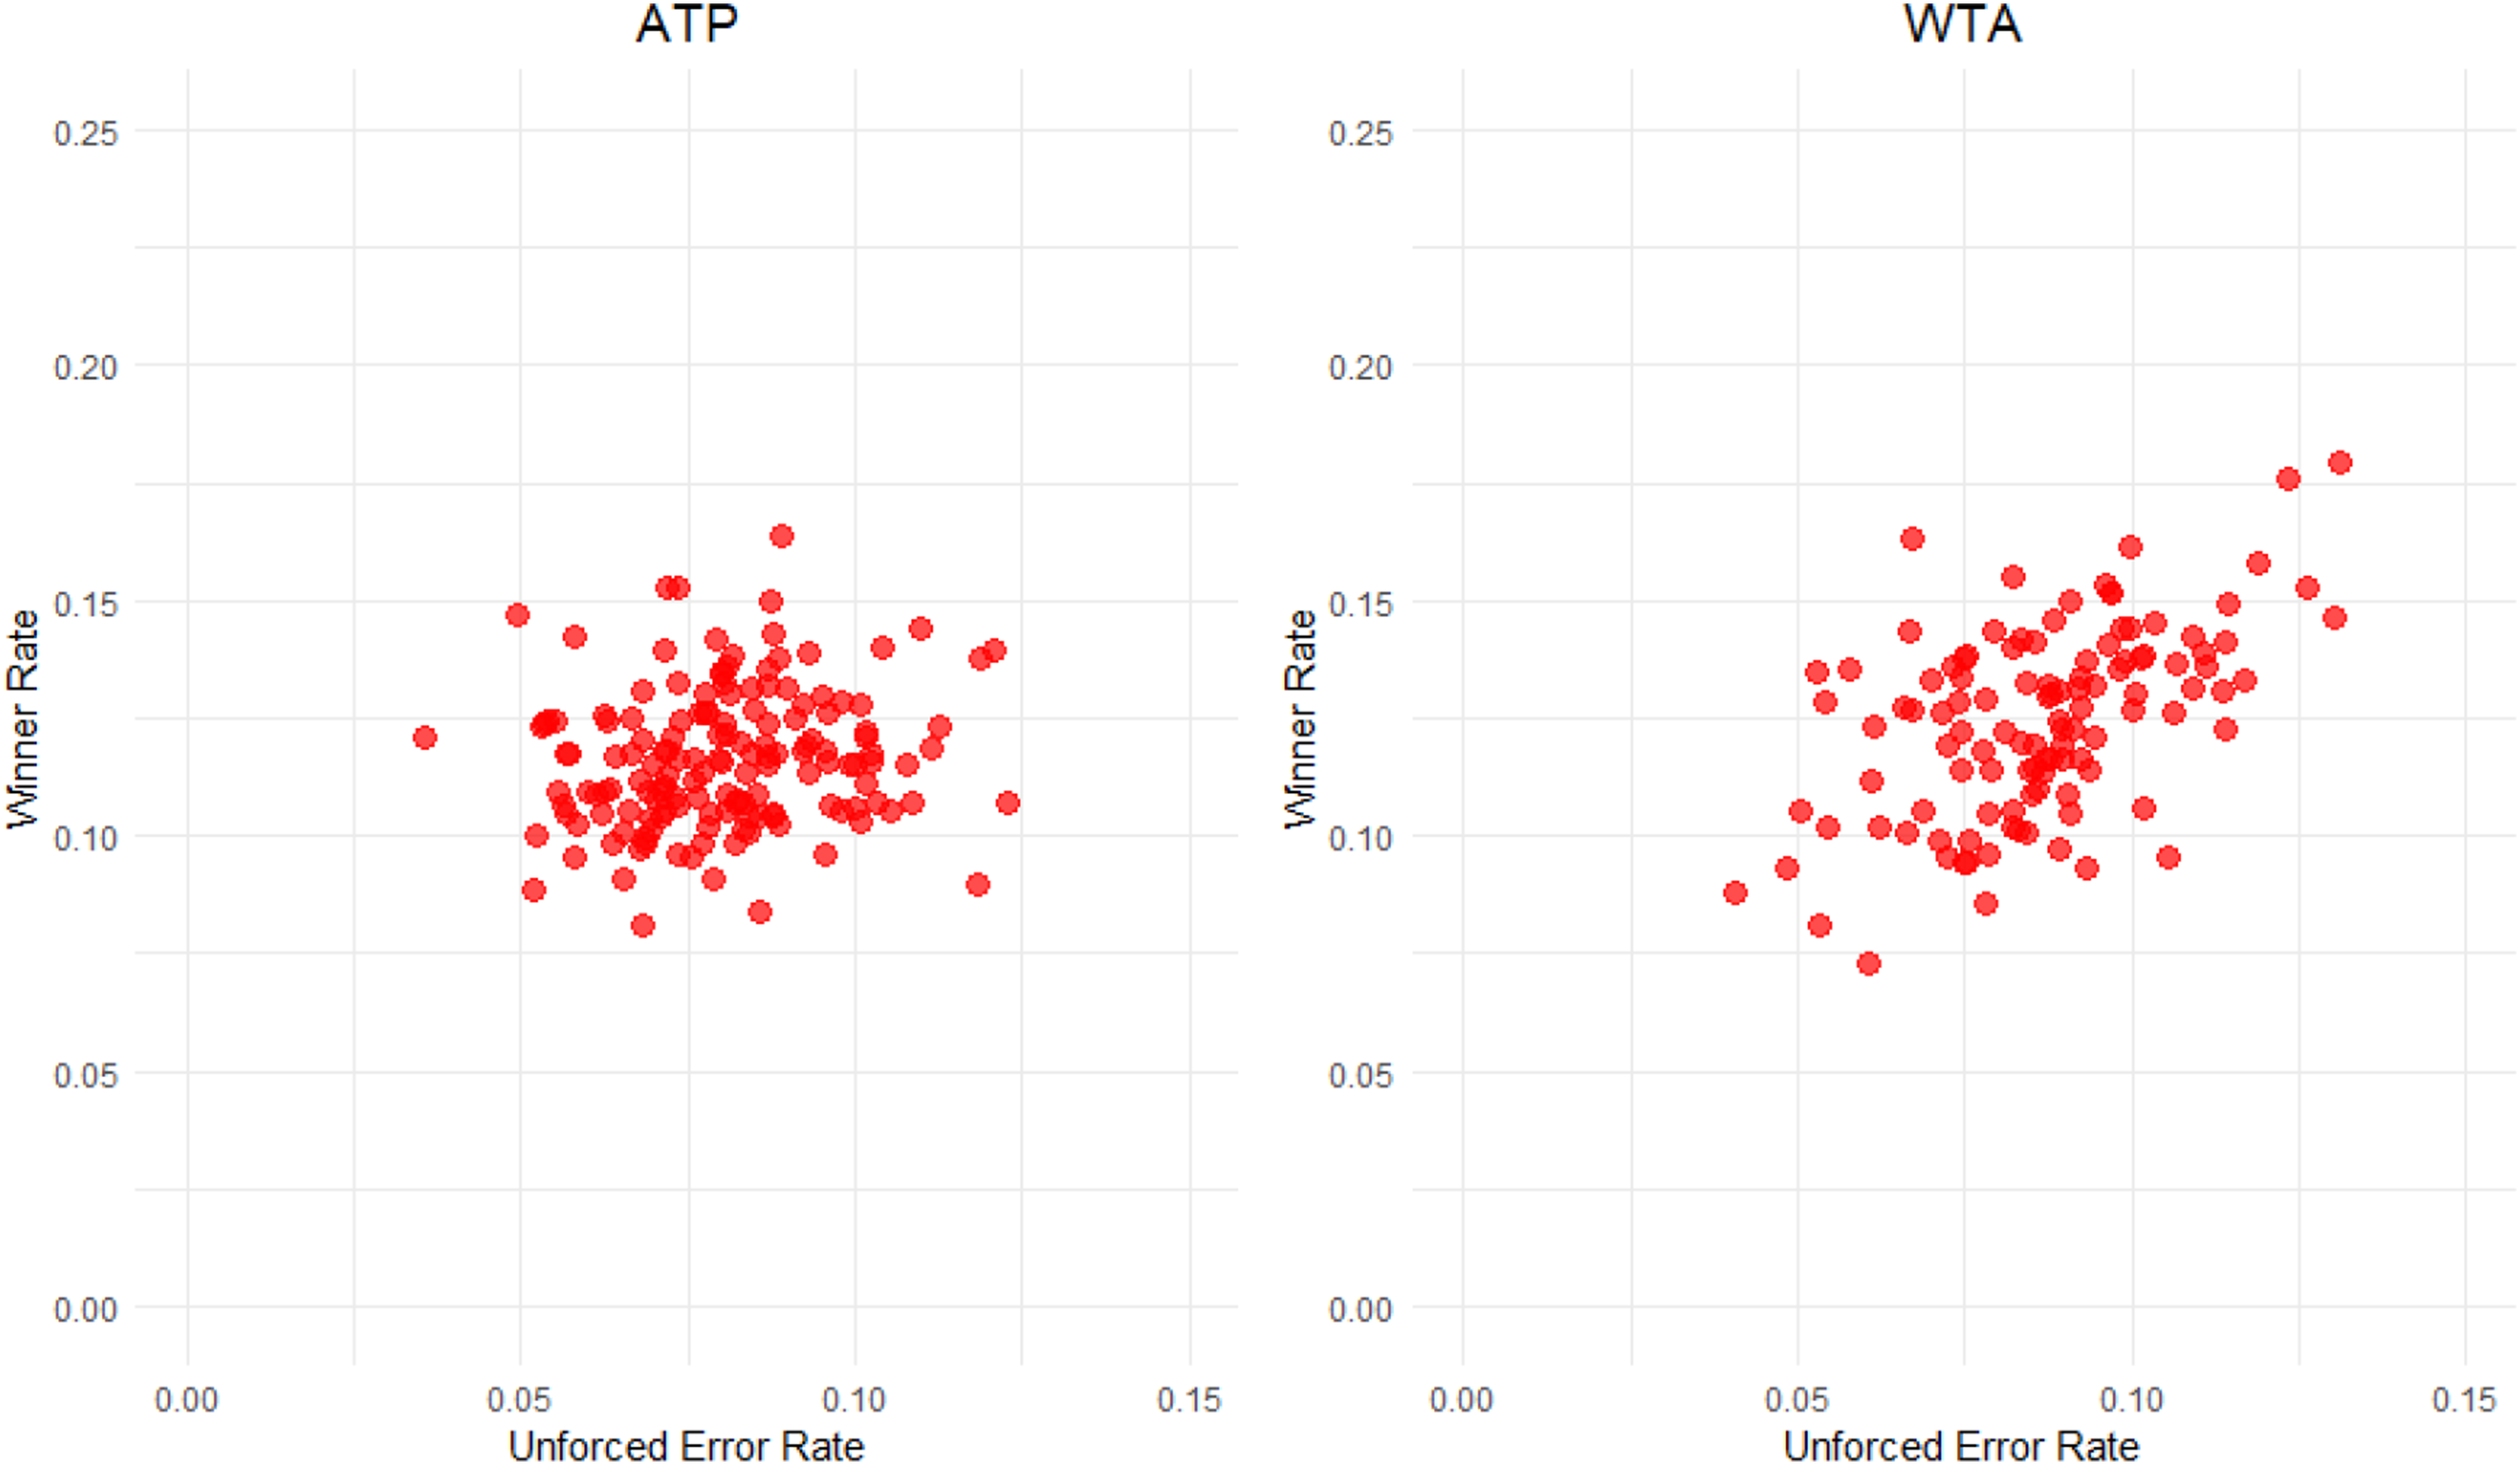
Scatterplots of the winner rate versus the unforced error rate.
We know that there are different issues in tennis with respect to the touch number. For example, with “big” (powerful) servers, touch
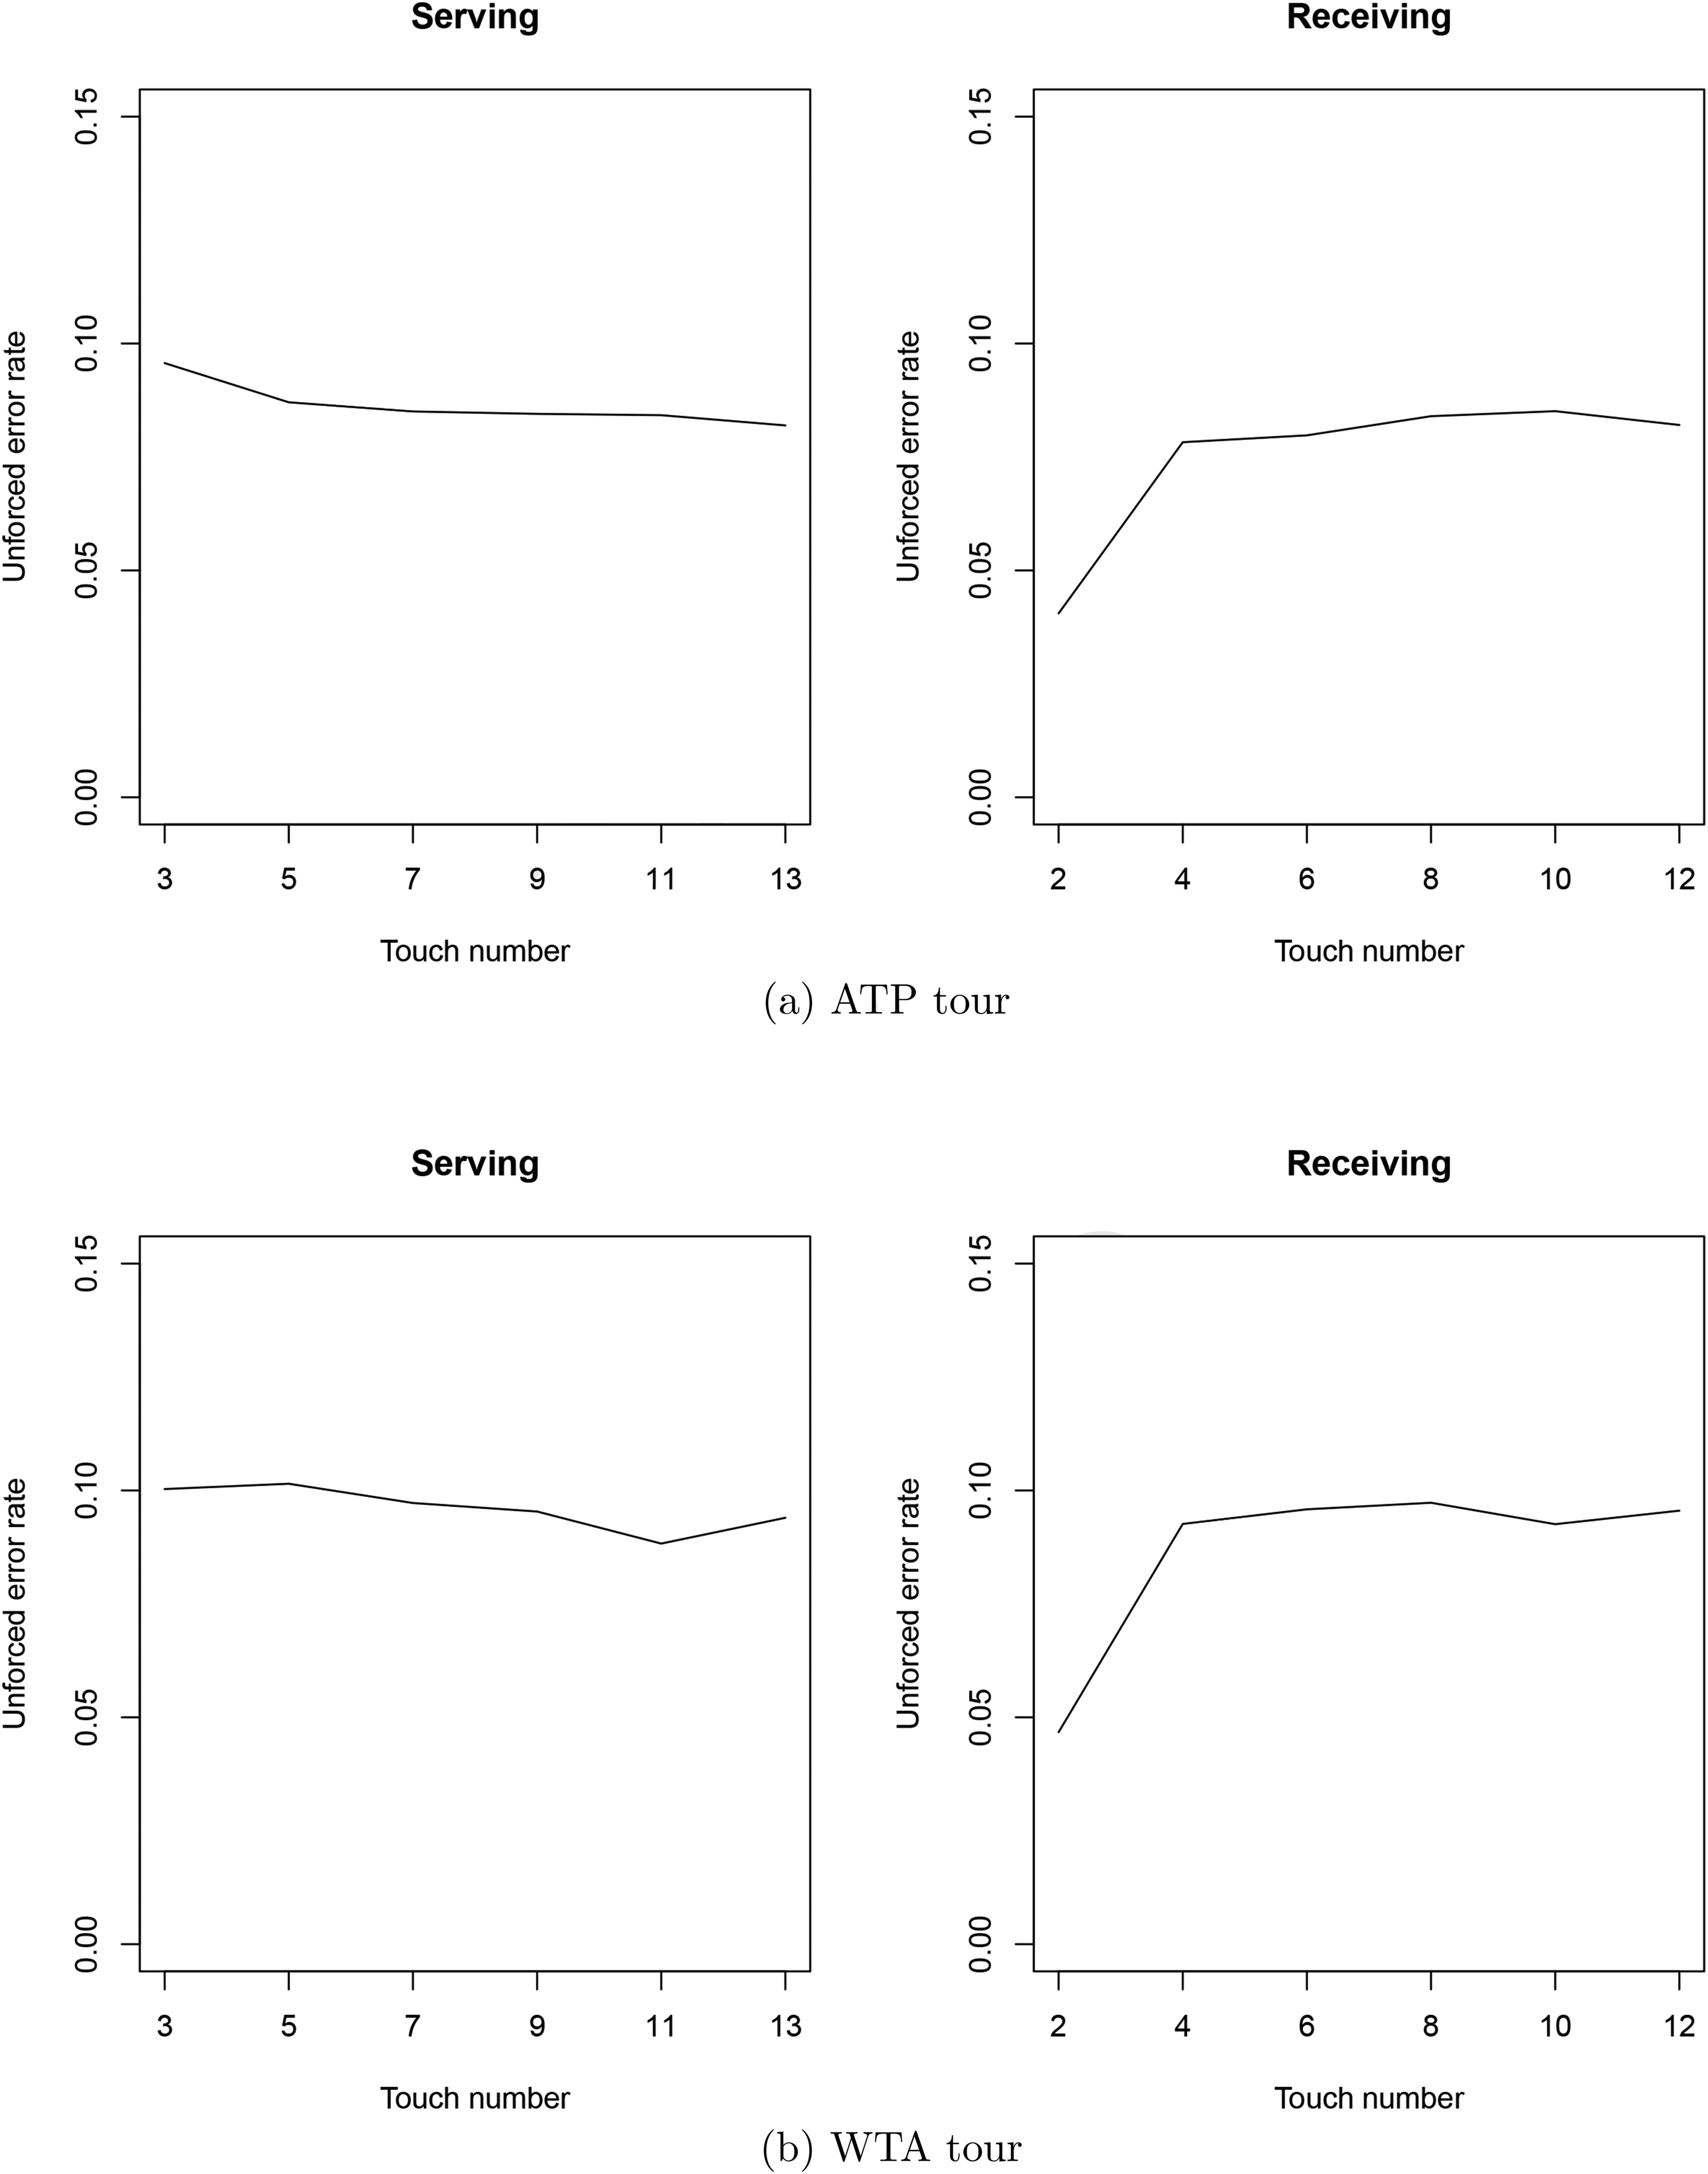
Unforced error rates on the ATP and WTA tours with respect to touch number. (a) ATP tour; (b) WTA tour.
It is also interesting to investigate how the game has changed with respect to unforced errors. In Figure 6, we plot the unforced error rates in the ATP and WTA tours versus year. We observe that the unforced error rate has gradually increased over time in both the men’s and women’s games. We do not have a definitive explanation for this. One conjecture relates to technological changes in tennis, especially relating to racquets. With such advances, there has been an increase in the speed of the game. This may make it more difficult to keep the ball in play, and consequently increase unforced errors. Another possibility is that the game of tennis is evolving, and that increased unforced error rates are a consequence of movement towards optimal play that involves more risks.
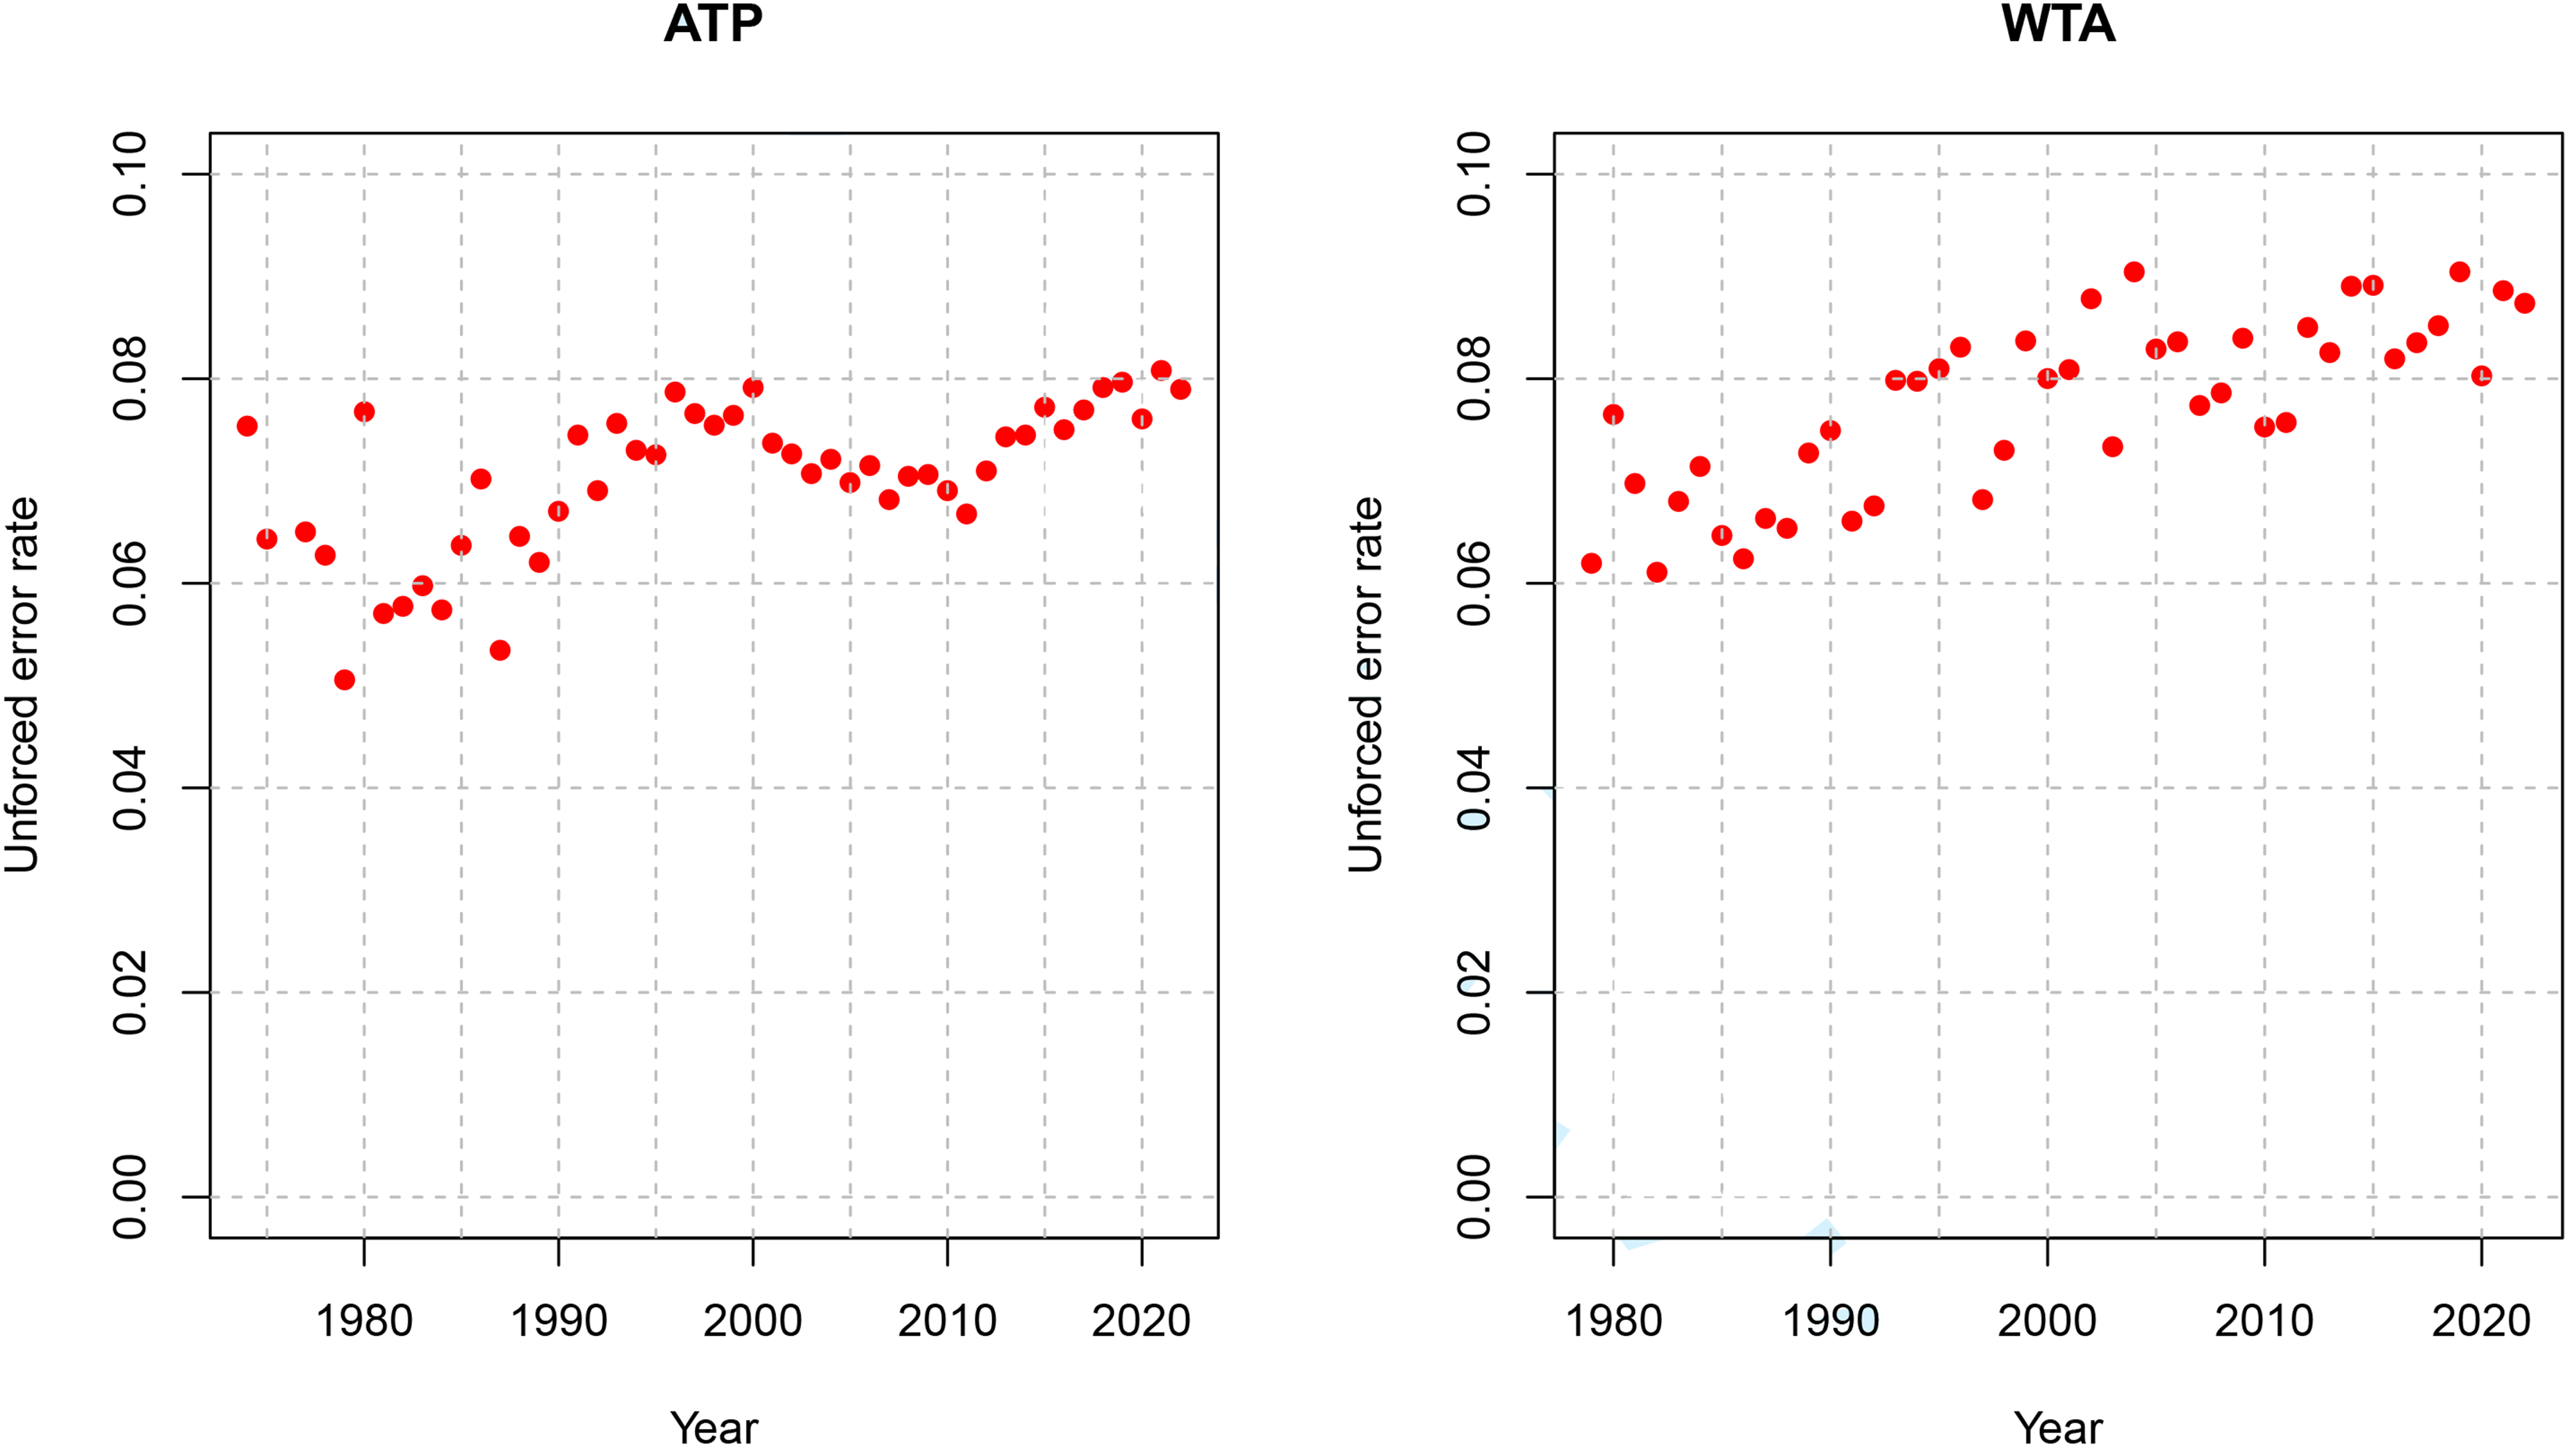
Unforced error rates on the ATP and WTA tours over time.
Bootstrapping investigation
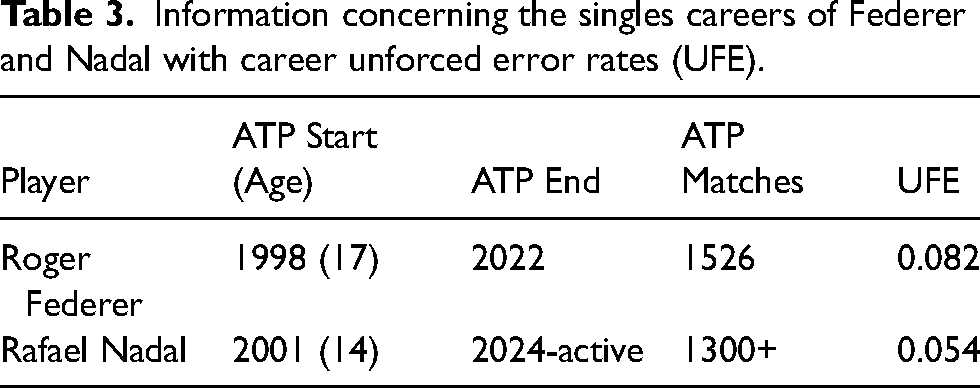
We now illustrate the proposed methods by considering two prominent players, Roger Federer and Rafael Nadal. They have enjoyed an intense rivalry, beginning in 2004, and have played against one another in 9 Grand Slam finals. In Table 3, we provide some descriptive comparisons of the two players. In comparison with Figure 1, we note that Federer’s career unforced error rate of 8.2% is about average for an ATP player whereas Nadal’s rate of 5.4% is extremely low. We note that Nadal has made tentative plans to retire in 2025.
Information concerning the singles careers of Federer and Nadal with career unforced error rates (UFE).
We now carry out an analysis involving Federer and Nadal with the results shown in Table 4. We show actual results between the two players, simulated results from their historical matches, simulated results with Federer’s unforced error rate reduced by 10% and simulated results with Federer’s unforced errors eliminated (i.e. reduced by 100%). These results are based on the 35 ATP matches recorded between Federer and Nadal in our dataset. We note that official records indicate that these two players actually faced each other 40 times; hence the dataset is missing 5 matches. In their rivalry, Federer’s unforced error rate (UFE) was 8.9% and Nadal’s UFE was 5.7%. These interpersonal rates are slightly higher than their career rates of 8.2% and 5.4%, respectively. Also, for simulated match results, a win is defined as the first player to have won two sets. The results in Table 4 are based on simulations from
Federer percentage results against Nadal under various scenarios. Bootstrap standard errors are given in parentheses.
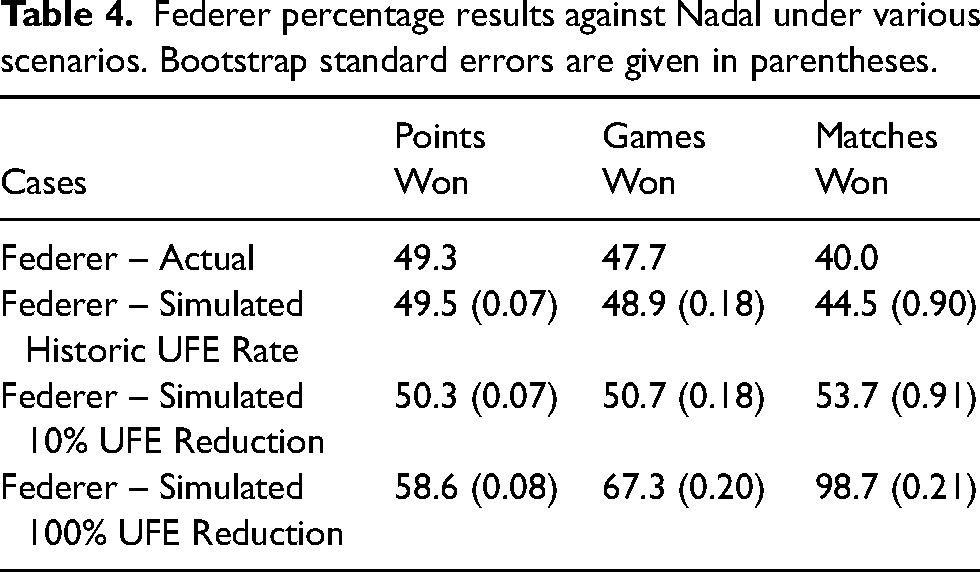
From Table 4, in actual competitions, we observe that Federer won 49.3% of the points against Nadal, demonstrating the competitiveness of the matches. However, at the match level, Federer won only 16 of the 40 matches, i.e. only 40% of the time. This demonstrates something about Nadal’s ability to come through in clutch situations. This is further confirmed by Federer’s simulation match results that are better than his actual match results. The results also demonstrate that small advantages in the probability of winning a point propagate to larger match winning probabilities. We have confidence in the simulation results since the differences between Federer’s actual points won and simulated points won is minor. Most importantly for this investigation, we quantify the extent to which Federer’s unforced errors impacted his results against Nadal Had Federer been able to reduce his unforced error rate by even a small margin (10%), his match results would have increased substantially to 53.7%, placing him above Nadal. And as an upper bound for improvement, we consider the unrealistic simulation case where Federer eliminated all unforced errors. In this scenario (ii), Federer would have been completely dominant. This exercise illustrates the critical impact of unforced errors in tennis. Recall again the important caveat recorded at the end of Section “Methods” whereby a reduction in the rate of Federer’s unforced errors assumes that he retains the same level and style of play. In this context, Federer’s hypothesized improvement due to a reduction in unforced errors may be better viewed as potential improvement.
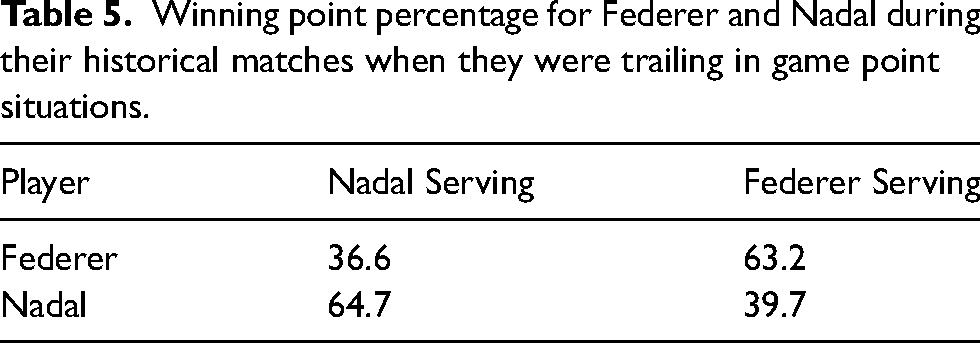
The speculation regarding the performance of Federer and Nadal in clutch situations suggests a deeper dive into the data. In Table 5, we consider all the results between Federer and Nadal in game point situations. These are not the most high leverage situations in tennis but they are abundant and involve points of importance. Accordingly, we look at the percentage of points won by both players when they were trailing 40-love, 40–15, 40–30 and at Ad point. We break the analysis down further into cases where the player was either serving or receiving. As speculated, we observe that Nadal has a better rate than Federer in winning high leverage points, both when serving and when receiving.
Winning point percentage for Federer and Nadal during their historical matches when they were trailing in game point situations.
Discussion
Whereas unforced errors in tennis are a much discussed topic, the quantification of the impact of unforced errors is something that appears to be missing from the literature. This paper uses bootstrapping methods to address this novel problem. The consequent understanding of a player’s unforced error rate can then be used for player evaluation and training.
In Section “Bootstrapping investigation”, we investigated the the impact of unforced errors between two giants of men’s tennis, Roger Federer and Rafael Nadal. This was a convenient investigation since these two players had an extensive history of playing against one another, and hence, their interpersonal unforced error rates are well-assessed. In future investigations, one may wish to study individual players. In this case, one could use their performance against the field (i.e. the typical player) to assess the impact of unforced errors.
Another avenue for future investigation may involve digging deeper in the circumstances where unforced errors are committed. In live matches, unforced error rates are routinely reported, but knowing when these errors occur is relevant to performance. For example, they may occur on high or low leverage points, early or late in a rally, etc.
Footnotes
Acknowledgements
H. Peiris is a PhD candidate and T. Swartz is Professor, Department of Statistics and Actuarial Science, Simon Fraser University, 8888 University Drive, Burnaby BC, Canada V5A1S6. N. Epasinghege Dona is Senior Data Analyst, BC Health. Swartz has been partially supported by the Natural Sciences and Engineering Research Council of Canada. The work has been carried out with support from the CANSSI (Canadian Statistical Sciences Institute) Collaborative Research Team (CRT) in Sports Analytics. The authors thank three Reviewers whose comments helped improved the manuscript.
Declaration of conflicting interests
The author declared no potential conflicts of interest with respect to the research, authorship and/or publication of this article.
Funding
The author(s) received no financial support for the research, authorship, and/or publication of this article.