
Abstract
Despite increases in performance analysis research, research within British netball remains scarce. This study examined technical performance differences among Netball Super League (NSL) teams during the 2023 and 2024 seasons and assessed the progression of British netball since 2008. This study analysed 188 matches, with teams categorised by league position. Performance indicators (PIs) such as centre pass (CP) and turnover (TO) conversion, and shooting variables were assessed using inferential statistics, comparing top- and bottom-quality teams against different standards of opposition. Results indicated top-quality teams consistently outperformed bottom-quality teams in most PIs, with significant differences in CP, TO and shooting statistics. Top-quality teams converted a median of >70% for CP and TO to goal, indicating a threshold for successful performance. Additionally, there was a median performance improvement of >20% for these PIs compared to 2008 profiles. However, performance inconsistencies were observed, with large interquartile ranges in PIs, suggesting performance variability. These findings highlight improvements within British netball since 2008, aligning with research trends in offensive play dominance. As the NSL relaunches in 2025, this study establishes a benchmark for evaluating future league changes on competitiveness and consistency. Future research should explore tactical aspects of successful netball performance e.g. offensive and defensive CP strategies.
Introduction
Despite the recent increase in performance analysis research, investigations within netball remain scarce. 1 Research by Whitehead et al., 2 determined that since 1990, only 24 studies have focused on “match characteristics” in netball, and just 7 of these assessed technical and tactical aspects. This scarcity is even more prominent when examining research focused on British netball. Whitehead et al., 2 found that 54% of netball research originates from Australia, with only 19% from the UK Moreover, of the 24 studies on “match characteristics”, only one was from the UK, 3 compared to 20 from Australia. The disparity is likely due to netball being more professional (in terms of funding and spectators) in Australia than the UK, 2 and the Australian League (Suncorp Super Netball (SSN)) being ranked as the number one domestic competition. 1
When assessing technical performance in netball, previous studies have highlighted the importance of maintaining possession for successful performances.3–5 Technical performances have shown to differ depending on team and opposition quality, with Hersant and Oates 4 finding that top-quality international teams at the 2022 Commonwealth Games performed more consistently than lower-quality teams and defeated lower-quality teams by larger margins. At the domestic level, O’Donoghue et al., 3 found similar results in the British Netball Superleague, with top-half teams scoring from a similar percentage of centre passes (CP) regardless of the opposition's quality. They also found that successful teams achieved more turnovers (TO) and converted a higher percentage of TO into goals.
However, the study by O’Donoghue et al., 3 remains the only study to assess team technical performances in British domestic netball and the impact of team quality on these performances. Moreover, it is necessary to consider the development of netball as a sport since this study was conducted. According to O’Donoghue et al., 3 54.3% of CP and 50.8% of TO were converted to goals, and 75.9% of shots were scored when top-half teams played bottom-half teams. In comparison, Hersant and Oates 4 found that top international teams converted a median of 84% of CP, 84% of restart TO, and 81% of live TO to goal, and scored from 91% of shots against lower-quality opponents. Although these results are from international netball, the quality of netball performance (both domestic and international) has increased significantly. Bruce et al., 1 noted an upward trend in the number of CP receives in the ANZ Championship since 2011, indicating that teams are scoring more goals. Therefore, it is important to assess the technical performance of British netball to provide an update to performance indicator profiles within netball.
Looking ahead, England Netball has announced the relaunch of the Netball Super League (NSL) for 2025 to compete with other well-established domestic leagues (such as SSN), with the goal of making it “the most competitive, commercially vibrant, and captivating professional netball league in the world”. 6 Significant changes to the league have been confirmed, including reducing the number of teams from ten to eight, playing 50% of games in major arenas, reducing squad sizes from twelve to ten players, and increasing player salaries by an average of 60%. 7 Although currently the NSL is considered one of the premier domestic netball competitions, the average winning margin in the 2022–23 NSL season was 12.3 goals, compared to just 7.6 goals in the same season of the SSN, the lowest it has ever been. 8 It is, therefore, important to conduct an assessment of current NSL teams’ technical performances, so in the future England Netball can accurately evaluate whether the league changes have led to improved performances, and a more competitive league. Consequently, one aim of this study is to assess technical performance differences between NSL teams during all matches of the 2023 and 2024 seasons to provide current benchmark standards of technical performance within British domestic netball ahead of the NSL re-launch. This study also aims to provide an update on technical performance on KPIs within British netball since 2008.
Methods
Sample
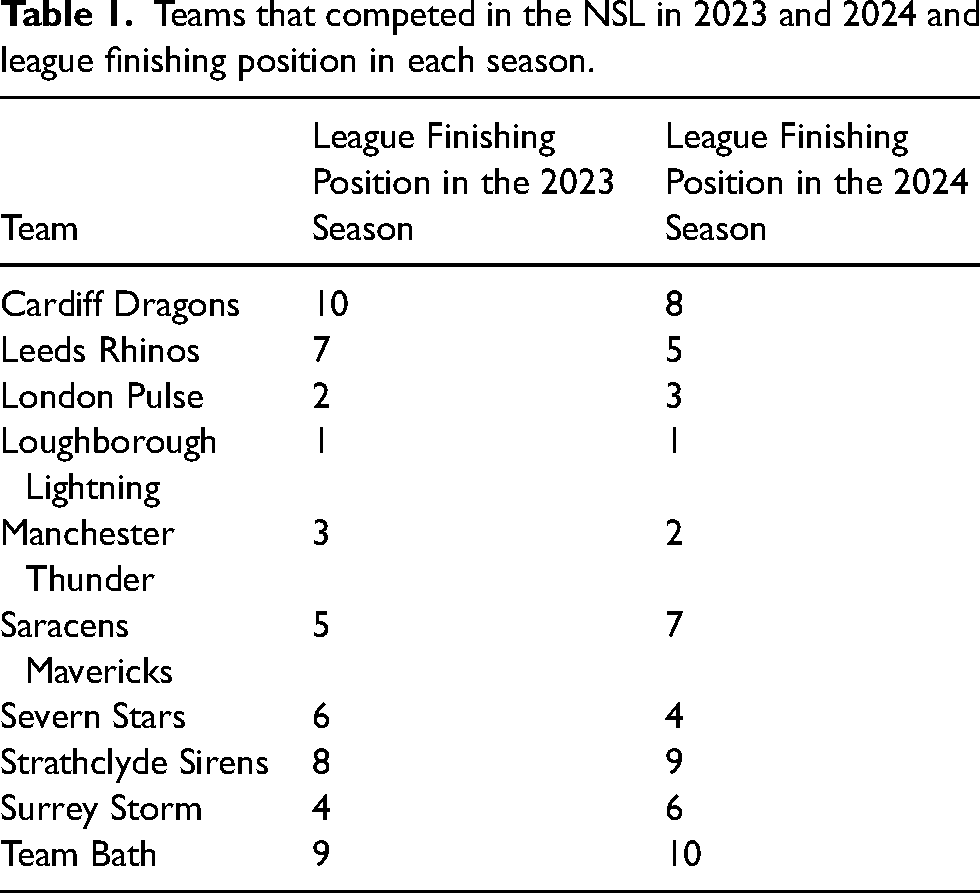
Data for this study came from the 2023 and 2024 NSL seasons, with a total of 188 fixtures included as part of the final sample, including all league and finals fixtures. A total of 10 teams competed in the NSL in 2023 and 2024 (Table 1), and during the regular season each team played each other twice (one home, one away fixture). The teams that finished in the top 4 positions in the league then competed in the semi-finals, with the two winners playing in the grand final, and the losers playing in the 3rd/4th place play-off. For this study, the teams were split into two groups based on final league position: top 4, and bottom 6. Final league positioning was used to split teams as this represents a more stable indicator of team performance.4,9 Fixtures were then split into 4 different categories based on team quality and opposition quality; top versus top (TvT), top versus bottom (TvB), bottom vs top (BvT), and bottom versus bottom (BvB) using a similar approach to Hersant and Oates 4 and O’Donoghue et al. 3
Teams that competed in the NSL in 2023 and 2024 and league finishing position in each season.
Procedure
Games were filmed and coded by each team's respective performance analyst if they were the noted home team. Match footage was then imported into Hudl SportscodeTM Pro or Elite (Hudl Sportscode, Hudl, USA) and ball possessions from centre passes and turnovers, and the percentage of these possessions that led to a goal were calculated and coded by analysts. How teams gained possession of the ball either through a Live or Restart turnover (see operational definitions) was coded, and individual shooting statistics were also coded and calculated. 4 A bespoke code window and output window devised by England Netball was used by all analysts to code and analyse fixtures and calculate statistics. After the analysis was completed, analysts were then required to upload the match footage, and coding to the England Netball Hudl Exchange which is shared by all teams. For this study, relevant data were downloaded from the Hudl exchange and were checked for errors or missing data. If any data were missing or incorrect, the fixture was re-coded post-match by one of two experienced and independent analysts (who both had 7+ years working as performance analysts in netball). Once all data was downloaded and checked, it was exported into Microsoft Excel (Microsoft, USA). Data were organised by team quality (top 4 or bottom 6), match type (TvT, TvB, BvT and BvB) and outcome (win or loss). The score at each quarter was also noted.
Operational definitions
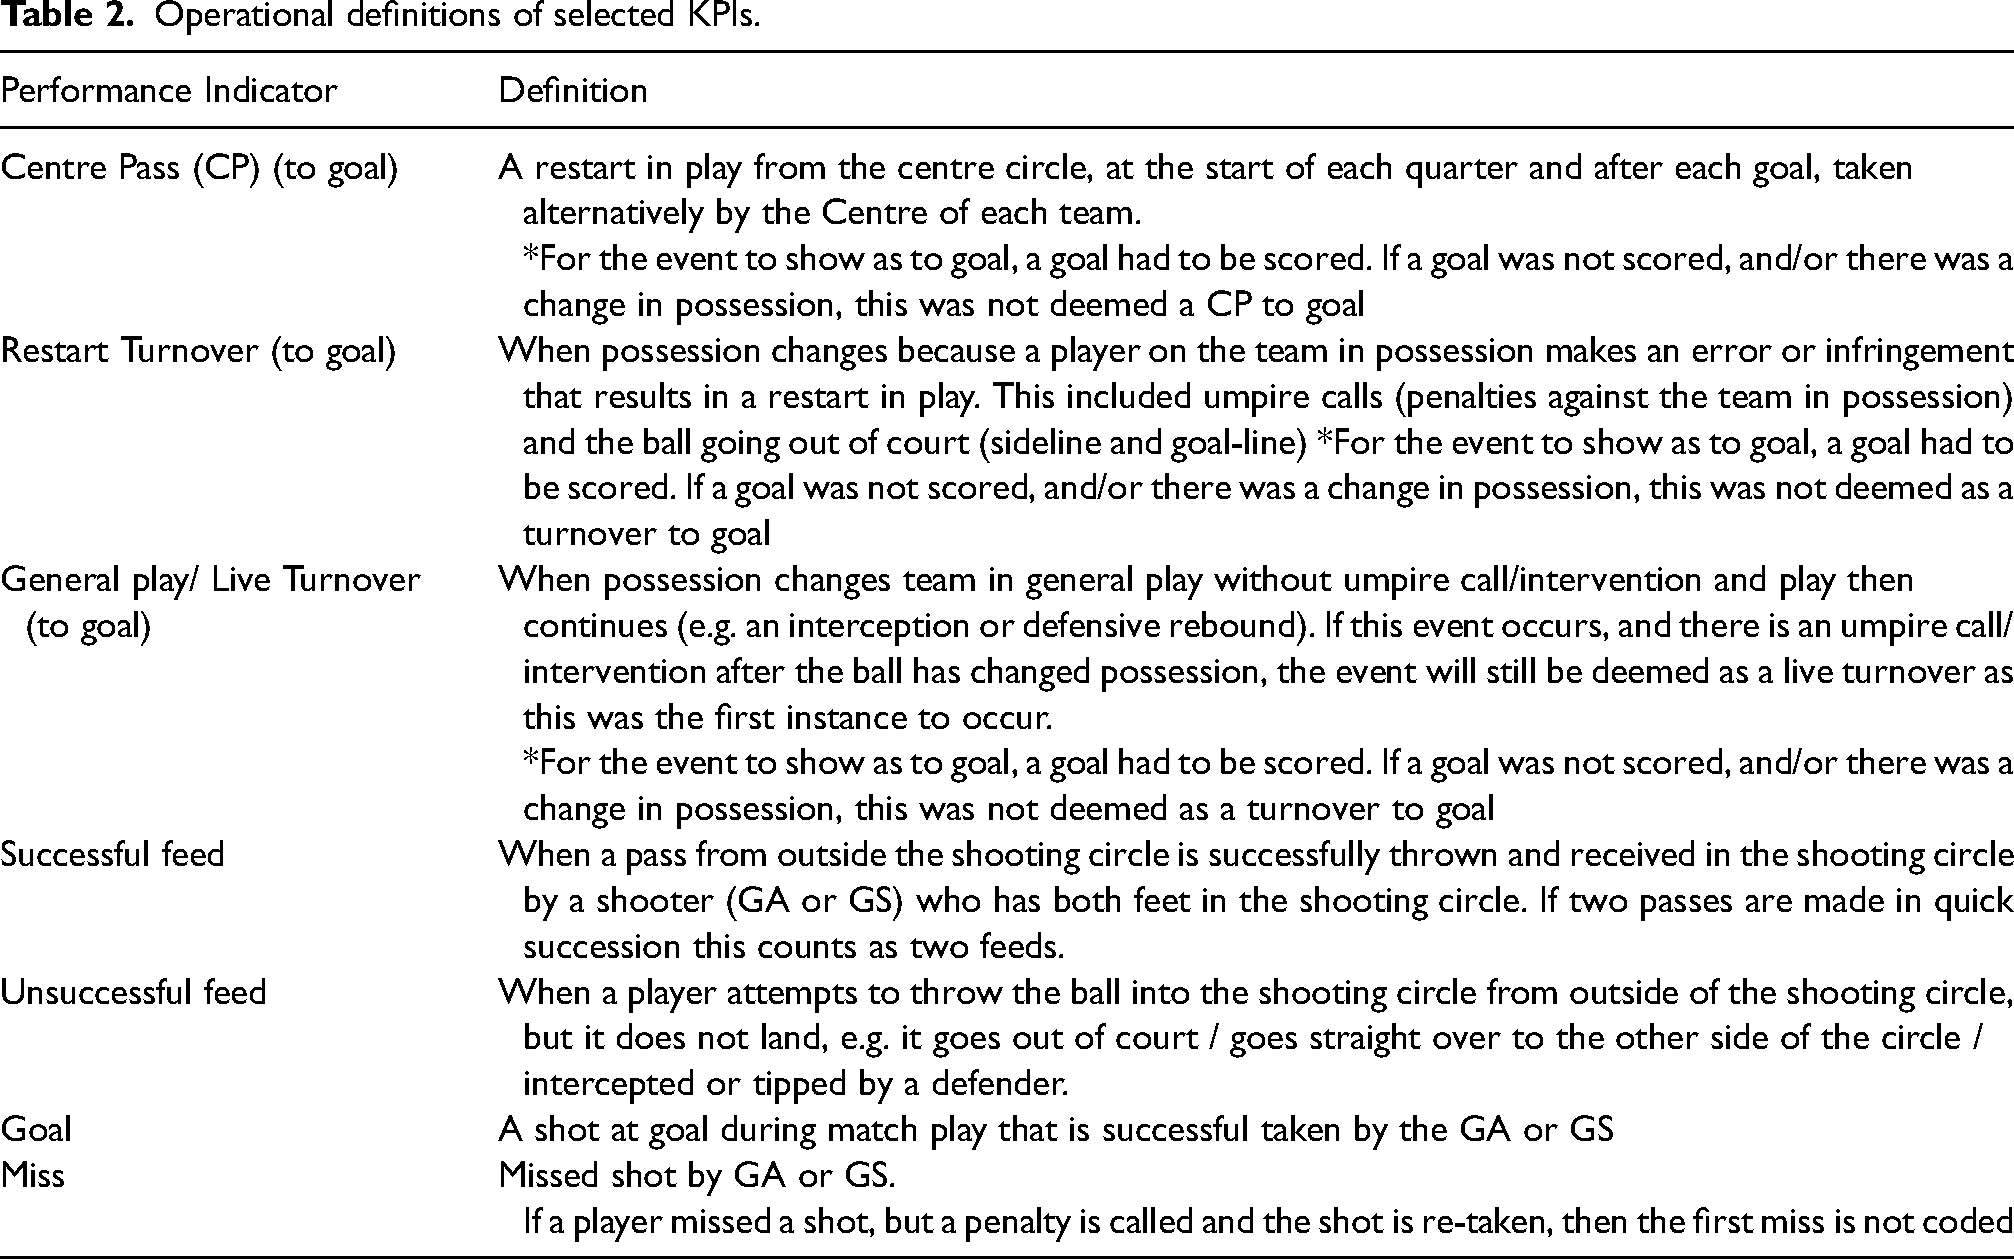
Definitions of performance indicators were taken from Hersant and Oates 4 and England Netball guidelines. Definitions are listed in Table 2.
Operational definitions of selected KPIs.
Reliability
Reliability between researchers and league analysts was tested through inter-observer techniques. This was performed by re-analysing 18 randomly selected matches (9 from each season and including a minimum of 2 matches per team to account for all other analysts in the league) to represent over 10% of the matches analysed, similar to Hersant & Oates. 4 For inter-observer testing, the matches that were selected were coded by a researcher who did not conduct the original analysis. Inter-rater reliability testing was conducted using intraclass correlation coefficient (ICC) analysis using a 2-way random effects approach. It was determined excellent inter-rater reliability between the researchers and league analysts with ICC reported as 0.908–1.000 for all variables measured. Results of the ICC testing can be found in the Supplementary Materials.
Data analysis
Data were imported into IBM SPSS Statistics (IBM SPSS Statistics 27, USA) and were tested for normality using the Shapiro-Wilk normality test. All data were deemed as non-parametric as significance values were p < 0.05 for variables and failed to satisfy assumptions of normality (p > 0.01). Data is presented as Median, with upper and lower quartiles (Q1, Q3). Descriptive statistics were also calculated for each standard of team (top and bottom) and for each match type. Mann Whitney U tests, with significance set at p ≤ 0.05, were performed on the data to determine differences between teams of different standard (top and bottom) across all fixtures, and within each standard (Top team performances (TvT and TvB) and Bottom team performances (BvT and BvB)). Cohen's D effect sizes were also calculated to assess the magnitude of the differences between groups. Effect sizes were considered to be small (d ≤ 0.2), medium (d ≤ 0.5), and large (d ≥ 0.8). 10
Results
Team quality differences
When assessing team performances, top-quality teams significantly outperformed bottom-quality teams on all indicators (p < 0.05) except the number of CP and Restart Turnover (RTO). Top-quality teams converted significantly more possession events (CP, RTO, LTO and Total TO) to goal and to shot, had significantly more shots and goals, and a higher shooting percentage than bottom-quality teams. Additionally, top-quality teams had significantly less losses in possession than bottom-quality teams. For all significant results, effect sizes were classed as small-medium (Table 3).
Median (Q1, Q3) for possession, and shooting statistics for top, and bottom teams during the 2023 and 2024 seasons in the NSL.
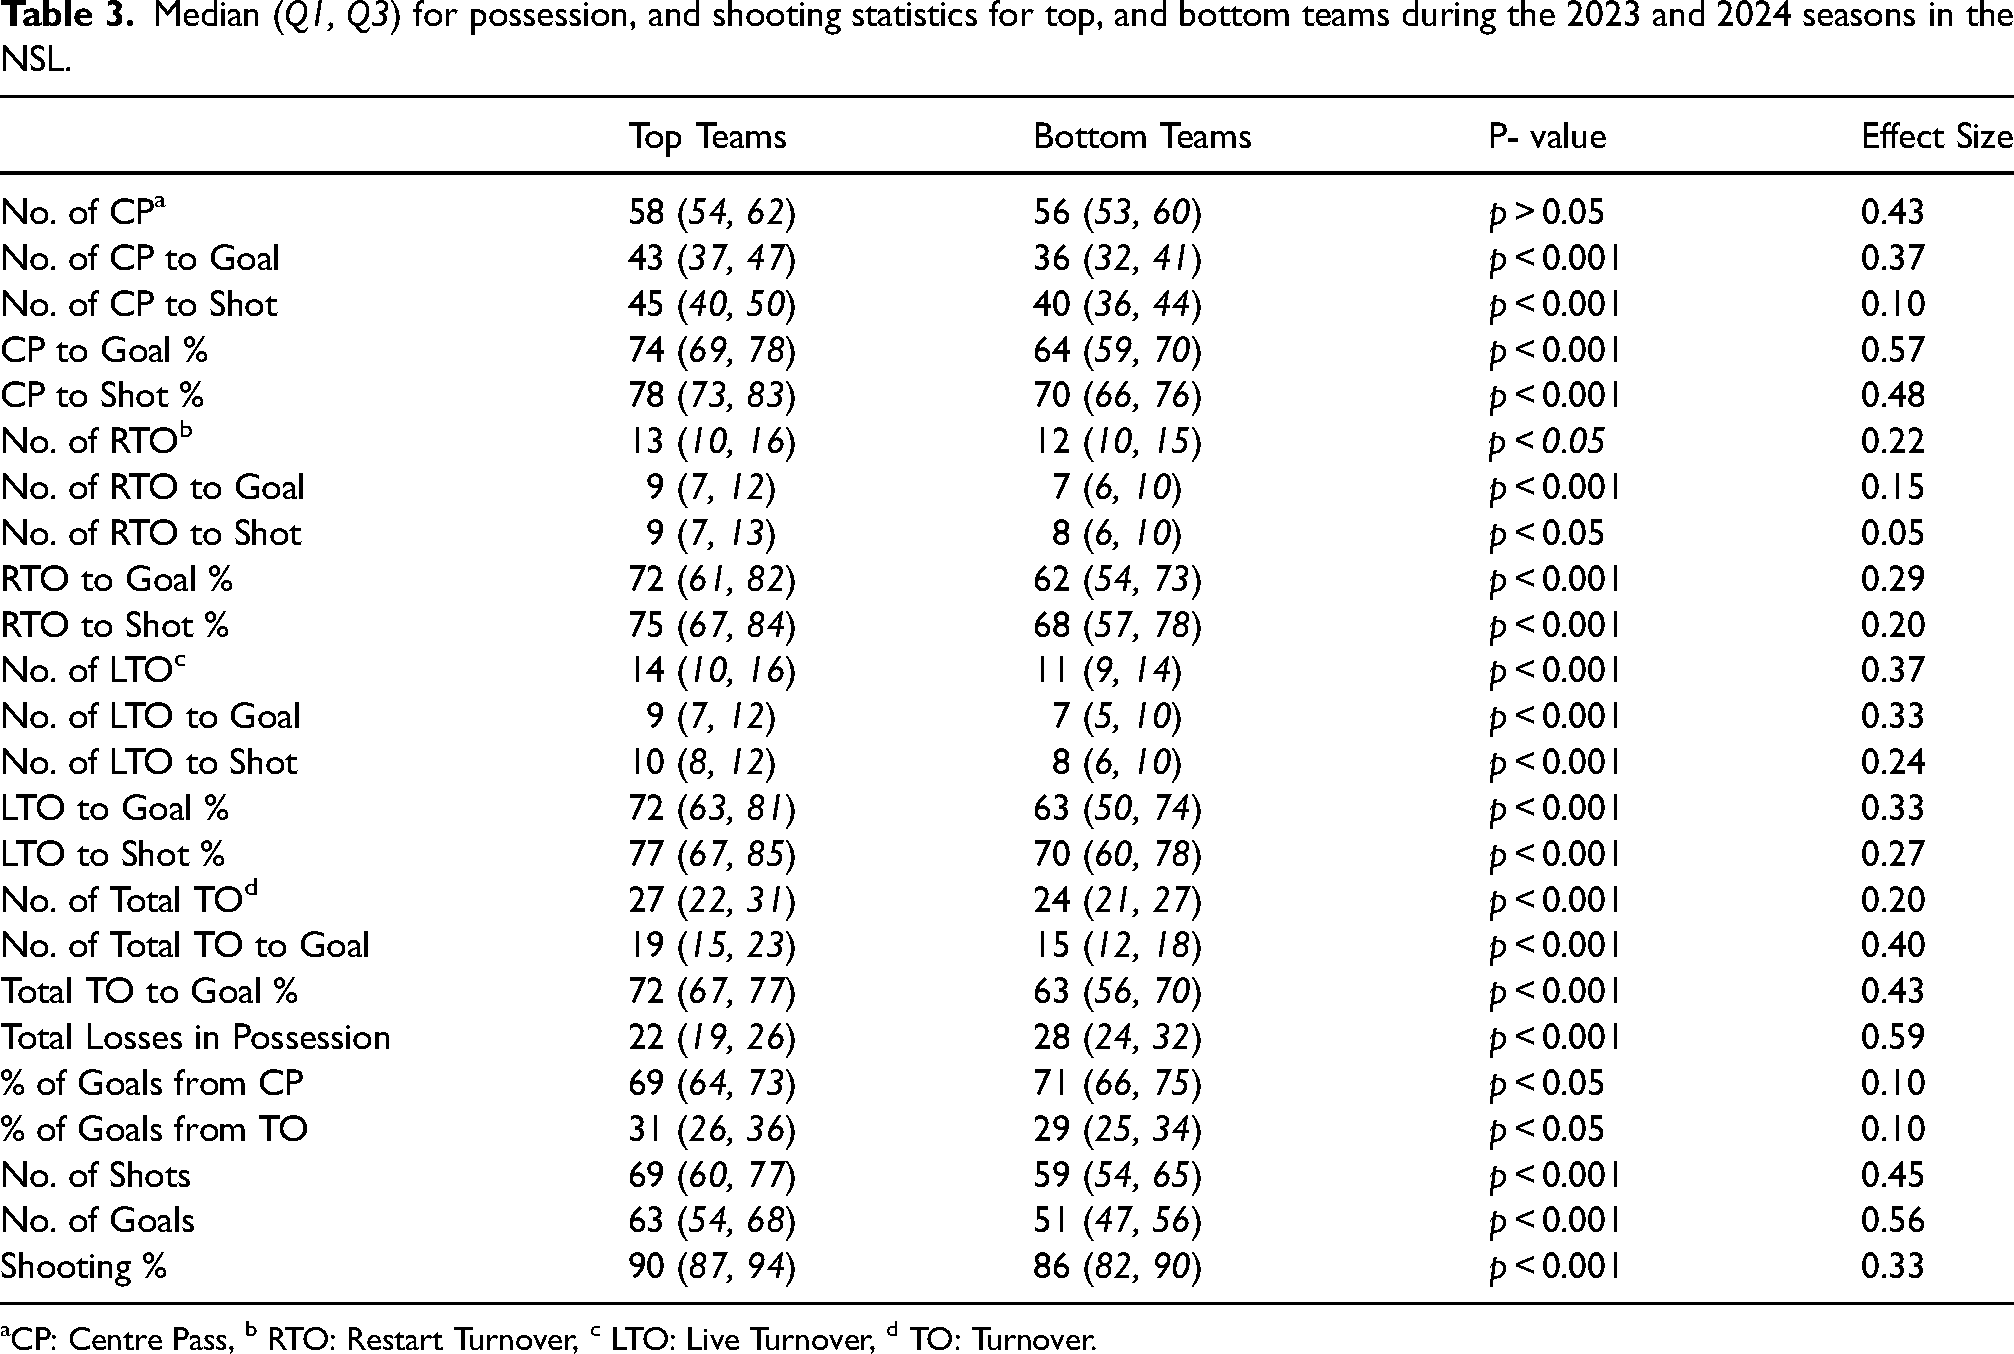
CP: Centre Pass, b RTO: Restart Turnover, c LTO: Live Turnover, d TO: Turnover.
Opposition quality
Top team performances
For CP performance, top-quality teams had significantly more, and converted more to shot and to goal when playing bottom-quality teams than when playing top-quality teams. For turnover performance, top-quality teams had significantly more RTO and Live Turnover (LTO) in total, to goal and to shot when playing bottom-quality teams than when playing top teams. However, no significant differences were revealed for the percentage of these events to goal, and the number of losses in possession. Similarly, there were significantly more total TO, total TO to goal and a higher percentage of total TO to goal for when top-quality teams played bottom-quality teams as opposed to top-quality teams. A significantly higher percentage of goals were scored from CP when playing top-quality teams as opposed to bottom-quality teams, whereas a significantly higher percentage of goals were scored from TO when playing bottom-quality teams as opposed to top-quality teams. When playing a bottom-quality opposition, top-quality teams had significantly more shots and goals than when playing top-quality opposition, however, shooting percentage did not differ. Finally, top-quality teams had significantly higher scoreline margins against bottom-quality opposition than when against top-quality opposition. For all significant results, effect sizes were classed as small-medium (Table 4).
Median (Q1, Q3) for possession, shooting statistics and scoreline margins for top team performances (TvT, TvB) during the 2023 and 2024 seasons in the NSL.
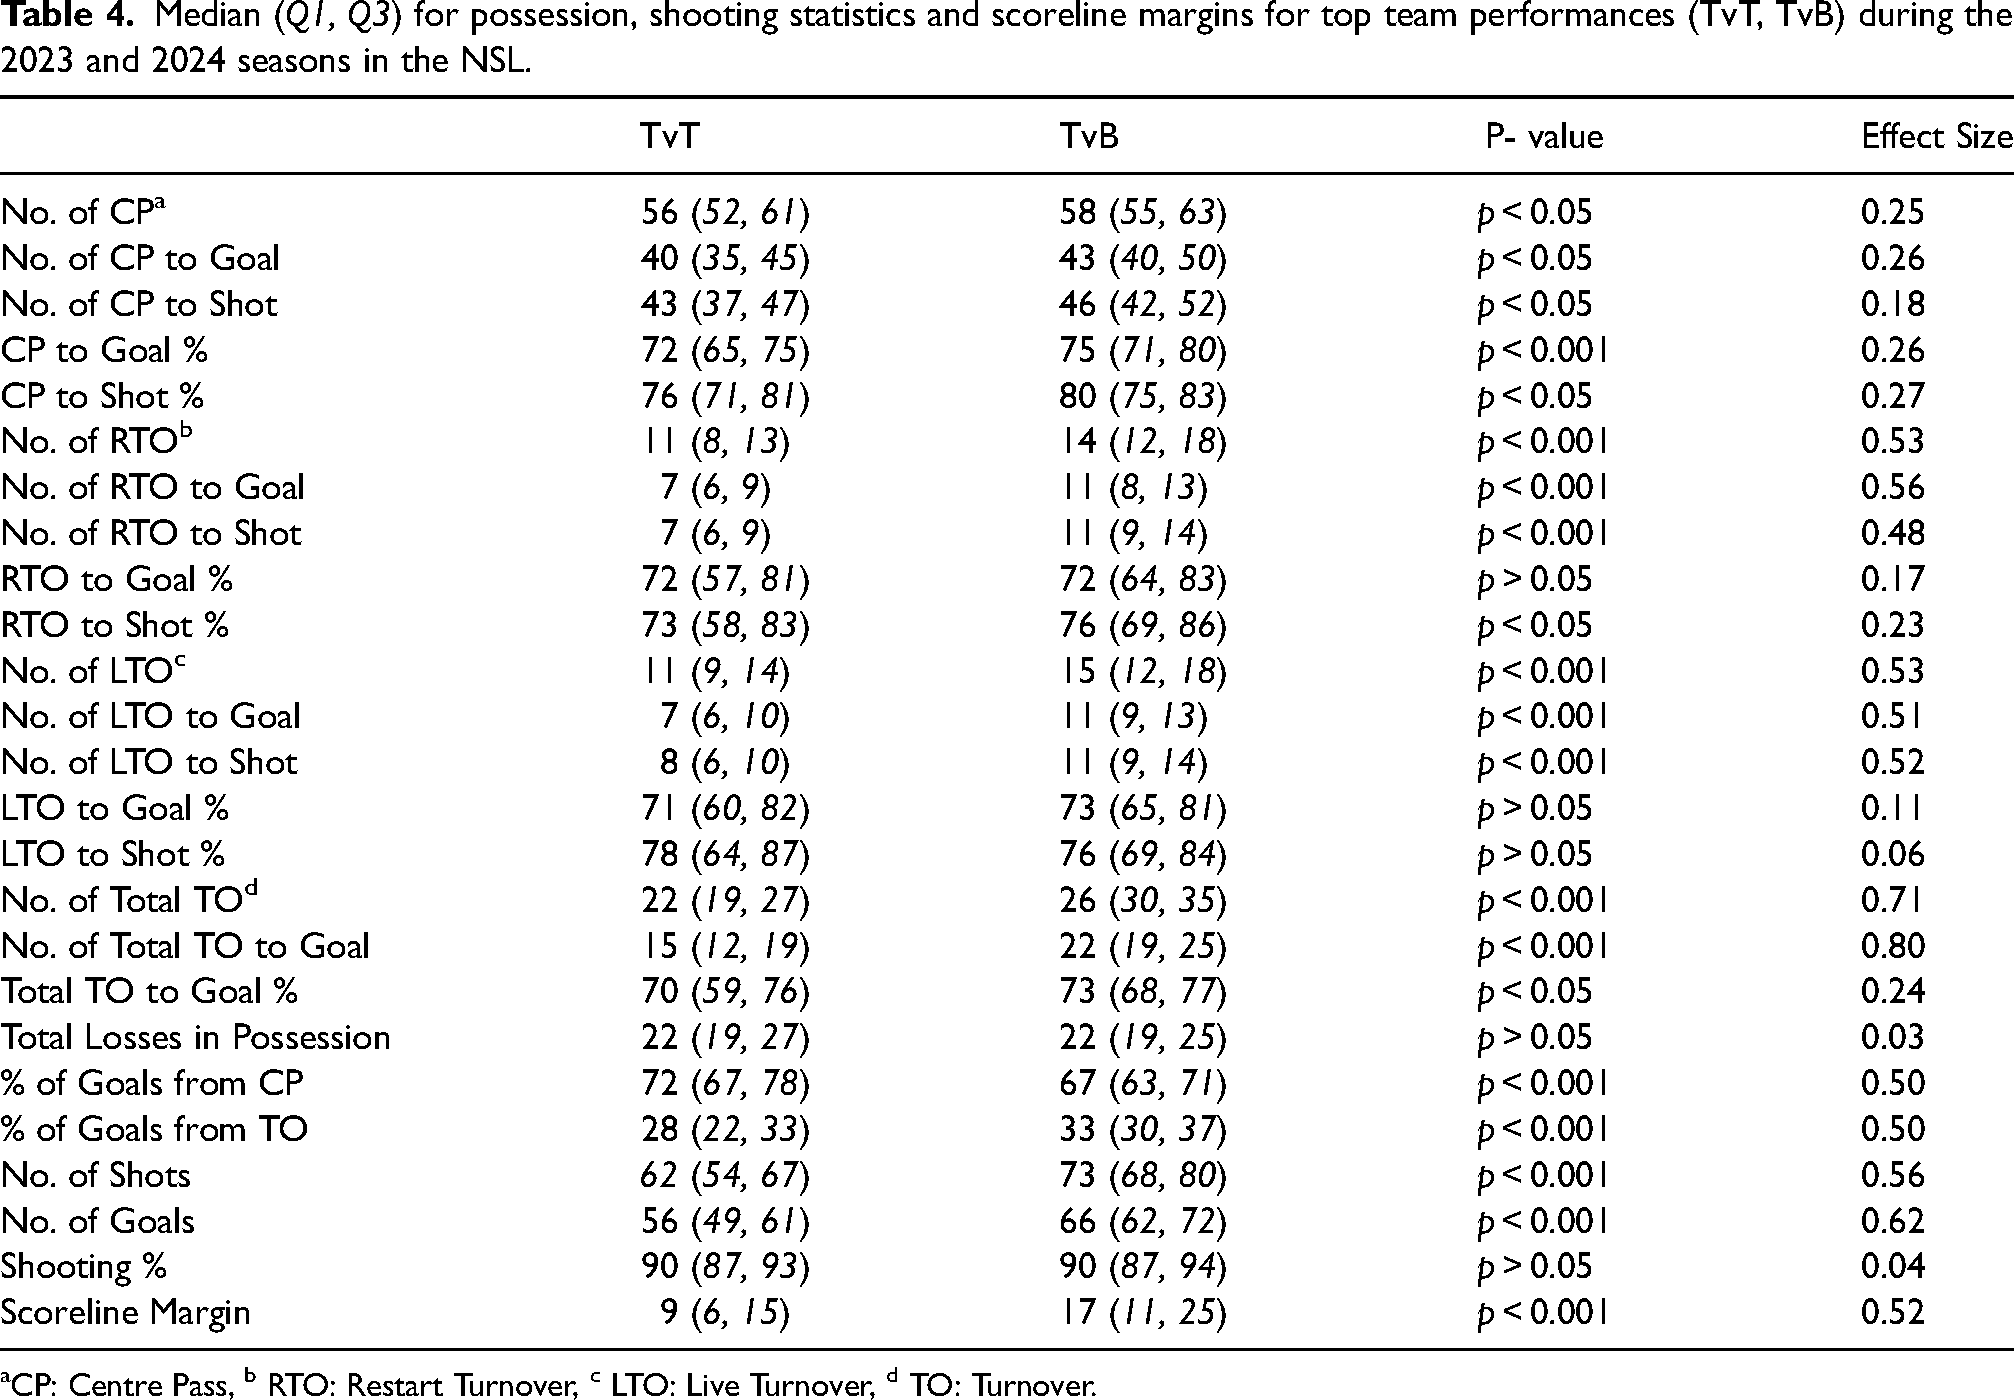
CP: Centre Pass, b RTO: Restart Turnover, c LTO: Live Turnover, d TO: Turnover.
Bottom team performances
For CP performance, bottom-quality teams had a significantly higher number of CP when playing top-quality opposition as opposed to bottom-quality opposition, however, the number of CP to goal and shot were not significantly different. There was a significantly higher percentage of CP to goal and to shot identified when bottom-quality teams played bottom-quality teams as opposed to top-quality teams. For TO performance (RTO, LTO and total TO) all results were significantly higher when playing bottom-quality opposition as opposed to top-quality opposition, apart from RTO percentage to shot where no significant difference was revealed. For total losses in possession, bottom-quality teams had significantly more losses against top-quality opposition than bottom-quality opposition. Similar to top-quality teams, a significantly higher percentage of goals were scored from CP for bottom-quality teams when playing top-quality teams as opposed to bottom-quality teams, whereas significantly more goals were scored from TO when playing bottom-quality teams as opposed to top-quality teams. For shooting performance, bottom-quality teams had significantly more shots, goals and a higher shooting percentage when playing bottom-quality opponents as opposed to top-quality opponents. Finally, bottom-quality teams had significantly smaller scoreline margins against bottom-quality opposition than when against top-quality opposition For all significant results, effect sizes were classed as small-medium (Table 5).
Median (Q1, Q3) for possession, shooting statistics and scoreline margins for bottom team performances (BvT, BvB) during the 2023 and 2024 seasons in the NSL.
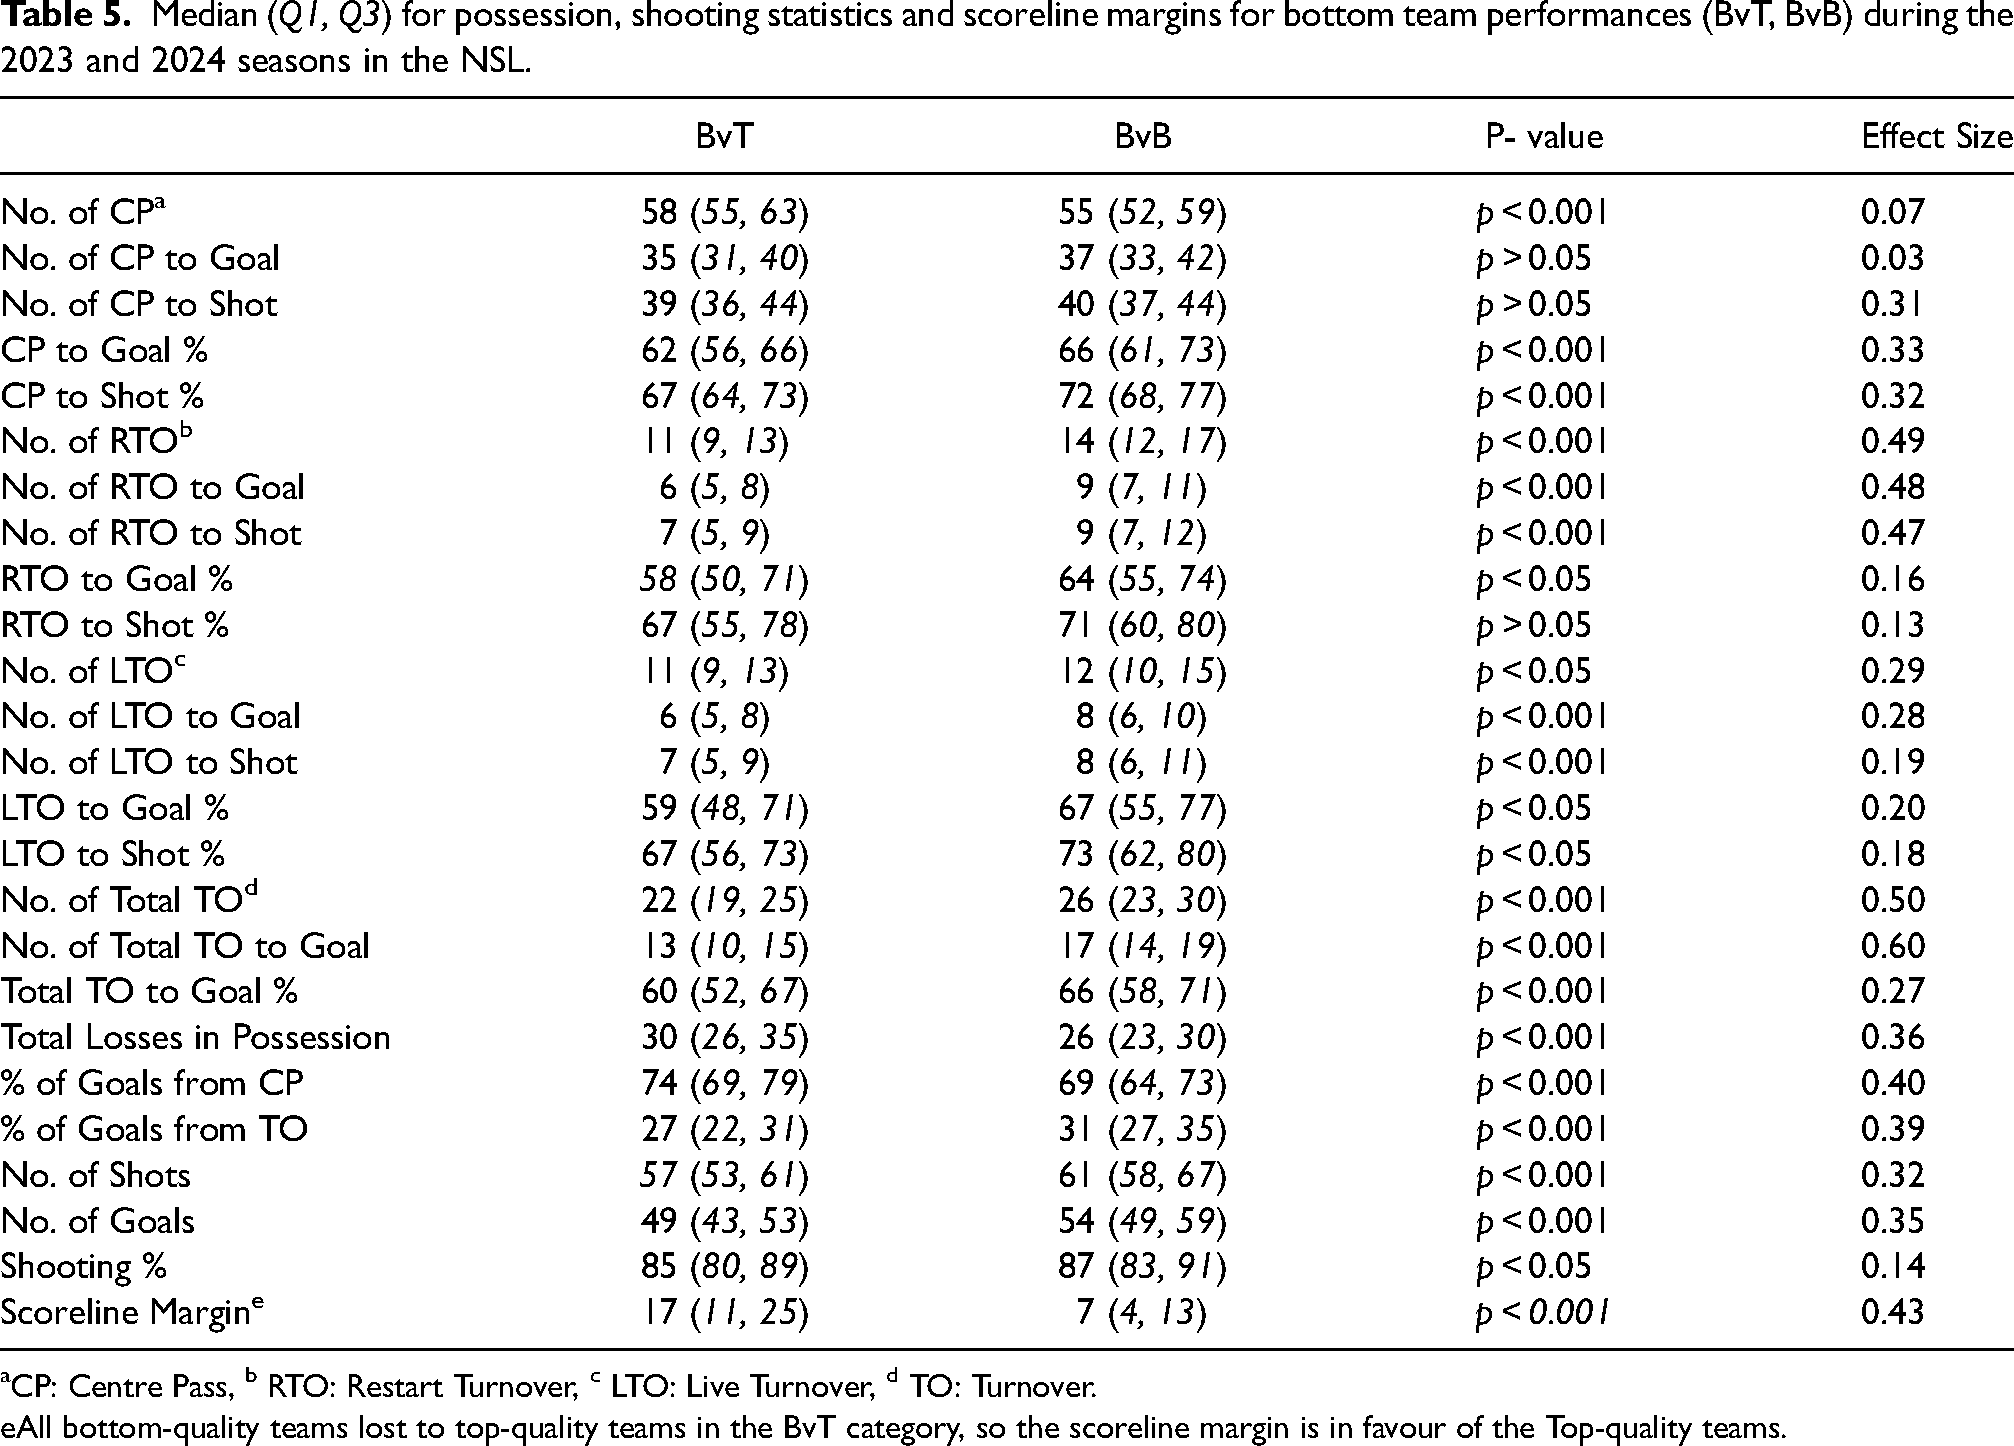
CP: Centre Pass, b RTO: Restart Turnover, c LTO: Live Turnover, d TO: Turnover.
All bottom-quality teams lost to top-quality teams in the BvT category, so the scoreline margin is in favour of the Top-quality teams.
Discussion
The aim of this study was to investigate performance differences between NSL teams during the 2023 and 2024 seasons. The key findings revealed that top-quality teams significantly outperformed bottom-quality teams in the majority of technical indicators. When factoring in opposition quality, for significant results, both top-quality and bottom-quality teams had significantly higher Performance indicators (PIs) (apart from total losses in possession for bottom-quality teams and percentage of goals from CP) when playing against bottom-quality opponents than top-quality opponents. Furthermore, large spreads in the interquartile range can be seen for several PIs regardless of the quality of the opponent.
Significant differences were revealed for the majority of possession and shooting statistics (except the number of CP and RTO) between top-quality and bottom-quality teams. Top-quality teams were able to convert significantly more CP, RTO, LTO and Total TO to shot and to goal than bottom-quality teams, with median conversion rates >70% for top teams to goal vs 62–64% to goal for bottom teams. Therefore, this may indicate a threshold for successful performance for these PIs within the NSL. Top-quality teams also had significantly more shots and goals, and a significantly higher shooting percentage than bottom-quality teams. This coincides with previous research from O’Donoghue et al., 3 and Hersant and Oates 4 who both found at the domestic and international level respectively, top-quality teams were able to convert significantly more possessions to goal than bottom-quality teams. However, no significant results were found for the number of RTO between teams. This suggests that top-quality and bottom-quality teams are comparable in the number of possessions they gain through a break in play (i.e. ball going out of court) or umpire intervention in a match, but top-quality teams are better at maintaining possession of these events and converting them to a shot or goal. This is likely due to top-quality teams having better technical and tactical execution, and better offensive strategies in play to ensure possession maintenance. 4 This can also be seen when looking at the effects of opposition, where top-quality teams regardless of opposition have the same shooting percentage of 90%.
As expected when assessing the possession-based PIs and the effects of the opposition, both types of teams performed significantly better against bottom-quality opponents than top-quality opponents, aligning with O’Donoghue et al., 3 and Hersant and Oates. 4 Similar to O’Donoghue et al., 3 this study found that top-quality teams scored from a similar percentage of turnovers (RTO and LTO) regardless of opposition, as shown by the non-significant results. However, this was not the case for CP, with top-quality teams converting a significantly higher percentage of CP to goal against bottom-quality opponents than top-quality opponents, contradicting the findings of O’Donoghue et al. 3 This may suggest that top-quality teams can better implement offensive CP strategies against lower-quality opposition, whereas strategies to maintain possession and score from turnovers are not affected by the quality of an opponent. This is likely due to the CP being a more structured event, compared to in-game turnovers which can occur from a variety of events and in various locations. Teams may implement more general play strategies (particularly for LTO) which do not differ across opponents when they win possession from turnovers. Whereas for the CP, the structured nature of this event provides opportunities for more strategic and opponent-specific set-ups and strategies to be developed and implemented. These strategies have likely evolved since 2008 3 due to enhanced training environments, improved video analysis support, and more advanced coaching. This can also be supported by the percentage of goals scored from CP, where for both bottom and top teams regardless of opposition, more than 65% of goals are scored from CP. This shows the high frequency of this event and the importance of this event for scoring; thus teams are likely to spend more time practising these set-ups and strategies in training.
As Hersant and Oates 4 suggested, and as per the secondary aim of this study, it is important to consider the development of netball, particularly British netball, where league structures and squad sizes have not varied much since its inception in 2005. According to O’Donoghue et al., 3 across 3 seasons (2005–06, 2006–07 and 2007–08) in the NSL, 54.3% of CP, and 50.8% of TO were converted to goal, and 75.9% of shots were scored when top-half teams played bottom-half teams. Compared with the results of this study, where top-quality teams converted a median of 75% of CP, 72% of RTO and 73% of LTO to goal, and scored from 90% of shots against bottom-quality opposition. Additionally, O’Donoghue et al., 3 found that top-half teams gained a median of 28 interceptions and 7 defensive rebounds against bottom-half teams, whereas this study found that against a bottom-quality opposition, top-quality teams gained a median of 15 LTO (inclusive of interceptions and rebounds), a decrease in 20 live turnovers of possession. Bruce et al., 1 found all teams irrespective of quality in the ANZ Championship had an upward trend in predominantly offensive aspects, suggesting that games are becoming dominated by attacking players. The results of this study coincide with these findings, as since 2008, it can be seen that teams are scoring more goals at a higher shooting percentage, from 75.9% to 90%, and are losing possession less. This therefore highlights the significant developments and increases in technical performances, particularly with regards to possession maintenance and shooting performance, of teams within the NSL since 2008, whilst also providing an up-to-date profile of teams’ technical performances on KPIs.
However, despite the developments in British Netball, is it important to consider the consistency of team performances. Although since the 2022 season, three of the top teams have consistently finished in the top four, when assessing interquartile ranges (IQR) amongst the results of this study, large spreads can be seen for the majority of the indicators, regardless of opposition. For example, when assessing top-quality teams possession conversion percentages, IQRs of 10% and 9% for CP, 4% and 9% for RTO, and 12% and 6% for LTO can be seen when playing against top-quality and bottom-quality opponents respectively. This can also be assessed alongside the median scoreline/winning margins of teams. Again, when looking at top-quality teams, the median winning margin against top-quality teams was 9 goals, and against bottom-quality teams was 17 goals. However, the IQRs of these results reveal a spread of 9 goals and 14 goals against top and bottom-quality opponents respectively. This shows a large variance in winning margins, thus suggesting that top-quality teams are inconsistent in their winning performances regardless of opposition and also highlights inconsistencies in opposition performance. A similar pattern can also be seen for the bottom-quality teams, where against opposition of a similar quality (BvB), an IQR of 9 goals can be seen in the scoreline margin. Compared to the average winning margin of just 7.6 goals in the 2023 SSN season overall, 8 large disparities across the different domestic leagues have been identified. Going forward, it is important to consider these statistics, and whether the major changes introduced to re-launch the NSL in 2025 will allow for more closely competed matches and more consistent performances.
Limitations and future research
This study has highlighted performance developments in British netball in terms of technical performance, however, there is a lack of tactical assessment and of what causes winning performances. However, as Hersant and Oates 4 suggested, future research should investigate the tactical elements of netball at the domestic level too. This could include CP attacking and defensive strategies, to determine how teams maintain possession and convert CP to goal, whilst also gaining possession of opposition's CP. Also, since this study did not assess circle feeds and the success rate, future research can assess this KPI and the tactical strategies associated with successful circle feeding (i.e. how to gain optimal shooting position), which was shown to be a KPI in international netball. 4 Finally, with the re-launch of the NSL, an investigation into performance indicators in netball should be revisited in the future once the league is more established. Therefore, this could identify if the NSL re-launch has led to a more competitive competition, and more consistent team performances, which could then be compared to the other top domestic leagues worldwide, such as ANZ and SSN.
Conclusion
To conclude, this study has noted key performance differences amongst teams of differing quality in the British NSL. Overall, top-quality teams significantly outperformed bottom-quality teams on the majority of technical KPIs, and teams of different quality generally performed better against opposition of lower quality. For top-quality teams CP to goal, RTO to goal and LTO to goal median conversion rates were >70%, whereas conversion rates were 62–64% for bottom-quality teams. This may indicate a threshold for more successful performance within the NSL. This study has also revealed the development in British domestic netball performances since 2008 by O’Donoghue et al. 3 This information can be used by coaches to prepare for performances against different levels of opposition and to see current performance standards within British netball. Despite developments in netball performance, there is still inconsistency within the NSL and large winning margins indicating a disparity between top-quality and bottom-quality teams. Future research should consider the tactical assessment of teams, to aid in the identification of winning performances within netball. Furthermore, a re-visited investigation like this study should be conducted in the future to monitor if the NSL re-launch has allowed for more competitive games similar to other domestic leagues.
Supplemental Material
sj-docx-1-spo-10.1177_17479541251333942 - Supplemental material for An analysis of technical team performances in the British Netball Superleague 2023–2024
Supplemental material, sj-docx-1-spo-10.1177_17479541251333942 for An analysis of technical team performances in the British Netball Superleague 2023–2024 by Hannah Hersant and Luke Oates in International Journal of Sports Science & Coaching
Supplemental Material
sj-xlsx-2-spo-10.1177_17479541251333942 - Supplemental material for An analysis of technical team performances in the British Netball Superleague 2023–2024
Supplemental material, sj-xlsx-2-spo-10.1177_17479541251333942 for An analysis of technical team performances in the British Netball Superleague 2023–2024 by Hannah Hersant and Luke Oates in International Journal of Sports Science & Coaching
Footnotes
Acknowledgements
The authors would especially like to thank England Netball, and all franchise analysts for their work in collecting data throughout the NSL seasons.
Author contributions
Conceptualisation, HH and LO. Investigation, HH and LO. Writing, HH and LO. Reviews and editing, HH and LO. All authors have read and agreed to the published version of the manuscript.
Consent to participate
Informed consent was not required to participate in this study as data was already pre-collected by England Netball. However, gatekeeper permissions were signed and approved by England Netball to use the data for this study.
Consent for publication
Not applicable.
Data availability
Declaration of conflicting interests
The authors declared no potential conflicts of interest with respect to the research, authorship, and/or publication of this article.
Funding
The authors received no financial support for the research, authorship, and/or publication of this article.
Ethical considerations
This study received ethical approval from the London Sport Institute, Middlesex University, Research Ethics Committee on 01/02/2024, approval no. 27902.
Supplemental material
Supplemental material for this article is available online.
References
Supplementary Material
Please find the following supplemental material available below.
For Open Access articles published under a Creative Commons License, all supplemental material carries the same license as the article it is associated with.
For non-Open Access articles published, all supplemental material carries a non-exclusive license, and permission requests for re-use of supplemental material or any part of supplemental material shall be sent directly to the copyright owner as specified in the copyright notice associated with the article.