
Abstract
There has been increasing interest in new measurement systems that provide instantaneous spatiotemporal data whilst being less expensive and more accessible to practitioners. The aim of this study was to examine the agreement between the OptoJump Next system (OJ), videography and force platform methods for measuring spatiotemporal variables during the acceleration phase of sprinting. Ninety-nine university students completed two maximal 20 metre sprints in which spatiotemporal parameters (contact time [CT], flight time [FT], step length [SL] and step rate) were simultaneously obtained using the OJ system (1000 Hz), videography (200 Hz), and force platforms (1000 Hz). The OJ and video systems showed high agreement for the measurement of step length (bias: 0.003–0.007 m, random error [RE]: 0.057–0.071 m). For temporal parameters, OJ tended to overestimate CT compared to the force platforms (bias: 0.012–0.014 s, RE: 0.009–0.021 s) and also underestimated FT (bias: 0.012–0.013 s, RE: 0.011–0.012 s). Despite the lower sampling rate, videography showed a closer agreement with the force platform for both CT (bias: 0.005–0.010 s, RE: 0.009–0.021 s) and FT (bias: 0.005–0.007 s, RE: 0.008–0.010 s). Although OptoJump next provides instantaneous spatiotemporal parameters, coaches may wish to adjust for the systematic overestimation of CT (0.013 s) and underestimation of FT (0.012 s) in order to obtain sprint spatiotemporal data that aligns to force platforms.
Introduction
Spatial and temporal gait variables are commonly examined in sports biomechanics to investigate performance-related factors. Parameters frequently investigated include step length, step rate, contact time and flight time, predominantly because of their strong connection to sprinting performance. 1 These measurements are frequently used in talent identification, monitoring the effectiveness of training interventions and in characterising individual running style, hence the measurement methods used to obtain these variables are of great interest to coaches, athletes and researchers. Whilst some of these parameters can be obtained using low-cost digital cameras or mobile applications (e.g. Runmatic), laboratory systems such as force platforms have long been considered the gold-standard methods. Force platforms provide accurate data for use by practitioners and researchers; however, these are expensive, lack portability for field-based measurements and may require extensive analysis time.
Videography continues to be a method used by practitioners and scientists to monitor spatiotemporal parameters during sprinting. 2 Advances in video technology now mean that higher (>500 Hz) sampling frequencies can be utilised which resemble those utilised by laboratory methods (e.g. force platforms). However, in reality, very high sampling rates (>500 Hz) are unlikely to be frequently used in non-laboratory settings due to the system storage requirements, associated costs and the time-consuming nature of repeated analysis. Videography which utilises lower sampling rates (50–250 Hz) remains a viable measurement option in non-laboratory settings due to ongoing advances in technology but there has been an increasing interest in measurement systems that provide instantaneous data whilst being less expensive and more accessible to practitioners.3–6 In particular, instruments that utilise photoelectric cells have gained popularity among sports scientists; 7 these instruments consist of a long corridor of light-emitting and light-receiving diodes that are placed opposite each other orientated perpendicular to the direction of the activity. Of these, the OptoJump Next system (OJ) measures spatiotemporal variables at a frequency of 1000 Hz over multiple gait cycles and is now widely used within sport and exercise research and in the field. 8
Research has highlighted that the OJ system is a valid and reliable tool for the examination of vertical jump, hopping and drop jumping performance,7,9,10–14 with less research examining the validity and reliability of the device when measuring human gait.15–17 Whilst these studies support the validity and reliability of the system in walking and running activities, limited information exists to support its use during sprinting and the early acceleration phase in particular. This is somewhat surprising given the importance of acceleration and sprinting in many sporting activities, 18 and the frequent use of OJ to analyse sprinting in sports science research.11,19,20 Although it may be tempting to infer the validity of the OJ system for sprinting activities based on investigations that have examined running activities, there are well established differences between running and sprinting (aside from the movement velocities) which most notably include the progressive changes in spatiotemporal variables that are known to occur during the acceleration phase of sprinting.21,22 Aside from the lack of specific information on the validity of OJ during sprinting activities, it is surprising that spatiotemporal variables measured using the OJ system have been used as the gold-standard from which to validate other, non-laboratory methods.3,12,23 Although this is presumably based on the high sampling rate (1000 Hz) of the system, the location of the sensors 3 mm from the ground 24 is known to impact calculated spatiotemporal variables. 9 Whilst the resulting systematic bias may be diminished depending on the filter settings selected,16,17 temporal variables (e.g. contact time) measured with non-laboratory systems should be compared with force platforms as the best method available.
Since issues relating to time demands, cost, accessibility and accuracy inform the use of technology by applied practitioners, both videography and OJ remain viable options for the analysis of spatiotemporal variables during sprint acceleration. Since questions clearly remain regarding the validity of these methods for this application, the purpose of this study was to examine the agreement between the OJ system, videography and force platform measures for measuring spatiotemporal variables during the early acceleration phase of sprinting. The examination of both OJ and videography systems ensured that two commonly used systems were compared whilst the inclusion of force platforms indicated the level of agreement with the best available method for obtaining temporal parameters. Since the OJ system and videography are frequently used in monitoring individual athlete's sprinting abilities, 11 information on the accuracy of spatiotemporal variables obtained from these methods is of great interest to sports science practitioners to ensure that accurate interpretation is undertaken to inform subsequent decisions regarding training, performance and return-to-play following injury.
Methods
Study design
In order to achieve the aims of the study, data were simultaneously collected using the OJ system, videography and force platforms during a 20-metre overground sprint during one visit to the Biomechanics laboratory at Leeds Beckett University. Spatiotemporal variables were obtained for each of the systems and the agreement between these was then compared using a range of absolute (e.g. limits of agreement) and relative (e.g. intraclass correlation coefficient) metrics.
Participants
The population consisted of 99 healthy university students (mean ± SD: age: 20.11 ± 1.10 years, height: 1.73 ± 0.08 m, mass: 73.58 ± 14.52 kg) of which 68 were male and 31 were female. The study was approved by the Carnegie School of Sport Research Ethics Committee. In accordance with the institutional review board's policies for the use of human participants in research, all participants were informed of the benefits and possible risks associated with participation before taking part and informed of their right to withdraw at any point. All participants were recreationally active students (5 metre split: 1.176 ± 0.083 s) who were free from injury, older than 18 years and provided written, informed consent before taking part.
Procedures
Following a standardised warm-up, participants completed two maximal sprints over a distance of 20 metres starting from an upright position with the preferred leg in front of the body. One familiarisation trial was permitted beforehand, and the trials were interspersed with 3–5 min of stationary recovery. During each trial, split time data were collected using infra-red timing gates (Microgate, Bolzano, Italy) placed at 5 m, 10 m and 20 m. Spatiotemporal parameters were simultaneously obtained using three different measurement systems during the maximal sprint trials. Contact time (CT) and flight time (FT) were measured during each trial using 3 adjacent 900 × 600 mm force platforms (1000 Hz; Kistler, Winterthur, Switzerland) arranged in-series (total footprint = 2700 × 600 mm) and located within the first 5 metres (platform one started at 0 metres) of the 20-metre segment. This enabled three ground contacts to be collected for each participant (but not three complete steps). Since previous investigations provide evidence to support the validity of video analysis for measuring sagittal plane kinematics during running, 25 step length (SL), step rate (SR), CT and FT were calculated from recordings taken using a video camera (200 Hz; Fastec Imaging, San Diego, CA, USA). This sampling rate was chosen to align with the realistic use of videography in applied scenarios where the time available for data collection and analysis may be limited. Finally, spatiotemporal parameters were also obtained using a 5-metre segment of the OJ system (1000 Hz; Microgate, Bolzano, Italy) which was also positioned in the first 5 metres of the 20-metre segment. The force platforms were covered with a synthetic athletics surface and were flush with the OJ strips which ran parallel. The camera was positioned 8.25 m from the running track with its lens at height of 1 metre and perpendicular with the centre of the middle force platform. The resolution of the camera was 1280 × 960 px, the shutter speed was 1/2500 s and the f-stop was 2.0. Additional lighting was provided by 26 overhead lights (4000 W).
The ground reaction forces (GRF) obtained from the force platform were analyzed using a custom-written Matlab script (MathWorks, Natick, MA, USA). In order to identify initial contact during each foot strike, the mean and standard deviation (SD) of the unfiltered resultant GRF noise in the first 100 ms of each sample was quantified, ground contact was then considered to begin when the GRF was greater than 3 SD above the mean of the noise 26 for at least 50 frames (or 0.05 s). An identical procedure was used to determine the end of ground contact (also the beginning of the flight phase).
In order to replicate field-based measurements when the time available for data collection and extraction may be limited, data from the OJ system was extracted using the default (0_0) setting meaning that ground contact began when at least 1 light-emitting diode (LED) was activated and ended once the number of active LEDs returned to 0. The minimum threshold for flight time was also set at the default threshold of 10 ms. The video files were analysed for contact time, flight time and step length using SIMI Motion 9.2.2 (SIMI Motion, Munich, Germany). A rigid frame measuring 6.00 × 2.00 m and comprising 12 reference points was used for calibration purposes. Contact time was defined as the duration from initial contact (the first visible frame of touchdown) to toe-off (the final frame of contact prior to flight), whereas flight time was the duration from toe-off on one foot to the initial contact of the opposing foot. 22 For the video and OJ System, step length was taken as the horizontal (anteroposterior) displacement between toe-off of consecutive foot contacts. The sum of contact and flight time was used to obtain step time, and the inverse of this value was used to obtain step rate (Hz). The product of step rate and step length were then used to obtain step velocity. Variables were obtained for three complete steps taking place within the capture volume for all three measurement systems meaning that the data were removed for any participants in which a complete data set was not available. To check for outliers, all data were checked to ensure that the measured values were within 2.2 times the interquartile range of the median score.27,28 Any detected outliers were then removed from analysis. The reliability of the digitising process showed minimal total errors for the measurement of SL (ICC: 0.994, RMSD: 0.011 m), SR (ICC: 0.997, RMSD: 0.024 Hz), CT (ICC: 0.997, RMSD: 0.002 s) and FT (ICC: 1.000, RMSD: 0.000 s) when it was repeated for six randomly selected subject with an intervening period of 48 h.
Statistical analysis
Descriptive statistics are reported as mean and SD. Statistical analysis was conducted using SPSS Statistics 24 (IBM SPSS, Inc., Chicago, IL, USA). In order to quantify the agreement between each measurement system, a range of metrics were used: root mean square difference (RMSD), intraclass correlation coefficient (3,1; including 95% confidence intervals) and limits of agreement (LOA; bias and random error [RE]).29,30 In line with previous recommendations, 31 an intraclass correlation coefficient (ICC) over 0.9 was categorised as high, between 0.8 and 0.9 as moderate and below 0.8 as low.
Results
In line with their different units, the level of bias and random error varied for CT (bias: 0.005–0.014 s, RE: 0.009–0.021 s) (Table 1), SL (bias: −0.007–0.003 m, RE: 0.057–0.071 m) (Table 2), SR (bias: −0.024–0.013 Hz, RE: 0.143–0.218 Hz) (Table 2) and FT (bias: −0.013–−0.005 s, RE: 0.009–0.012 s) (Table 1). The ICC analysis however revealed that the agreement between OJ and video was high for CT (0.917–0.963) (Table 1), SL (0.940–0.956) and SR (0.964–0.983) (Table 2) but only low-high (0.780–0.901) for FT (Table 1).
Measures of agreement for contact time and flight time measured with the OJ, video, and force plate (FP) systems.
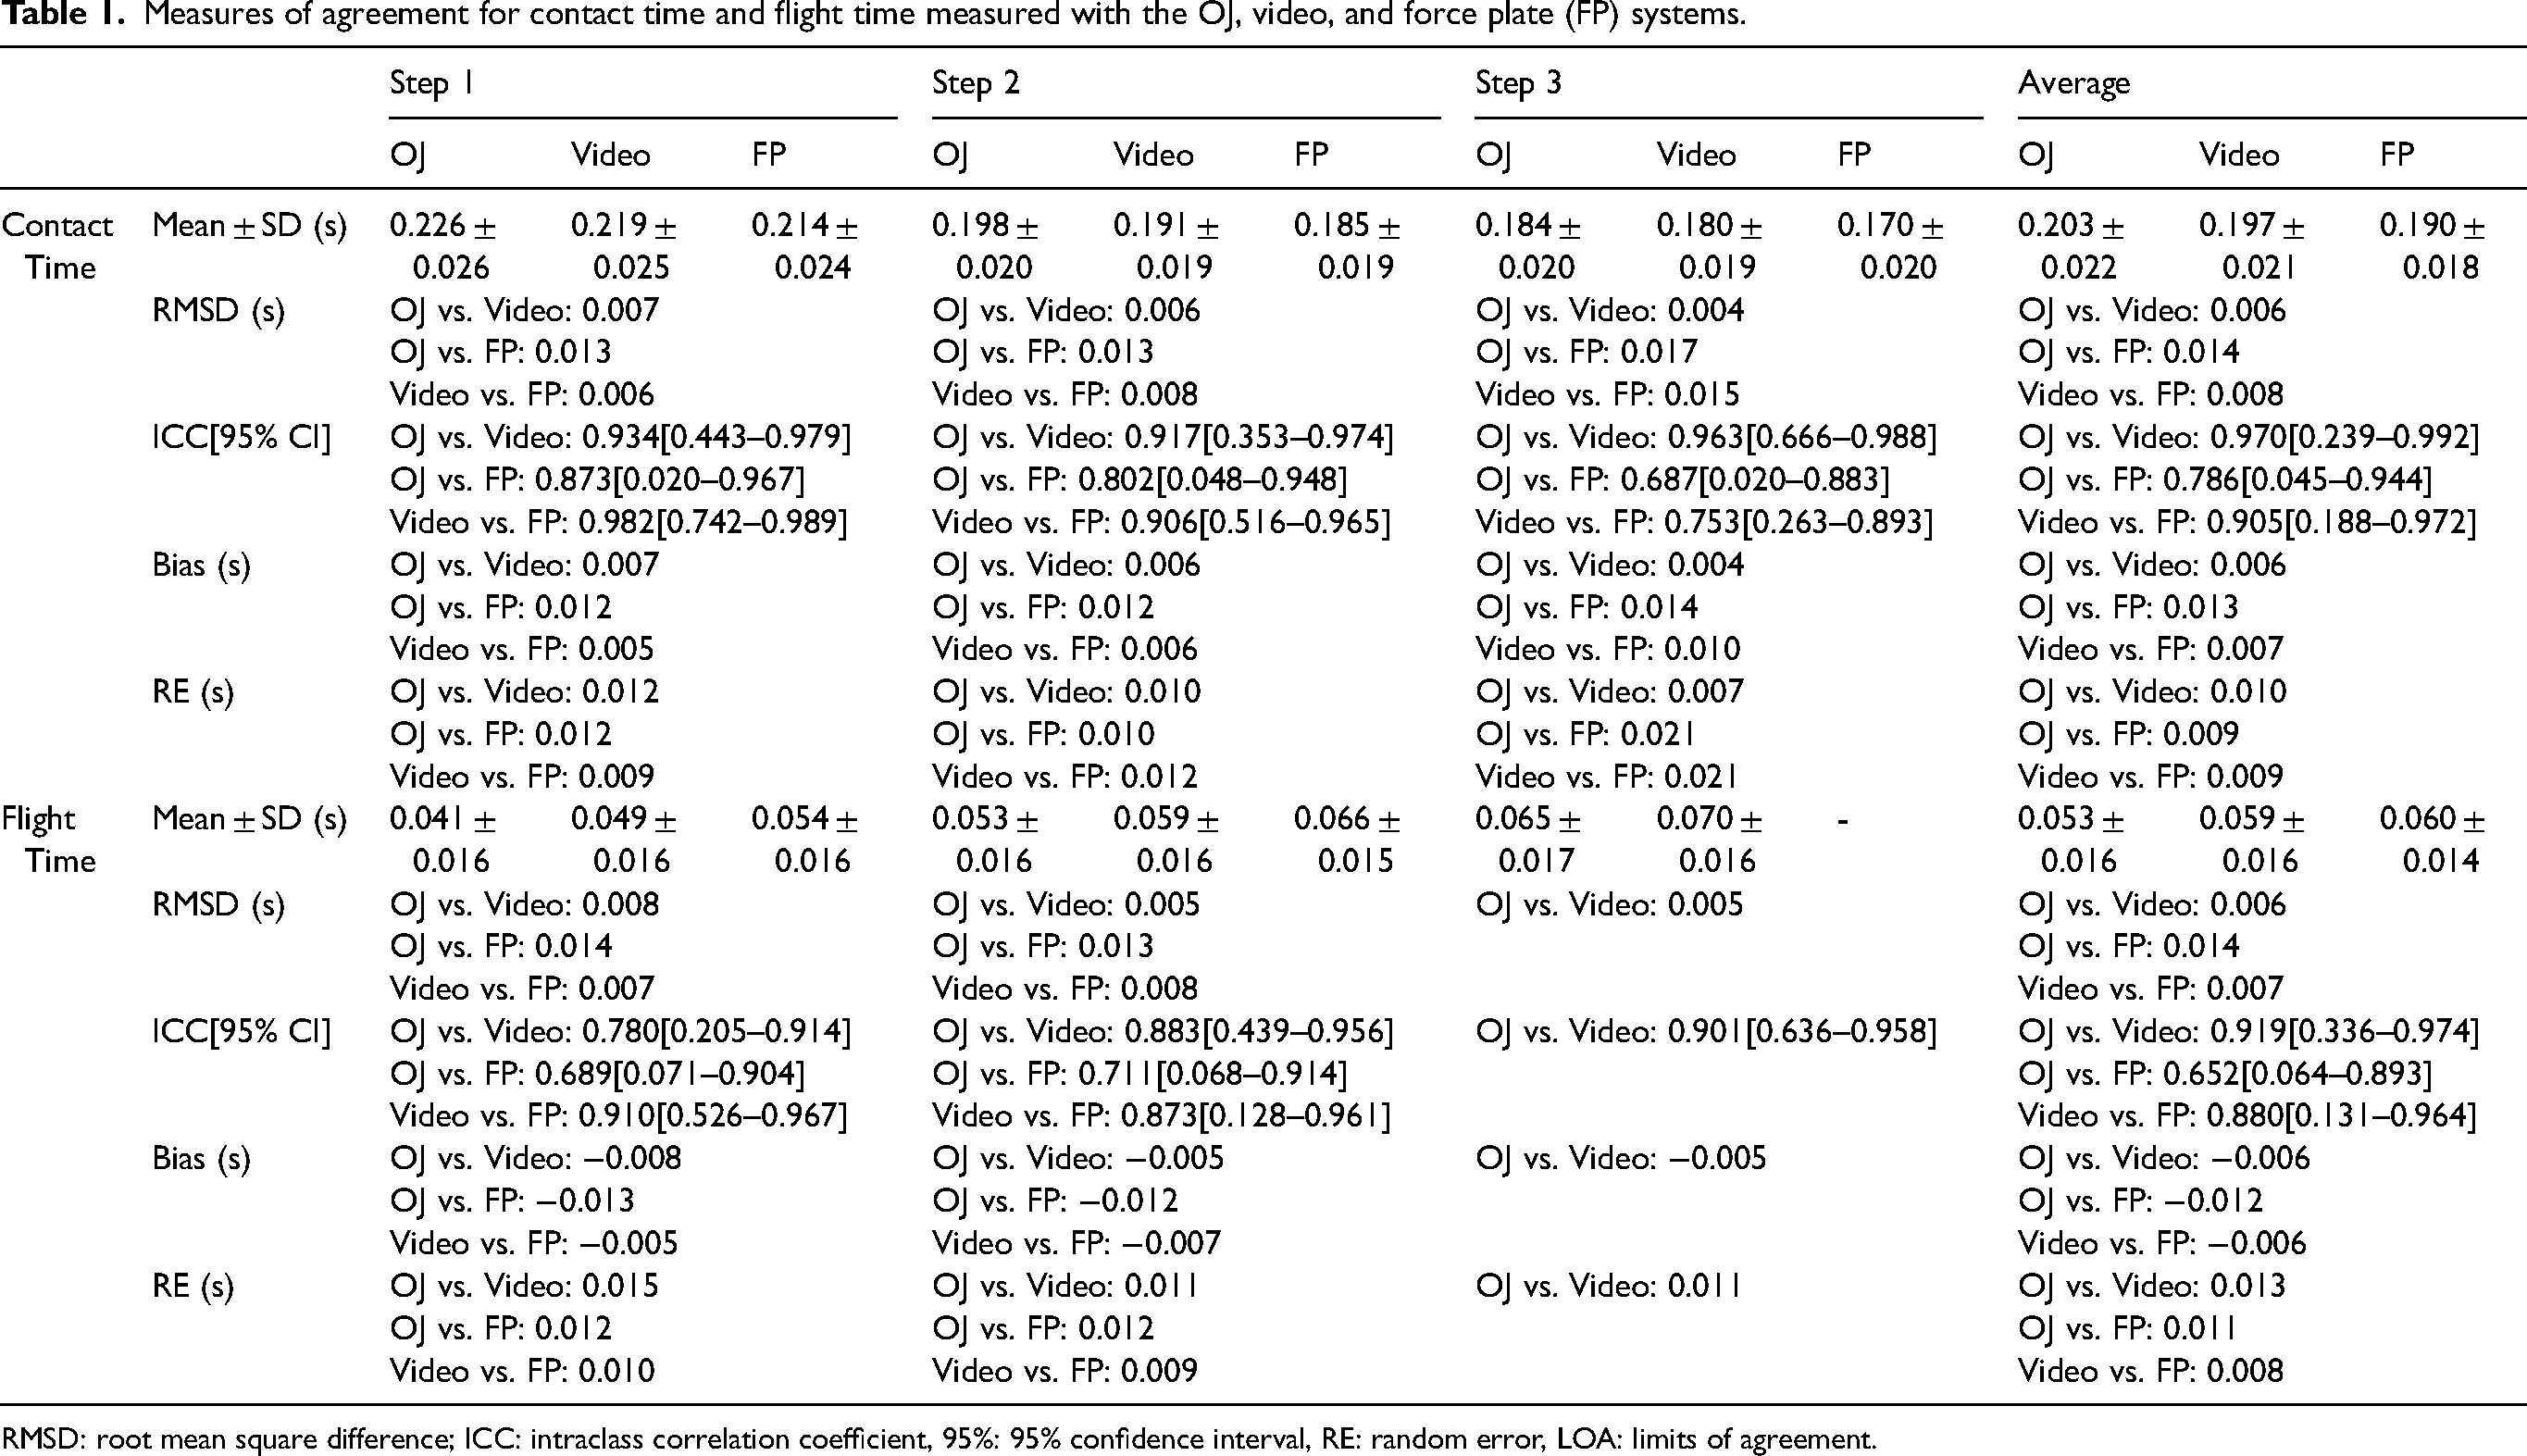
RMSD: root mean square difference; ICC: intraclass correlation coefficient, 95%: 95% confidence interval, RE: random error, LOA: limits of agreement.
Measures of agreement for step length and step rate measured with the OJ and force plate (FP) systems.
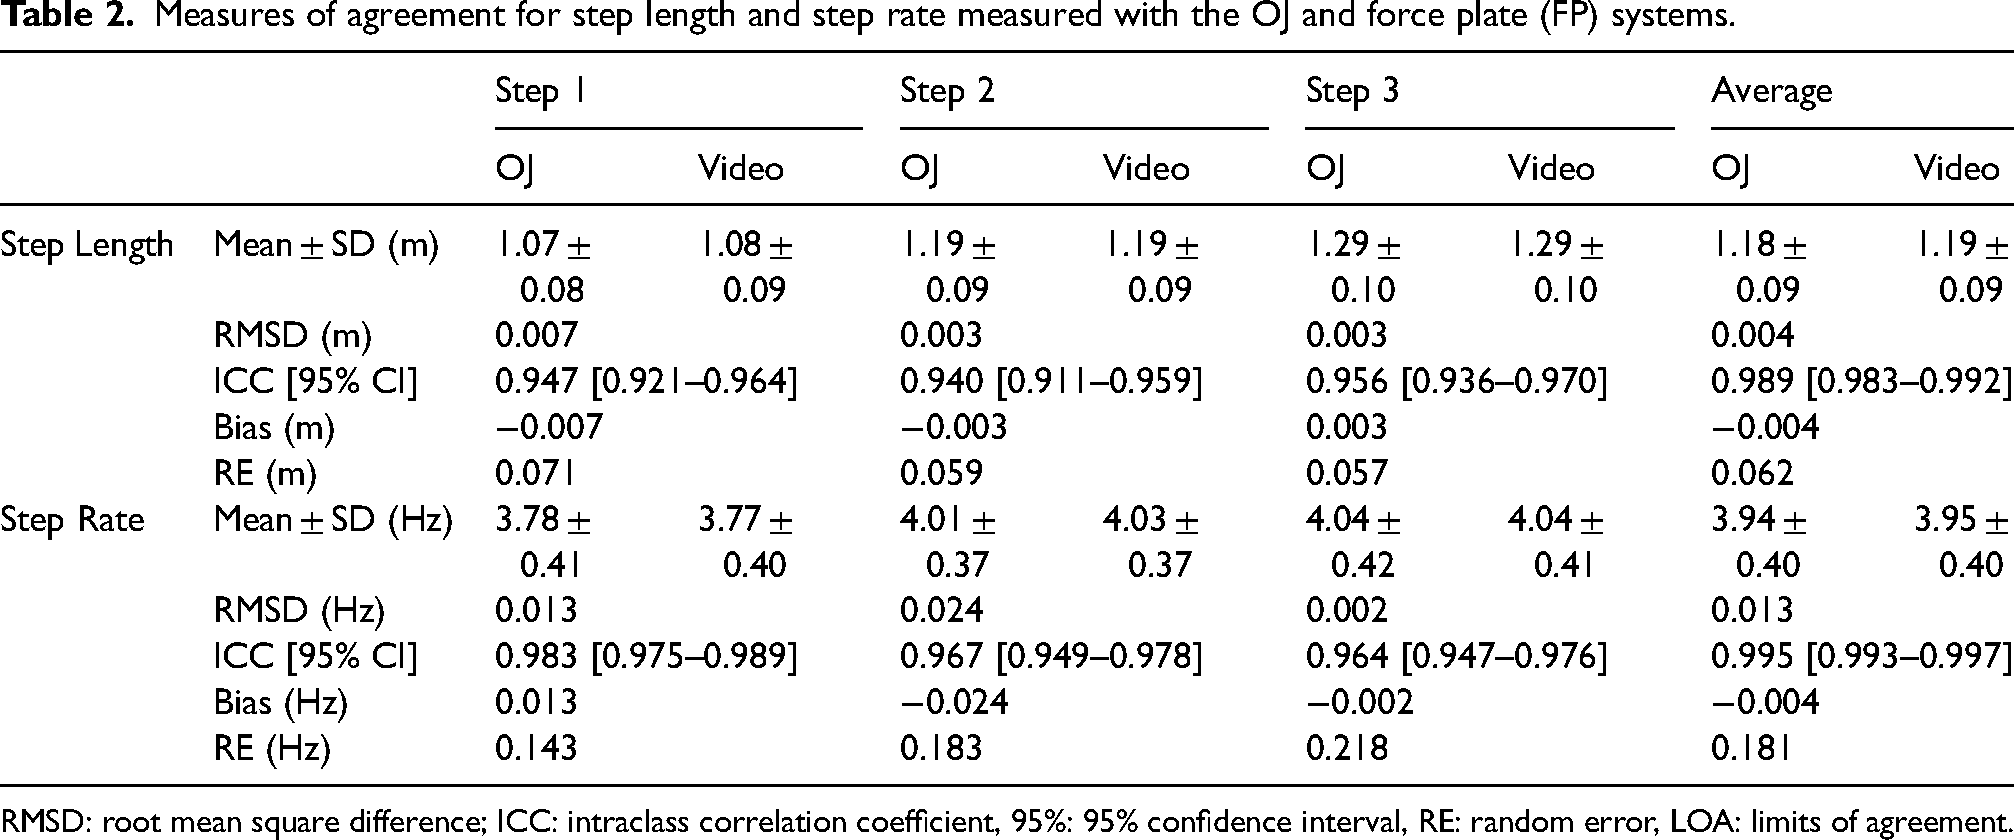
RMSD: root mean square difference; ICC: intraclass correlation coefficient, 95%: 95% confidence interval, RE: random error, LOA: limits of agreement.
According to the bias and RE metrics, OJ tended to overestimate CT compared to the force platform (bias: 0.012–0.014 s, RE: 0.010–0.021 s) and also underestimated FT (bias: −0.012–−0.013 s, RE: 0.012 s) (Table 1). Videography showed a closer agreement with the force platform, with the bias and RE reported for CT (bias: 0.005–0.010 s, RE: 0.009–0.021 s) and FT (bias: −0.005–−0.007 s, RE: 0.009–0.010 s) being lower than when OJ was compared to force plate (FP) (Table 1). According to the ICC values, the agreement between OJ and force platform was low-moderate for CT (0.687–0.873) and low for FT (0.689–0.711) (Table 1). A higher level of agreement was observed between video and force platform, with the values for CT (0.753–0.982) and FT (0.873–0.910) sitting in the low-high categories (Table 1).
Figures 1 and 2 show the bias and LOA for step length and step rate between OJ and video. Figures 3 and 4 show the LOA for contact time and flight time measured by OJ, force platforms and video.
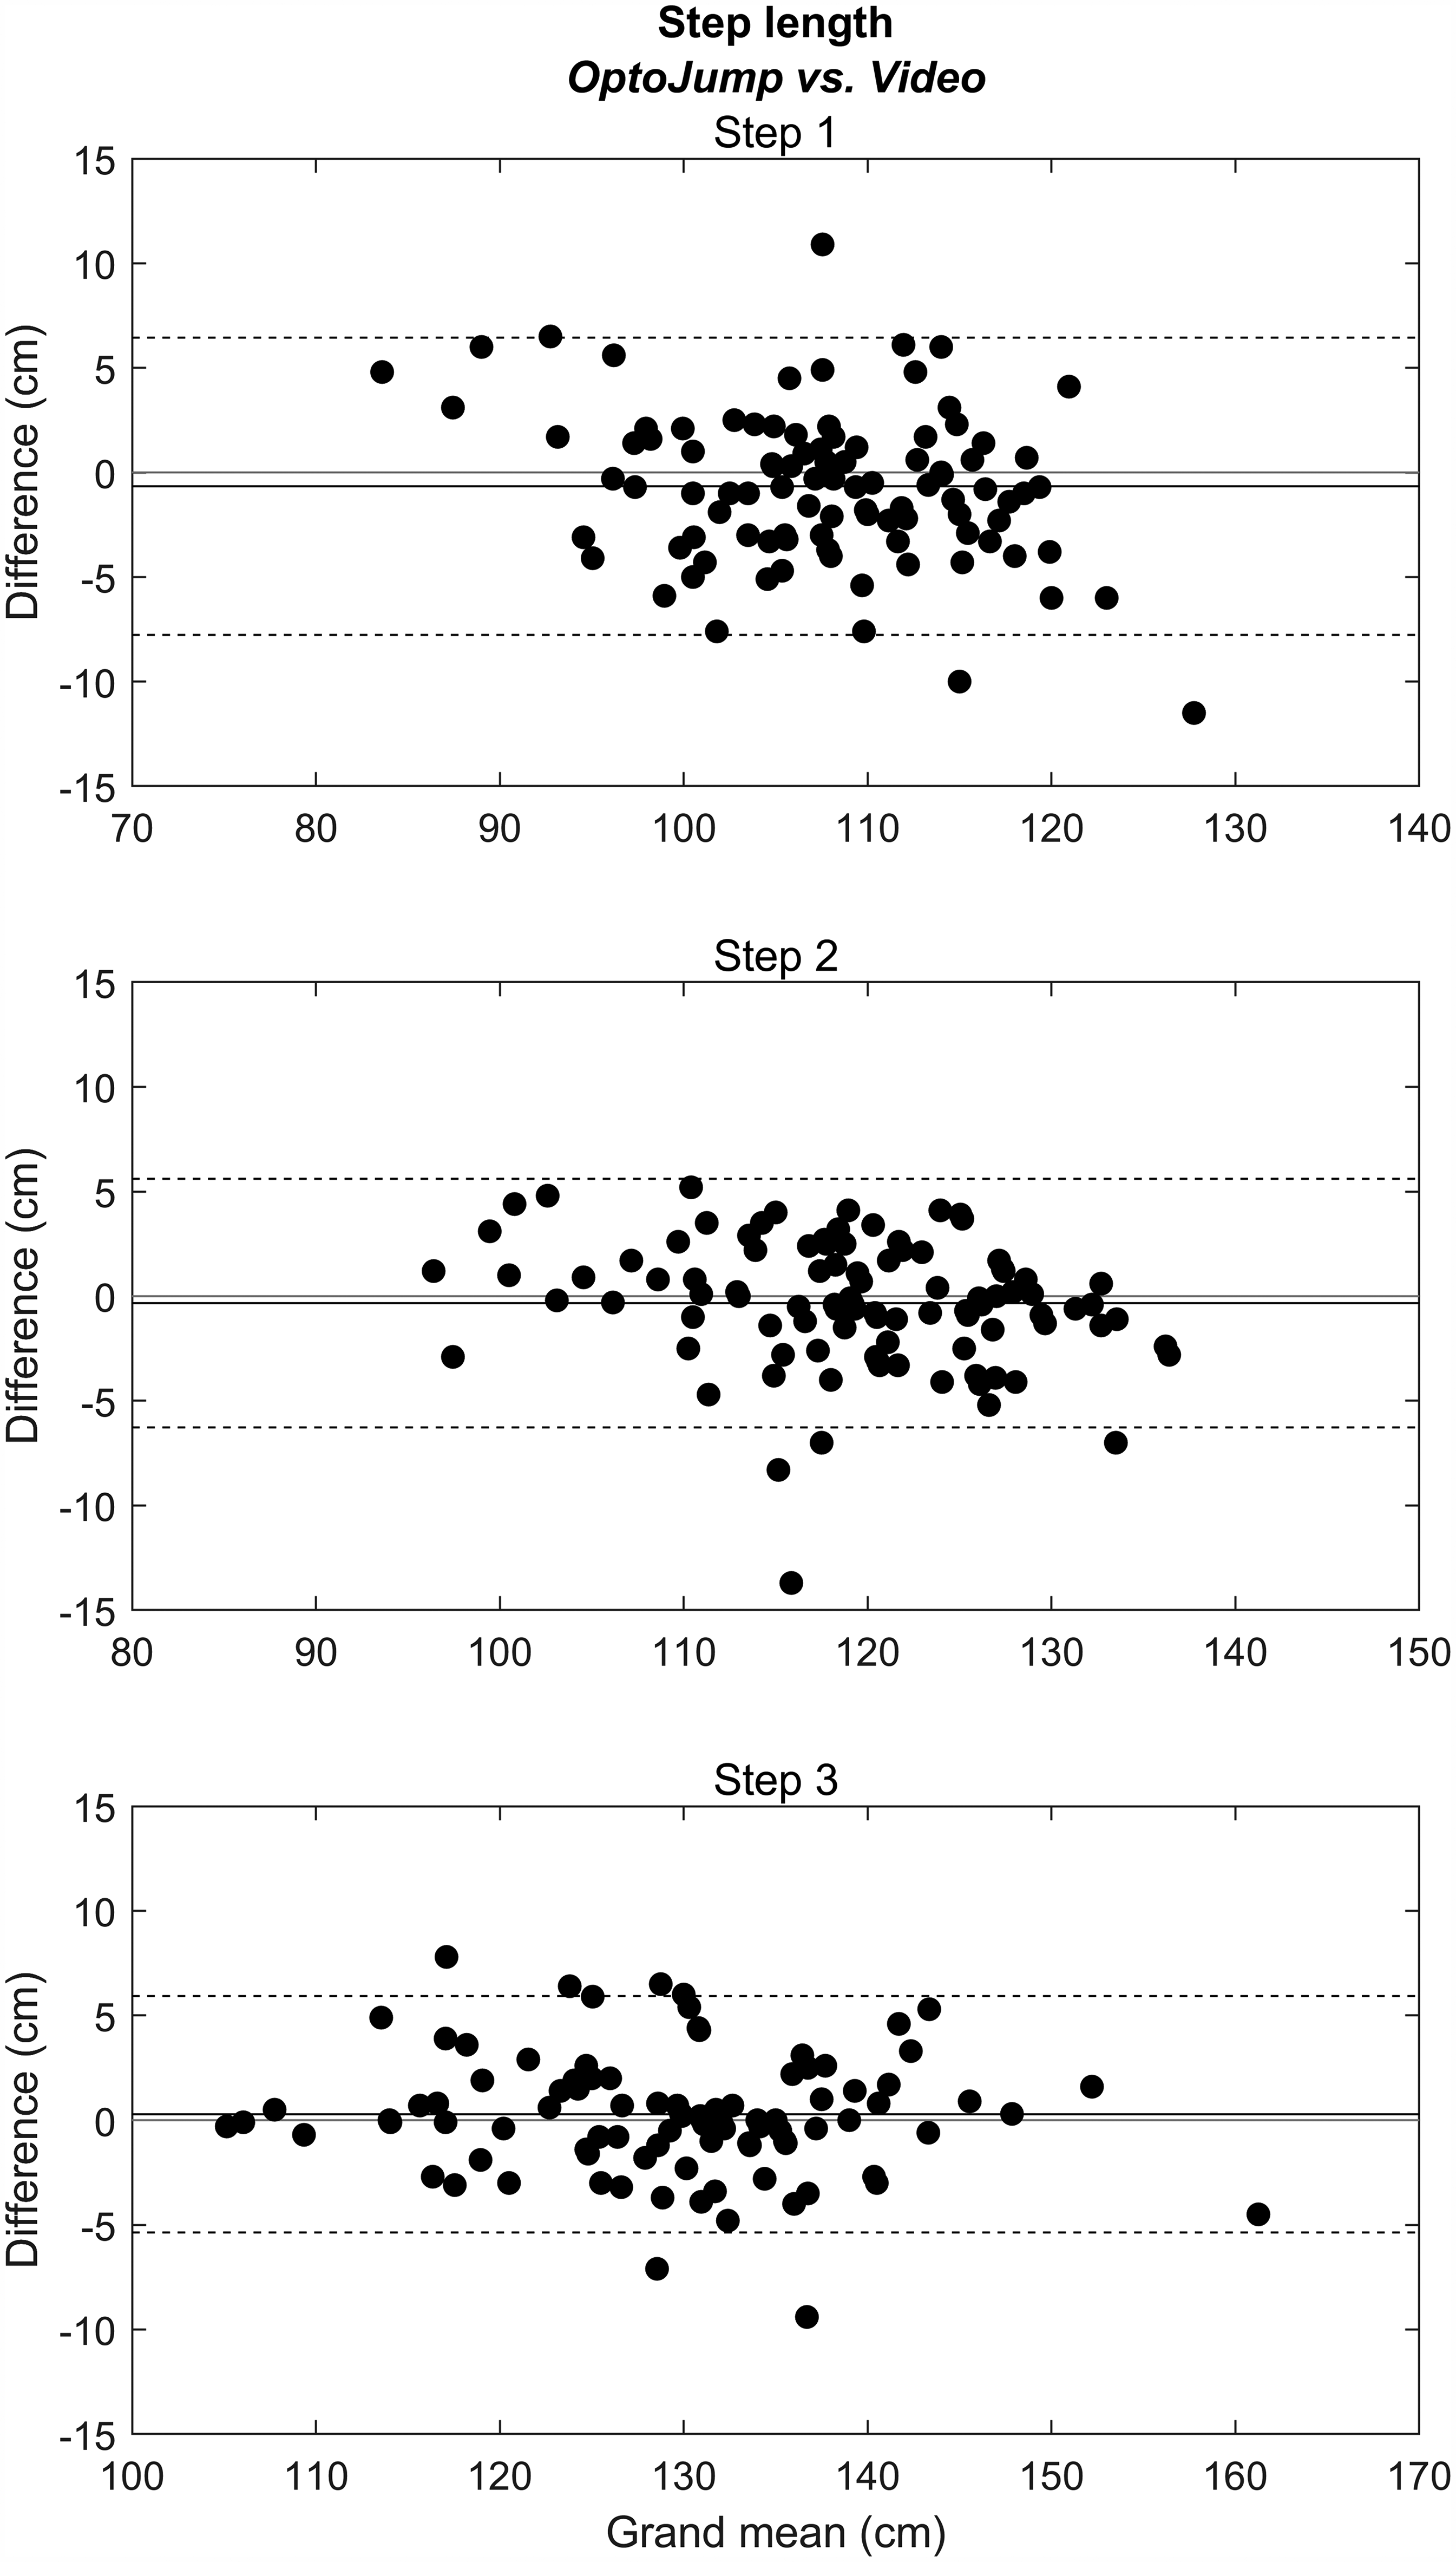
Bland-Altman plots of step length (step 1, 2 and 3) measured by OJ and video. On the Bland-Altman plots, the solid line represents the bias and the broken lines represent the upper and lower 95% LOA.
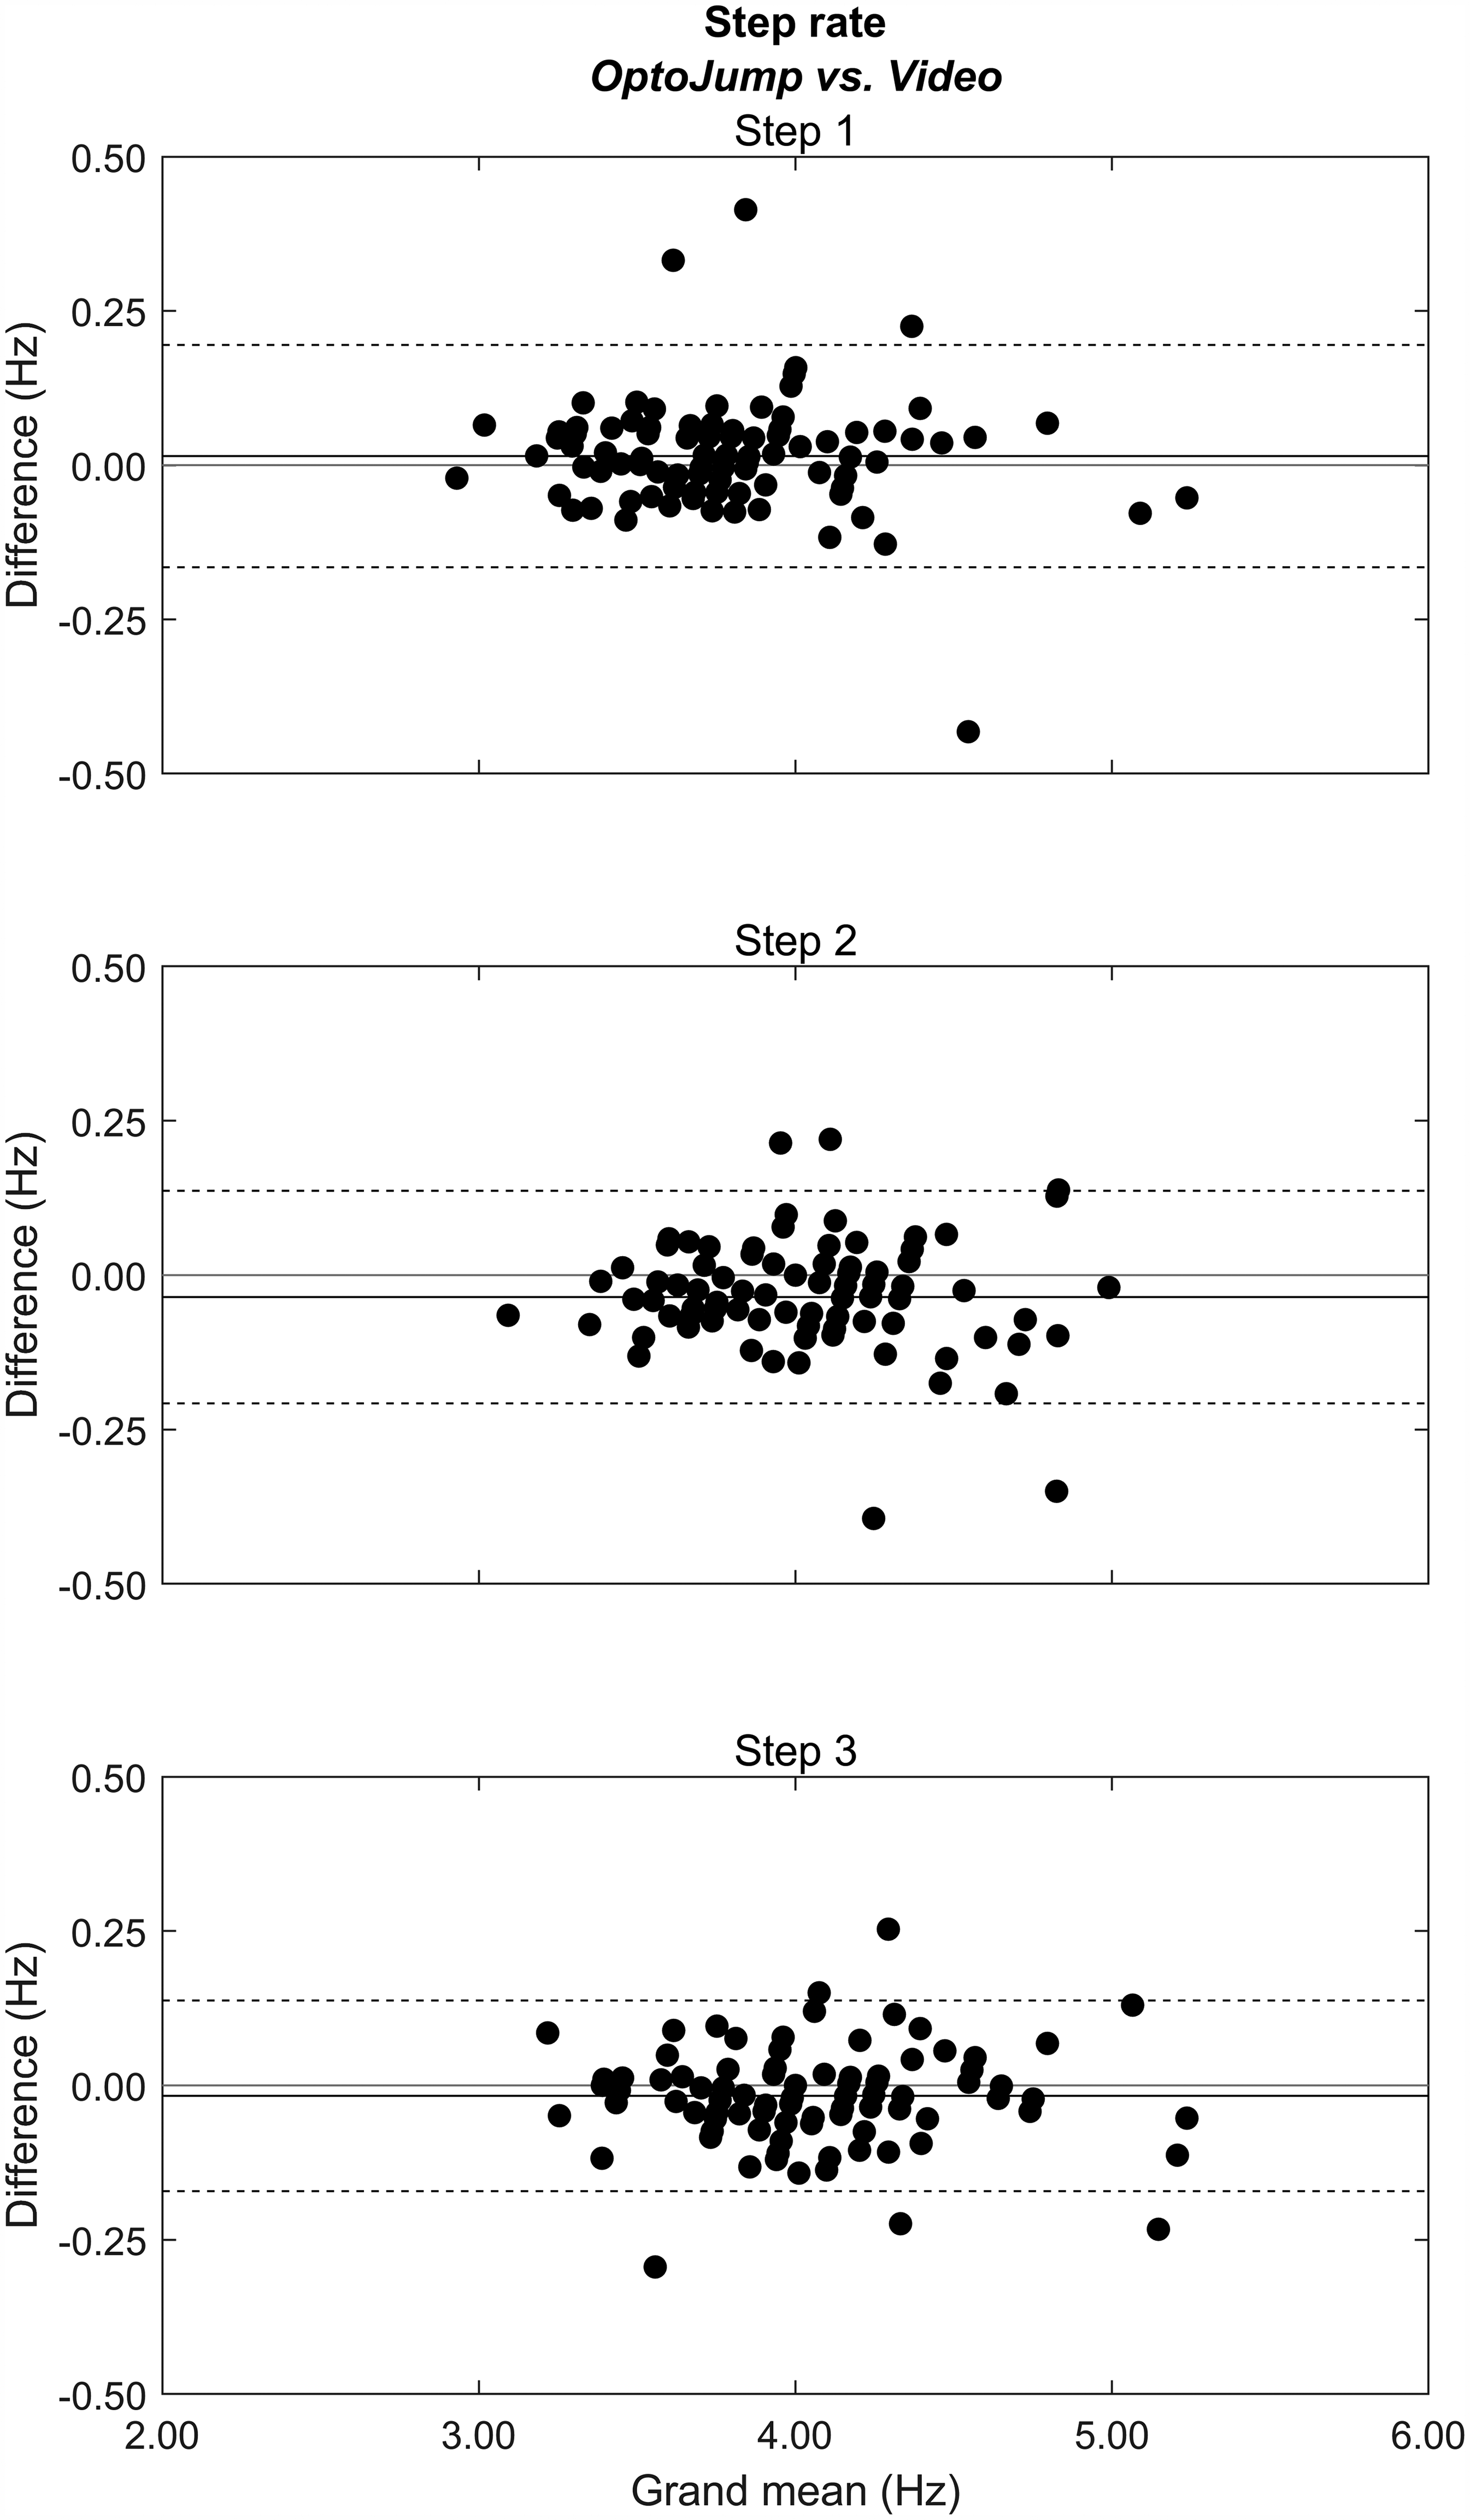
Bland-Altman plots of step rate (step 1, 2 and 3) measured by OJ and video. On the Bland-Altman plots, the solid line represents the bias and the broken lines represent the upper and lower 95% LOA.
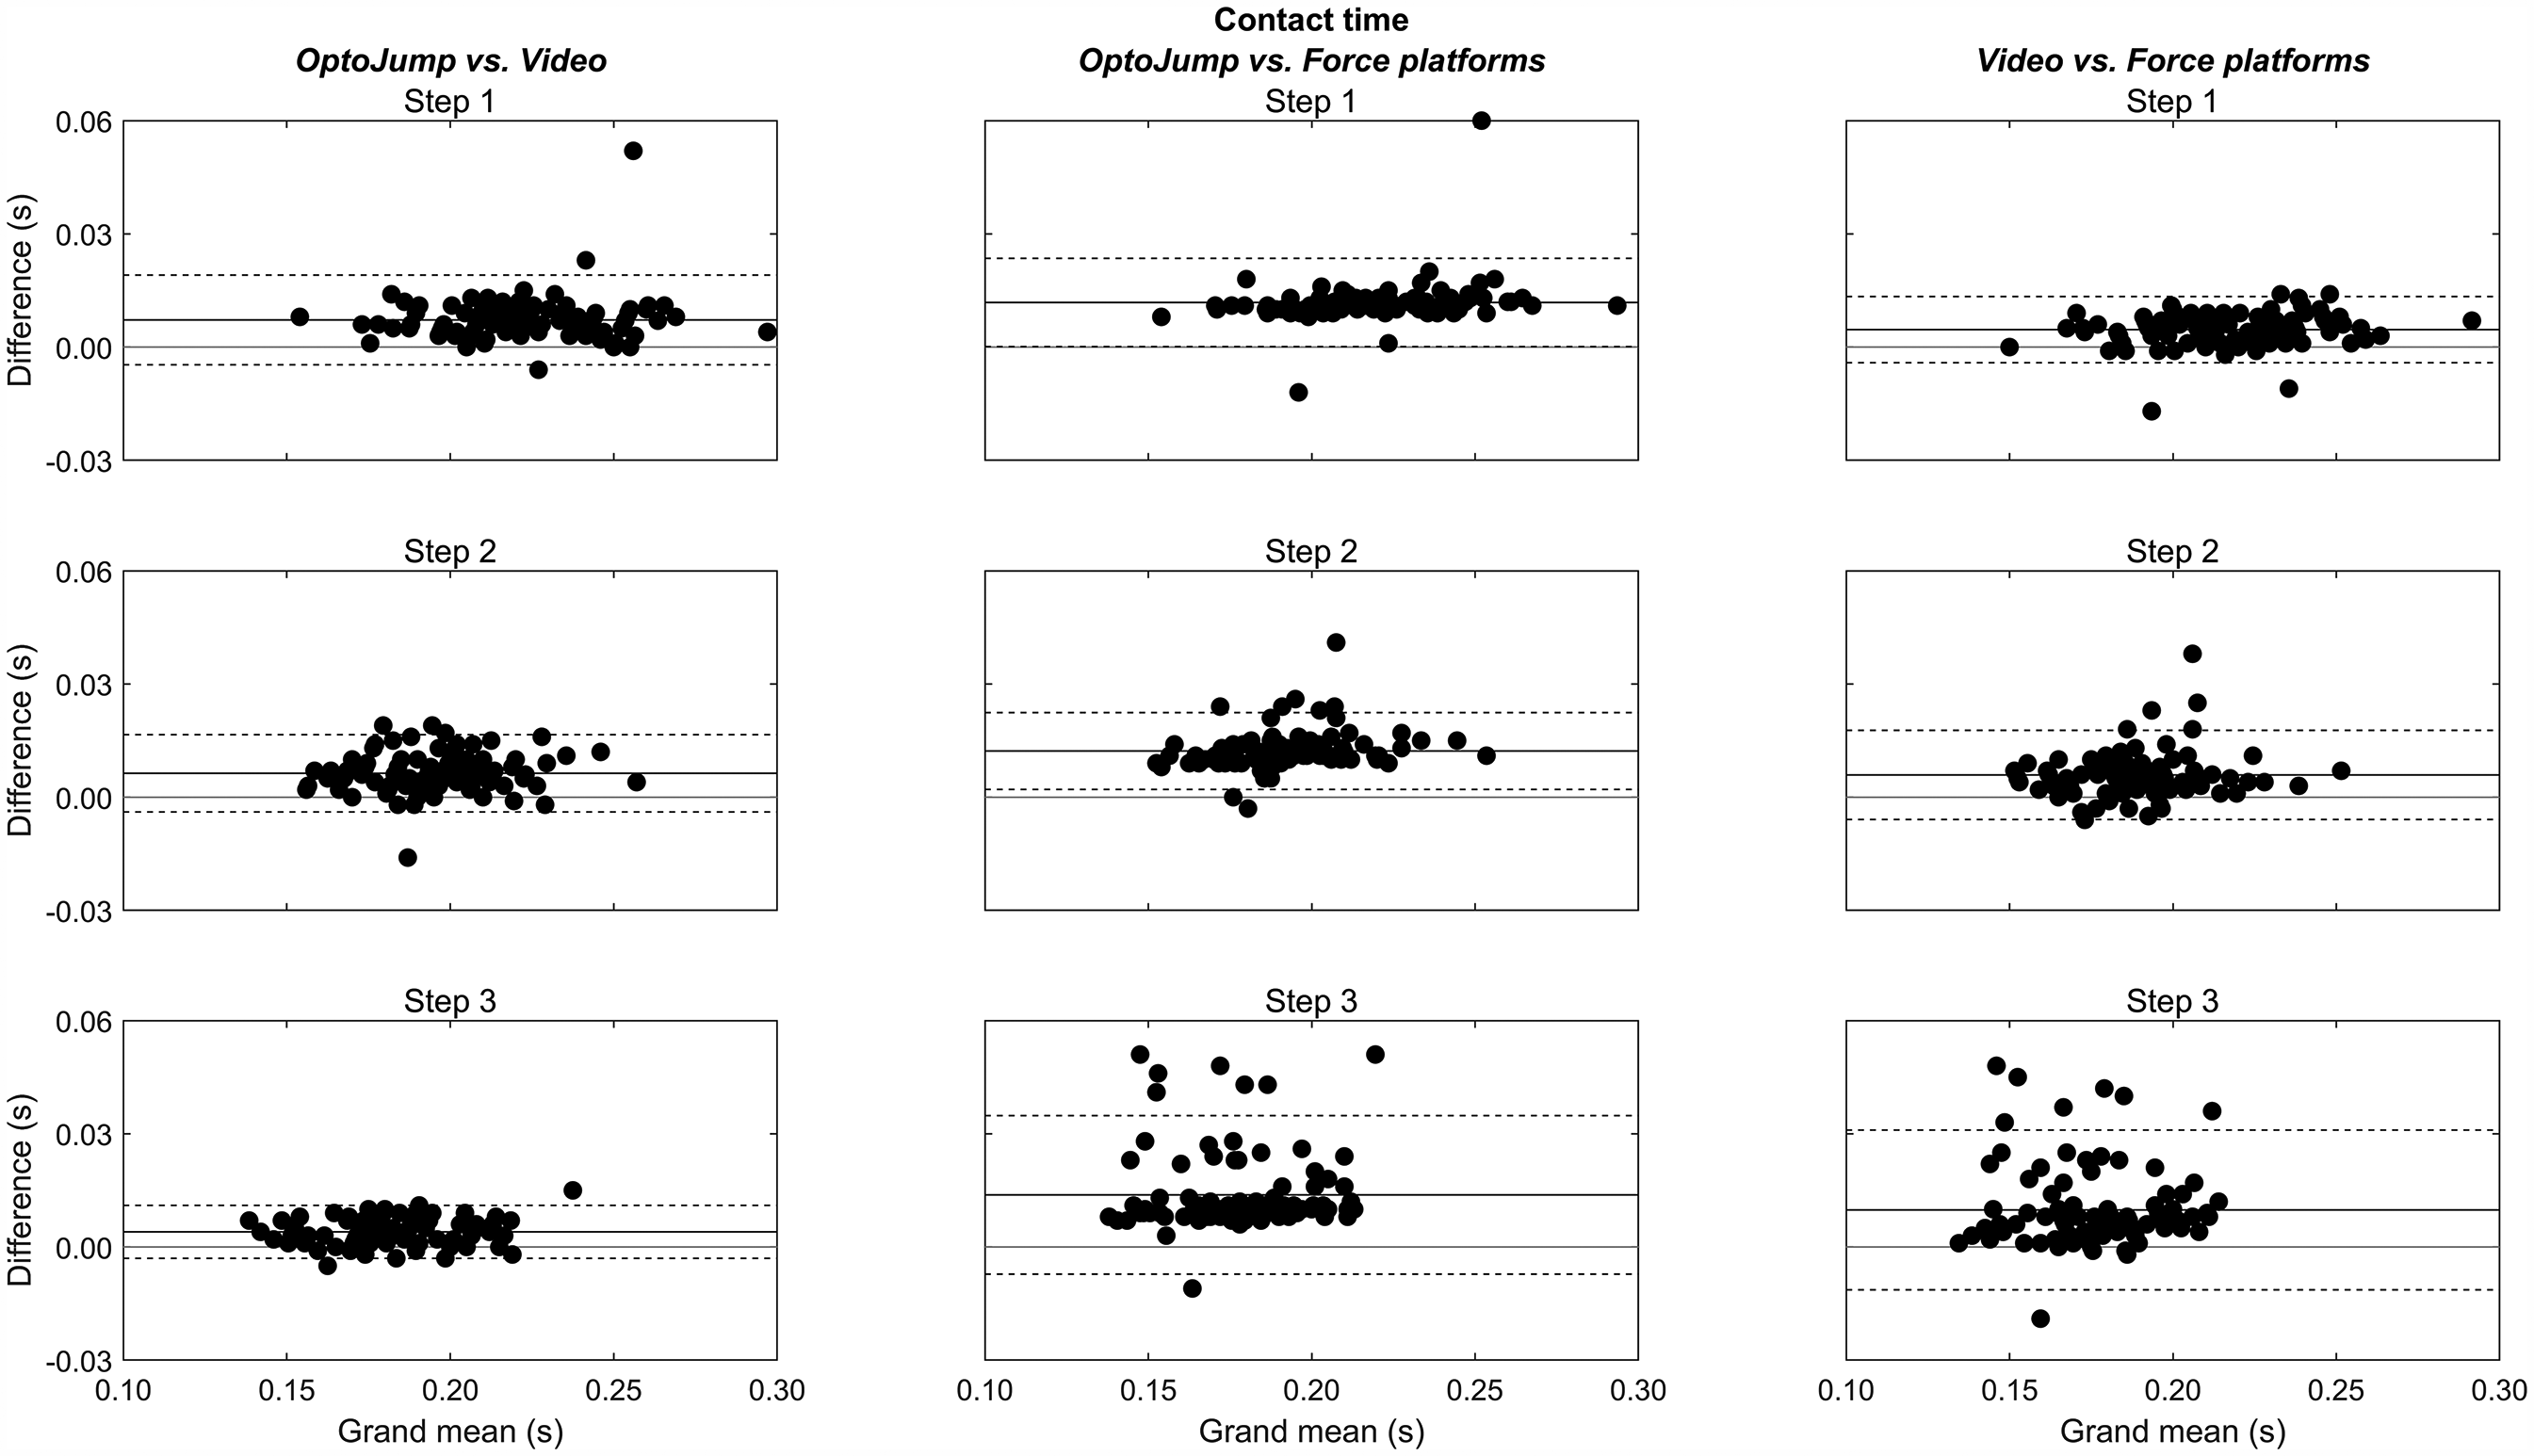
Bland-Altman plots of contact time (step 1, 2 and 3) measured by OJ, video and force platforms. On the Bland-Altman plots, the solid line represents the bias and the broken lines represent the upper and lower 95% LOA.
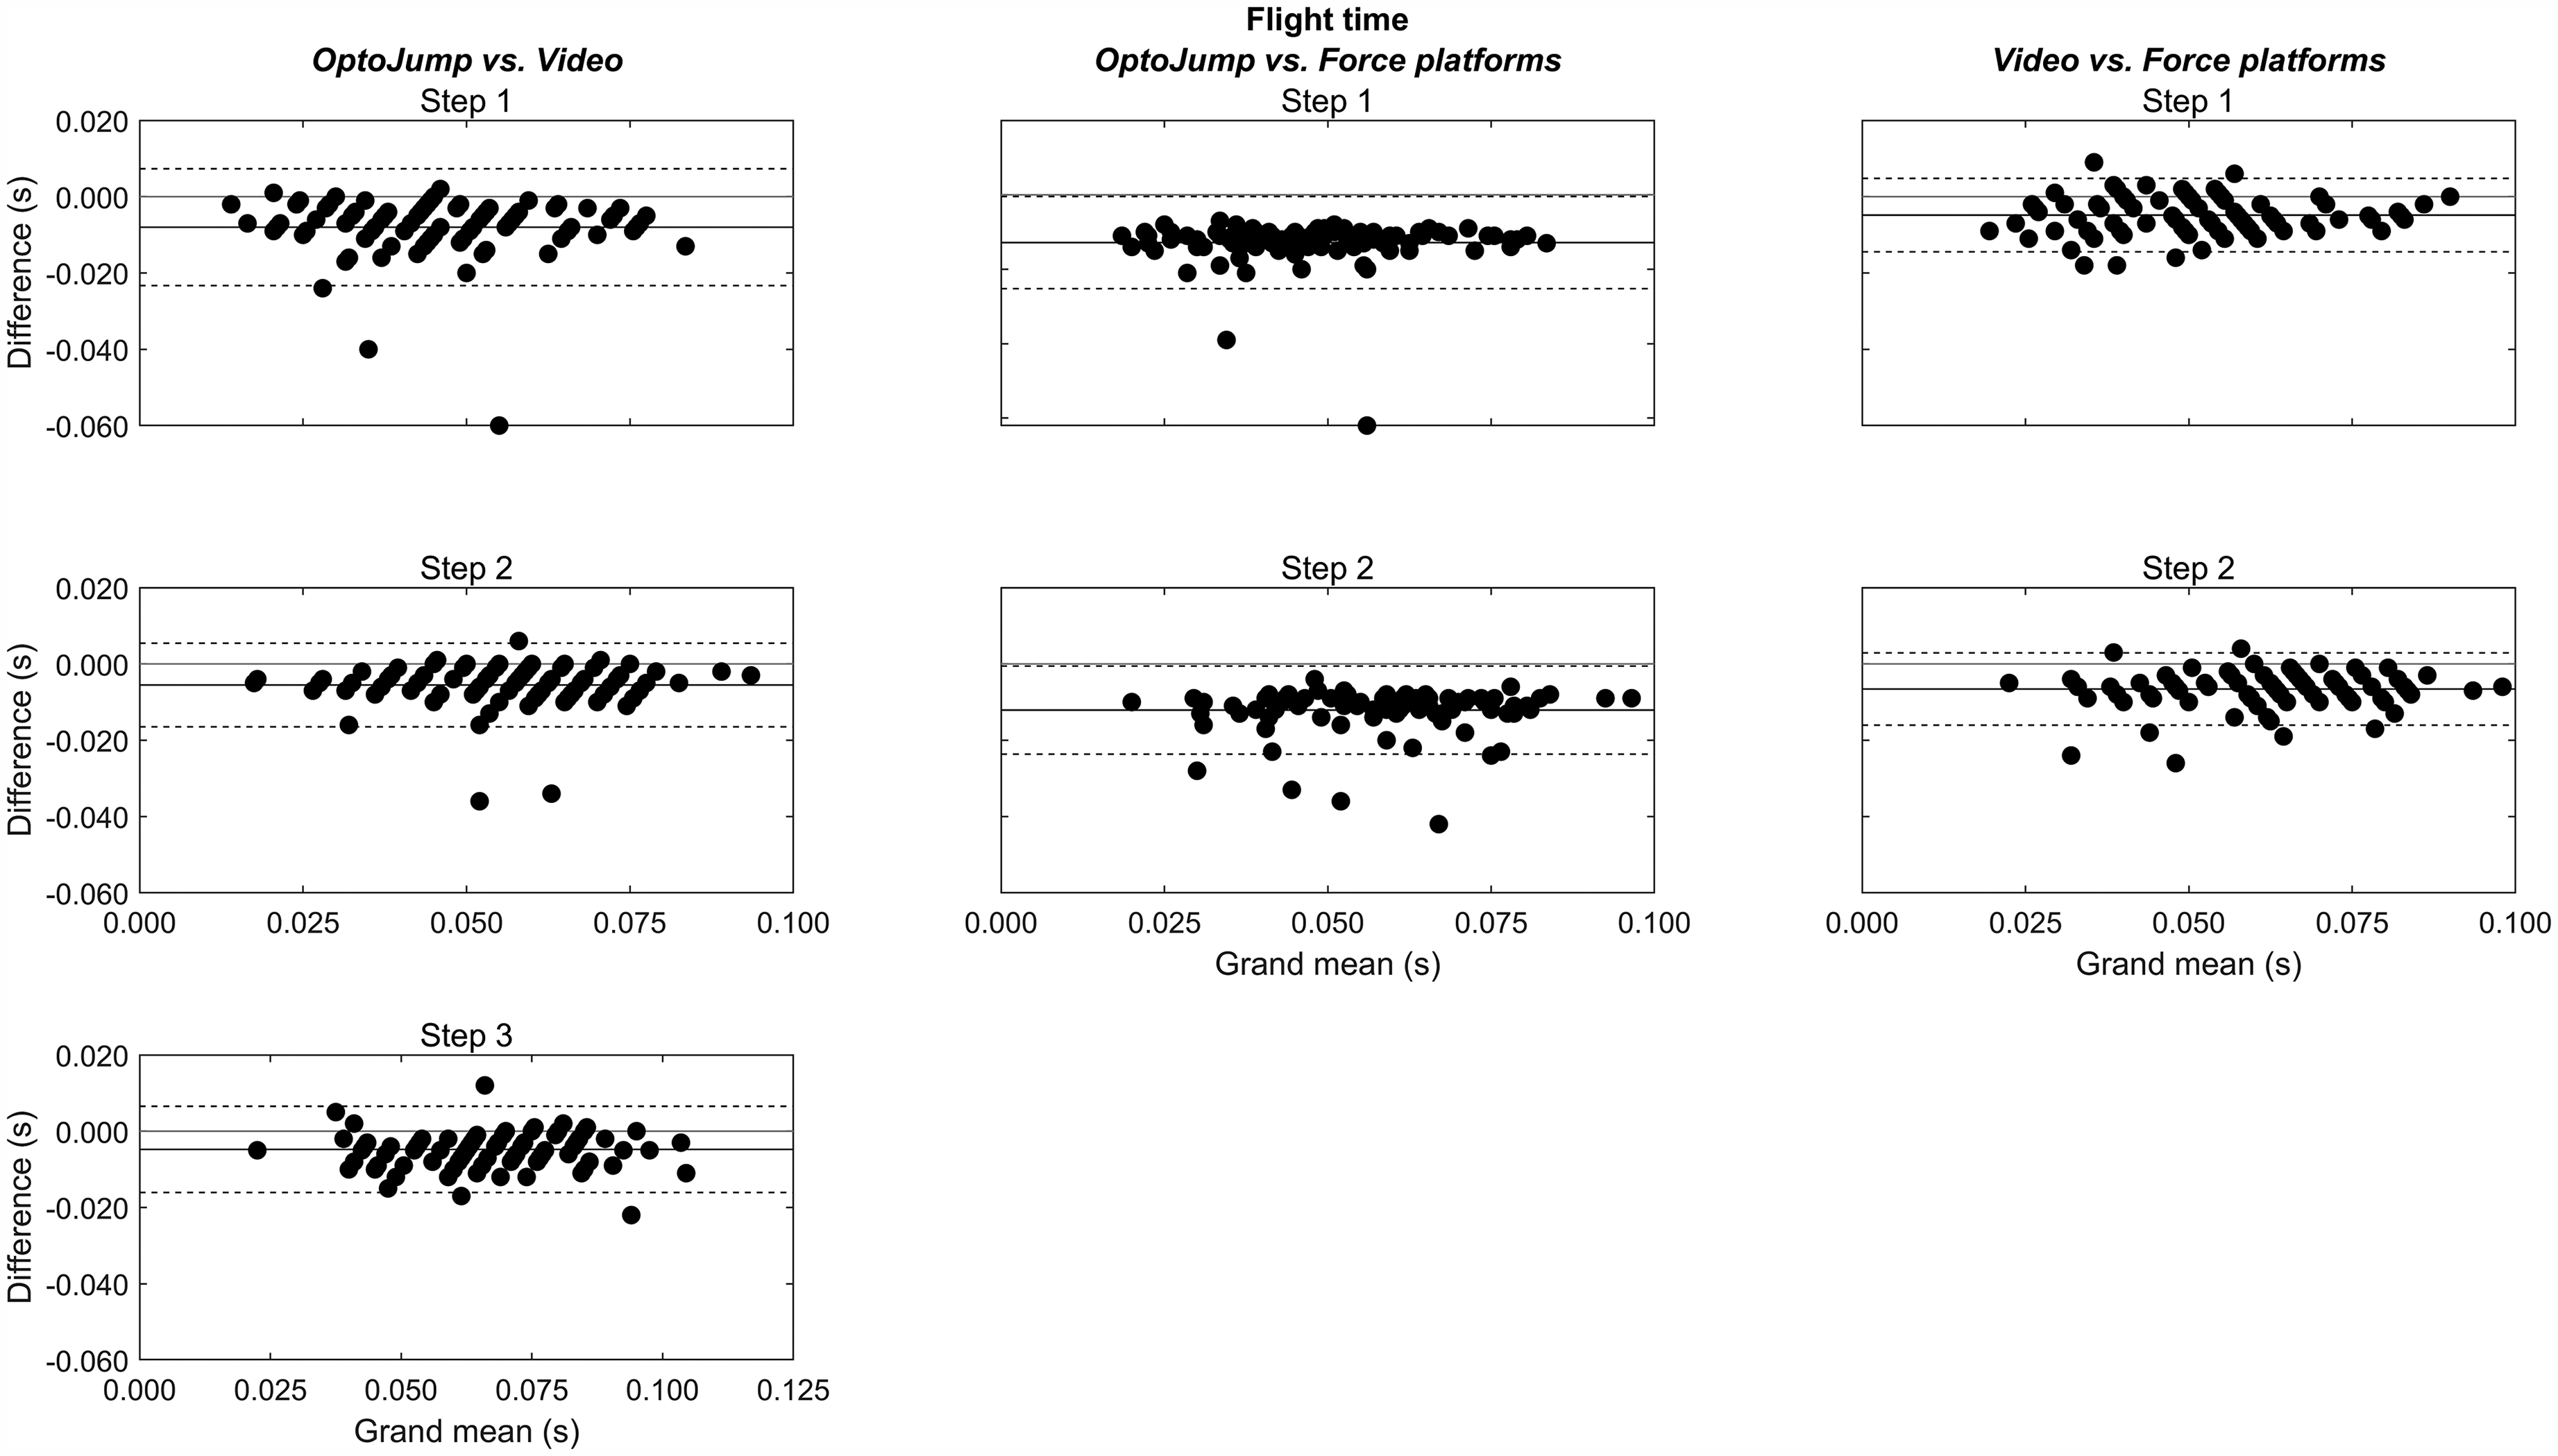
Bland-Altman plots of flight time (step 1, 2 and 3) measured by OJ, video and force platforms. On the Bland-Altman plots, the solid line represents the bias and the broken lines represent the upper and lower 95% LOA.
Discussion
This is one of few studies that has investigated the validity of OJ together with videography for measuring spatiotemporal parameters during gait activities with past research focusing on measurements taken during walking15,17,32 or submaximal running activities16,33,34 albeit with lower sample sizes (≤40 participants). This is the first study to provide information on the validity of spatiotemporal data obtained from the OJ and videography systems during the acceleration phase of sprinting activities. Although some caution is required based on the wide ICC confidence intervals reported for some variables (e.g. Tables 1 and 2), the results demonstrate that OJ showed high agreement with videography for the measurement of SL. For temporal parameters, the agreement between OJ and force platform was low-moderate for the measurement of CT and low for FT, with the OJ consistently overestimating CT and underestimating FT when compared to the force platform method. Since videography demonstrated closer agreement to the force platform system for the measurement of CT (low-high) and FT (moderate-high), coaches and researchers should be mindful that instantaneous temporal data obtained from OJ may be different than data obtained from more time-consuming methods (i.e. videography). In real terms, this means that OJ and videography may have different sensitivities for the detection of longitudinal changes (in spatiotemporal variables) and may produce absolute values (e.g. for athlete characteristisation purposes) that differ in their agreement with more time-consuming methods. As long as the employed measurement methods are consistent, the implications of these difference are likely to be small. Nevertheless, practitioners must balance the time and resources available for monitoring purposes with the desired level of measurement accuracy.
The finding that OJ shows high agreement (bias: −0.007–0.003 m) with videography for the measurement of SL is in agreement with the findings of other investigations that have compared OJ to videography albeit during slower running velocities on a treadmill. 16 In practical terms, practitioners conducting athlete profiling can therefore be confident that SL measurements obtained using OJ are accurate to within a centimetre of those obtained using videography. Considering that the reproducibility of manual digitising in the present investigation was high, the small discrepancies in step length observed between the OJ and video systems likely resulted from differences in spatial resolution or sampling rates of the two systems. Whilst the future use of a higher frame rates in videography may enable a more accurate identification of the key events (e.g. touchdown) which are the constituent parts of spatiotemporal variables, the sampling rate in this investigation (200 Hz) was higher than that available for many digital cameras, is considered to be suitable for the analysis of the early stages of a sprint race and very high sampling frequencies (>500 Hz) are unlikely to be used in sports science practice due to the associated costs, and time-consuming nature of data storage and analysis procedures. Thus, coaches and researchers can be confident that OJ provides fast and accurate step length data that is comparable to that obtained via videography during linear sprint assessments.
Despite the excellent agreement between the OJ and videography for step length measurements, it was apparent that the OJ system systematically overestimates contact time (bias: 0.012–0.014 s) compared to the force platform and that this overestimation is greater than when videography is compared to the force platform system (bias: 0.005–0.010 s). The finding that OJ also consistently underestimates flight time (bias: −0.0012–−0.013 s) is consistent with studies that have reported similar findings during bilateral drop jumping (bias: −0.004 s), 14 walking (bias: −0.010 s) 17 and sub-maximal running (bias: −0.005 s) 34 and the occurrence of this during maximal running trials is to be expected. The discrepancy in flight time between OJ and force platform likely reflects the physical design of the OJ system in that the LEDs are positioned 0.003 m above the floor. This difference likely resulted in an earlier detection of initial ground contact and late detection of toe-off compared to the force platform. 14 This explanation is supported by the close agreement between the OJ and force platform methods when total step time (the sum of contact time and flight time) was considered. It is plausible that the temporal validity of the OptoJump system may have been diminished by the use of the default (0_0) LED setting as reported in previous work.16,17 Whilst practitioners may wish to consider different LED settings and their influence on instantaneous temporal measures, practitioners may be unlikely to adjust these factors in situations where there is limited time for data collection or when OJ is being used for testing different activities (e.g. countermovement jumps, drop jumps). Instead, coaches may wish to adjust for the systematic overestimation of CT (+0.013 s) and underestimation of FT (−0.012 s) in order to obtain sprint spatiotemporal data that aligns to force platforms. This could be achieved using simple correction factors in these cases of systematic bias (e.g. corrected OJ CT = measured OJ CT − 0.013). Additionally, in some cases where a heteroscedastic relationship exists, or when where is an association between the grand mean of the systems and the difference between systems, correction factors using the slope of this relationship could also be used. For example, the association between the grand mean and difference values when comparing OJ and Video step lengths in the first step was weak (r = −0.27) but statistically significant (p = 0.006) (Figure 1). This relationship can be expressed with the linear equation y = −0.123x + 0.126, which could also be used as a correction method for discrepancies in OJ data. In the current study, these relationships were inconsistent between steps and outcome measures, so were not explored further. Nonetheless, the above equation serves as an example for practitioners and researchers seeking to understand methods of correcting for disagreement between OJ and laboratory-based methods of spatiotemporal data collection.
Conclusion
The OJ system provided high agreement with videography for the quantification of step length and step rate, but low-high agreement for the quantification of contact time and flight time during the early acceleration phase of sprinting. Despite the quicker availability of results using OJ when compared to videography, coaches and researchers should be mindful that instantaneous temporal data obtained from OJ may be different than data obtained from more time-consuming methods (i.e. videography) that can be used in non-laboratory settings. When OJ was compared with the force platform method, contact time was over-estimated and flight time was underestimated with these differences being larger than when videography was compared to the force platform. Coaches wishing to characterise the temporal characteristics of an athlete's running performance are therefore advised to be consistent with the type of measurement system they opt to use with their athletes. Nevertheless, the present data provides the information needed for practitioners to realign data obtained from OJ with that measured using videography or force platforms. Finally, the present findings emphasise the need for researchers to utilise the best available methods (e.g. force platforms) to validate other non-laboratory measures of spatiotemporal variables (e.g. phone applications) when these are accessible.
Footnotes
Declaration of conflicting interests
The authors declared no potential conflicts of interest with respect to the research, authorship, and/or publication of this article.
Funding
The authors disclosed receipt of the following financial support for the research, authorship, and/or publication of this article: The study was funded by the Carnegie School of Sport, Leeds Beckett University.