
Abstract
Monitoring sprint distance is commonplace in Australian Rules football (ARF). Thresholds are programmed as a percentage of maximum speed (Vmax), however day-to-day variation has not been considered. The aim of this study was to determine the day-to-day variation in Vmax, jump height, power, and strength in male, talent-identified ARF athletes. Twenty-three male, ARF athletes (age = 16.6 ± 0.64 years, height = 179.4 ± 9.1 cm, mass = 73.4 ± 8.4 kg) completed a countermovement jump, isometric mid-thigh pull, and 40-metre sprint on three occasions within a 7-day period, separated by 48-h recovery periods. Descriptive statistics, repeated measures ANOVAs, and general linear regressions were used to analyze the data. Vmax declined progressively (ηP2 = 0.586, CV = 5%) between session one (31.8 ± 1.5km⋅h−1), two (30.8 ± 1.2km⋅h−1), and three (30.0 ± 1.3km⋅h−1). No differences were observed for jump height (47.4 ± 5.0 cm), peak force (2981 ± 518N), or net peak force (2047 ± 444N⋅kg−1). Jump height, peak force, and net peak force did not predict Vmax in session 1, session 2, or session 3. Individual changes in Vmax exceeded 5% in 10 instances. The Vmax is outside the typical error for measurement and indicative of the variation in Vmax. The lack of predictive power demonstrated by strength and power variables is evidence of the technical considerations associated with sprinting. Practitioners should consider the variation in Vmax when monitoring training load in field sports. The variation suggests that programming thresholds based upon a single recording of Vmax may incorrectly describe the true amount of high-speed and sprint running completed.
Introduction
Australian Rules football (ARF) is an invasion sport characterised by repeated high-intensity activities such as high-speed running (HSR), sprinting, jumping, and tackling interspersed by periods of lower intensity jogging, walking, or standing. 1 Load monitoring is commonplace at the elite level of ARF 1 and consistently used as a part of wider physical preparation program 2 to enhance performance and reduce the risk of injury. 3 Several studies have used similar metrics for load monitoring, including distance covered, HSR distance, or sprint distance.4–6 Practitioners acknowledge that some of these metrics are more important than others, 7 such as HSR and sprinting metrics due to their association with lower-limb soft-tissue injury.8–10 Nevertheless, a recent systematic review concluded that there is there is no clear consensus of the most appropriate threshold to classify either high-speed running, or sprinting in a football setting, 11 yet practitioners in professional ARF have used relative speed thresholds of 85% of maximum velocity (Vmax). 2 The volume of HSR and sprinting above this respective Vmax threshold is used to monitor and prescribe training loads. For example, if an athlete performs too much HSR then the volume prescribed in future training can be limited. Conversely, too little volume can result in athletes performing “top-up” running at the end of training sessions to ensure the desired training load is completed.
Literature examining HSR and sprinting load has focused on the injury risk associated with spikes in acute training load when compared to the chronic training load.8,12,13 However, none of these studies have considered the possibility of daily variation in maximum running speed when collating and analysing data. As such, it is currently unknown whether Vmax for a field sport athlete on a given day is consistent across multiple sessions in a microcycle. From a reductionist perspective, Vmax is heavily dependent on lower body strength and lower body power 14 ; two qualities with established day-to-day variability (∼5% and ∼10%, respectively).15–17 Therefore, training load practices based on a percentage of Vmax may result in an erroneous classification of HSR and sprinting if the variation is similar to that associated with strength and power qualities. Conceptually, an athlete's assumed 85% Vmax could in fact correspond to 80%Vmax on a given day; which would result in an overestimation of the HSR training load. Establishing the day-to-day variation for an athlete could improve monitoring and training practices, which in turn could improve the performance and injury risk associated with field sports.
Practitioners could reassess Vmax frequently, however, the assessment of Vmax is considered high-risk for lower limb injury. 18 Athletes could perform a low-risk objective assessment before training to inform and autoregulate exercise intensity, which is an effective tool in gym-based resistance training sessions.19,20 Based upon the importance of strength and power for sprinting,14,18 low-risk measures such as a countermovement jump (CMJ) may be able to offer a similar regulatory process for the monitoring of HSR and sprint load. Further investigation of the predictive qualities is warranted, particularly as the potential for improved monitoring of practice may reduce injury and improve performance.
The primary aim of this study is to establish the day-to-day variation in Vmax in talent identified ARF athletes. A secondary aim will be to establish whether lower body power and lower body force production are predictive of the Vmax in this population. It is hypothesised that Vmax will be significantly different between testing sessions, largely attributed to the previous documented variation in strength and power qualities. Furthermore, the authors hypothesise that lower body power and strength measures will share a significant correlation. The results of this investigation will apply to sport scientists who prescribe and monitor sprint training load across a field sport setting with a high-speed running component.
Materials & methods
Study design
This project utilised a repeated-measures, observational design. Participants completed three testing sessions across a 7-day period, each separated by at least 48 hours. All testing sessions were completed at the same time of day ± 2 h. Each testing session consisted of a standardised warm-up followed by an Abalakov CMJ assessment, an Isometric Mid-Thigh Pull (IMTP) assessment, and a 40-metre sprint. Participants were encouraged to maintain their usual diet and activity throughout the study. During this microcycle, technical training sessions occurred thrice per week and resistance training sessions occurred twice per week. Technical sessions were predominantly skilled-based sessions lasting 70–100 min, and resistance training sessions were strength focussed and between 45–60 min in duration. This project received ethical approval from the Institutional Ethics Committee (Approval Number: 2022-168F).
Participants
Twenty-three male, talent-identified, ARF athletes (age = 16.6 ± 0.64 years, height = 179.4 ± 9.1 cm, mass = 73.4 ± 8.4 kg) were recruited to complete this study. All participants (and parents/guardians) were verbally informed and provided with a written copy of all potential risks and benefits, and each signed an institutionally approved informed consent form. All subjects were free from any musculoskeletal or neuromuscular injuries that would have affected their ability to perform the required tests.
Testing protocols
Prior to testing, all athletes completed a 10-min warm-up protocol consisting of a slow jog and series of dynamic stretches delivered by the team's strength and conditioning coach. The athletes then completed an Abalakov CMJ followed by an IMTP, and then they completed a 40-meter sprint test. All test protocols were regularly programmed into the athletes’ team-based strength and conditioning sessions and thus participants were adequately familiarised with each test.
The Abalakov CMJ begin with three warm-up jumps that increased incrementally between 50% to 100% of perceived maximal ability. The Abalakov jump was chosen over the traditional CMJ due to specificity to Australian Football testing protocols and athlete familiarity. Athletes then performed a previously established protocol of three CMJs on dual uniaxial force plates (ForceDecks; VALD Performance, AUS).21,22 The greatest jump height produced during each testing occasion was retained for analysis. Trials were repeated if the CMJ was performed incorrectly.
To prepare for the IMTP assessment, athletes completed 5-s warm-up trials at 50% and 75% perceived maximum ability. One maximal 5-s IMTP was performed with strong encouragement to facilitate a maximum effort. Peak force and net peak force were recorded. A previously established protocol 23 was implemented to collect this data using dual uniaxial force plates (ForceDecks; Vald Performance, QLD, AUS). Athletes stood and grasped a barbel affixed to a non-compliant metal chain. Wrist straps were worn to mitigate the effect of grip strength on the execution of the assessment. The athlete's position was standardised using a goniometer and fabricated stencil to measure and alter hip and knee joint angles within best practice guidelines. 23 Notably, ForceDecks have previously demonstrated good reliability for power and strength metrics.24,25
Sprint testing began with four to five progressively faster 40-metre efforts between 50% to 95% of maximal effort. Following this, athletes performed two maximal 40-metre sprints, separated by 4-min of passive recovery. The highest Vmax was retained for analyses. Peak running speed was recorded from velocity-time data measured using radar device sampling at 46.7 Hz (Stalker ATS II; Applied Concepts, Dallas, TX). The radar device was positioned on a tripod 10-metres behind the start line at a height of 1-metre, corresponding approximately to the height of the subject's centre of mass.26,27 To reduce potential interference, the sprint was aligned in a way that no objects would interfere in the background, whilst error associated with manual operation was removed by using Stalker ATS software (version 5.0.2.1; Applied Concepts) on a connected laptop. The intraday reliability of the technology to measure velocity and split times have been previously confirmed.26,28 All sprints were performed on a consistent, flat, dry grass surface, and athletes were instructed to use their normal running shoes on each occasion. To minimise the influence of the wind on athlete's speed, the start and finish lines were positioned so that the sprint was performed with a cross wind. Wind speed and temperature was recorded for each of the testing sessions using a pocket anemometer.
Statistical analyses
A priori calculation identified a sample size of 20 participants provides the necessary power to detect effect size (ƒ) of 0.3 (α=0.05, β=0.80) using a one-way repeated measures analysis of variance (ANOVA). Descriptive statistics and the coefficient of variation (CV%) were collated for all three testing days. Before analyses, all data were checked for normality (Shapiro-Wilk test) and equal variance (Levene's test) requirements for parametric testing. Separate one-way repeated measures ANOVAs with post-hoc Bonferroni corrections were used to assess differences in Vmax, CMJ jump height, IMTP peak force, and net IMTP peak force. Partial eta squared (ηP2) was used to calculate effect size repeated measures ANOVAs and interpreted with customary thresholds (small effect; ηP2 ≥ 0.01, medium effect; ηP2 ≥ 0.06, large effect; ηP2 ≥ 0.14). Hedge's g was calculated to describe the differences between Session 1 to Session 2, Session 2 to Session 3, and Session 1 to Session 3. This was interpreted with thresholds for strength training research (trivial effect; g < 0.35, small effect; g ≥ 0.35, moderate effect; g ≥ 0.80, large effect; g ≥ 1.5). 29 Multiple linear regressions were used to assess if CMJ jump height, IMTP peak force, and net IM peak force predicted Vmax on session 1, session 2, or session 3. Significance level was set at p ≤ 0.05 with all analyses completed using the statistical software SPSS v29 (Armonk, NY: IBM Corp) and Jamovi v2.3.30–32 Data are presented as mean ± standard deviation.
Results
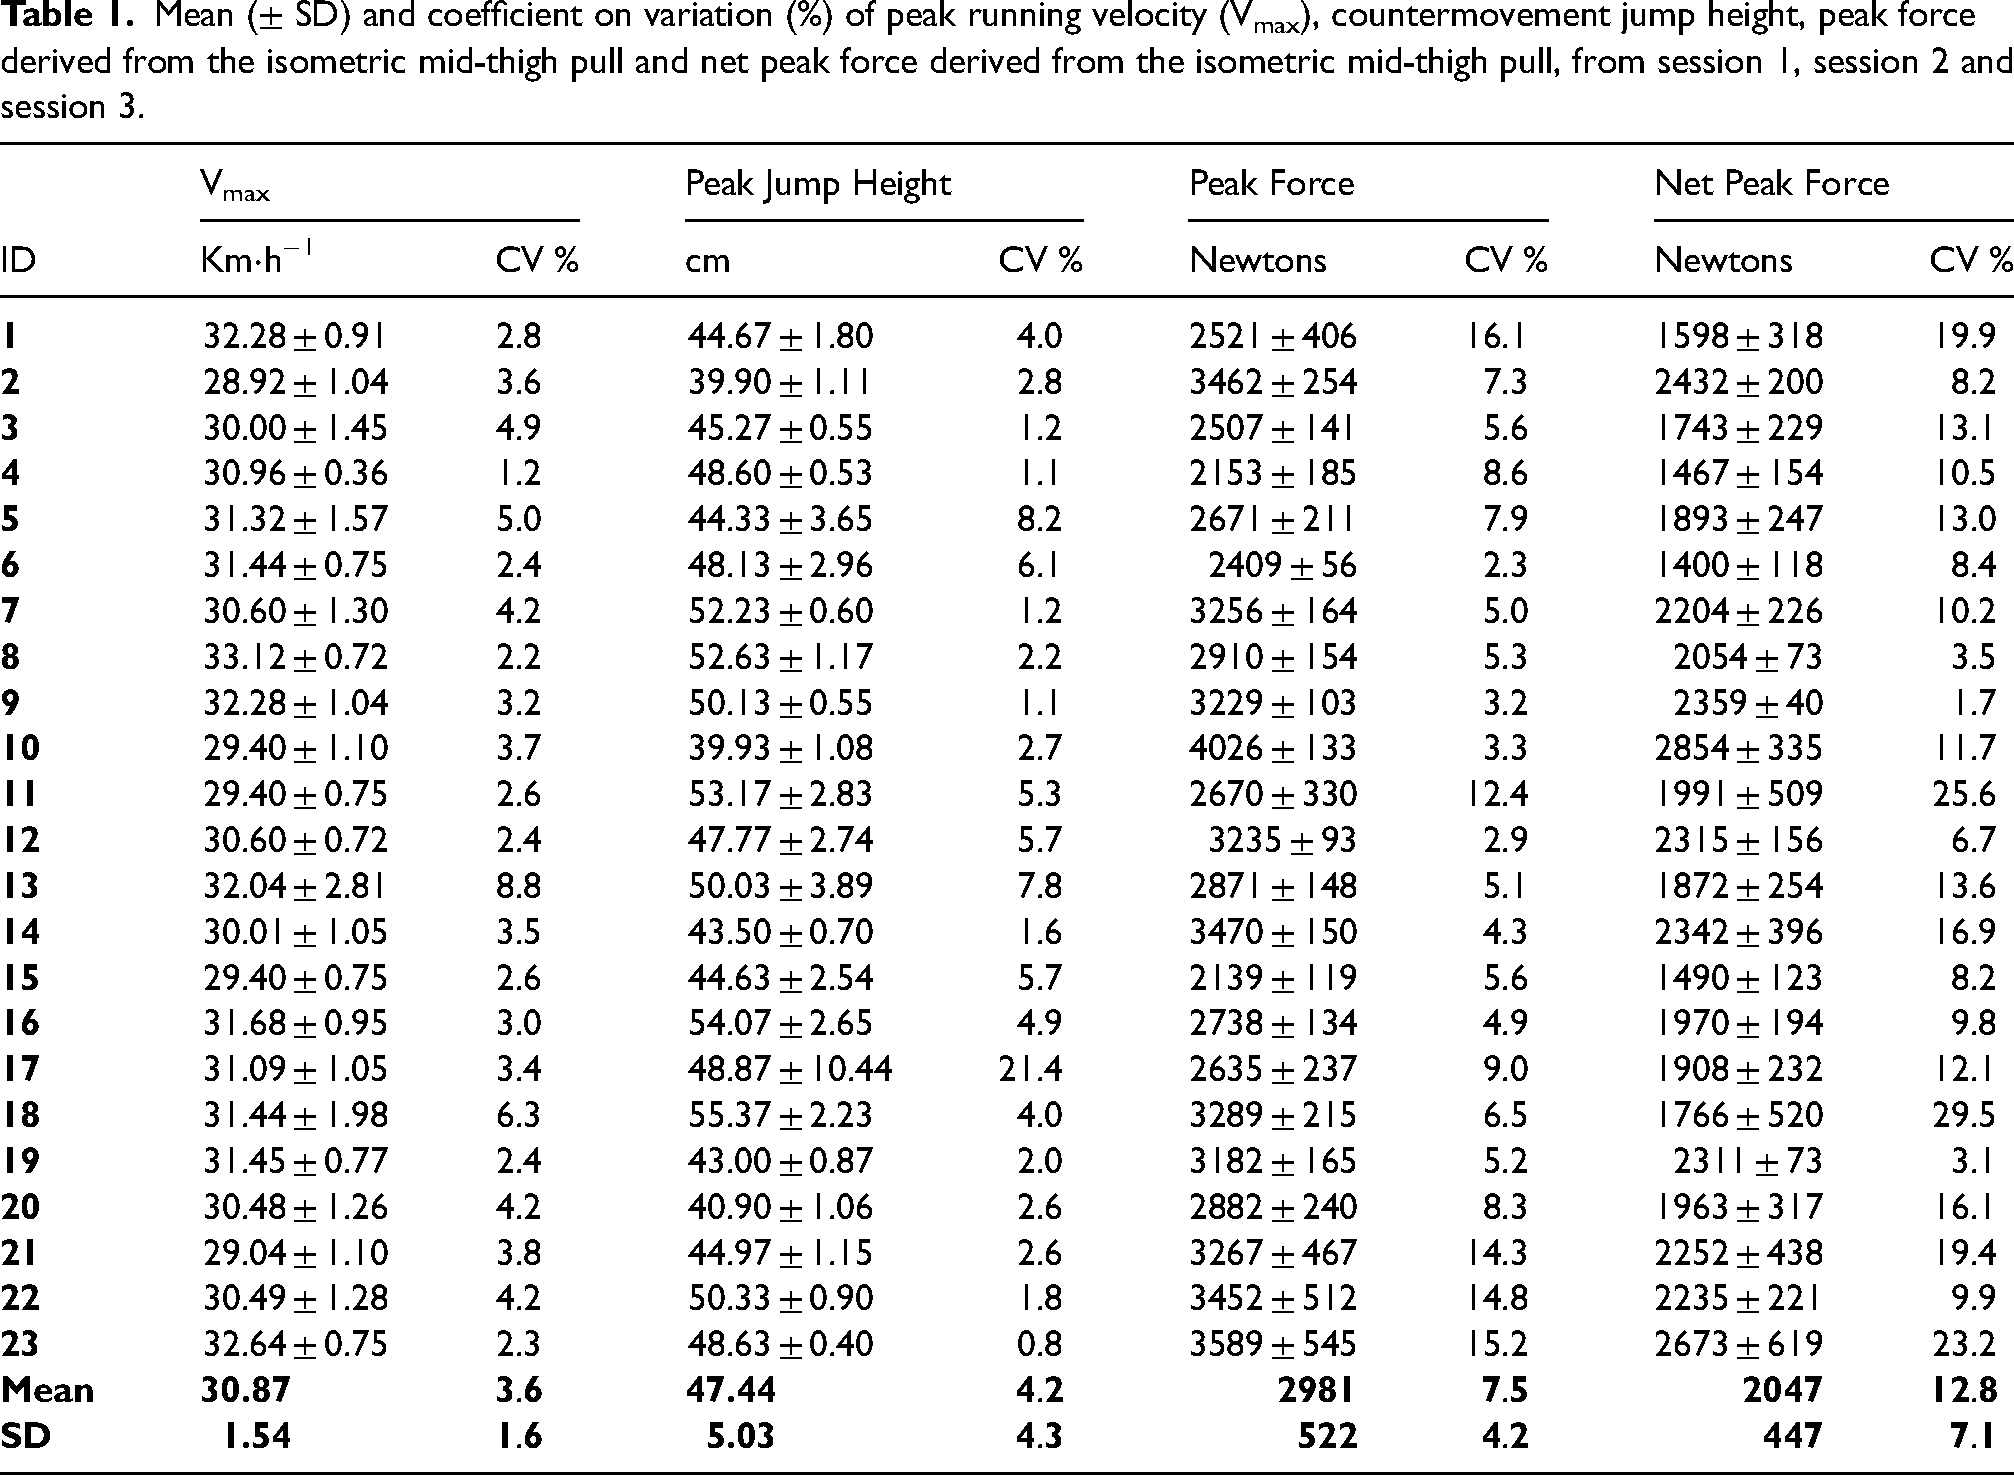
Descriptive statistics from all session of the mean Vmax, jump height, peak force and net peak force, alongside the CV for each participant are outlined in Table 1.
Mean (± SD) and coefficient on variation (%) of peak running velocity (Vmax), countermovement jump height, peak force derived from the isometric mid-thigh pull and net peak force derived from the isometric mid-thigh pull, from session 1, session 2 and session 3.
Peak velocity displayed a main effect between testing sessions (F(2,44) = 31.10, p < .001, ηP2 = 0.586). Peak velocity of session 1 (Figure 1(a)) was greater compared to session 2 (p = .003, g = 0.73) and session 3 (p < .001, g = 1.30); and session 2 was greater compared to session 3 (p = .003, g = 0.62). No differences were observed for jump height (F(2,44) = 2.28, p = .114, ηP2 = 0.094), peak force (F(2,44) = 0.31, p = .734, ηP2 = 0.014) or net peak force (F(2,44) = 0.01, p = .990, ηP2 = 0.000). The spread of data is presented in Figure 1.
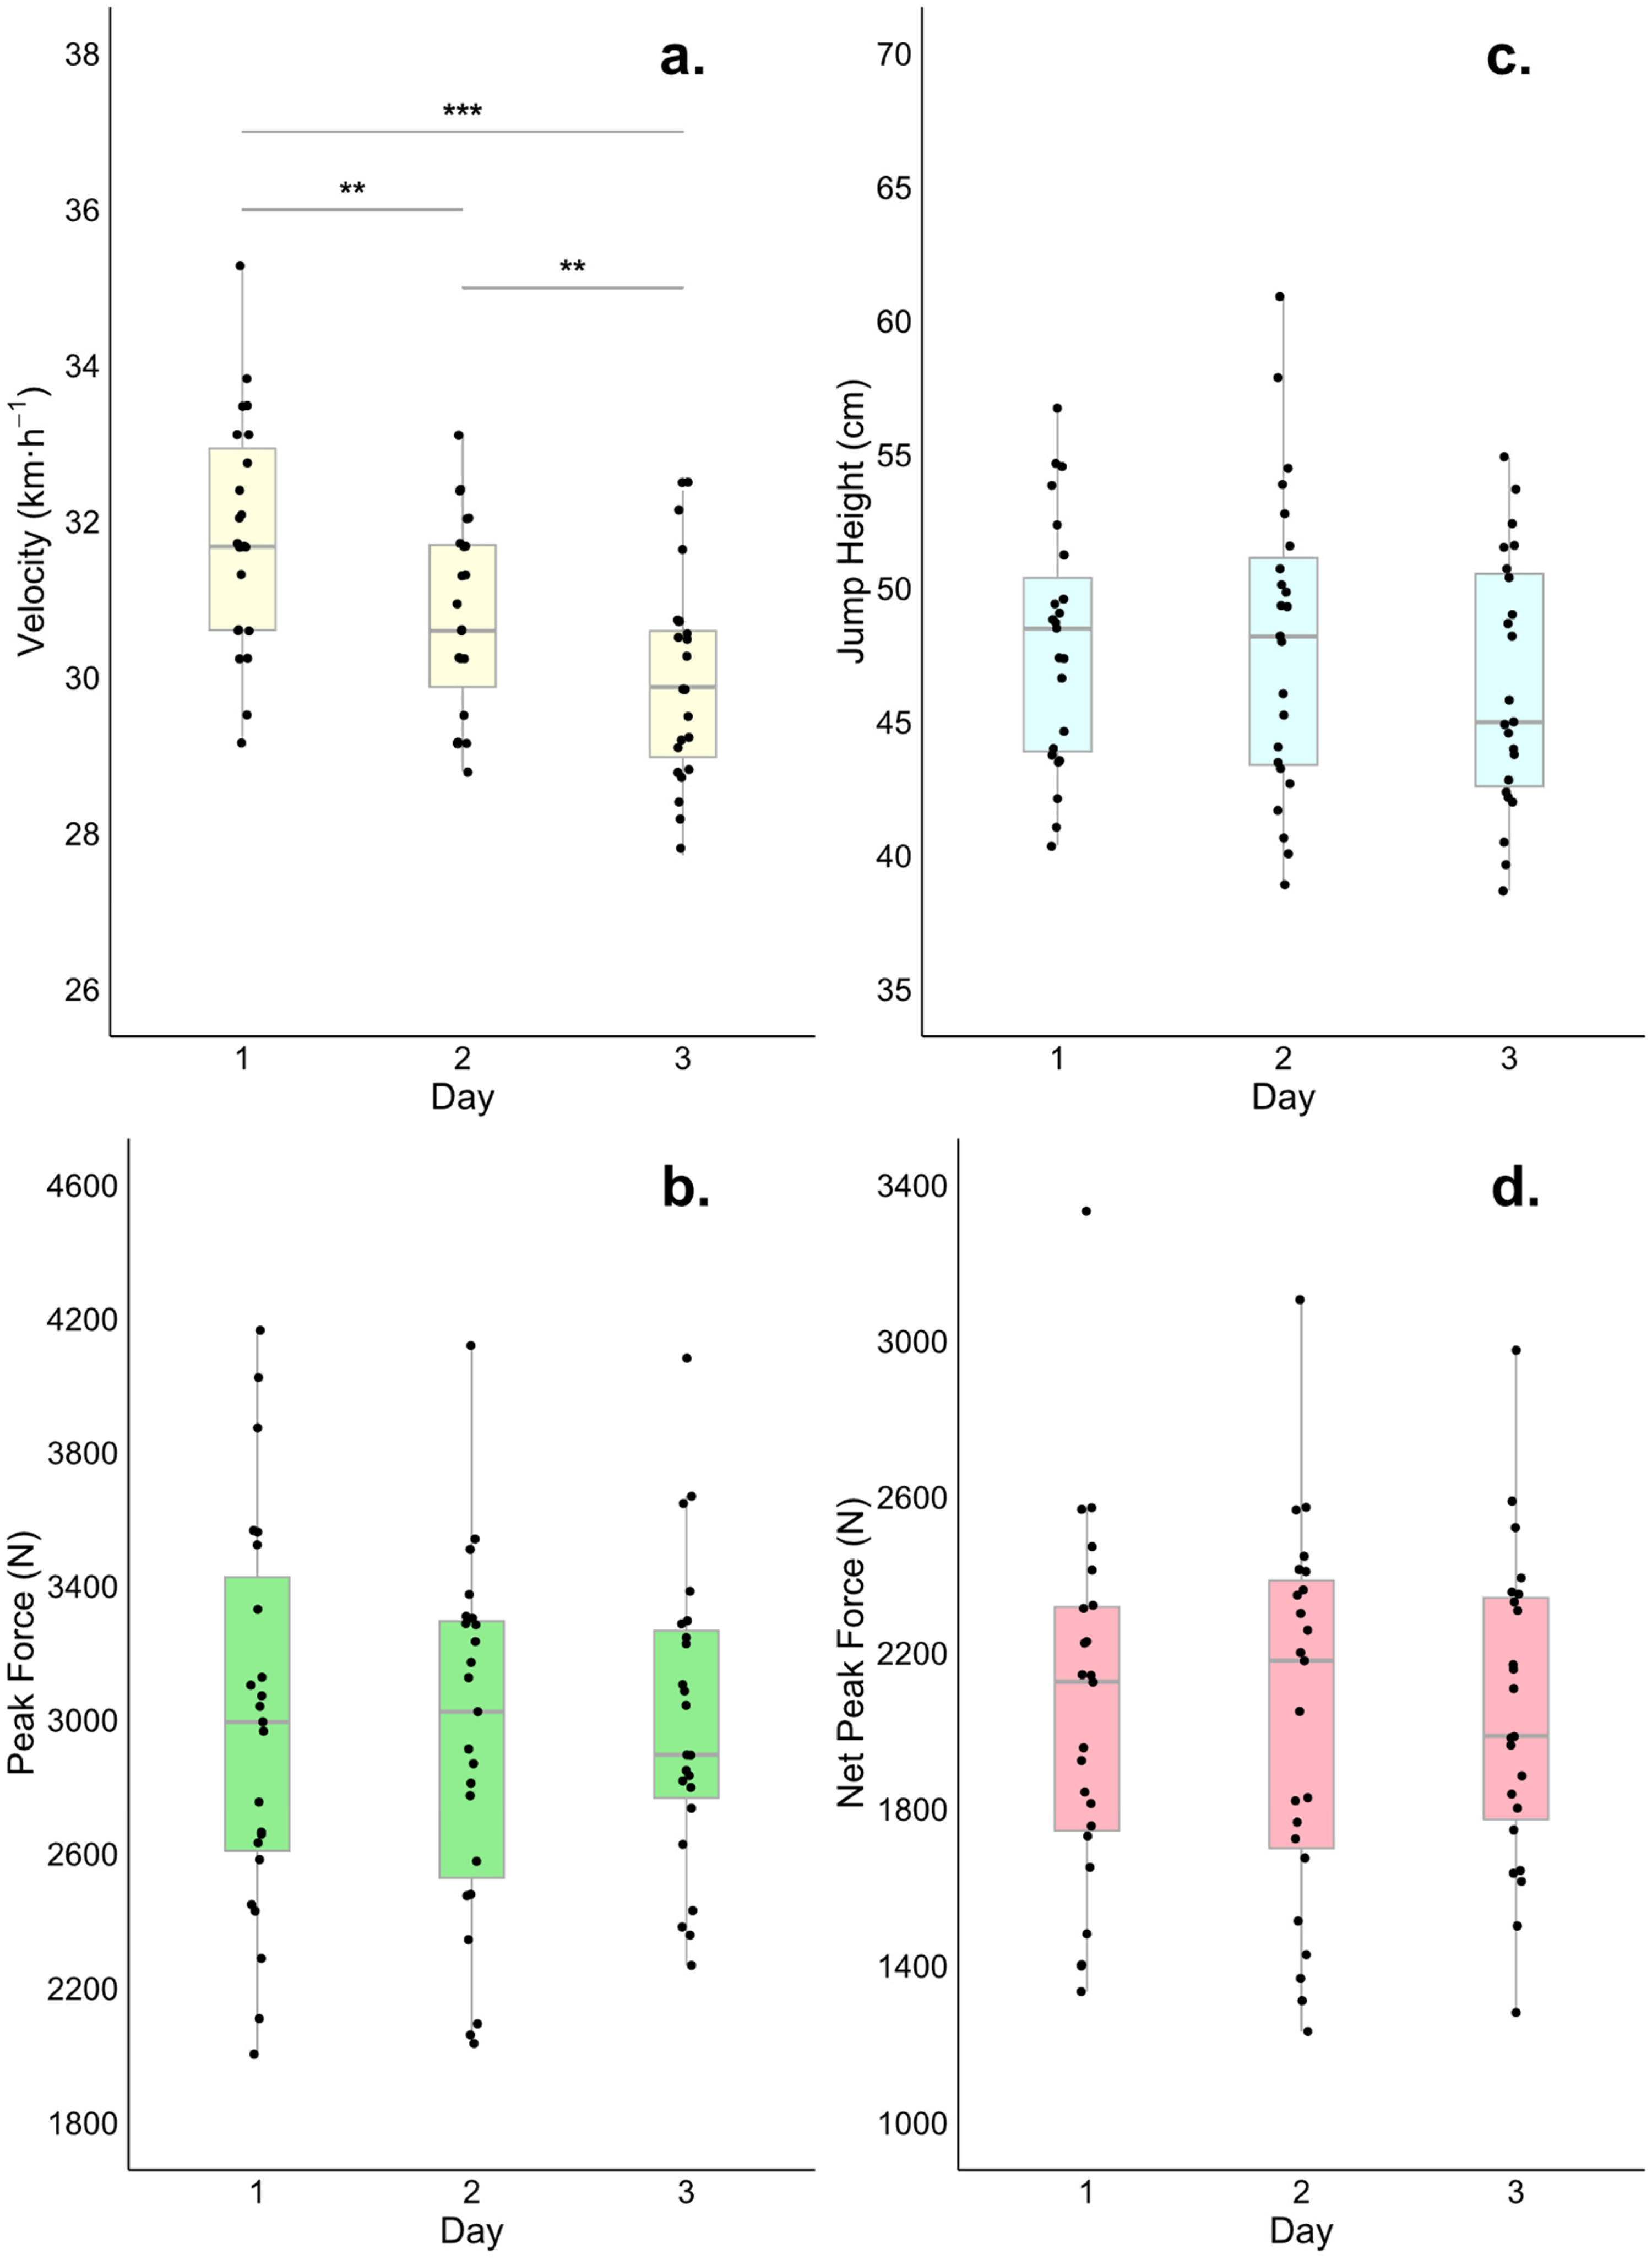
Boxplots of a) Vmax, b) peak force, c) jump height, and d) net peak force for session 1, session 2, and session 3. ** denotes significant difference at p < .01, and *** denotes significant difference at p < 0.001.
Peak velocity displayed a significant, positive, medium correlation with jump height in session 2 (p = .021, r = .480), but not in session 1 (p = .181, r = .289) or session 3 (p = .092, r = .359). The multiple, separate linear regressions used to identify if jump height, peak force, or net peak force could predict Vmax were not significant for session 1 (F(3, 19) = 1.408, p = .271), session 2 (F(3, 19) = 2.196, p = .122), or session 3 (F(3, 19) = 1.692, p = .202). Scatterplots of linear regressions for sessions 1, 2, and 3 are provided in Figure 2.
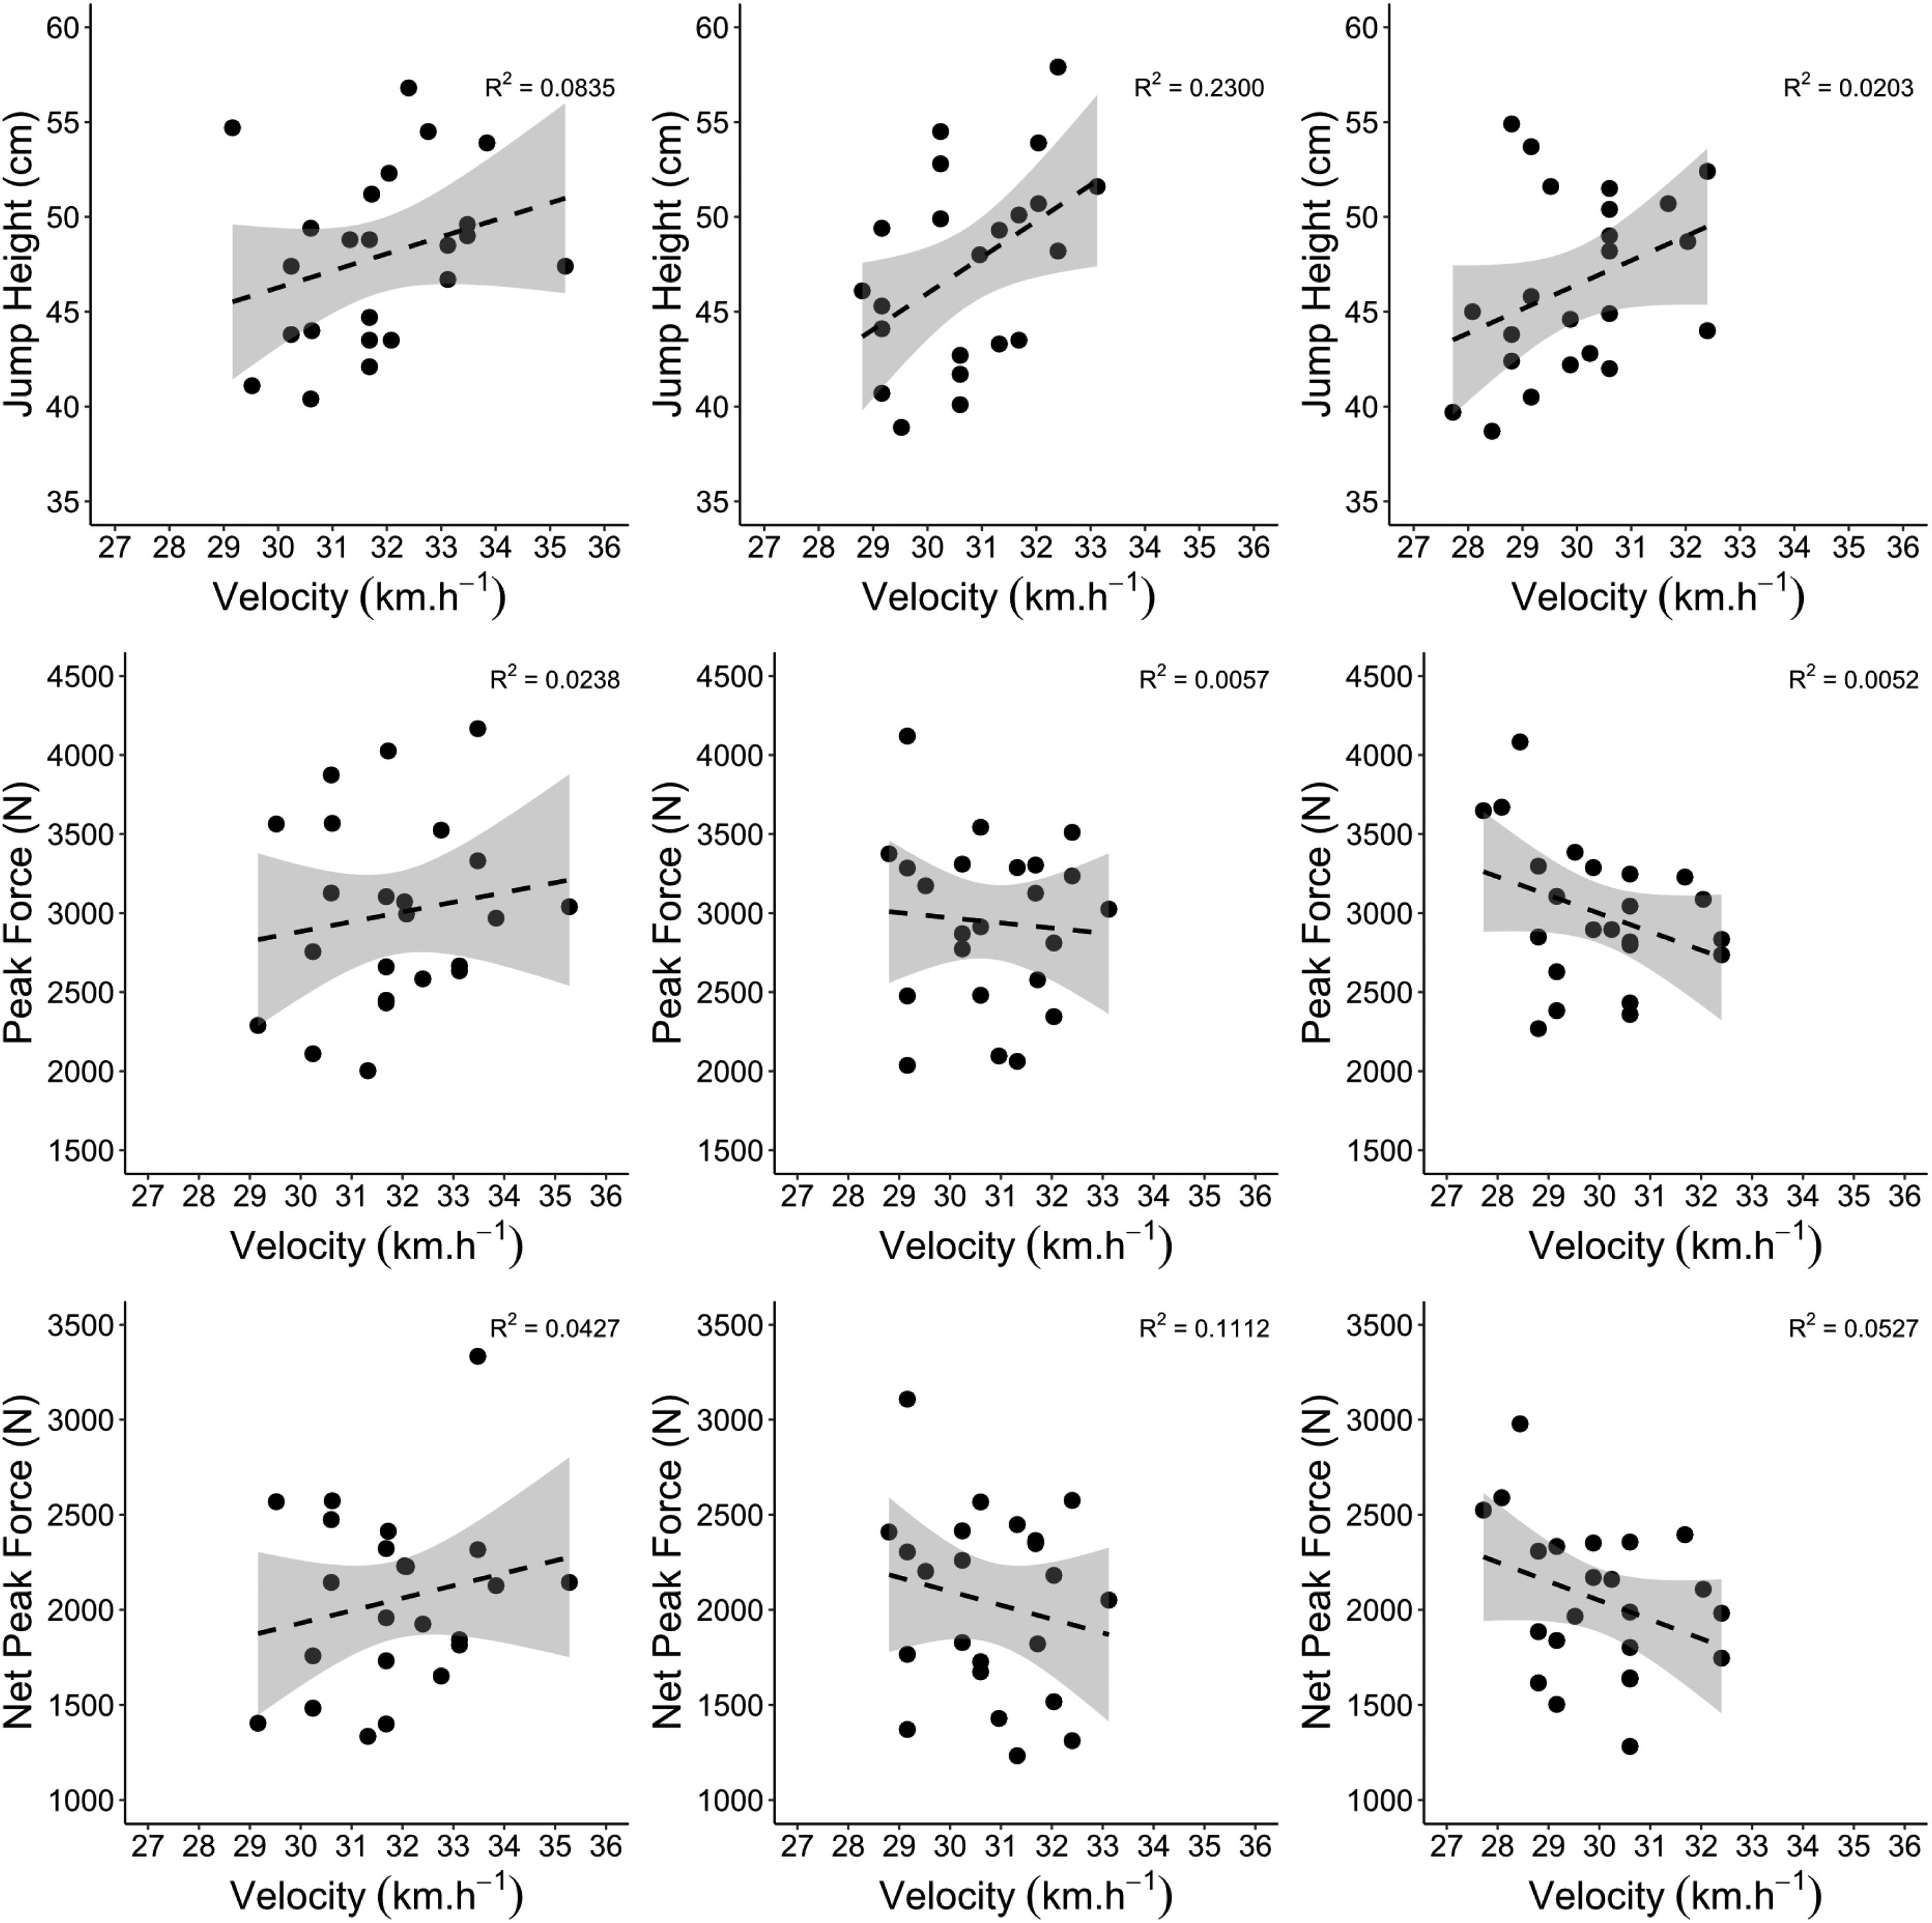
Scatterplots of Vmax and jump height, Vmax and peak force, and Vmax and net peak force for a) session 1, b) session 2, and c) session 3.
Substantial changes between sessions were observed for individual athletes. An overview of the percentage changes in Vmax, jump height, peak force, and net peak force between session 1 to session 2, session 2 to session 3, and session 1 to session 3 are presented in Table 2. Notably, athlete 13 displayed a 14.3% decrease in Vmax between session 1 and session 2, yet improved jump height by 15.0%. Another point of interest is athlete 22, who displayed an 8.1% decrease in Vmax from session 1 to session 2, but then increased by 4.9% from session 2 to session 3. Furthermore, the CV for Vmax was 4.5% in session 1, 3.9% in session 2, and 4.6% in session 3, whilst the CV for jump height was 9.6% in session 1, 10.7% in session 2, and 10.5% in session 3.
The individual percentage changes for each participant in peak running velocity (Vmax), countermovement jump height, peak force derived from the isometric mid-thigh pull and net peak force derived from the isometric mid-thigh pull between session 1 and session 2, session 2 and session 3, and session 1 and session 3.
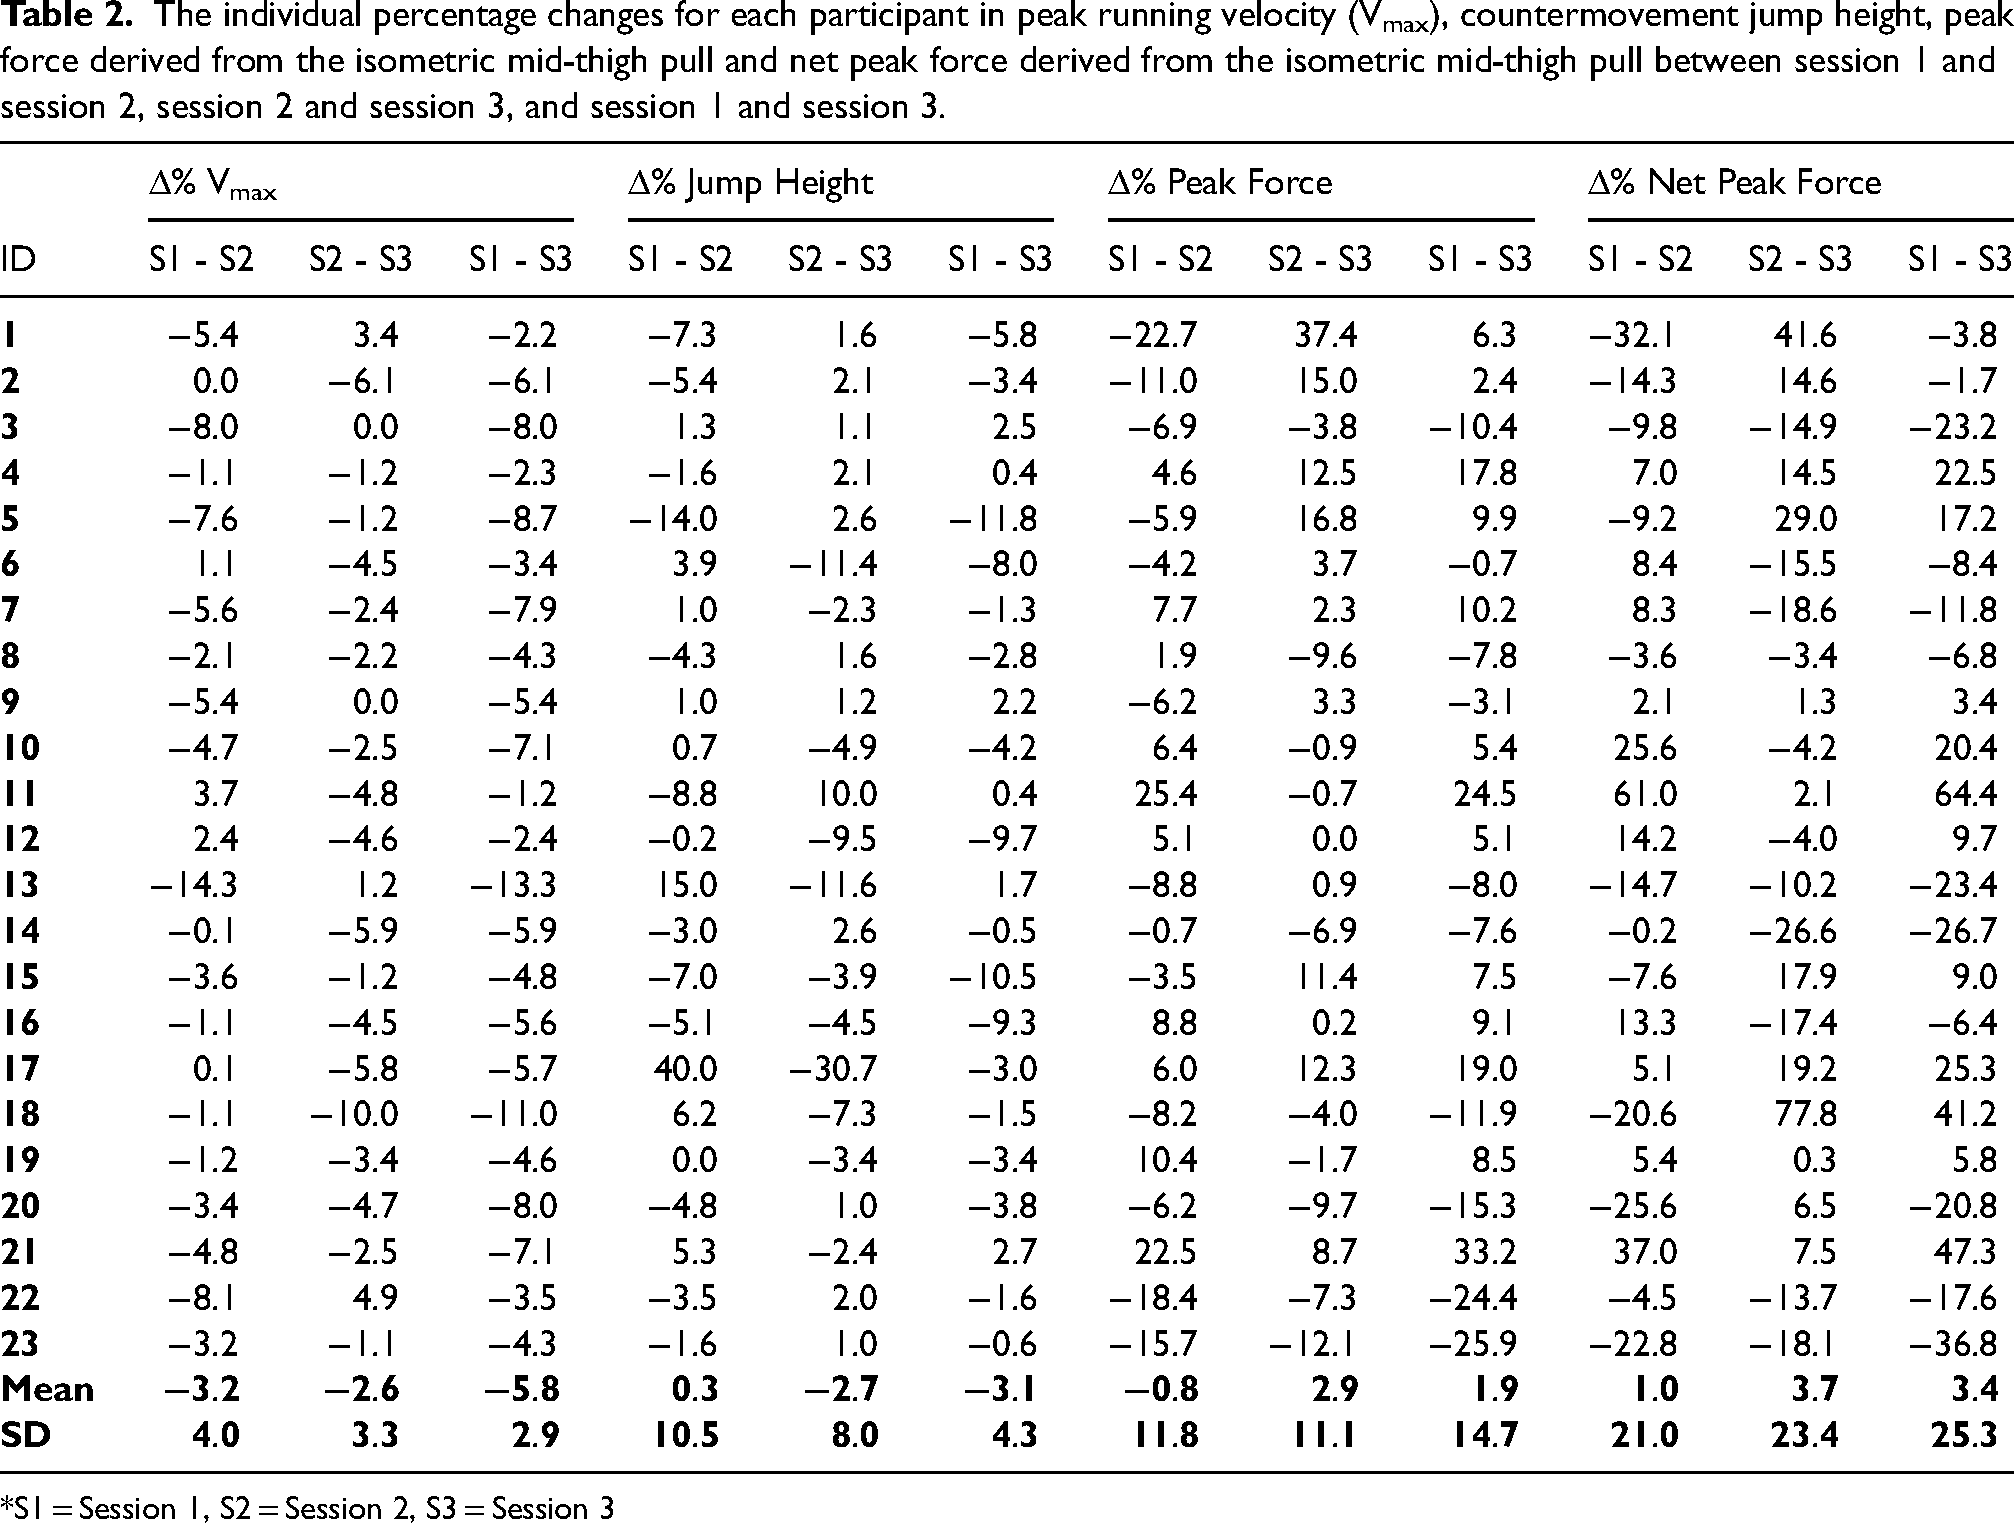
*S1 = Session 1, S2 = Session 2, S3 = Session 3
Discussion
This study examined the day-to-day variation in Vmax in ARF athletes and if this was predicted by peak CMJ height, peak IMTP force, and peak net IMTP force. The main finding is that Vmax displays significant variability in talent identified ARF athletes when assessed multiple times across a 7-day training microcycle (Figure 1). From a group perspective we did not observe any significant variability in measures of isometric strength, or lower body power. However, several individuals displayed substantial differences across testing sessions. Neither jump height, peak force, or net peak force were predictive of Vmax. These findings support for our hypothesis that maximum running speed would be significantly different between testing sessions, however, the underlying factors contributing to this variability cannot be determined from the present data.
The Vmax of overground running progressively declined across the three sessions within the microcycle which has implications for current HSR load monitoring practices. The Vmax is often obtained at the beginning of a macrocycle and then a relative percentage (e.g., > 85%) is used to classify HSR and calculate the associated HSR training load. 13 However, the present data demonstrates up to a 5.8% average difference in Vmax within a microcycle. Using this average difference as an example, it is possible that an athlete running at 94.2% Vmax is in fact running at 100% of their maximal ability on a given day. On the other hand, using the same example, running as slow as 79.2% of assumed Vmax could in fact be 85% of true Vmax; which would therefore be erroneously classified as moderate speed running instead of sprinting. If so, the athlete may be inappropriately prescribed top-up HSR (to avoid the assumed large differences in the acute-chronic training load ratio) which would in fact cause a higher acute load than anticipated. The day-to-day variation in Vmax is therefore an important consideration for load monitoring as current practices likely misjudge the amount of sprinting completed for athletes in field sports with a high-speed running component.
It was believed that lower body strength and power would at least partly explain Vmax33,34 yet linear regressions for each testing session were not predictive of Vmax. This finding indicates that lower body strength and power did not contribute to the observed changes in Vmax across the microcycle and is contrary to our hypothesis. Although it cannot be determined from the present data, it is likely that coordination and technical/mechanical execution contributed more to Vmax in this athletic cohort.18,35 Indeed, greater step frequency and shorter ground contact time have been shown to be correlated with Vmax. 34 The jump height and peak isometric force therefore are not generalisable compared to the more complex skill of sprinting and thus Vmax. As such, CMJ or IMTP cannot be used to quickly assess and regulate sprinting thresholds on training and competition days.
Substantial individual variation was observed for individuals across all the variables measured, which is consistent with previous literature in strength, power, 15 and aerobic assessments. 36 The smallest change in Vmax across the three testing sessions was ±0.1%, whilst the largest change was −14.3%. Importantly, several individuals displayed a change between either session 1 and session 2 (15 out of 23 athletes) or session 2 and session 3 (16 out of 23 athletes) that is far greater than the standard error and CV% associated with Doppler radar speed measurements. 27 Given these large individual differences and the significant differences in Vmax over the training microcycle, the current practice of assigning a relative threshold based upon a Vmax recorded on a separate day is likely flawed. As a result, other alternatives to monitor an athlete's sprint capability might be preferred, such as a coach's subjective perspective on sprinting performance. 37
This study should be considered alongside its limitations. Firstly, Vmax was recorded using a radar gun, and this equipment is likely not readily available to practitioners in an applied setting. It is far more likely that any assessment of Vmax occurs through global positioning systems. 2 However, Johnston et al., 1 reported the percentage typical error of measurement for 10 Hz GPS devices as 1.3%. Therefore, as participants in this study displayed changes more than 6% between testing sessions, our results and the conceptual underpinnings are valid. Secondly, data was collected during pre-season, however, the associated training loads are reflective of the typical pre-season requirements and contribute to the ecological validity of this investigation. We did not control for the prior training or nutrition prior to the testing sessions; yet, each session was conducted at the same time of day, following the same daily schedule for each participant, indicating strong ecological validity. Furthermore, this investigation used an adolescent male sample. Future research should investigate the same protocol in a female population and also adult semi-professional ARF athletes.
Conclusions
The main practical application is that current thresholds applied to sprint running in field-sports should consider the day-to-day variation in Vmax. As demonstrated in Figure 3, the influence of variation in Vmax can change the relative effort required to achieve a ‘sprint’. In some instances, this may mean that the prescribed intensity is actually easier to achieve, and the athlete may be underpreparing. Conversely, the prescribed intensity based upon a singular Vmax may be unachievable on a given day (e.g., > 100% of actual Vmax) and athletes trying to meet this threshold may be increasing their risk of soft-tissue injury. In this instance, a maximal speed sprint over 40-metres may provide a recalibration point for the maximal capabilities of an athlete on that specific day.
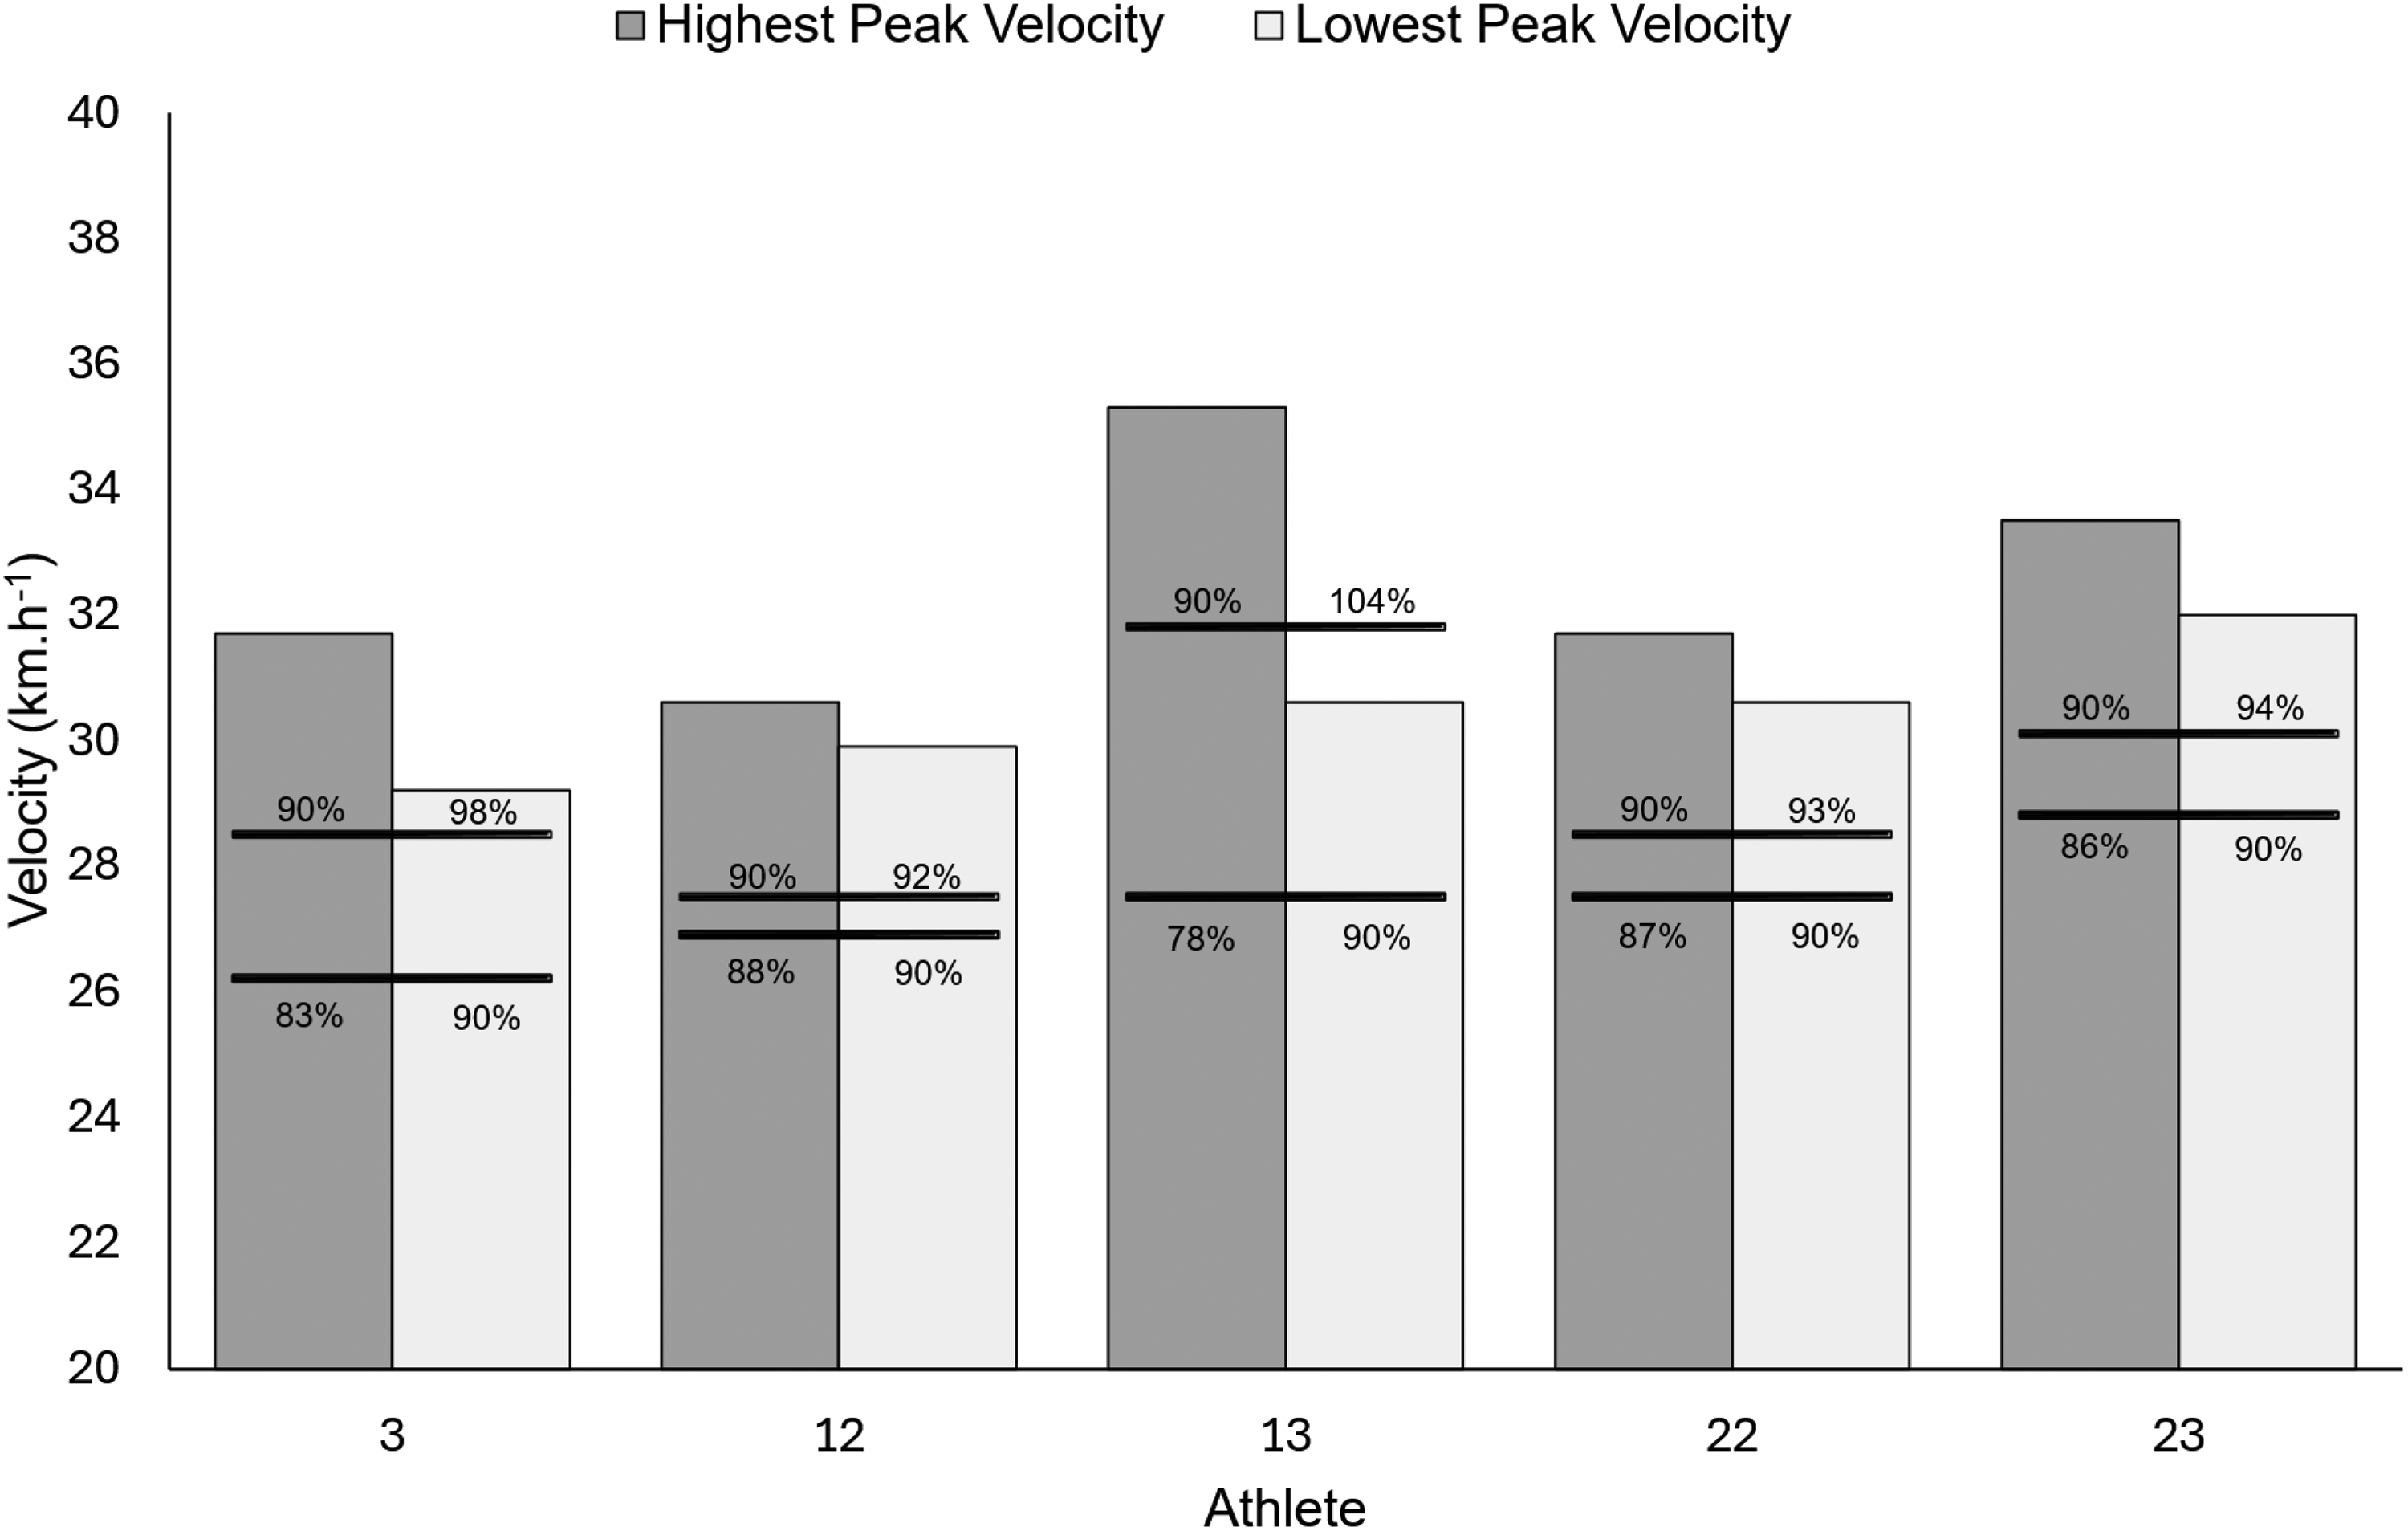
An example of relative thresholds for athletes 3, 12, 13, 22, and 23 based upon their fastest recorded Vmax and slowest recorded Vmax. The top black line represents the 90%Vmax threshold calculated from the fastest Vmax recorded, and the value to the right on the line indicates the relative %Vmax if this were applied to the slowest Vmax. The bottom black line represents the 90%Vmax threshold calculated from the slowest recorded Vmax, and the value to the left indicates the relative %Vmax if this were applied to the fastest Vmax.
This is critical considering the exponential increases in muscular force and negative work observed in the lower body musculature over increasing relative speeds.38–40 Future research should investigate the ability to regulate thresholds based upon a maximal effort at the start of a training session or competition. An evaluation of Vmax on training sessions where HSR and sprint running are key objectives may provide a more accurate picture of the demands of the session and inform ‘top-up’ training prescription. 2
Footnotes
Acknowledgements
The authors would like to thank Mr Sam Mainwaring, Mr Alec Da Silva, and the East Fremantle Football Club for their assistance with data collection.
Data availability
Declaration of conflicting interests
The authors declared no potential conflicts of interest with respect to the research, authorship, and/or publication of this article.
Ethics approval
This study received institutional ethical approval (#2022-168F) and conforms with the declaration of Helsinki.
Funding
The authors received no financial support for the research, authorship, and/or publication of this article.