
Abstract
Swim coaches routinely monitor the performance and performance determining variables of their athletes to optimize training programs in an individual-specific manner with the ultimate aim to swim faster and win races. To interpret the collected data, they require a suitable, and practically useful, conceptual framework, which can be found in the power balance of swimming. For coaches a heuristic model for training and performance optimization based on the power balance has been proposed. We build on this model and illustrate how it can be employed in the training practice using data of an exemplary sub-elite swimmer (700 FINA points), which was collected continuously during two training sessions. Variables that are used in daily swim training practice, such as heart rate (HR), stroke count (SC), stroke rate (SR), and lap time (LT), were measured. By combining external load variables (e.g. LT) and internal load variables (e.g. HR) with technical variables (e.g. SR), the degree to which the swimmer complies with the training program can be determined. The measured values of these variables are presented using a traffic light feedback system indicating the degree of compliance. The traffic light system enables coaches to adjust the program if deemed necessary. It is thus shown how the model and commonly measured variables can assist swim coaches in the design and evaluation of training sessions in their pursuit of personal performance improvement leading to greater athletic success.
Introduction
Swim coaches are often seen standing on the pool deck with the prevailing training program written on a whiteboard or notepad and one or more stopwatches held in hand. They typically record variables, such as the time to cover a certain distance, stroke rate (SR) and stroke count (SC), in an analog or digital logbook. Additionally, swimmers might count their heart rate (HR) for a certain number of seconds to obtain information about their current training zone, 1 typically assuming that a faster time combined with a lower SR, SC, and HR reflects improvement.1,2 Although feasible for a single swimmer, measuring a multitude of swimmers simultaneously represents a major challenge for a coach. Without technological assistance, this cumbersome task leaves little room for active coaching and bolstering the coach–athlete relationship. 3
Compared to other sports such as cycling, 4 swimming has been trailing in the direct measurement of performance-determining factors in the daily training practice due to the complexity of measuring in an aquatic environment and the absence of a connection with a mechanical device from which relevant performance data can be readily obtained, such as in cycling. However, recent sensor developments have provided the opportunity to collect a large amount of data simultaneously.5–9 Owing to this development, rich information has become available about every lap of every swimmer throughout the entire training session. Although helpful in principle, this development has led to the need to manage and interpret the wealth of collected information in an expedient and meaningful manner.
To this end, an appropriate conceptual framework is required. The framework in question should be theoretically motivated, based on available scientific knowledge, and enable practically useful insights into how different performance-determining factors interact in producing a particular performance, that is, the time spent to cover a certain swimming distance. Since many of the factors and processes that determine swimming performance are unknown, such a model necessarily consists of aspects with a reasonably sound scientific foundation and aspects that are lacking such a foundation. In general, more is known about the biomechanical and physiological determinants of swimming than about the psychological and contextual determinants, such as the effects of mental processes and environmental factors on performance.10–12 In particular, the power balance for swimming has been established as a sound and expedient framework for studying and understanding how relevant biomechanical and physiological variables contribute to swimming speed and hence race results.13–16
Unfortunately, the performance-determining factors contained in the power balance are difficult to measure in regular training sessions. Therefore, a heuristic model based on the concept of the power balance has been developed specifically for swimming. 17 Before explaining the model, it is useful to define what is meant by “heuristic.” A heuristic is defined as a strategy that ignores part of the information, with the goal of making decisions more quickly, frugally, and/or accurately than more complex methods. 18 Research has revealed that (a) individuals and organizations often rely on simple heuristics in an adaptive way and (b) ignoring part of the information can lead to more accurate judgments than weighting and adding all information, for instance for low predictability and small samples.18–20 Although heuristic approaches are unfamiliar in the context of swimming, they may be useful to speed up the process of finding a satisfactory solution or making a suitable, albeit not necessarily perfect, decision, where optimal solutions and decisions are still unknown. 21 The model presented here is not a full-blown scientific model for swimming performance, but rather a tool to enhance objective, evidence-based support for coaches, making use of variables that can be measured in the daily training environment owing to technological advances.9,22
The model was designed to assist coaches in the decision-making process in a complex context of a small number of measured variables and many unknown factors. The aim was to provide them with heuristic guidelines, that may assist in making more accurate assessments and decisions in an efficient and expedient manner. 21 In this article, we explain and illustrate how swim coaches may use the heuristic model to design athlete-specific training programs and sessions, to guide the measurement of variables, to create order in the different streams of measured data, and to take decisions and actions based on those data. The model may be used by both coaches who follow a more classic approach in which the coach determines the training program and by coaches who follow a more contemporary approach in which the coach and athlete design the program together. 23 For the sake of readability, we have chosen to write this article from the coach-perspective, but this should not be read as us taking a preference for this perspective over the other.
Model
The proposed model, depicted in Figure 1, links physiological, biomechanical (technical) and mental processes occurring in the athlete to the task requirements, such as swimming as fast as possible over a certain distance or swimming as economically as possible, as well as changes in the environment, such as water temperature and swimming in an indoor or outdoor pool.
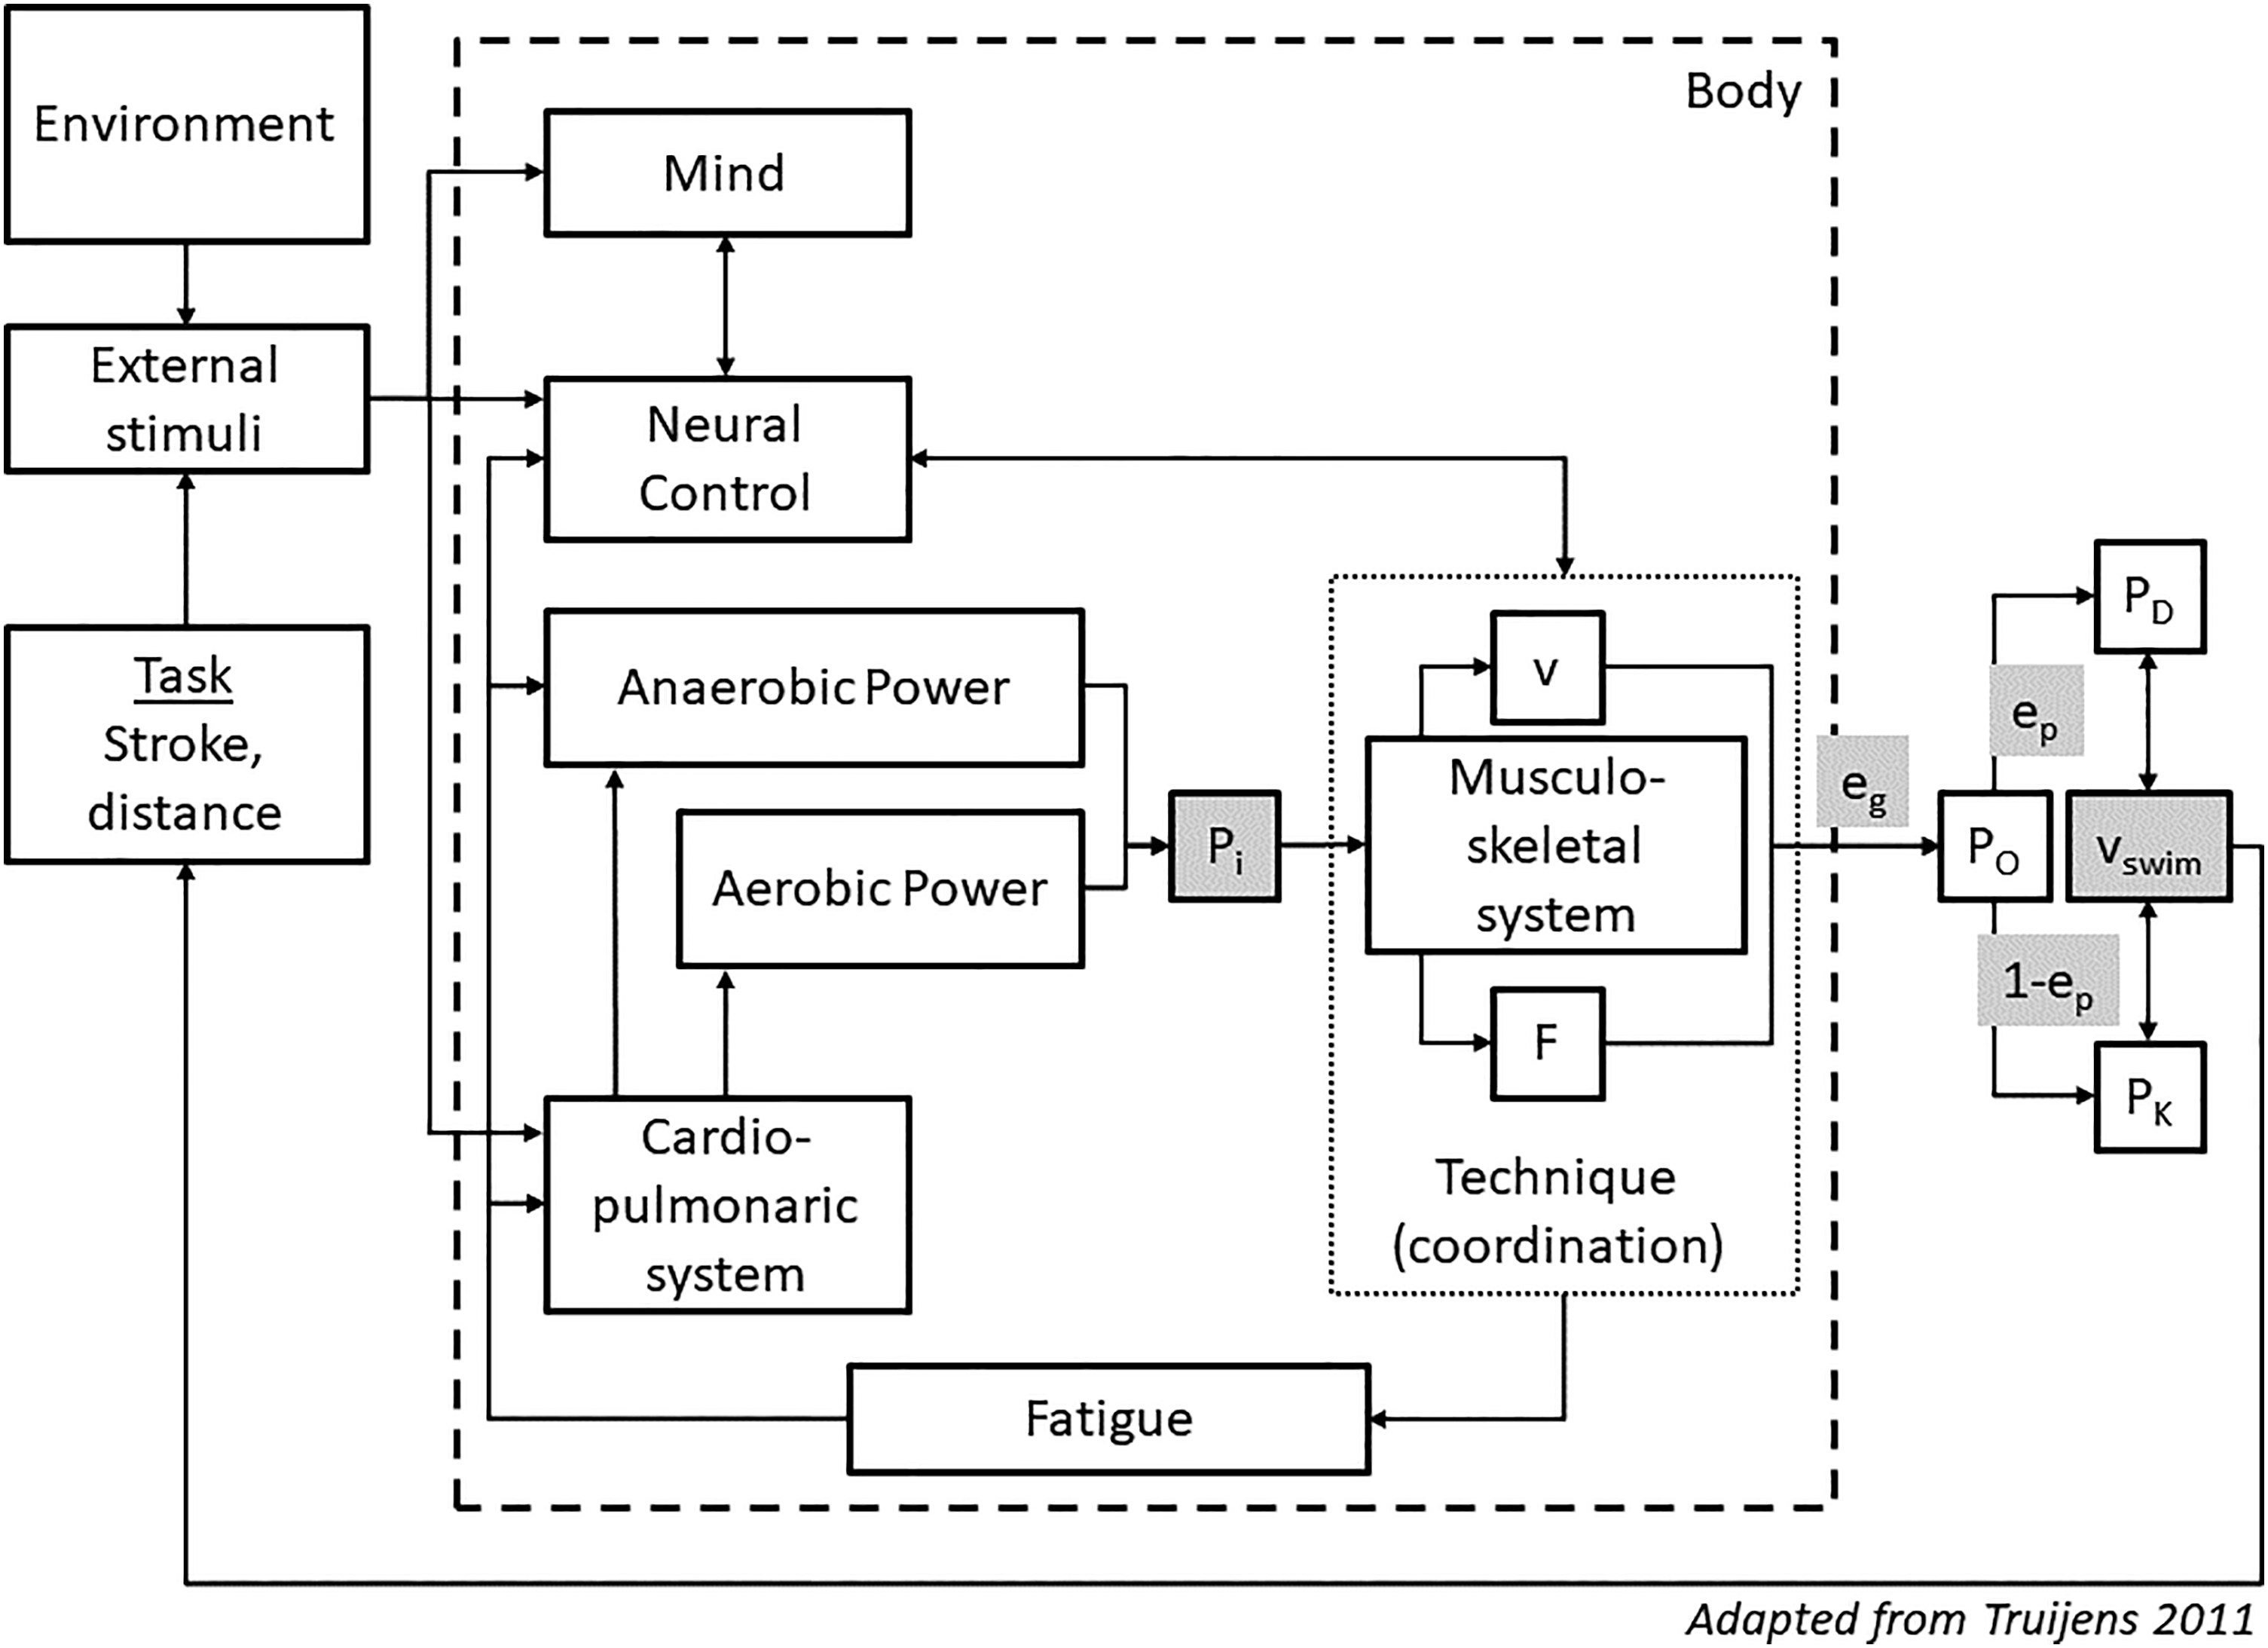
Heuristic model of a swimmer adopted from Truijens. 17 Arrows indicate connections between factors and variables. The dashed line represents the boundary of the swimmer's body; the dotted line represents the part of the model associated with technique; light gray areas highlight the key variables of interest. Pi = metabolic power output, v = the velocity of movement generated by the musculoskeletal system, F = the force generated by the musculoskeletal system, eg = gross efficiency, Po = mechanical power output, ep = propelling efficiency, PD = power used to overcome drag, PK = power lost to bringing water in motion, vswim = swimming velocity.
The muscles are activated to start working through cognition-mediated neural control. The musculoskeletal system generates a power (Pi) per stroke cycle through the conversion of metabolic energy, while PO is an external power value that can only be calculated through its effects on the environment, represented by the gross efficiency eg. At present no consensus exists about how PO can be validly determined.24,25 As captured by the model, as little energy as possible should be converted into energy that does not contribute to the propulsion of the body in the water in the desired direction, that is, that does not contribute to vswim. How much of the metabolic energy is converted into vswim is expressed in the model by the propelling efficiency, ep.26,27
There are two feedback loops in the model: (1) the perception of one's own movements and (2) fatigue arising in the musculoskeletal system, which affects the neural control of the swimming movements, the liberation of energy, and processes in the swimmer's mind. 12 The muscle spindles and Golgi tendon organs provide feedback about the condition of the muscles and tendons during swimming, which may lead to technique adjustments that promote more efficient and powerful swimming. 28
In brief, the model combines physiological, biomechanical, mental, and environmental factors and provides the coach and sport scientist with a framework to track, study, and evaluate the effects of training programs and other interventions, such as episodes of sleep, rest, or dieting.
A practical limitation of the model is that certain variables are hard or impossible to measure continuously in practice. For instance, continuous monitoring of anaerobic power is complicated and burdensome. 29 Moreover, the mechanical power output by the swimmer is difficult if not impossible to determine without influencing the swimming movement; moreover, the methods that have been described for this purpose in pertinent literature are known to yield vastly different results.27,30–32 Finally, the intricate interrelations between motor control, perception, and cognition are still poorly understood and subject of controversy. 33 Thus, the use of a heuristic model, based on variables that can be measured in training, seems warranted. The model shown in Figure 1 links variables that are routinely targeted by swim coaches in daily practice, such as time, SR, SC, and HR, to physiological and mechanical factors underlying swimming performance, and may thus be used to guide the training process.
HR or the heart rate reserve (HRR, the difference between maximum HR and resting HR) can be used as a proxy measure of the aerobic part of the metabolic system, Pi. The HRR has a largely linear relationship with the VO2 reserve (the difference between VO2max and resting VO2).34,35 HR is usually measured with Polar, Suunto, or Freelap equipment. 36 HR, can be monitored continuously during activity with only minor interference with the swimmer's performance and small measurement errors. 37
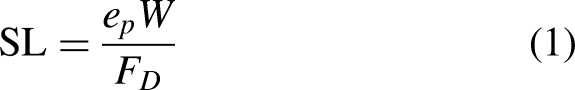
A practical indicator of ep is the stroke length, SL, as is evident from equation (1):
SR provides additional information about swimming performance.2,14 A high vswim is associated with a high SR,38,39 although there are marked differences between race events in this regard, as well as between female and male athletes. 40 Furthermore, when the SL drops in a race, swimmers seem to compensate by increasing the SR to maintain vswim. 38 This has led to the recognition that SR can be manipulated in practice to stabilize movement coordination and to cope effectively with difficult situations such as racing under fatigue.39,41,42 Hence, it seems worthwhile to measure and track SR to obtain more information on movement coordination and control.
Most importantly, end time is the sole outcome of interest for competitive swimming, in which a predefined distance has to be covered in the shortest possible time. This implies that swimmers have to reach a certain vswim throughout their race. An indication of the vswim per lap can be obtained by measuring the lap time (LT), that is, the time it takes to cover one lap of the pool. LT can be used to provide information on how a certain distance is split up into different sections, resulting in split times. Split times are important to establish the pacing profile of a swimmer, in other words to specify the optimal distribution of power over the race, resulting in the best possible outcome. Depending on whether the pool is short or long course, the split times are divided in 25 or 50 m or a multiple of these. The values of split times expressed as a percentage of the end time are relatively stable and can therefore be used to calculate goal times in training, which connects the training to the competitive performance as is commonly done in ultra-short race-pace training. 43
In summary, measurement of LT, SR, SC, and HR provides useful information about the swimmer per lap, because these measures can be related to aspects of the power balance. It should be noted here, that because of the practical difficulties involved in measuring metabolic and mechanical power in the daily training setting, we propose the use of the aforementioned variables as proxy indicators of the power balance, rather than equating them with power measures in any definite or formal manner.
Training design
The goal of training is to evoke an adaptive response that enhances the athlete's performance level as reflected in improved swimming times. The race performance outcome is usually measured through race analysis.44–46 A race analysis highlights areas that can contribute to faster swimming times, such as the adopted pacing strategy and kinematic variables pertaining to the adopted propulsion technique (manifested in the SR and SC).38,40,47 This provides the basis for the evaluation and planning for the next training period or macrocycle. 48 For each training session, a specific goal will be defined, depending on the periodization and planning. 49 This specific goal can be focused on more kinematic (i.e. technical), physiological, and/or strategical (i.e. pacing) improvements, all with the ultimate goal of increasing vswim. As indicated in the model shown in Figure 1, these factors influence each other. In the following paragraphs we will present some example sessions to demonstrate how the model can assist in designing training sets. Patently, these sets can and should be aligned with the overall philosophy, planning, and periodization of the training. The resting times of example sets are individually chosen based on the ranges provided by Maglischo. 50
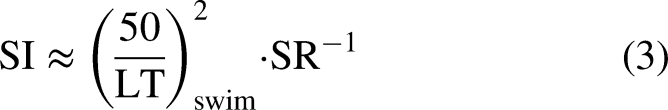
In a more technical session, the swimmer is working to optimize the interaction with the water to increase the distance traveled per cycle without noticeably increasing the cycle duration while maintaining the same energy expenditure. An example is 4 × 50 m with 30 s rest between repetitions. After each repetition the coach provides the swimmer with condensed feedback to optimize the stroke pattern. When the same energy input is delivered by the swimmer, kinematic changes will occur, which are reflected in the stroke index, SI. The underlying assumption is that at a given vswim, a swimmer with a greater SL has a more efficient swimming technique.
51
Costill et al.
52
defined SI as:

In a more physiologically oriented session, the swimmer is working to improve the aerobic or anaerobic metabolism through endurance intensive efforts, high intensity efforts, or explosive efforts, respectively. 50 In fact, aerobic and anaerobic metabolic pathways are closely linked and influence each other. 53 Moving at endurance and sprinting intensities both capitalize on metabolic pathways. This allows the body to produce energy uninterruptedly and maintain performance under various stress conditions without causing organ or system failure. It also leads to a holistic adaptation of the anaerobic and aerobic metabolic pathways. The goal of a more physiologically oriented session is to increase Pi, resulting in a higher vswim. An example of an endurance intensive effort training is 5 × 200 m at 70% of the HRR with 20 s rest between repetitions. The idea is that after a period of endurance training, HR at a certain vswim will be lower, due to an improvement of the oxidative phosphorylation pathway. 54
An example of a set with a combined technical and physiological focus, is 6 × 100 m with 15 s rest where the goal is to swim with a HR of 90% HRR while maintaining a certain LT, SR, and SC. The physiological responses to the energy requirements of external and internal stimuli during training are regulated by biological processes. By tracking and monitoring relevant measurement variables, in particular (split) times, it can be determined whether the intended stress has an impact on the goal of improving the time in competition. In the extant literature on monitoring, the physiological or psychological responses to stressors that are imposed on the athlete during training or competition are labeled internal loads. In contrast, the objective (biomechanical) measures of the work performed by the athlete during training or competition are labeled external loads.
55
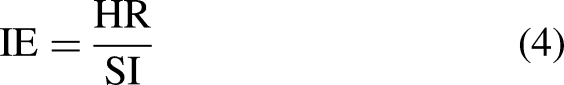
Using the model's proxy indicators, the HR is the internal load variable, whereas SR, SC, vswim, and SI are external load variables. The ratio between the internal and external load, IE, is defined as:
Heuristic rules
A certain set is composed with a training goal in mind. Within the set different targets can be formulated per swimmer, for instance achieving a certain SR, SC, HR, and LT in each part of the set. The model depicted in Figure 1 assists in defining these targets and gaining insights into how the variables of interest interact. The expected effects of the set targets follow from the heuristic rules implicated by the model. Information about the variables can then assist in evaluating and making decisions to ensure the goal is attained.
The first heuristic rule of the model is that all performance-determining factors contribute to a certain vswim. Second, the vswim is directly dependent on the biomechanics and technique of the swimmer. Third, the available energy is produced by the physiological metabolism. Finally, psychological and environmental factors may have an influence on both energy metabolism and technique; these influences can therefore, on a first pass, be indirectly assessed from the biomechanical and physiological factors LT, SR, SC, and HR.
With these heuristic rules in mind, the coach can formulate an expected outcome for the training session, observe if the athlete is on track towards reaching the outcome and check if the desired outcome has indeed been reached. Both the expectation and observation should be expressed in the variables LT, SR, SC, and HR.
Compliance
The degree to which a given individual athlete fulfills the targets set in the training program is called compliance. According to Stewart and Hopkins compliance to the training schedule is a prerequisite for the evaluation of the training process. 56 For both coach and swimmer it is important to assess compliance in an expedient and effortless way, such that decisions and actions can be taken when necessary. Typically, the coach decides what range of variation for the variables of interest (in this case LT, SR, SC, or HR) is acceptable.
When defining the compliance range, three considerations are in order. The first pertains to the variation that an athlete exhibits while performing a certain task. This is the natural variation between laps, strokes, and heartbeats that is expected to occur under normal circumstances. In a previous study, we defined compliance limits of 2% for LT, ± 1 stroke for SC, and found a range of ± 1 str·min−1 for SR based on standard deviations within a training set. 6 Second, several authors have described training zones to determine and schedule training intensity.57,58 These training zones are often defined in increments of 10 beats per minute (bpm) below the maximum HR or 10% of the HRR or the maximum HR and should be adapted for each individual swimmer.1,59–61 The third consideration is that it remains to be decided if action is necessary when a variable falls outside the desired range by a small margin. For example, when the selected compliance range is 35.0–36.0 s for LT, what will be decided when 36.2 s is timed on the stopwatch? The selection of a compliance range should take the technical measurement errors of the variable(s) in question into account.6,62
To assist in making appropriate decisions, we suggest using a traffic light system with a white, light gray, and dark gray zone. The white zone is the desired range around the target. Based on the research results described above, the white zone should have the following ranges around a specific value: ± 0.5 s for LT, ± 1 strokes for SC, ± 1 str·min−1 for SR and ± 5 bpm for HR. The light gray zone is the range where the variable falls outside of the desired range by a small margin, based on measured errors found in previous research.6,62 The light gray range is defined as ± 0.6 s for LT, ± 1 stroke for SC, ± 1 str·min−1 and ± 3% of HR of the white zone. The white and light gray zone of the IE can be calculated based on the other parameters following equation (4). Any variable outside of the white or light gray zone is then in the dark gray zone. It should be noted that if deemed desirable, and depending on the goal of the session, the compliance ranges can be changed. With the target and compliance ranges defined, the sessions can be tracked using either stopwatches or wearable sensors.
Tracking the training
Recent advances in sensor technology allow digital tracking of each swimmer in their training group.6,7,63 A custom-made device (Lode BV, Groningen, The Netherlands) was used to track the example session to be discussed in the next section. The device consists of a gyroscope, a magnetometer and a tri-axial accelerometer, all with a sampling frequency of 250 Hz, and a 3-lead electrocardiogram (ECG) with a sampling frequency of 1 kHz. The device was placed on the swimmer's back between the shoulder blades (Figure 2). An ECG cable was led to the front of the swimmer and attached to three electrodes (Kendall Medi-trace 200 Series Foam Electrode) placed around the heart. From the accelerometer data several parameters were obtained: SR, SC, and LT using previously described algorithms.6,64 HR was obtained from the three-lead ECG using a hierarchical probabilistic framework, as proposed by Warmerdam et al. 65 The data was processed on the device and the calculated variables were transferred in real-time to a smartphone or tablet on the pool deck via Bluetooth, every time the device was above the water long enough to make a connection, both during swimming and rest.
With such devices, the coach can design a training program with target times, SR, SC, and HR and check if each swimmer adheres to the prescribed exercise. 56 Additionally, by combining external load variables and internal load variables using the IE (see equation (4)), information can be obtained to determine the effectiveness of the training program and start monitoring by measuring indicators of training load on a regular basis.66,67
Example training
To illustrate the process of handling the data and the decisions and actions that can be taken based on the data, we use data that were collected during two training sessions of a 19-year-old male state level swimmer (700 FINA points according to the 2021 FINA point score) 68 from Queensland, Australia. The swimmer wore the custom-made device (Lode BV, Groningen, The Netherlands) described in the previous section. Based on the signals registered with this device, continuous, synchronized measures of LT, SR, SC, and HR were obtained.6,65
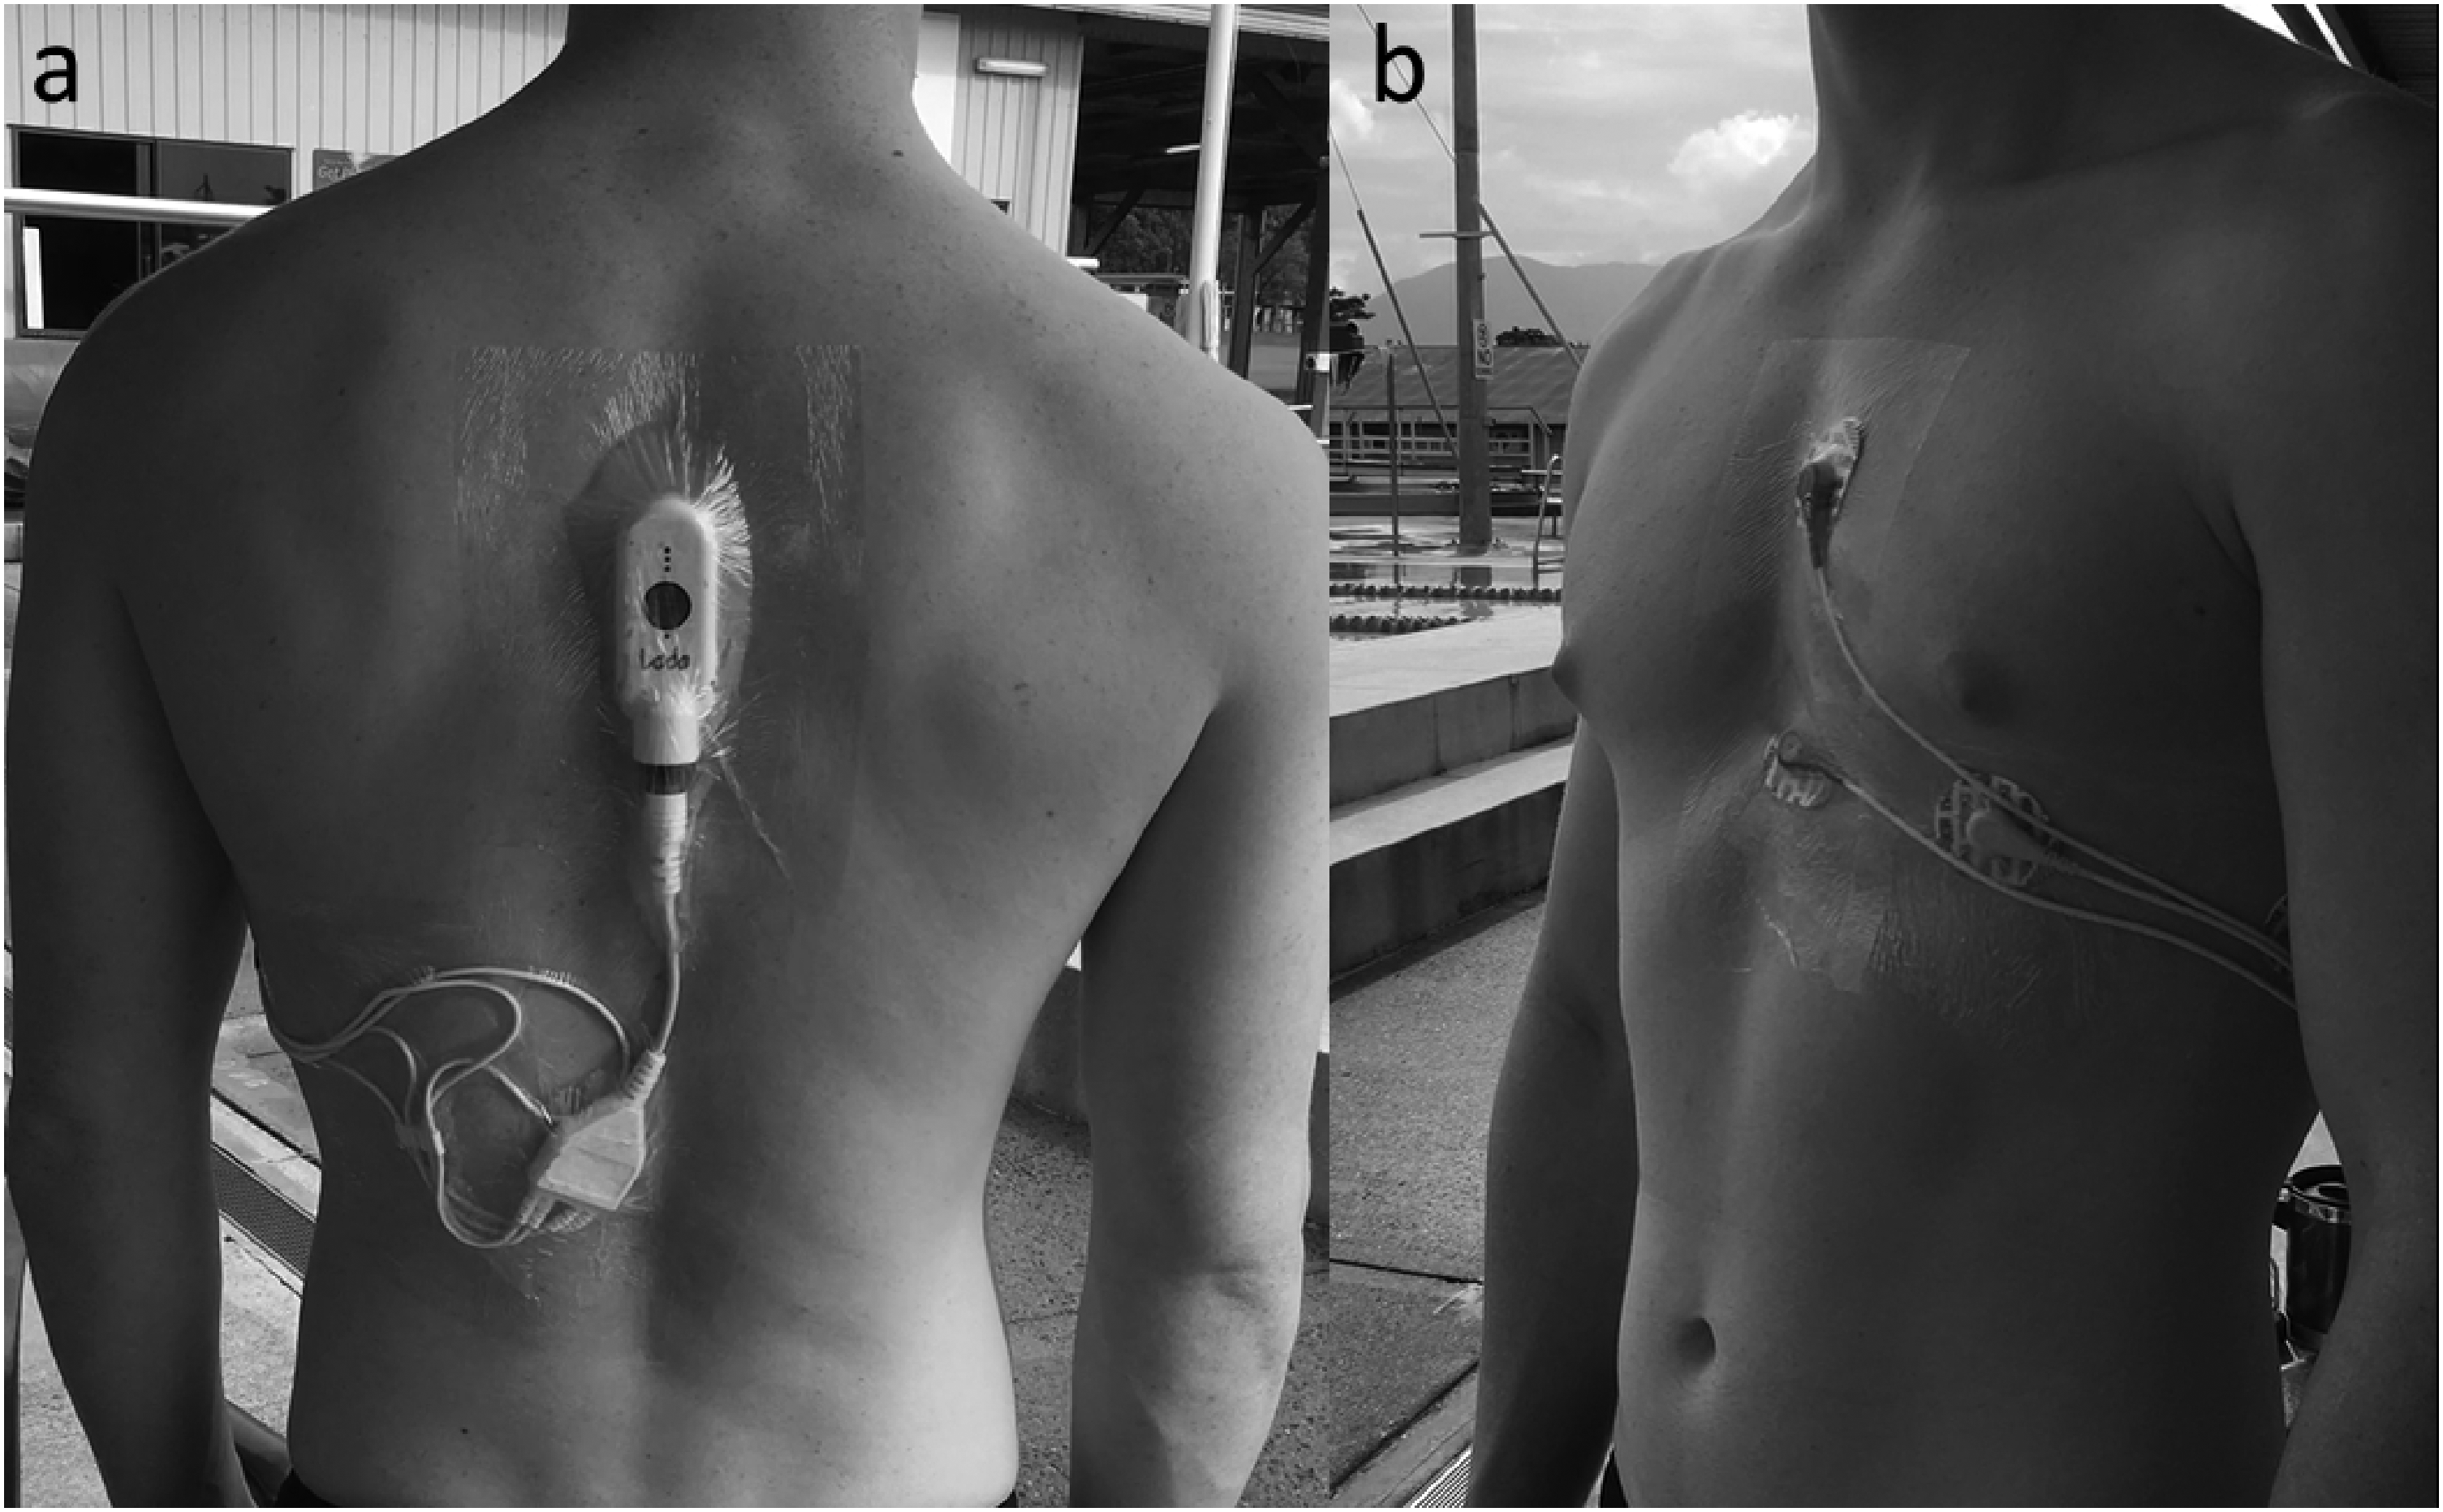
Position of the device on the swimmer's body. (a) Location on the swimmer's back and (b) electrode locations on the swimmer's chest.
The swimmer started by swimming 300 m at a preferred stroke style and pace, followed by 300 m front-crawl at normal warm-up pace. The swimmer then rested in silence for 2 min before starting the main set. A regular challenging training set was chosen, the goal of which was to improve the pacing strategy used by the swimmer. By implication, this would elicit changes in biomechanical or physiological variables throughout the set. The starting intervals were individually chosen based on regular training sessions.
The training set of session 1 was as follows:
3 × 200 m best average on a 3:15 min starting cycle 200 m active recovery on 5:00 min 6 × 100 m best average on 1:30 min 200 m active recovery on 5:00 min 12 × 50 m best average on 0:45 min
In session 2, the swimmer performed the set in reverse order, that is, starting with the 12 × 50 m and finishing with the 3 × 200 m, to induce fatigue and evaluate its effect. All distances started with a push-off from the wall. The swimmer received feedback on the LT after each completed distance.
For the present illustration we chose to compare the 12 × 50 m between both sessions, since there would be no effect from turns and less intradistance fatigue (see Figure 3). The same task (12 × 50 m) was performed at the beginning or end of the session, which implied that the preparation of the athlete for the 12 × 50 m was different.
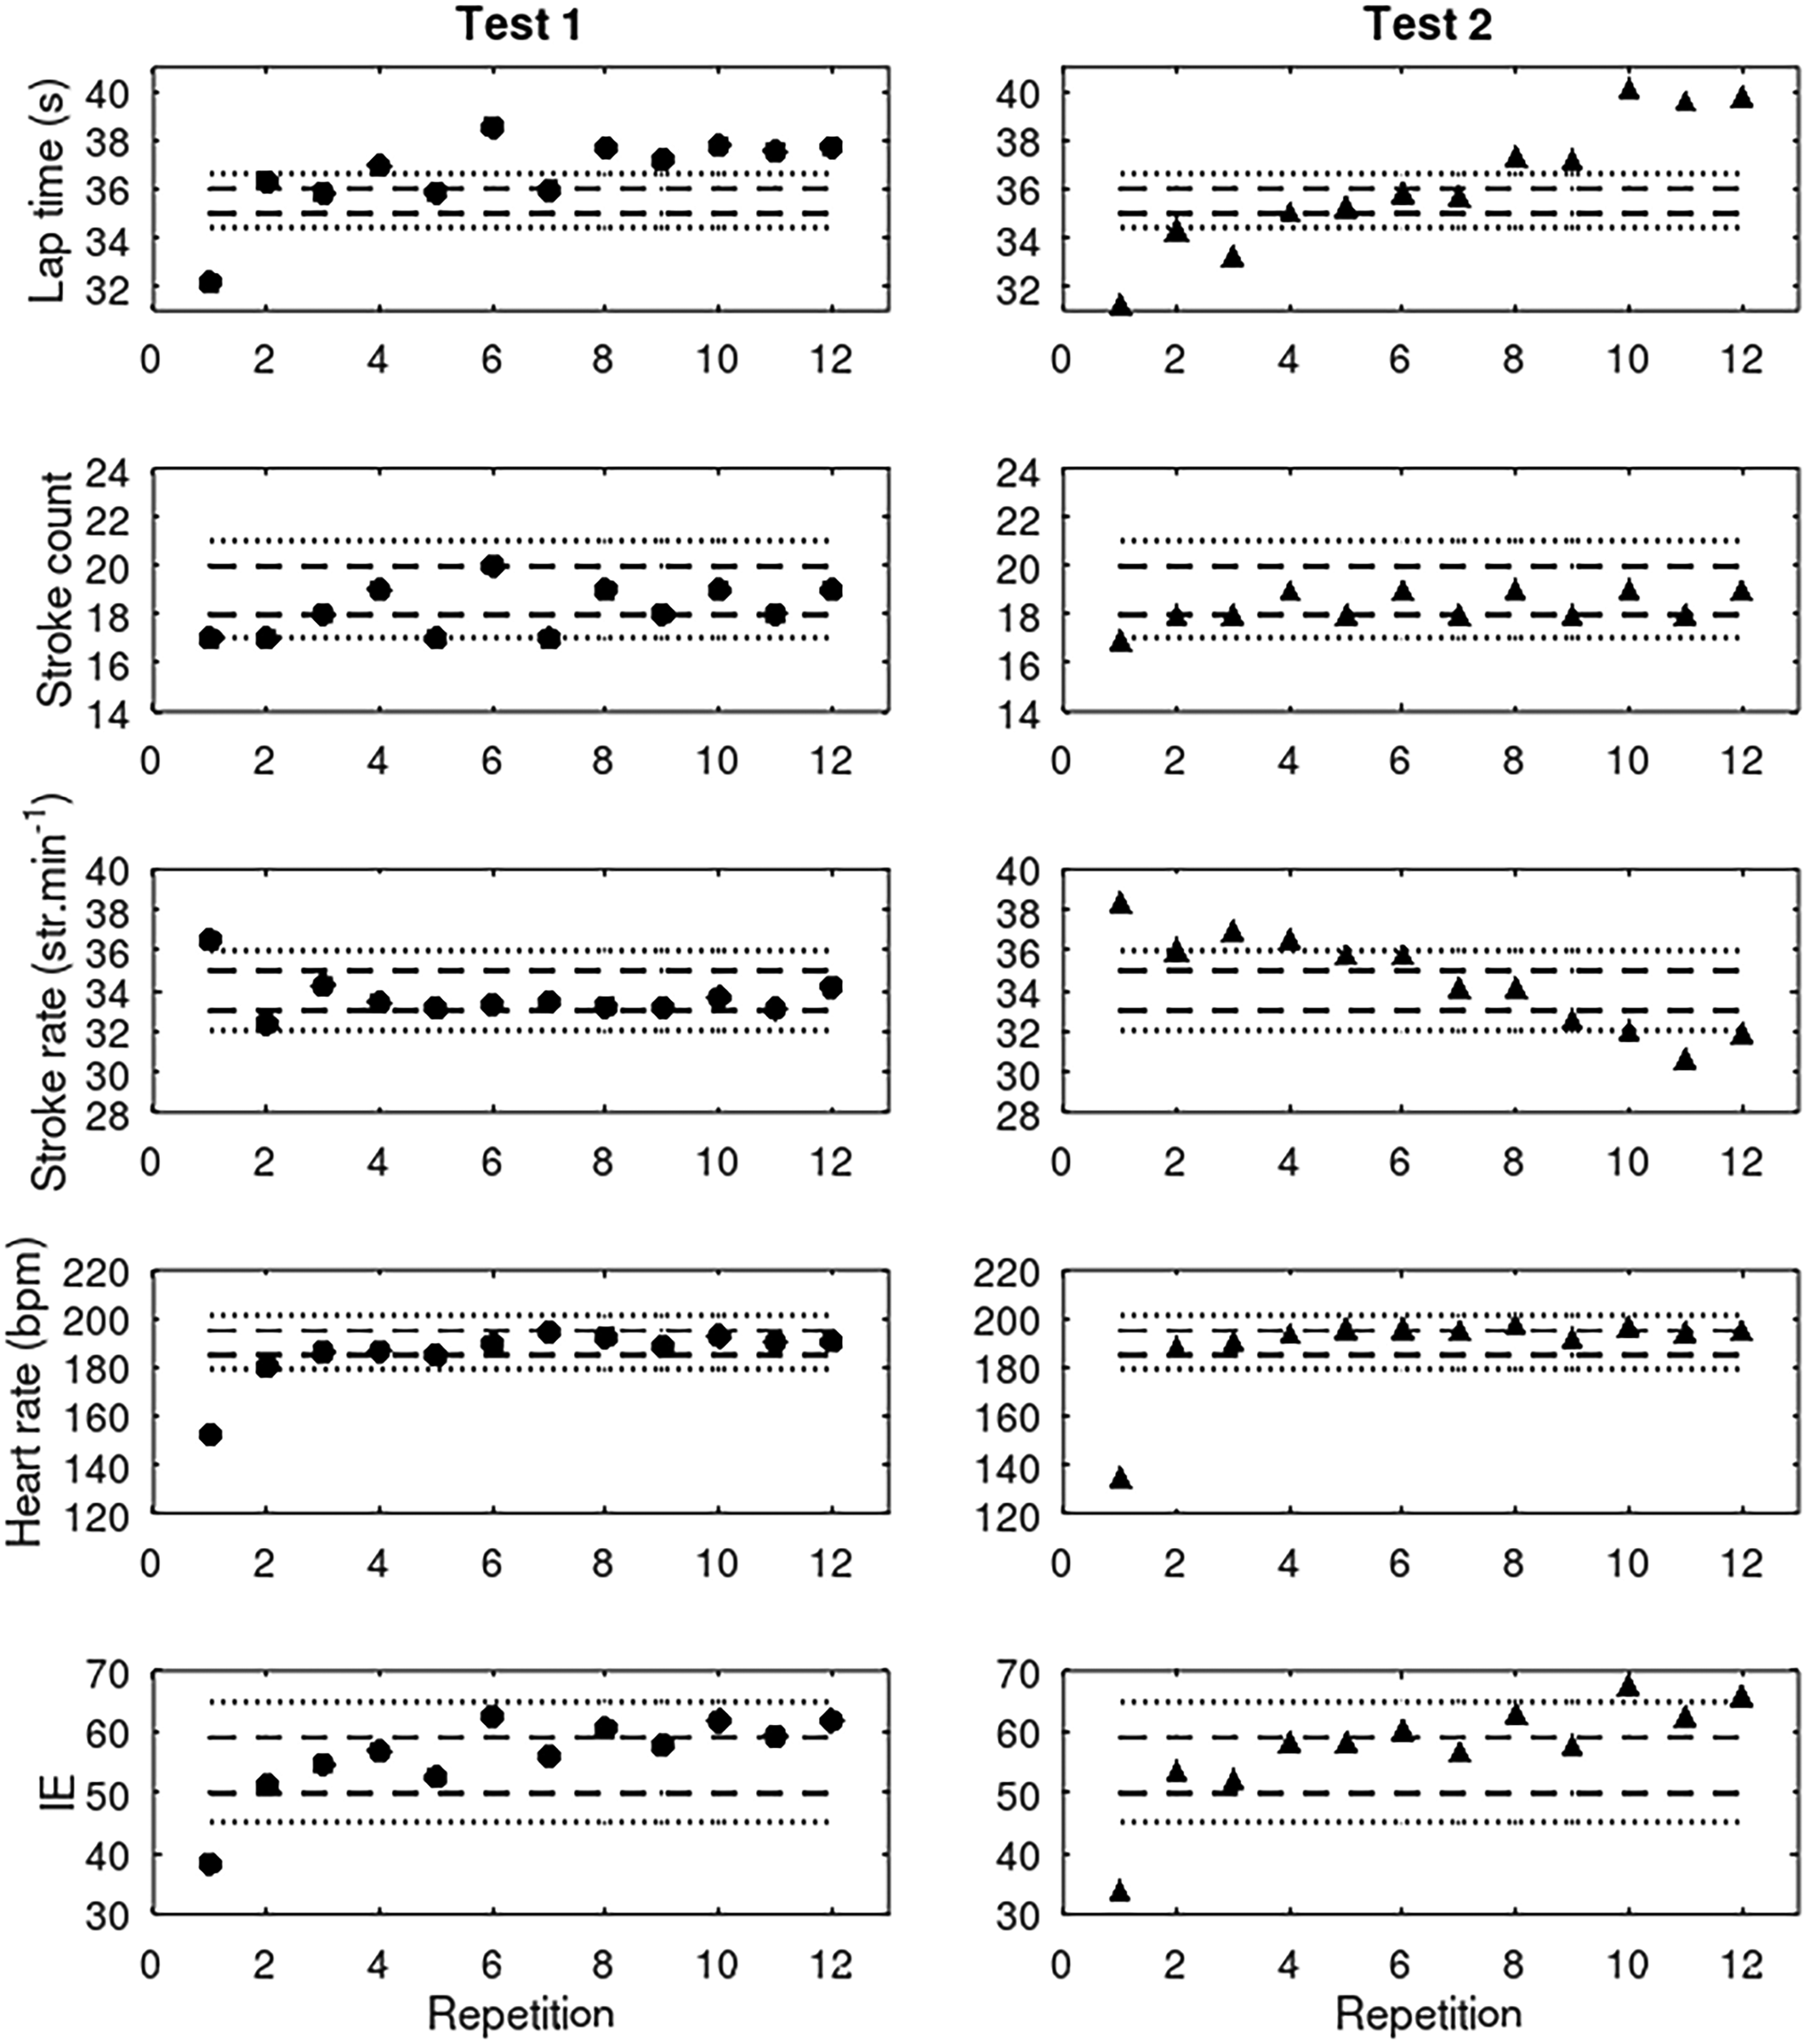
Results per lap for test 1 (left panels) and test 2 (right panels). IE is the internal to external load ratio. Dashed lines represent the target range, dotted lines mark outer values of the zone where the variable is outside of the target range by a small margin (± 0.6 s for LT, ± 1 stroke for SC, ± 1 str·min−1, ± 3% of HR and ± 5 IE of the target range). HR: heart rate; IE: internal to external load ratio; LT: lap time; SC: stroke count.
The white zone ranges for the 12 × 50 m for the swimmer in question were LT = 35.5 ± 0.5 s, SR 34 ± 1 str·min−1, SC 19 ± 1 cycles, and HR 190 ± 5 bpm. The IE ranged from 50 to 59. Using the predefined ± 0.6 s for LT, ± 1 stroke for SC, ± 1 str·min−1 and ± 6 bpm (∼3%) of HR the light gray and dark gray zone were defined. The light gray zone for IE was calculated from the light gray zone for LT, SR, and HR.
When swimming the 12 × 50 m fatigued at the end of session 1, the swimmer was expected to have a higher SR, SC, and HR to swim the same LT compared to when the 12 × 50 m was performed fresh at the start of the session, as in session 2. This would mean that at the end of session 1, IE would be higher, implying that the internal load was higher than the external load.
Visual representation of the results
Continuous data tracking brings along several challenges. An average training session for swimmers tends to be in the range of 5 km or more. For a swimmer in an Olympic sized swimming pool this distance amounts to 100 laps, which will lead to a dataset of 400 points per swimmer if LT, SC and average SR and HR are obtained for each lap. Keeping in mind that most coaches overlook more than one swimmer in the water at the same time and that multiple extra variables can be obtained,64,69,70 this might quickly lead to a loss of overview on the pool deck. The question then arises how to structure and present the data. This can be achieved by furnishing the model in Figure 1 with a proper visual representation. To this end, we propose to use a widget showing a visual representation of the traffic light system (see Figure 4). This widget can be shown on a smartphone or tablet placed anywhere on the pool deck. The widget has three parts:
- Left: identification of the swimmer. This can be an avatar or an id of the swimmer, in our example S1. - Middle: LT, SR, SC, and HR are represented by a colored bar. The color indicates in which zone the variable is, that is, white, light gray or dark gray. The height of the bar indicates if the value is within, above or below the white target zone. - Right: information about IE. The value of IE is also represented in the color of the left and right part of the widget (white, light gray, or dark gray).
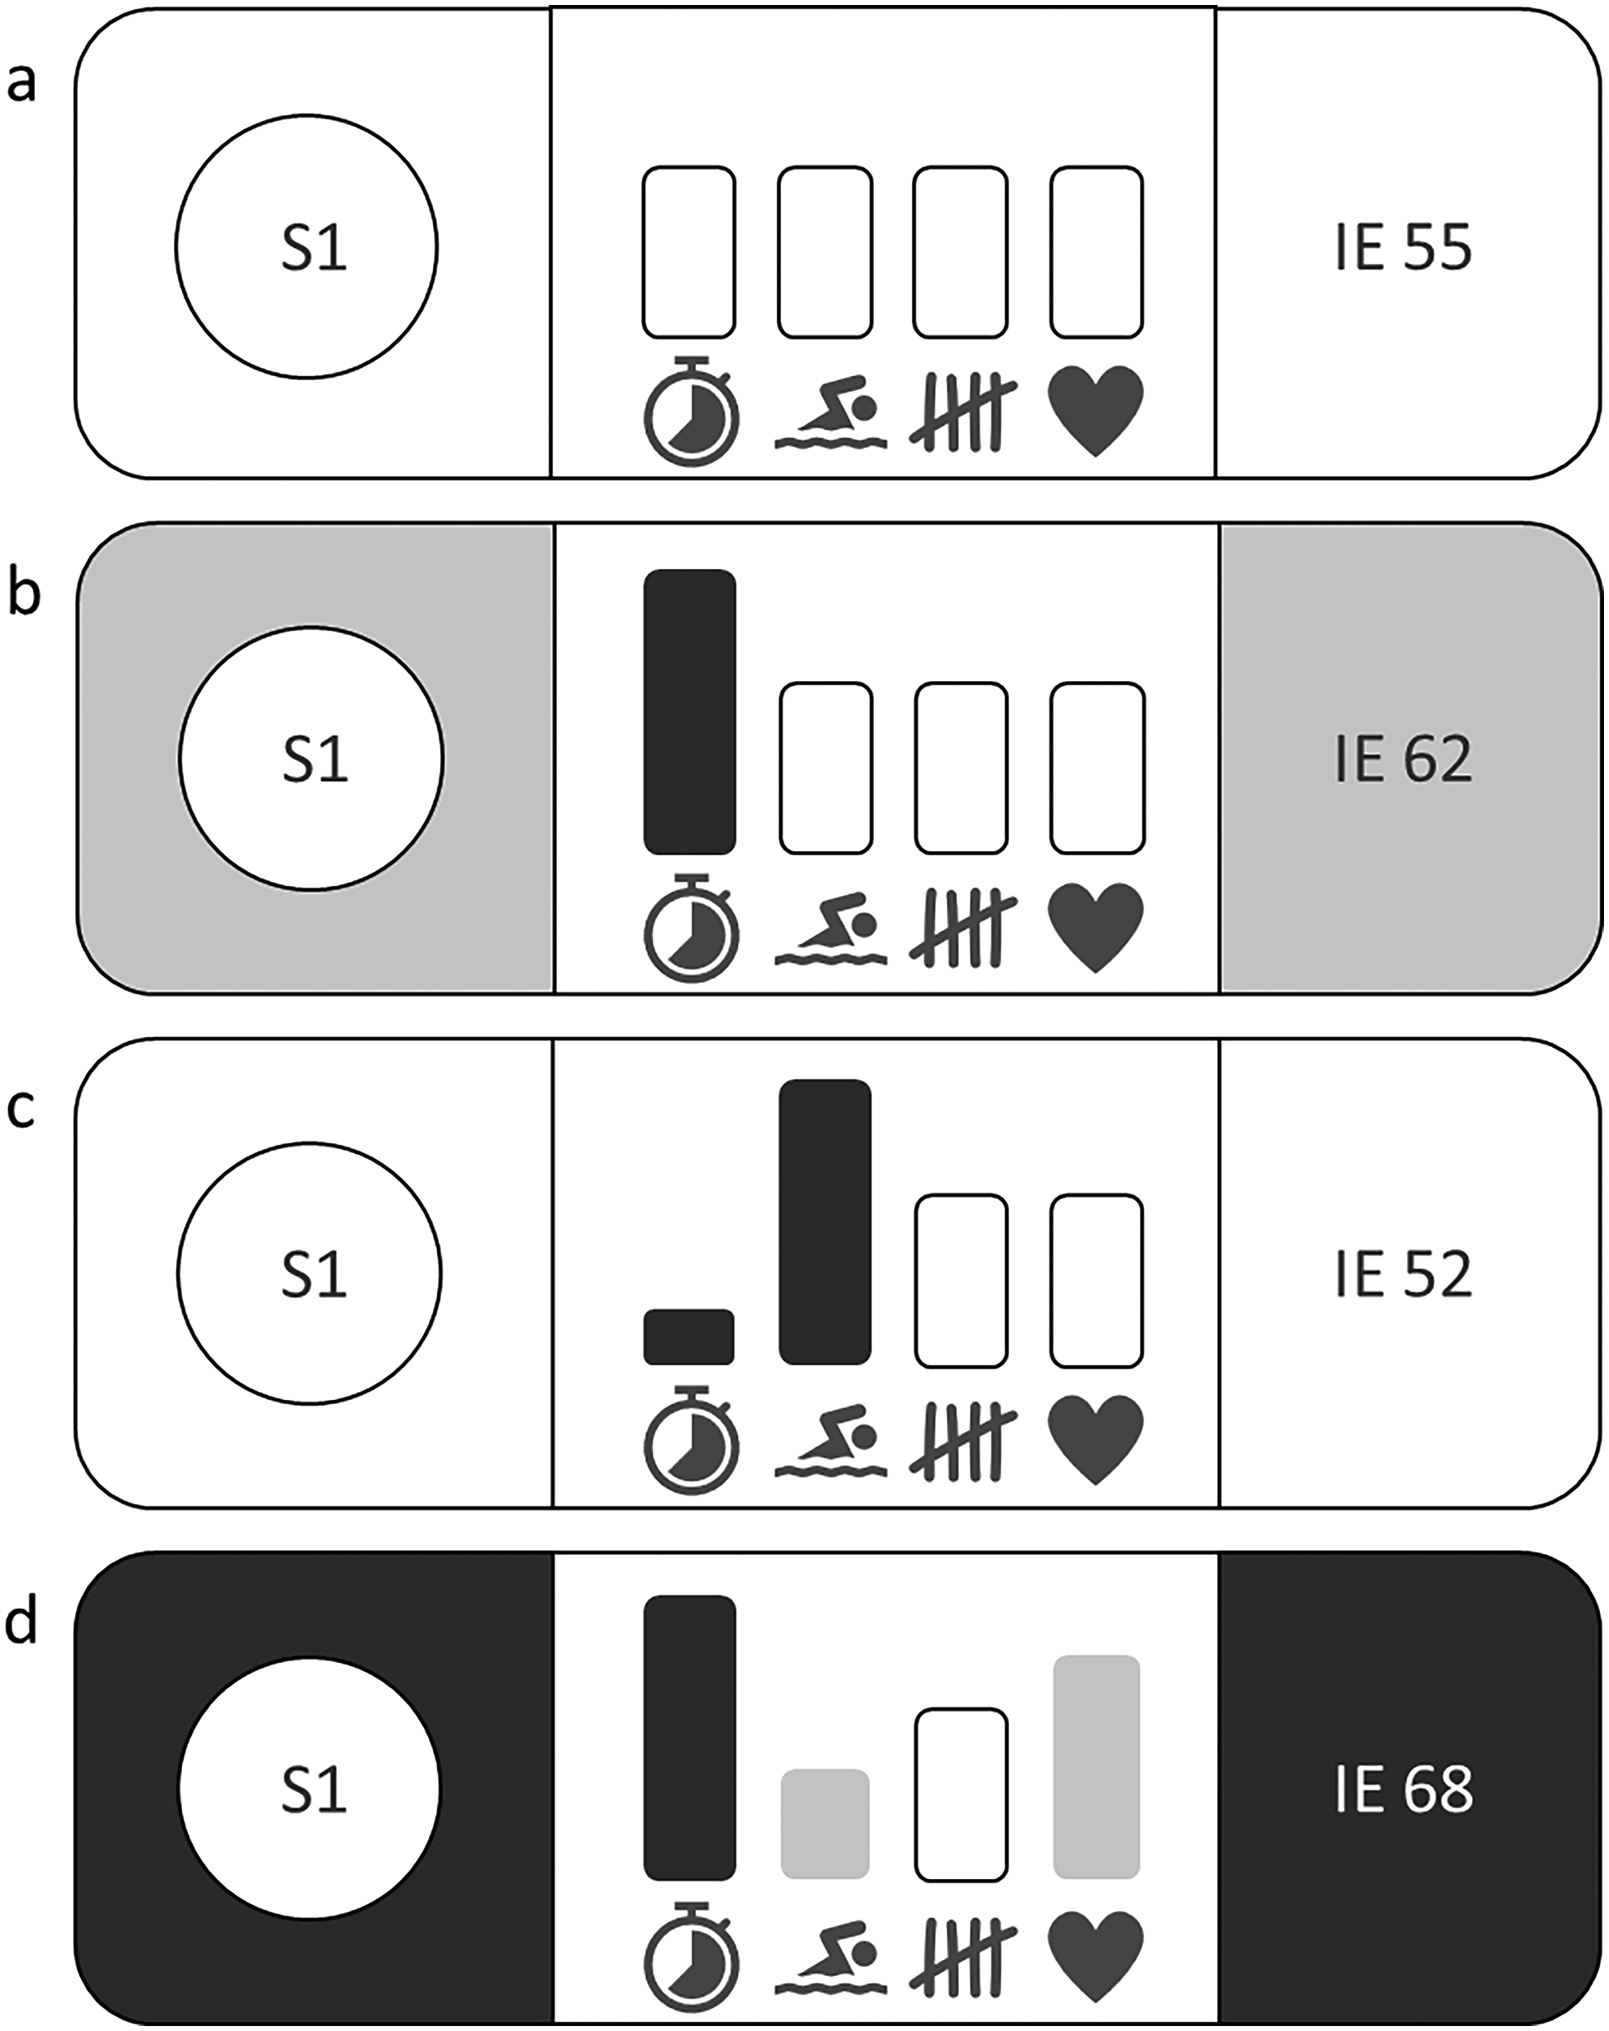
Dashboard widgets of the last completed swimming lap. For swimmer 1 (S1) four different laps are shown: (a) 3rd 50 m of session 1, (b) 9th 50 m of session 1, (c) 3rd 50 m of session 2, and (d) 9th 50 m of session 2. The widget has three parts: left—swimmer identification (S1); middle—overview of lap time, stroke rate, stroke count, and heart rate; and right—the IE. The color of the left and right part of the widget is dependent on the level of IE. The bars in the middle indicate the compliance level. The color of the bar shows where the variable is compared to the target: white—within the target range, light gray—outside of the range by a small margin (± 0.6 s for LT, ± 1 stroke for SC, ± 1 str·min−1 and ± 3% of HR of the white zone) and dark gray—outside of the light gray zone. The height of the bar indicates if the variable is below or above the target in five steps with the middle step defined as the target range. HR: heart rate; IE: internal to external load ratio; LT: lap time; SC: stroke count.
Scaling up the representation to more athletes is straightforward with appropriate software. Multiple athletes can be represented by adding a widget per athlete with clear unique identifiers for each athlete. In this way, the coach has an overview of the performance and compliance of all athletes while the swimmers can see their own individual performance. In the case of the example session, this information could have assisted the swimmer in adjusting his strategy to optimize the outcome of the session.
Acting on the acquired data
Figure 4 provides information on the training for the exemplary swimmer. Four possible scenarios are shown.
Entirely white widget: the swimmer fully complied with the training program. One dark gray variable, that is, LT, and IE in the light gray zone. Two dark gray variables, that is, LT and SR. One dark gray and two light gray variables, respectively LT, SR, and HR. In addition, IE is in the dark gray zone.
Objective data-based decisions can be made based on the widget. The response is simple when the widget is white (Figure 4(a)): the swimmer can continue in the same manner. When a single variable is out of range (LT in Figure 4(b)), a physiological (HR) or a technical/biomechanical (SR and SC) intervention can be selected. The intervention might differ depending on the repetition and the position in the training set, that is, at the beginning or the end of the set. IE is higher at the end of a set in session 1 (Figure 4(b)), indicating that the swimmer needs to reach a higher HR to maintain the same technique at a slower velocity, which is expected at the end of a session. Simple verbal encouragement could be the course of action or split times can be set as target times.
Decisions on how to act become harder when multiple variables deviate from the norm. The model depicted in Figure 1 shows that the variables interact; this interaction is visible in the data represented by the traffic light system and IE. When the session is intended to be more technical, the intervention should address SR and SC in combination with LT. When the goal of the session is more physiological, the intervention should be focused on HR in combination with LT. Note that achieving the goal of the session becomes increasingly difficult when the target LT is faster, because the required effort will be closer to the swimmer's maximum. In response to such situations, different approaches can be taken, such as allowing the swimmer more rest.
At the start of session 2 (Figure 4(c)) the swimmer has a lower LT and a higher SR, both in the dark gray zone. The HR has not yet increased, as indicated by a white IE. However, this is expected to happen at higher velocities.71,72 The swimmer should slow down and focus on his technique, because the set will continue for another 9 repetitions of 50 m. In the session in question the coach did not interfere with the set. Figure 4(d) shows that the swimmer was unable to maintain the target LT and did so with a lower SR, higher HR, and higher IE. This is a clear indication that the swimmer could not maintain the target ranges. This situation may be handled differently, for example, by adjusting the task to allow the swimmer more rest, by continuing the task to find out what the reason was for the outcome of the training session through evaluation afterwards, or by terminating the series.
Interestingly, Figure 4(a) and (b) were part of session 1 in which the 12 × 50 m was swum at the end, whereas Figure 4(c) and (d) were part of session 2 where the 12 × 50 m was swum at the beginning. The strategy used by the swimmer in session 2 was not the correct one and an intervention should have been made as soon as possible based on the data presented on the smartphone or tablet during the session.
Outlook
As explained and illustrated, the coach can use the model as a framework to design and evaluate the training program for individual athletes, based on measurements of the variables LT, SR, SC, and HR. With the assessment of multiple variables per lap of the swim training, initial strides have been taken to continuously track the athlete during training. Information on compliance with athlete-specific visual data representations ensures that the coach can maintain an overview.
Online tracking enables continuous monitoring of the training process. Various attempts at monitoring have been made in various sports including swimming by tracking different variables on a regular basis.73–75 However, due to the complexity of the resulting models and difficulties involved in obtaining the data, these models have not yet found their way to the daily training practice of swimming. Recent studies have shown that monitoring the training load in terms of external and internal load may be used as a tool to assess the effectiveness of the training program.55,66,67,76 With the current state of affairs in sensor technology, objective internal and external load variables have become accessible, rendering the IE ratio valid and meaningful. Additionally, the technology enables prompt summaries per session with information such as time spent or distance covered in a certain training zone, 1 meters swum77,78 and the average IE, which can be combined with subjective information such as the session rate of perceived exertion.76,79
Future software development should focus on improving the connection between the training session created by the coach and the swimmer's performance during that session. For instance, the designed session consists of 12 × 50 m at a certain LT, SR, SC, and HR. The measured LT, SR, SC, and HR, combined with IE, are shown and compared to the designed targets. The software connection provides feedback based on the proposed model in the form of the dashboard widget. The widget should be adaptable to the needs of the coach and swimmer and configured to show one or multiple variables. A new surge in performance is possible due to better tracking, optimization, and (direct) control of the training process, which might be enhanced and automated in the near future using artificial intelligence. 80
Several variables of the model are difficult or impossible to measure directly in the daily training practice. For example, an indication of anaerobic power via the increase of blood lactate accumulation can only be obtained after exercise. Many coaches do not have the accreditation or means to measure the blood lactate accumulation. However, as recognized by Zamparo et al., manipulation of stroke parameters will affect energy cost.30,81 This implies that changes in SR and SC at higher vswim will also provide an indication of the metabolism. Any change in the aforementioned variables will lead to a response in the interrelations between SR, SC, HR, and LT. The IE provides insight into the question on how the physiological/internal and biomechanical/external factors interact.
The presented levels of compliance are generic guidelines. The coach is in charge of deciding which levels are (un)acceptable or less relevant. For example, in ultra-short race-pace training, more emphasis will have to be placed on biomechanical over physiological adaptations, with more focus on SC, SR, and LT.43,82 Similarly, it might be decided that the swimmer should reach a certain level of HR, focusing on a certain training zone, 1 while the other variables change to enable this to happen. Prior to an important competition, when race levels have been established, low compliance levels might be required. 83 In any situation at any time for any swimmer, suitable compliance levels should be determined, keeping in mind the heuristic rules of the model.
The model is applicable in any environment, with or without sensor technology. Swimmers self-monitor SC and HR and check their times on the pace clock. 84 In addition, coaches provide SR and LT with their stopwatches. Training programs are designed in which target ranges are accounted for and swimmers are tracked with careful logging, testing, and registration of the results to observe if they comply with the program. When one variable turns noncompliant in a set, action can be taken in accordance with the defined heuristic rules. This process boils down to coach creativity and swimmer accountability.
The aim of this study was to provide guidelines for the coach based on available sources of information linked to the heuristic model to assist in coaching the athlete. Both the model itself and the implementation of the model are interesting avenues for future research. The coach can translate the information into instructions and feedback for the athlete. How the coach does this, and which coaching philosophy the coach embraces in this regard, is another issue, that falls outside the scope of the present, coach-focused contribution. In general, however, it can be stated that the instructions have to be provided in such a way that the swimmer can handle them cognitively to improve execution and learning, focusing on the goal-oriented nature of action and the direct connection between perception and action.85,86 Practical examples focus on optimizing cognitive activity through specific instructions and different forms of sensory feedback.87–89
The ultimate goal of training in competitive swimming is to improve performance, that is, to improve the end time through shorter split times. The targets, programs and planning for training depend on a careful analysis of where and how race improvements might be found. Over time, this leads to a cyclical process of change: the race leads to a training plan, which leads to the next race, based on which the training plan is reevaluated and adapted to realize further performance improvement, be it in the same or a different direction. The acquired data and the proposed model can assist in crafting an optimal training program for each individual swimmer through careful tracking of the swimmers and gathering knowledge about what has been done and accomplished in training. Apparently, different swimmers require different training targets, such as a greater focus on endurance intensive efforts, high intensity efforts or explosive efforts. 53 It has been established empirically that several profiles of stroke rate management can lead to high swimming performances,39,90 implying that swimmers tend to race in kinematically diverse ways. Indeed, some swimmers are more sensitive to constraints on stroke rate, others to swimming speed and still others to a combination of stroke rate and swimming speed when asked to swim at maximum speed. 91 Likewise, some swimmers benefit more from training on maximizing power output, while others benefit more from endurance or technique training, as is also apparent from case-studies reported in literature.77,92 The variation in training focus implies that the importance of different measured variables can change depending on swimmer, planning, and coaching philosophy: end time (and thus split times) is evidently the most important outcome variable, which can be combined with one or more of the other variables that can be readily measured while training and interpreted in terms of the power balance. This does not imply that the proposed heuristic model represents the holy grail for competitive swim training. Ultimately, the biological processes and individual stress reactions that are induced by training need to be understood in detail to be able to optimize training programs for individual athletes. This requires an interdisciplinary research effort, involving (epi)genetics, system biology, hydrodynamics, and cognitive (neuro)science, which goes far beyond the heuristic approach proposed here.
The presented heuristic model can be used as a framework to track and tailor the training program to the characteristics of individual athletes. Measurement of the variables SR, SC, HR, and LT will provide an abundance of information. We explained how this information can be interpreted to design training sessions and decide how to act, considering the swimmer's compliance level and the connection between pertinent variables. The model can be used to map the processes taking place and to gain a better understanding of the swimmer's adaptation and performance profile. With these features, the model can assist the individualization and optimization of the training process, resulting in personal performance improvement of individual athletes and greater athletic success.
Footnotes
Acknowledgements
Declaration of conflicting interests
The authors declared no potential conflicts of interest with respect to the research, authorship, and/or publication of this article.
Funding
The authors disclosed receipt of the following financial support for the research, authorship, and/or publication of this article: This work was supported by the Nederlandse Organisatie voor Wetenschappelijk Onderzoek (grant number 12887).