
Abstract
Objective
Variation in training load is consistently demonstrated within weekly microcycles in soccer, yet less is known of load variations between the same weekday sessions across different microcycles. Our study aim was to examine between-microcycle variability in key measures of external training load.
Methods
Thirty-seven professional soccer players participated in this observational study which took place across the clubs' initial 8-week in-season mesocycle of the 2022/23 season. During this mesocycle, each 1-week microcycle consisted of four distinct classifications of training session (Matchday (MD)-4, MD-3, MD-2, and MD-1, and one match (Saturday). External load data (total distance, high-intensity (>5.5 m.s) distance, high-intensity accelerations (>3 m/s2), and percentage (%) of maximal speed attained) were collected across 564 training sessions (MD-4 = 123, MD-3 = 148, MD-2 = 130, MD-1 = 163). Data were analysed with mixed linear modelling.
Results
When compared to the first microcycle, substantial week-to-week variation was evident for each of the four training session classifications, ranging from 1244 m to 2248 m for total distance, 80 m to 197 m for high-intensity distance, 11 to 25 for high-intensity accelerations, and 10.2 percentage points to 15.4 percentage points for % maximal speed.
Conclusion
Our data show that despite training sessions having a consistency of planned training stimulus across an 8-week mesocycle, external load varied between microcycles. Nevertheless, within-player variability on the same day relative to matchday indicated a more consistent stimulus for key training variables relevant to specific training days.
Introduction
The optimal design of the weekly training microcycle requires a blend of physical, technical, and tactical training within an appropriate tapering strategy in preparation for matchday. 1 As such, there is a need for careful manipulation of training variables within the training microcycle to facilitate a balance of optimal stress and recovery while also maintaining a consistent training stimulus across the mesocycle. 2 While variation of training stimulus within the training microcycle in elite soccer has been demonstrated previously, 3 between-cycle variation has not received thorough analysis. Consistency of the weekly training stimulus during the in-season period may be desirable and should facilitate favourable physical outcomes such as the maintenance of physiological capabilities and a stable chronic training load. 4
A growing body of work relating to the quantification and prescription of optimal workloads in team sports5,6 has provided comprehensive guidelines for physical development via the manipulation of on-field training variables such as pitch dimensions, small-sided game (SSG) durations, and player numbers.7,8 While variation in approaches to physical development exists depending on preferred coaching methodology, 7 it is now common for current training practices to consider the development of high-intensity bio-motor qualities such as speed, endurance, and strength through the manipulation of these variables integrated into the technical and tactical aspect of training. 9 Previously, an integrated coaching process has been described, 10 concurrently targeting physical, technical, and tactical strategies developed across the microcycle. Specifically, the deployed periodisation strategy included collective, unit, and positional-based principles (‘CUPs’) designed to enable coaches to ensure they influence each of the key coaching principles across the training period while also targeting key physical parameters.
Through the analysis of a contemporary periodisation methodology (‘CUPs’), the aim of this study was to evaluate and quantify the variability in training volume between weekly microcycles for each weekday session (with respect to matchday) across an in-season mesocycle for key external load parameters. Given a lack of consistency in training stimulus between microcycle's has the potential to drive unfavourable fatigue-related adaptations and fluctuating chronic training loads this study aims to verify the efficacy of a structured training methodology (CUP's) to provide a reliable external load stimulus. Specifically, the workload variables selected for analysis were total distance, high-intensity running distance, high-intensity accelerations, and percentage (%) maximum speed reached due to their associations with the deployed training model (Table 1), performance, 2 and injury. 4 Given the utilisation of a planned periodisation strategy, it was hypothesised that there would be a consistency of training stimulus across the mesocycle for all variables on each day relevant to the tactical theme.
Example of the ‘CUPs’ microcycle tactical and physical focus, adapted from Owen (2022).
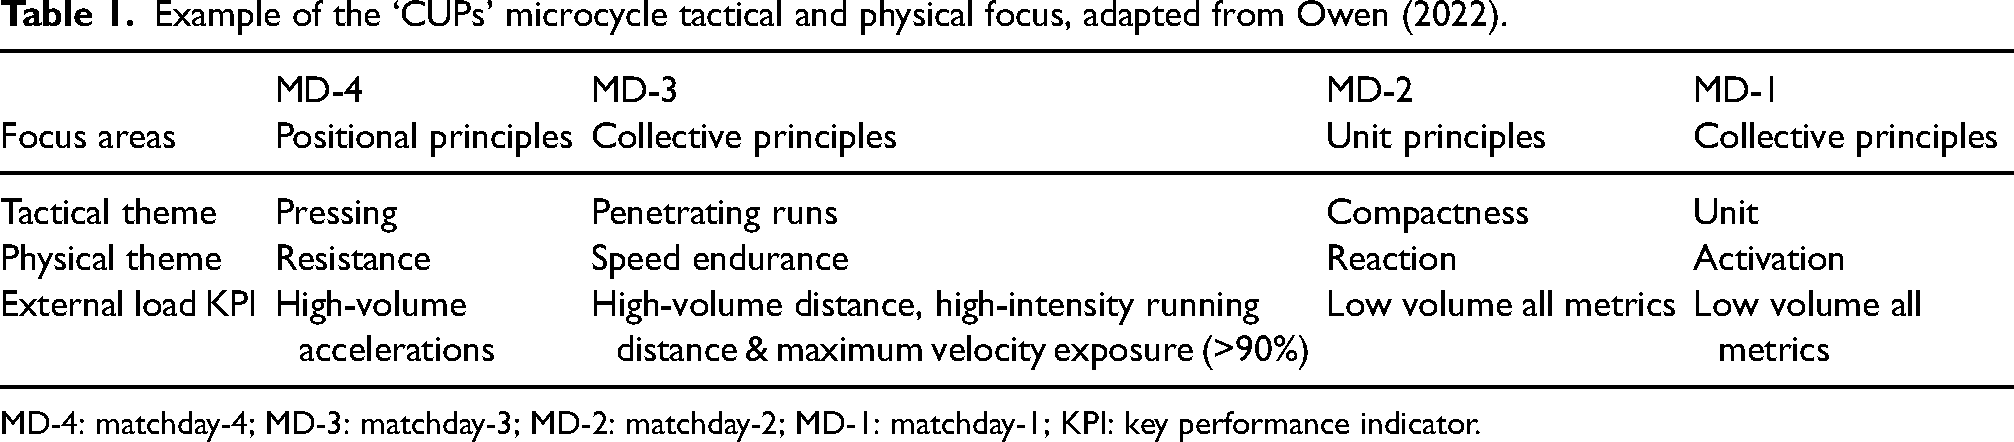
MD-4: matchday-4; MD-3: matchday-3; MD-2: matchday-2; MD-1: matchday-1; KPI: key performance indicator.
Methods
Subjects
Thirty-seven elite male professional soccer players from the same Scottish Premier League club (Height: 181.9 ± 6.7 cm, body mass: 81.1 ± 6.7 kg, Age: 25 ± 4.1 years) participated in this study. The professional soccer club regularly competed in the qualifying stages of European competitions and the squad consisted of players of international calibre (FIFA World Cup, UEFA European Championships). Data were collected as a condition of employment in which player physical performance is routinely measured during training and match play. Therefore, usual appropriate ethics committee clearance was not required. 11
Design
At the beginning of the 2022/23 season, we were presented with the unique opportunity to evaluate between-microcycle variability of training volume as the initial mesocycle of the season involved one match per week (Saturday, 3 pm), with the match preceded by a 4-day block of training (Matchday −4 [Tuesday, MD-4], Matchday −3 [Wednesday, MD-3], Matchday −2 [Thursday, MD-2], Matchday [Friday, MD-1]). Each microcycle therefore consisted of one match and four consecutive daily training sessions, with the exception of microcycle 11 when no MD-2 session was performed. Data were collected across this consecutive 8-week period (microcycles 6 to 13) which immediately followed the teams’ 5-week pre-season training. Across the study period, training sessions were scheduled at the same time of day to reduce the impact of circadian variation. Players were instructed to maintain their habitual dietary intake and water intake across the period. No additional dietary interventions were undertaken throughout the investigation.
Methodology
External load data were collected for every training session using global positioning systems (GPSs) technology (Catapult Sports, Melbourne, Australia) sampling at a frequency of 10 Hz. Each participant wore the GPS device between the scapulae in a tight-fitting vest to reduce movement artefact and layers wore the same GPS device for every session to eliminate any inter-unit variability. Post-session, data were downloaded using the manufacturer's software and exported and stored on a custom-built spreadsheet. The GPS system used has been found to have high levels of validity and reliability. 12 Our four dependent variables were session total distance, session high-speed (>5.5 m/s) running distance, the number high-intensity (>3 m/s2) accelerations, and percentage of maximal sprinting speed (as determined via a maximal 40-m sprint test) attained during the session. The focus of this study was the club's main team training sessions, so additional training, recovery, and rehabilitation sessions were not considered. 4 Goalkeeper data were excluded from the study. Player session data were included if players started the main team training session in which starting and non-starting players trained together. 13 This represents an intention-to-treat approach, which is what happens in practice 14 and therefore consistent with the applied nature of our study. There were a total of 564 training sessions (Table 2) from 37 players with a maximum of 31 sessions per player across the study (median number of training sessions 14, range 1–31). As per the recommendations of Borg et al., 15 for improved research practices in football, an exploratory analysis was conducted to explore for missing values using the visdat package 16 with no missing data for all dependent variables across the 564 training sessions.
Number of training observations per training day (MD) type, along with the median, minimum, and maximum number of players per session.
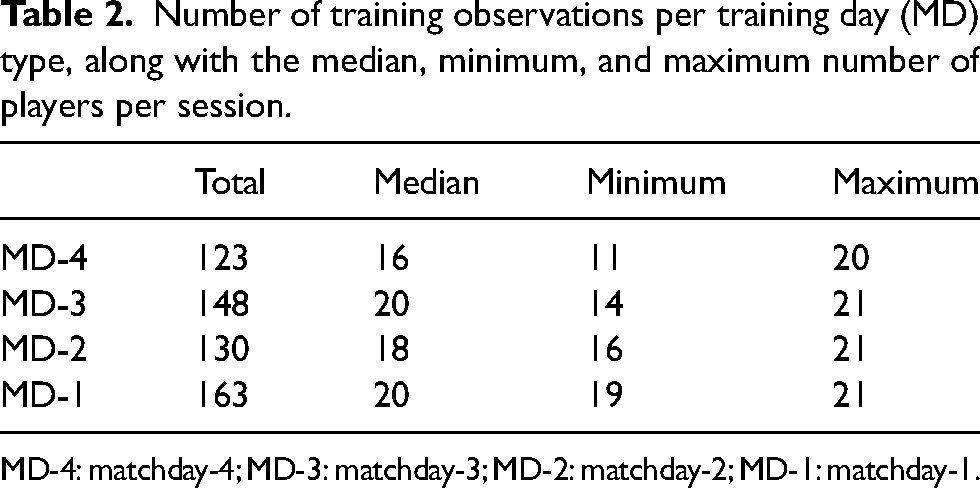
MD-4: matchday-4; MD-3: matchday-3; MD-2: matchday-2; MD-1: matchday-1.
Statistical analysis
Raw data, probability density, and boxplots of session distance, high-intensity distance, high-intensity accelerations, and % of maximum speed per matchday and microcycle are displayed via Raincloud plots. 17 With the exception of MD-4 total distance, where there was insufficient variation to warrant to inclusion of the random effects term, separate mixed linear models (intercept = microcycle 6, fixed effect = microcycle, random effect = Player) were performed on all metrics using the lme4 package 18 with model assumptions and performance verified using the performance package 19 and fixed and random effects plotted using the sjPlot package. 20 Residuals from all four linear mixed models were well behaved, indicating that treating the high-intensity acceleration counts and the bounded % of maximum speed as continuous was acceptable. For all models, we present between-microcycle differences (in raw units); however, we elected not to interpret the presence of an effect via the dichotomisation of null hypothesis significance testing. Instead, we considered the implications of all results compatible with our data, from the lower limit to the upper limit of the interval fixed effect estimates. 21 Therefore, the difference between the lower and upper limit of the fixed effects represents our measure of variability as reporting in the original units maximises the practical context of findings. 22 Uncertainty in our estimates is presented as 95% confidence intervals (95%CI) and all visualisations and analyses were performed in R (version 4.1.2, R Foundation for Statistical Computing).
Results
Total distance (m), high-intensity distance (m), number of high-intensity accelerations, and % of maximum speed attained for the study's four classifications of training day (MD-1, MD-2, MD-3, MD-4) are presented in Figure 1. Within-microcycle comparisons were not a study aim and therefore these data are presented for descriptive purposes only.
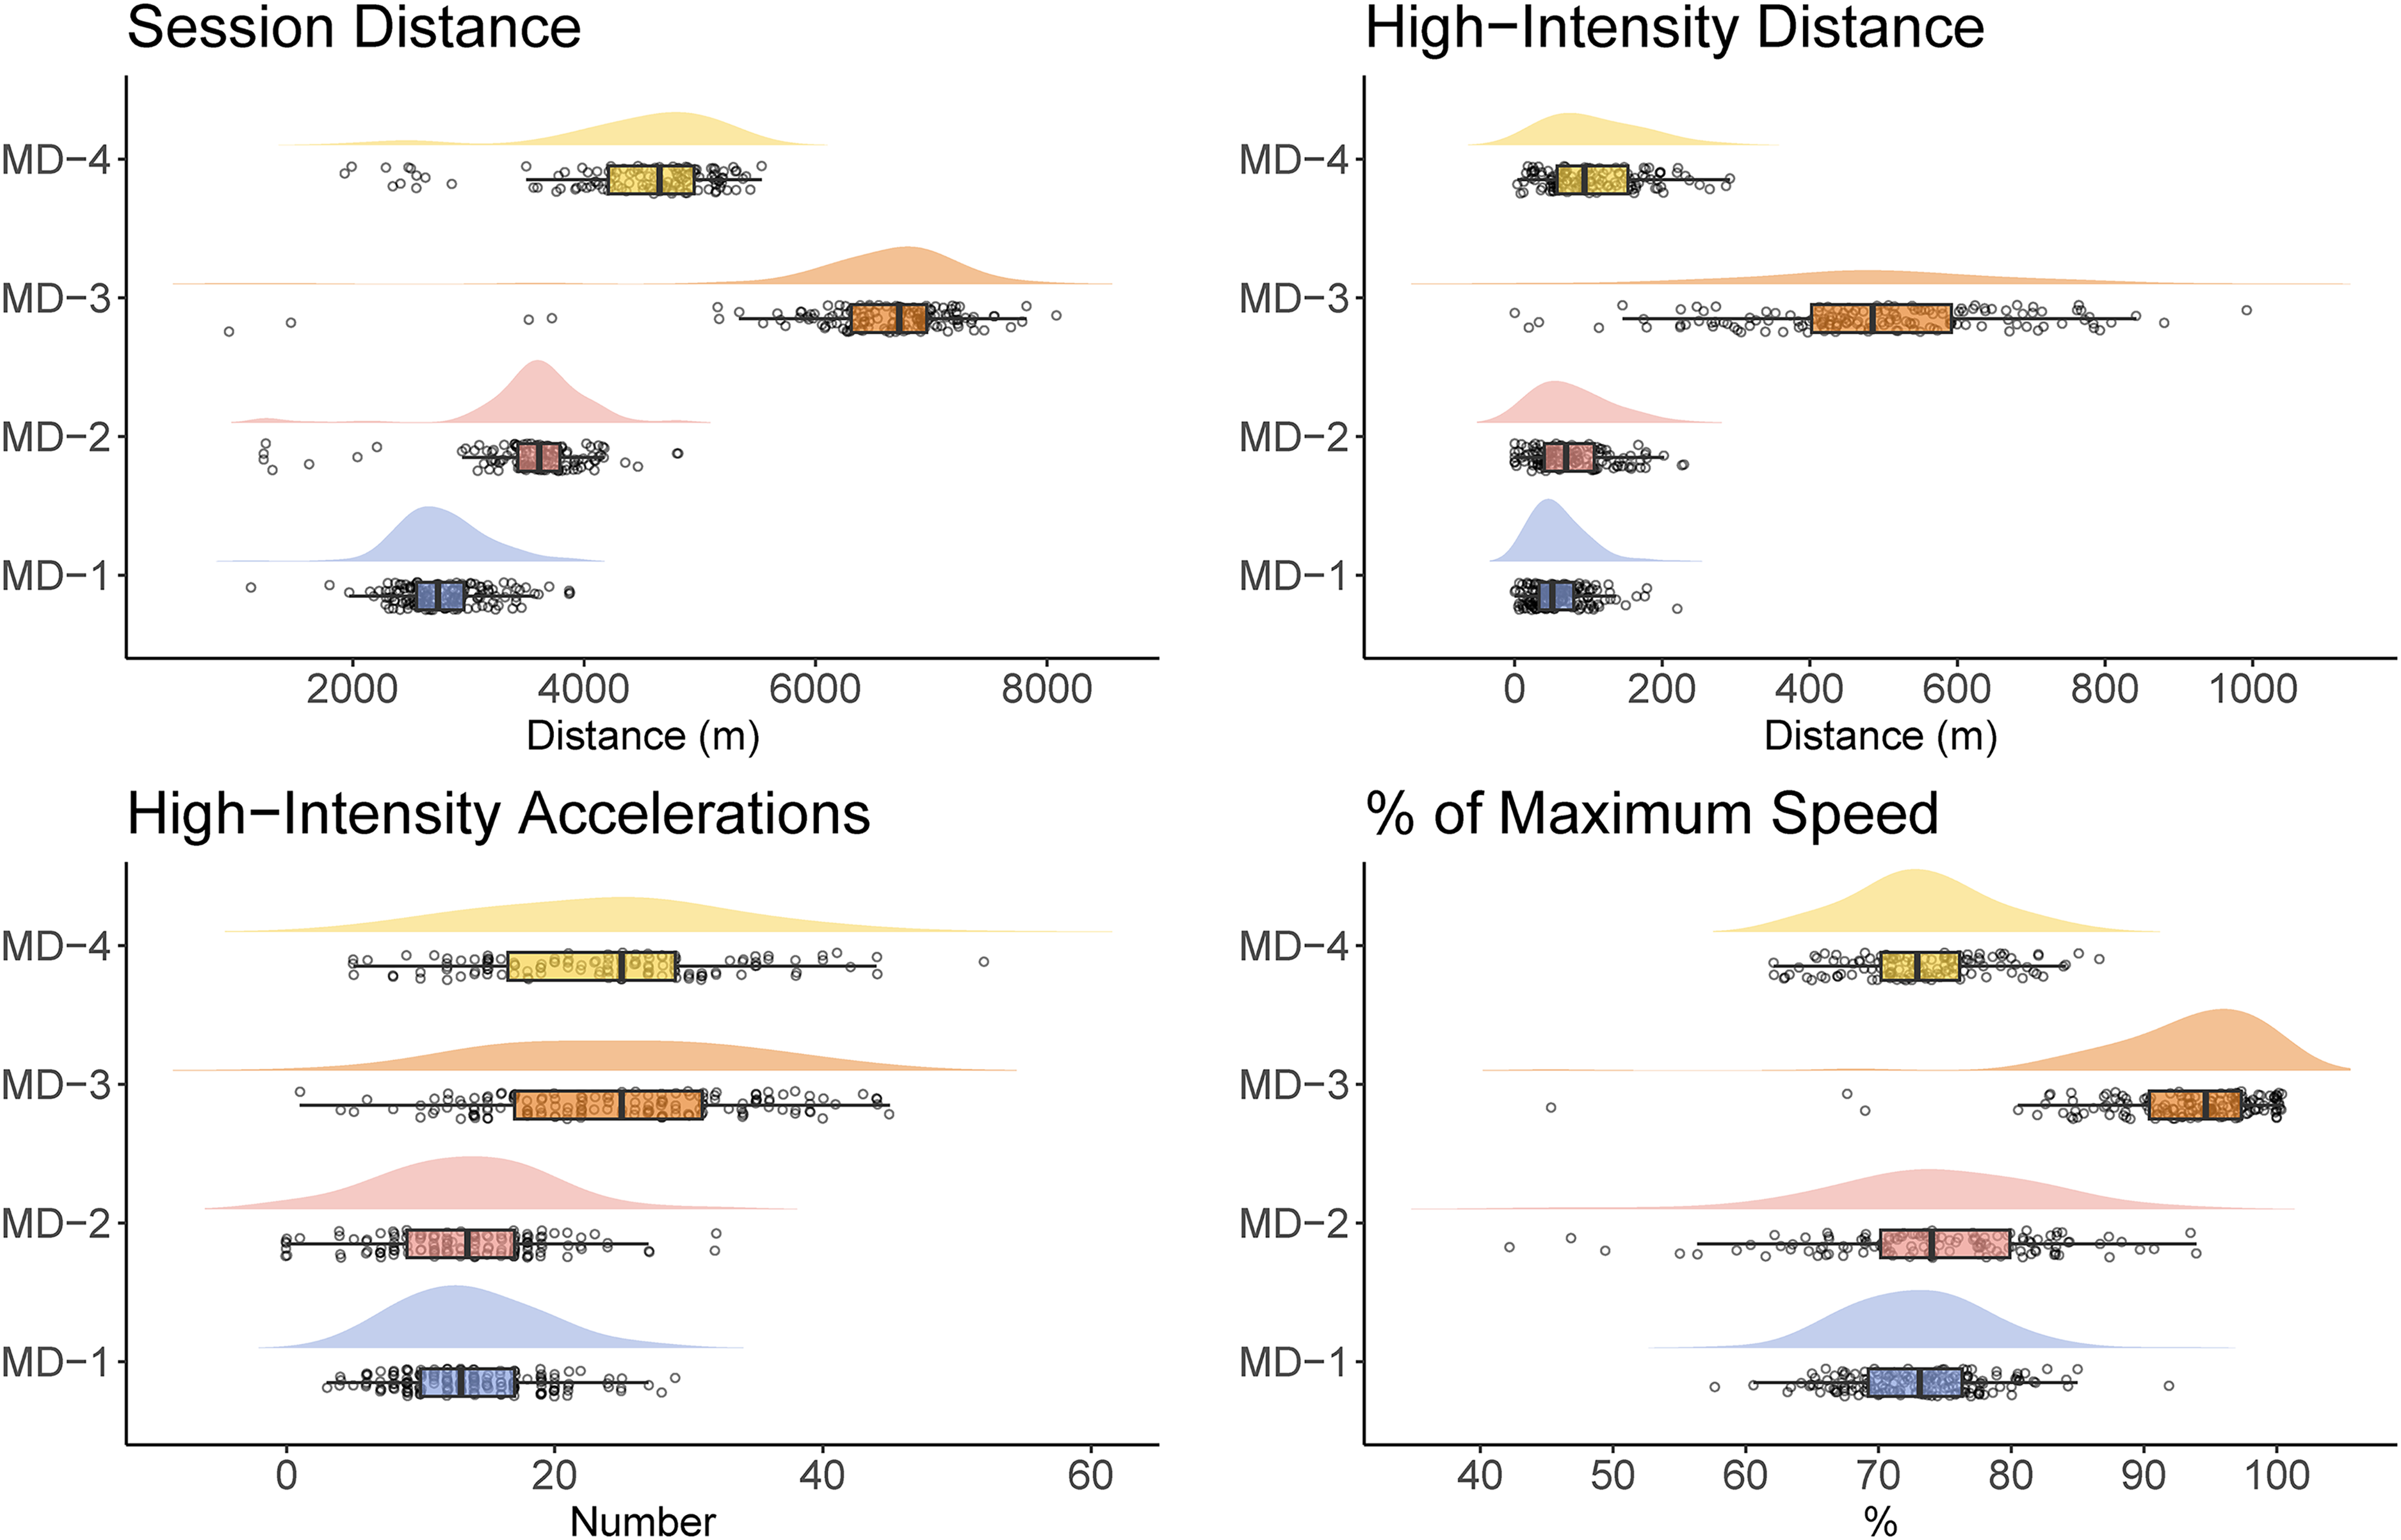
Raincloud plots showing the raw data, probability density, and boxplots for session distance, high-intensity distance, high-intensity accelerations, and % of maximum speed across each training day.
Total distance (m)
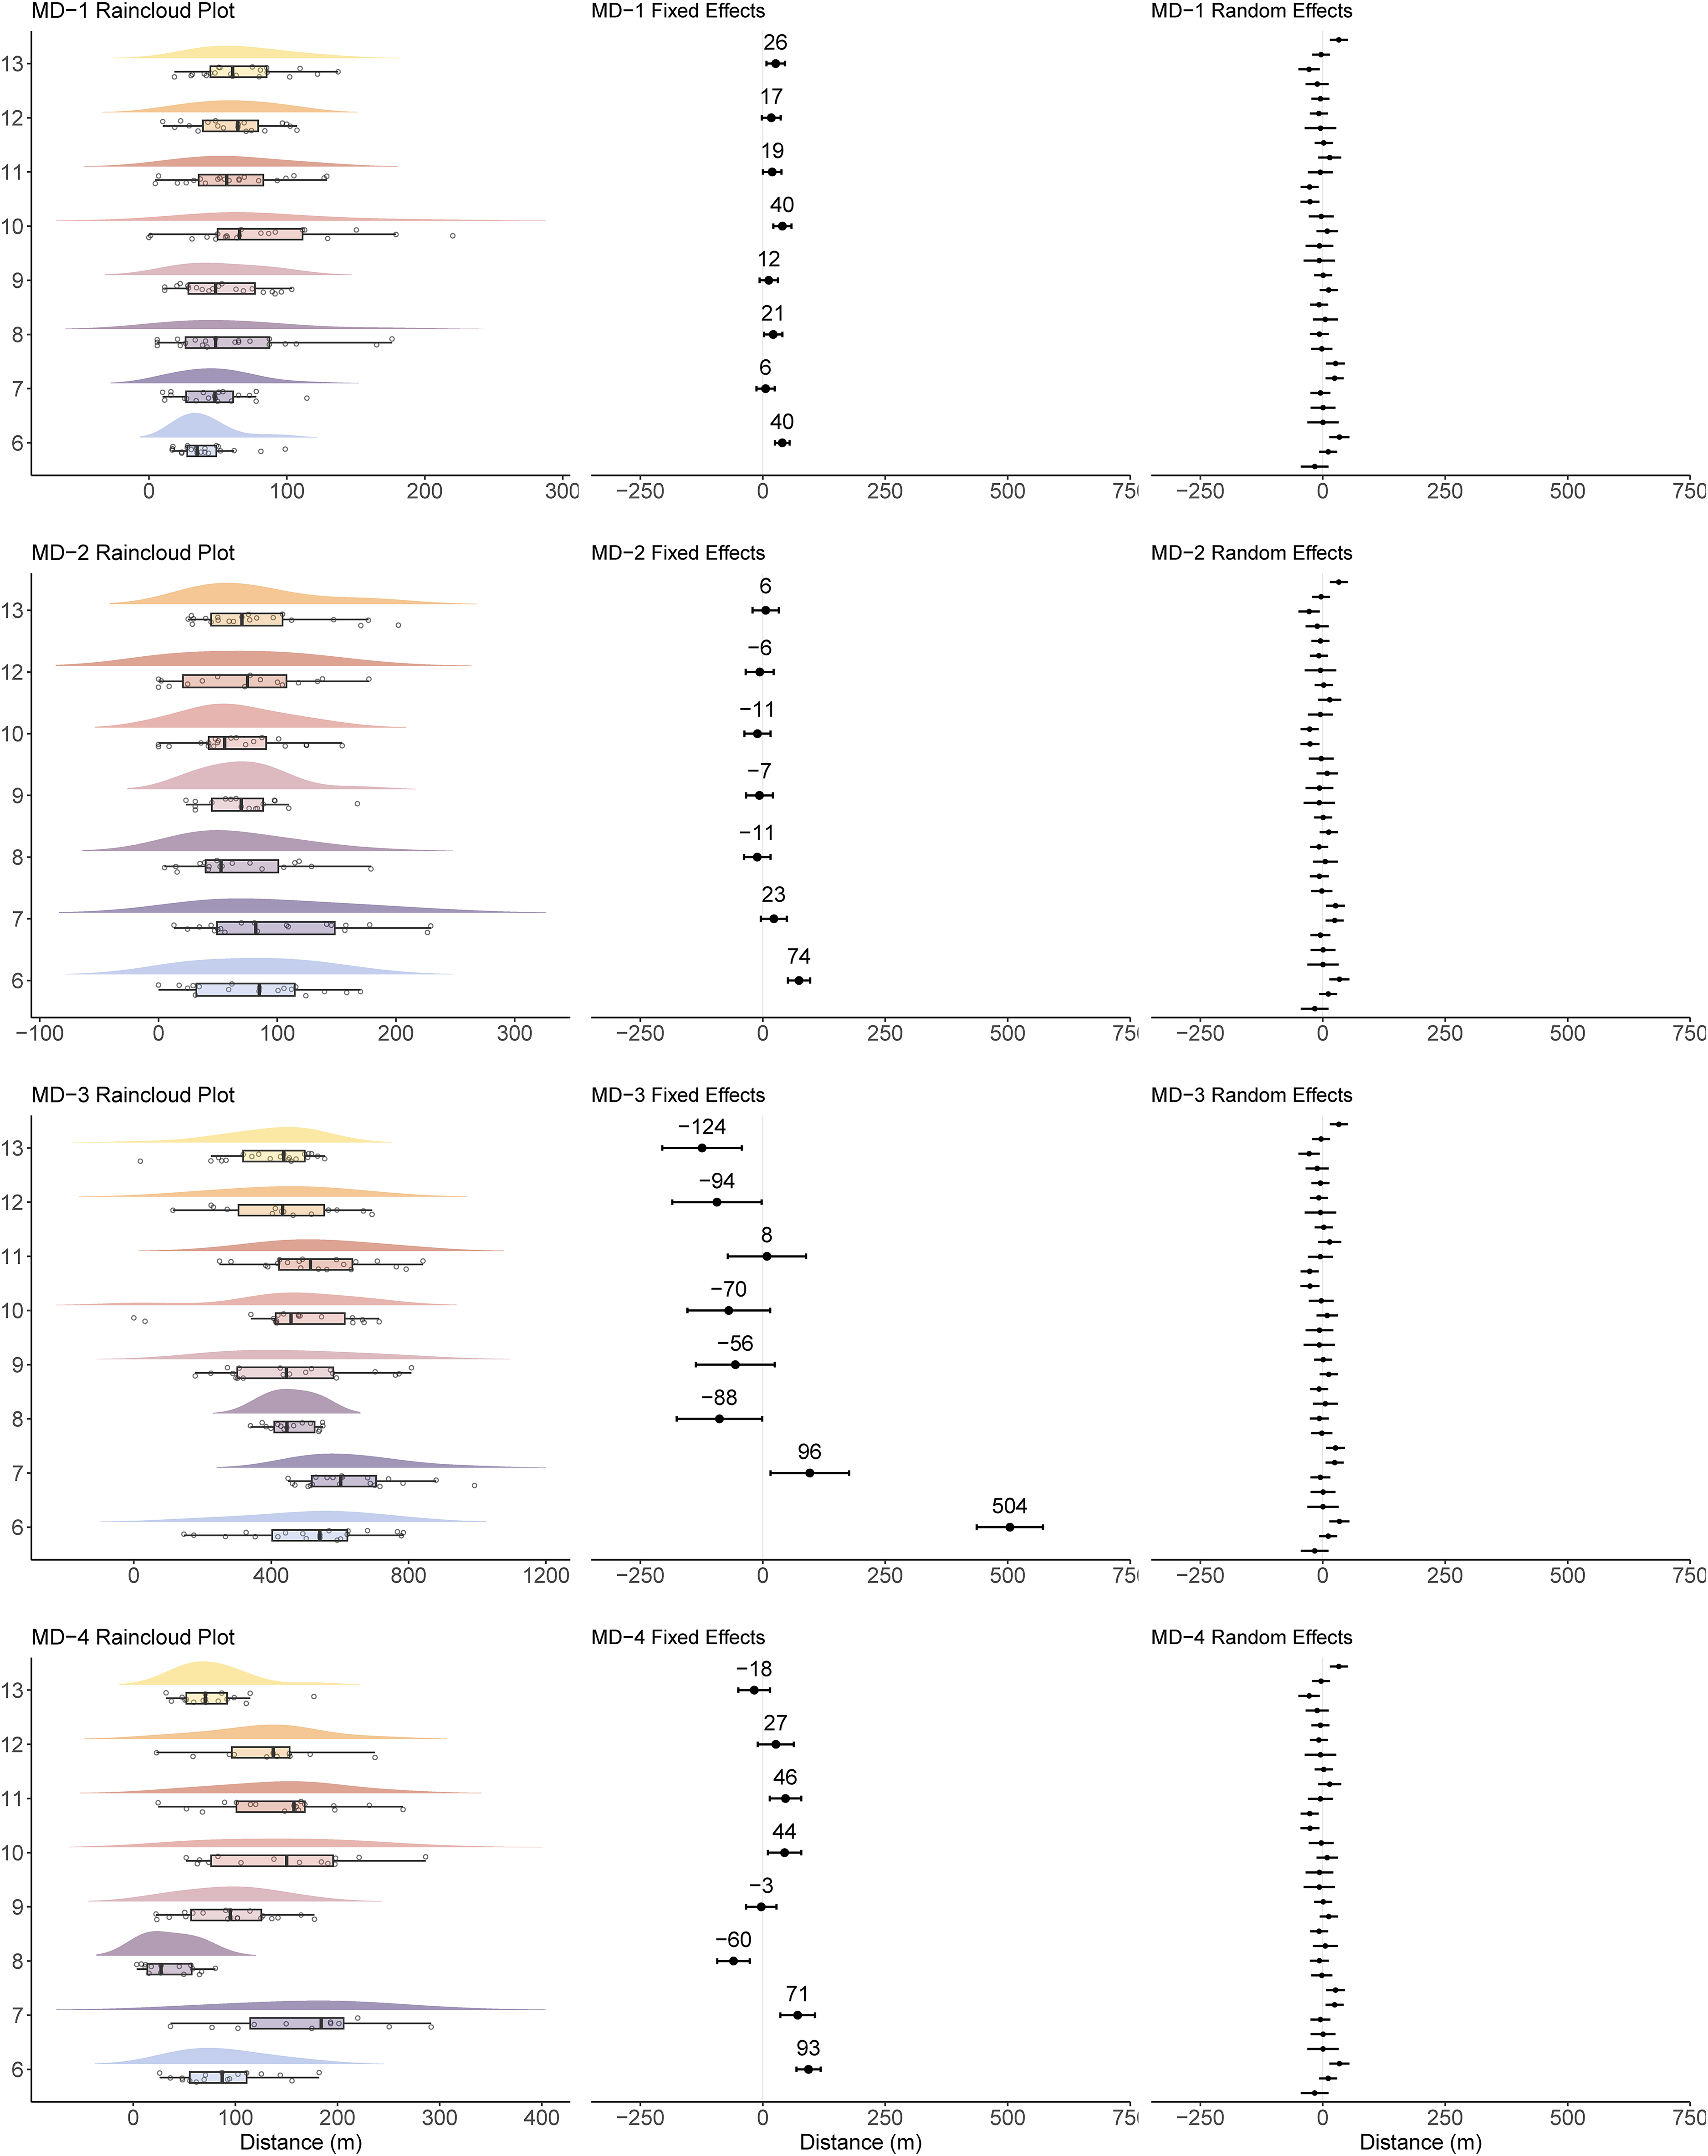
Compared to the model intercept (microcycle 6), the lower to upper estimate limit for between microcycle differences (Figure 2) spanned 1244 m, 1503 m, 1916 m, and 2248 m for MD-1, MD-2, MD-3, and MD-4, respectively. Random effect of player explained 0% to 35% of the variance in total distance left over from the fixed effect of microcycle, and the within-player SD's were up to 381 m (Table 3).
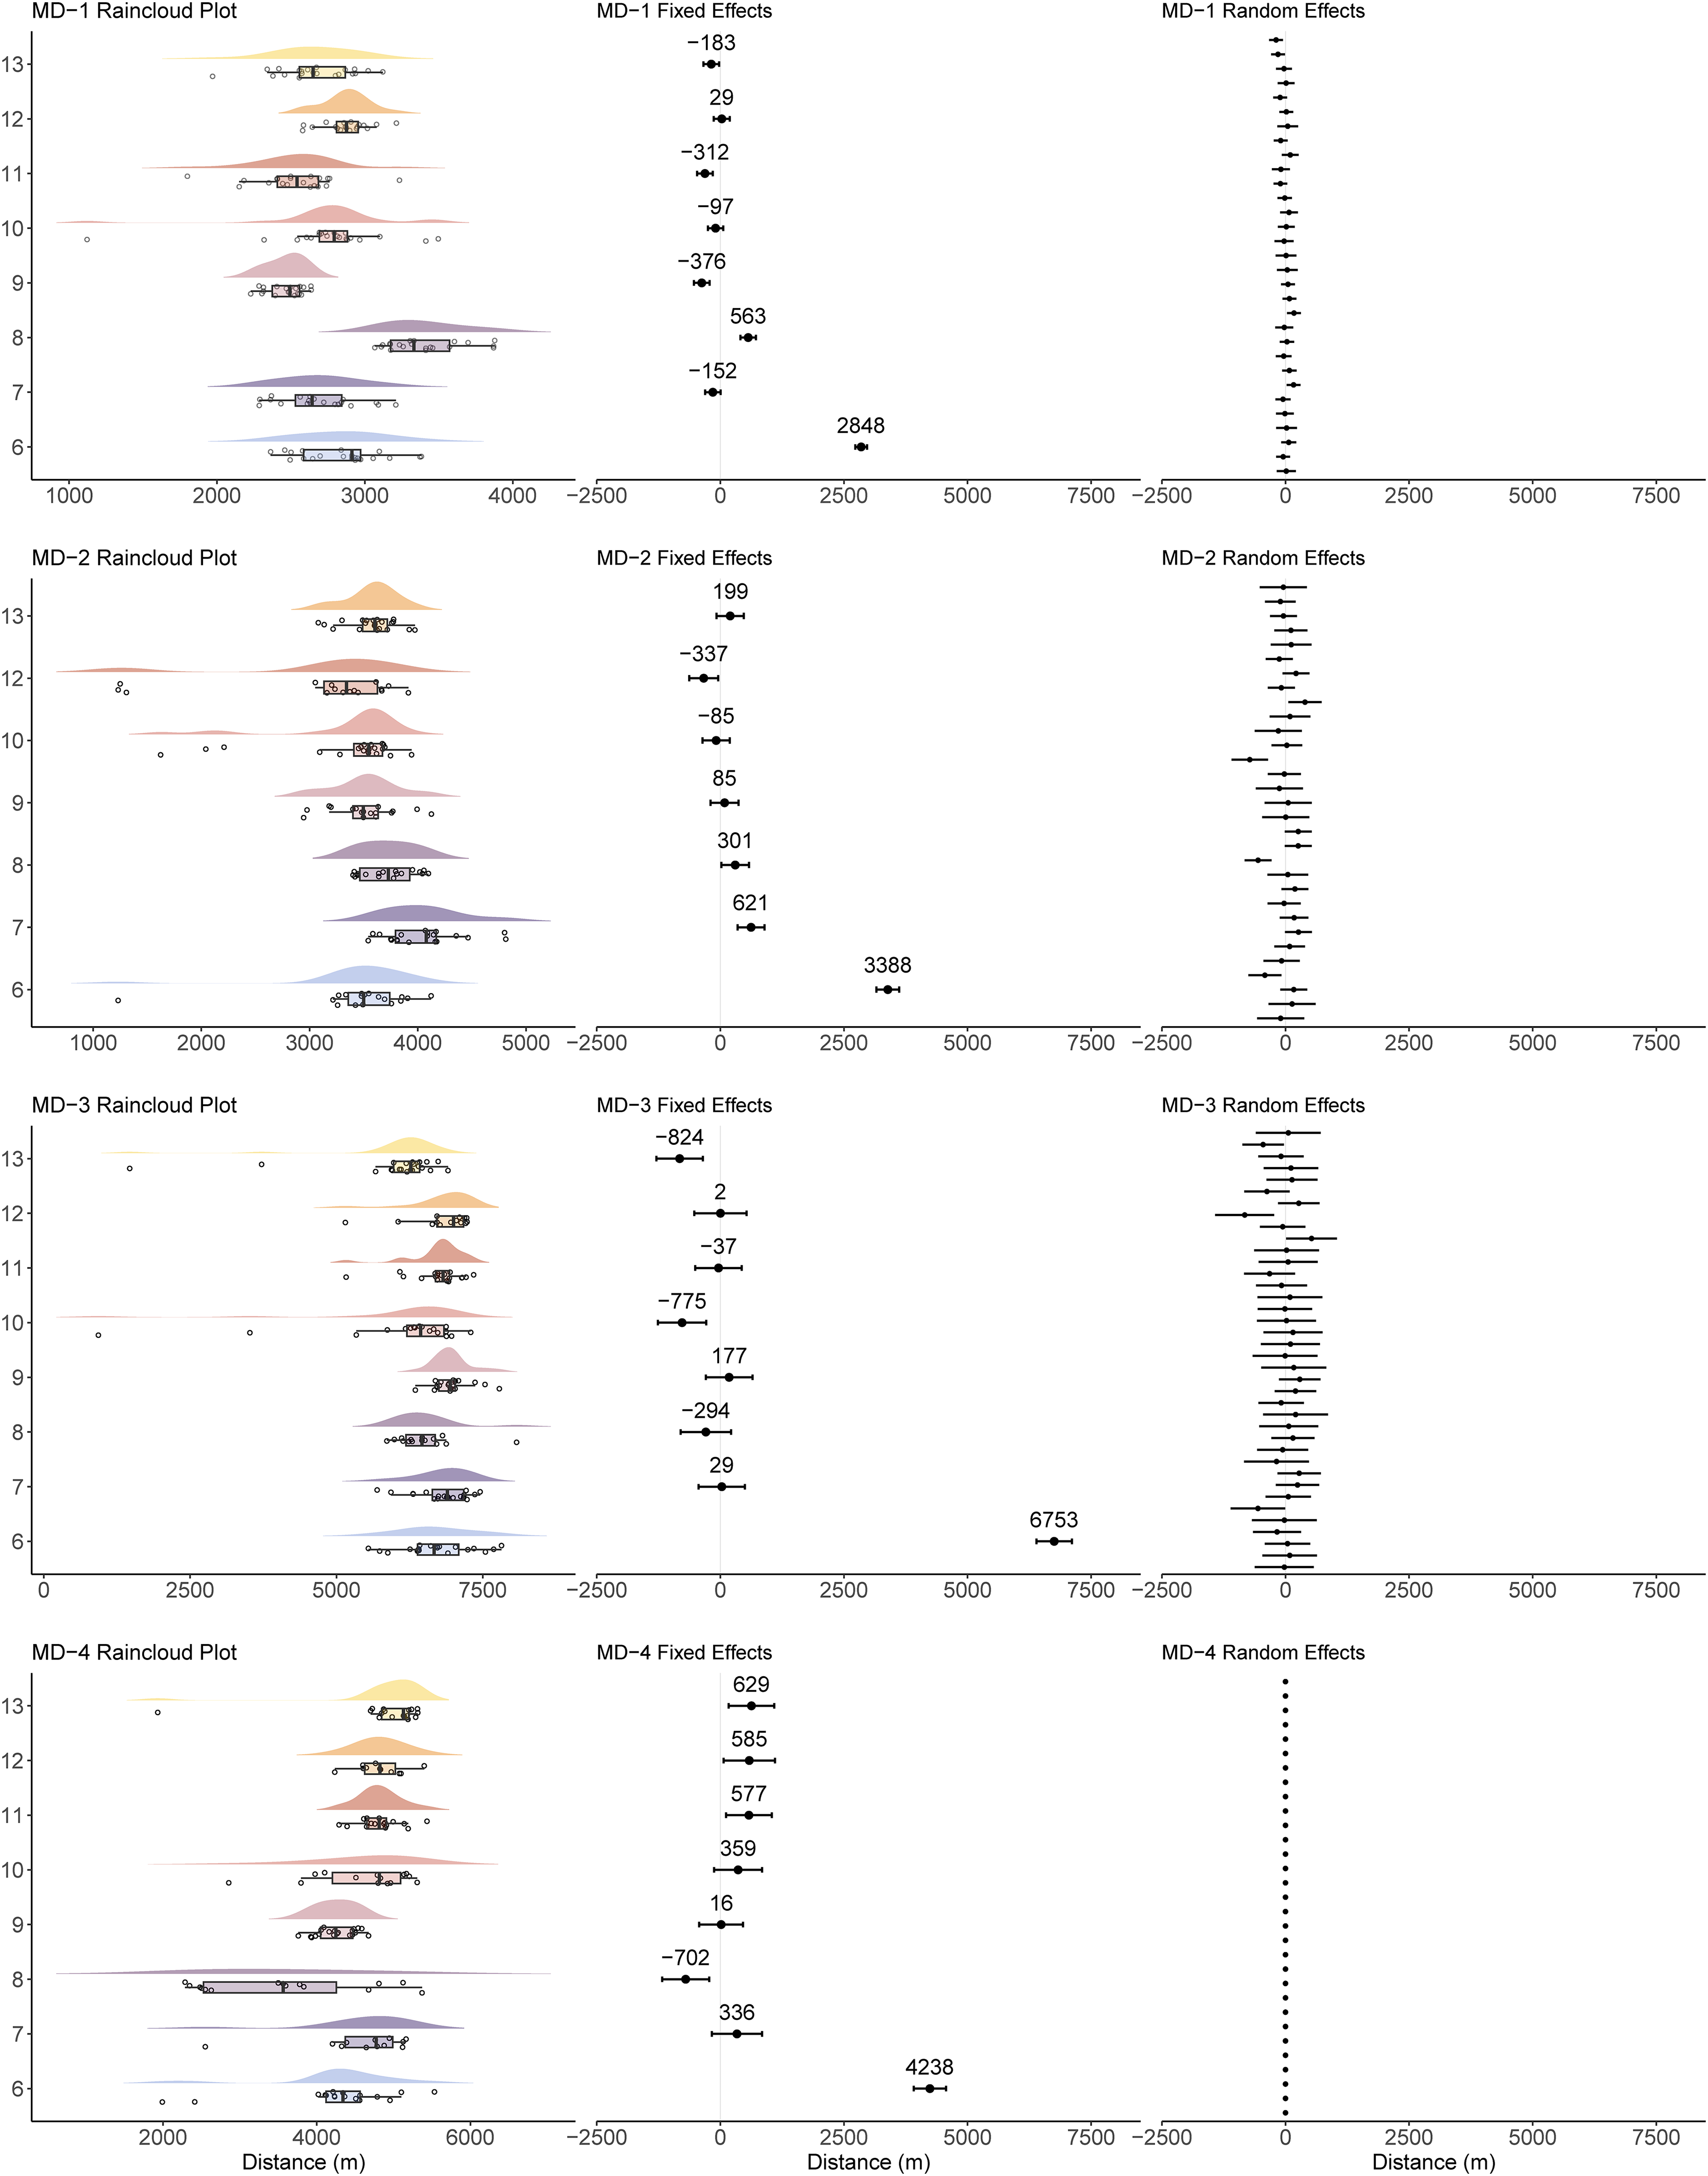
Raincloud plots (left panel), along with fixed (middle panel) and random (right panel) effect estimates with uncertainty (95% confidence intervals) from the total distance mixed linear model.
Within-player standard deviations for total distance, high-intensity distance, high-intensity accelerations, and % of maximum speed.
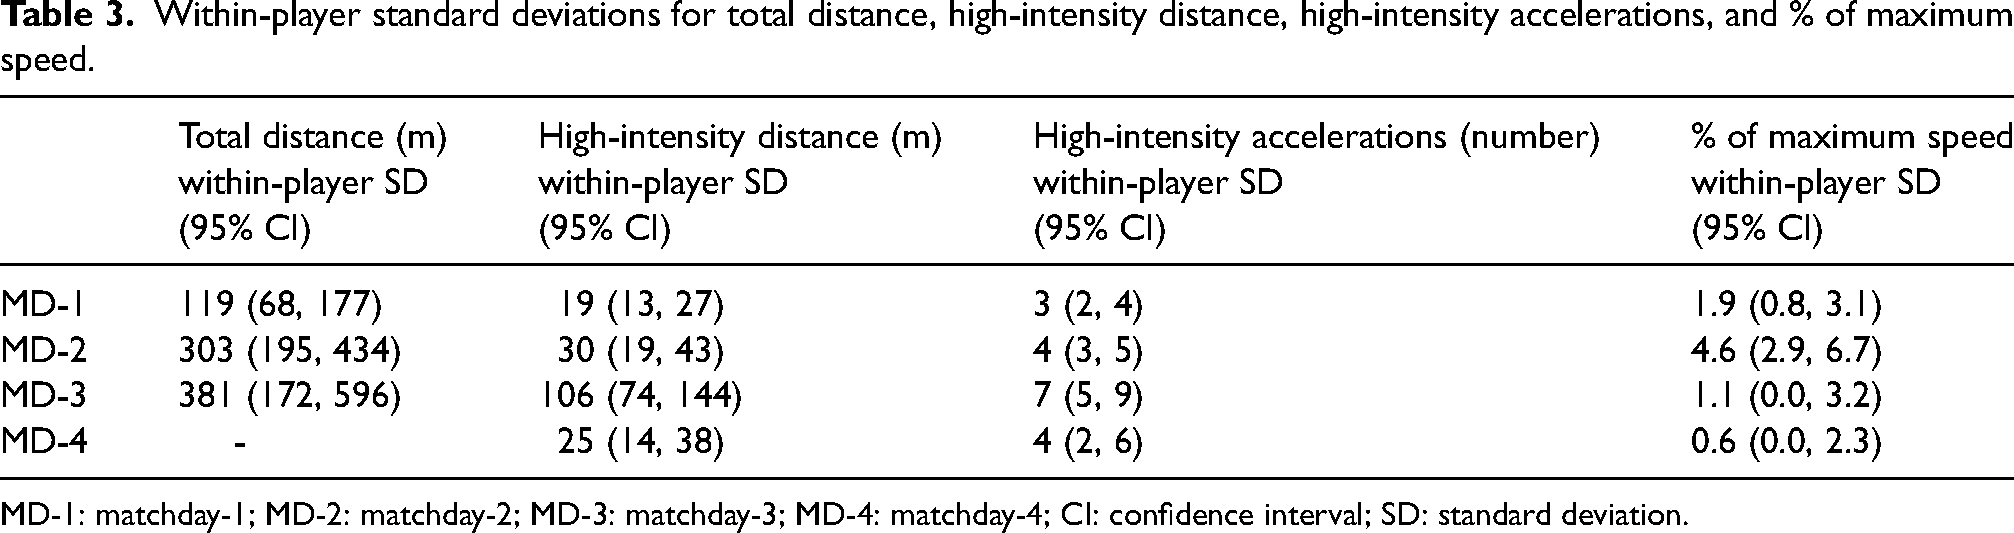
MD-1: matchday-1; MD-2: matchday-2; MD-3: matchday-3; MD-4: matchday-4; CI: confidence interval; SD: standard deviation.
High-intensity distance (m)
Between-microcycle differences spanned a lower to upper estimate limit of 80 m, 86 m, 375 m, and 197 m for MD-1, MD-2, MD-3, and MD-4, respectively (Figure 3). Random effect of player explained 23% to 42% of the variance in high-intensity distance, and the within-player SD's spanned 19 m to 106 m (Table 3).
Raincloud plots (left panel) and the fixed effect estimates (middle panel), their uncertainty (95% confidence intervals) from the mixed linear model for high-intensity distance (right panel).
Number of high-intensity accelerations
The lower to upper estimate limit for between-microcycle differences (Figure 4) spanned 11, 12, 16, and 25 for MD-1, MD-2, MD-3, and MD-4, respectively. Random effect of player explained 22% to 53% of the variance in session distance, and the within-player SD's ranged from 3 to 7 (Table 3).
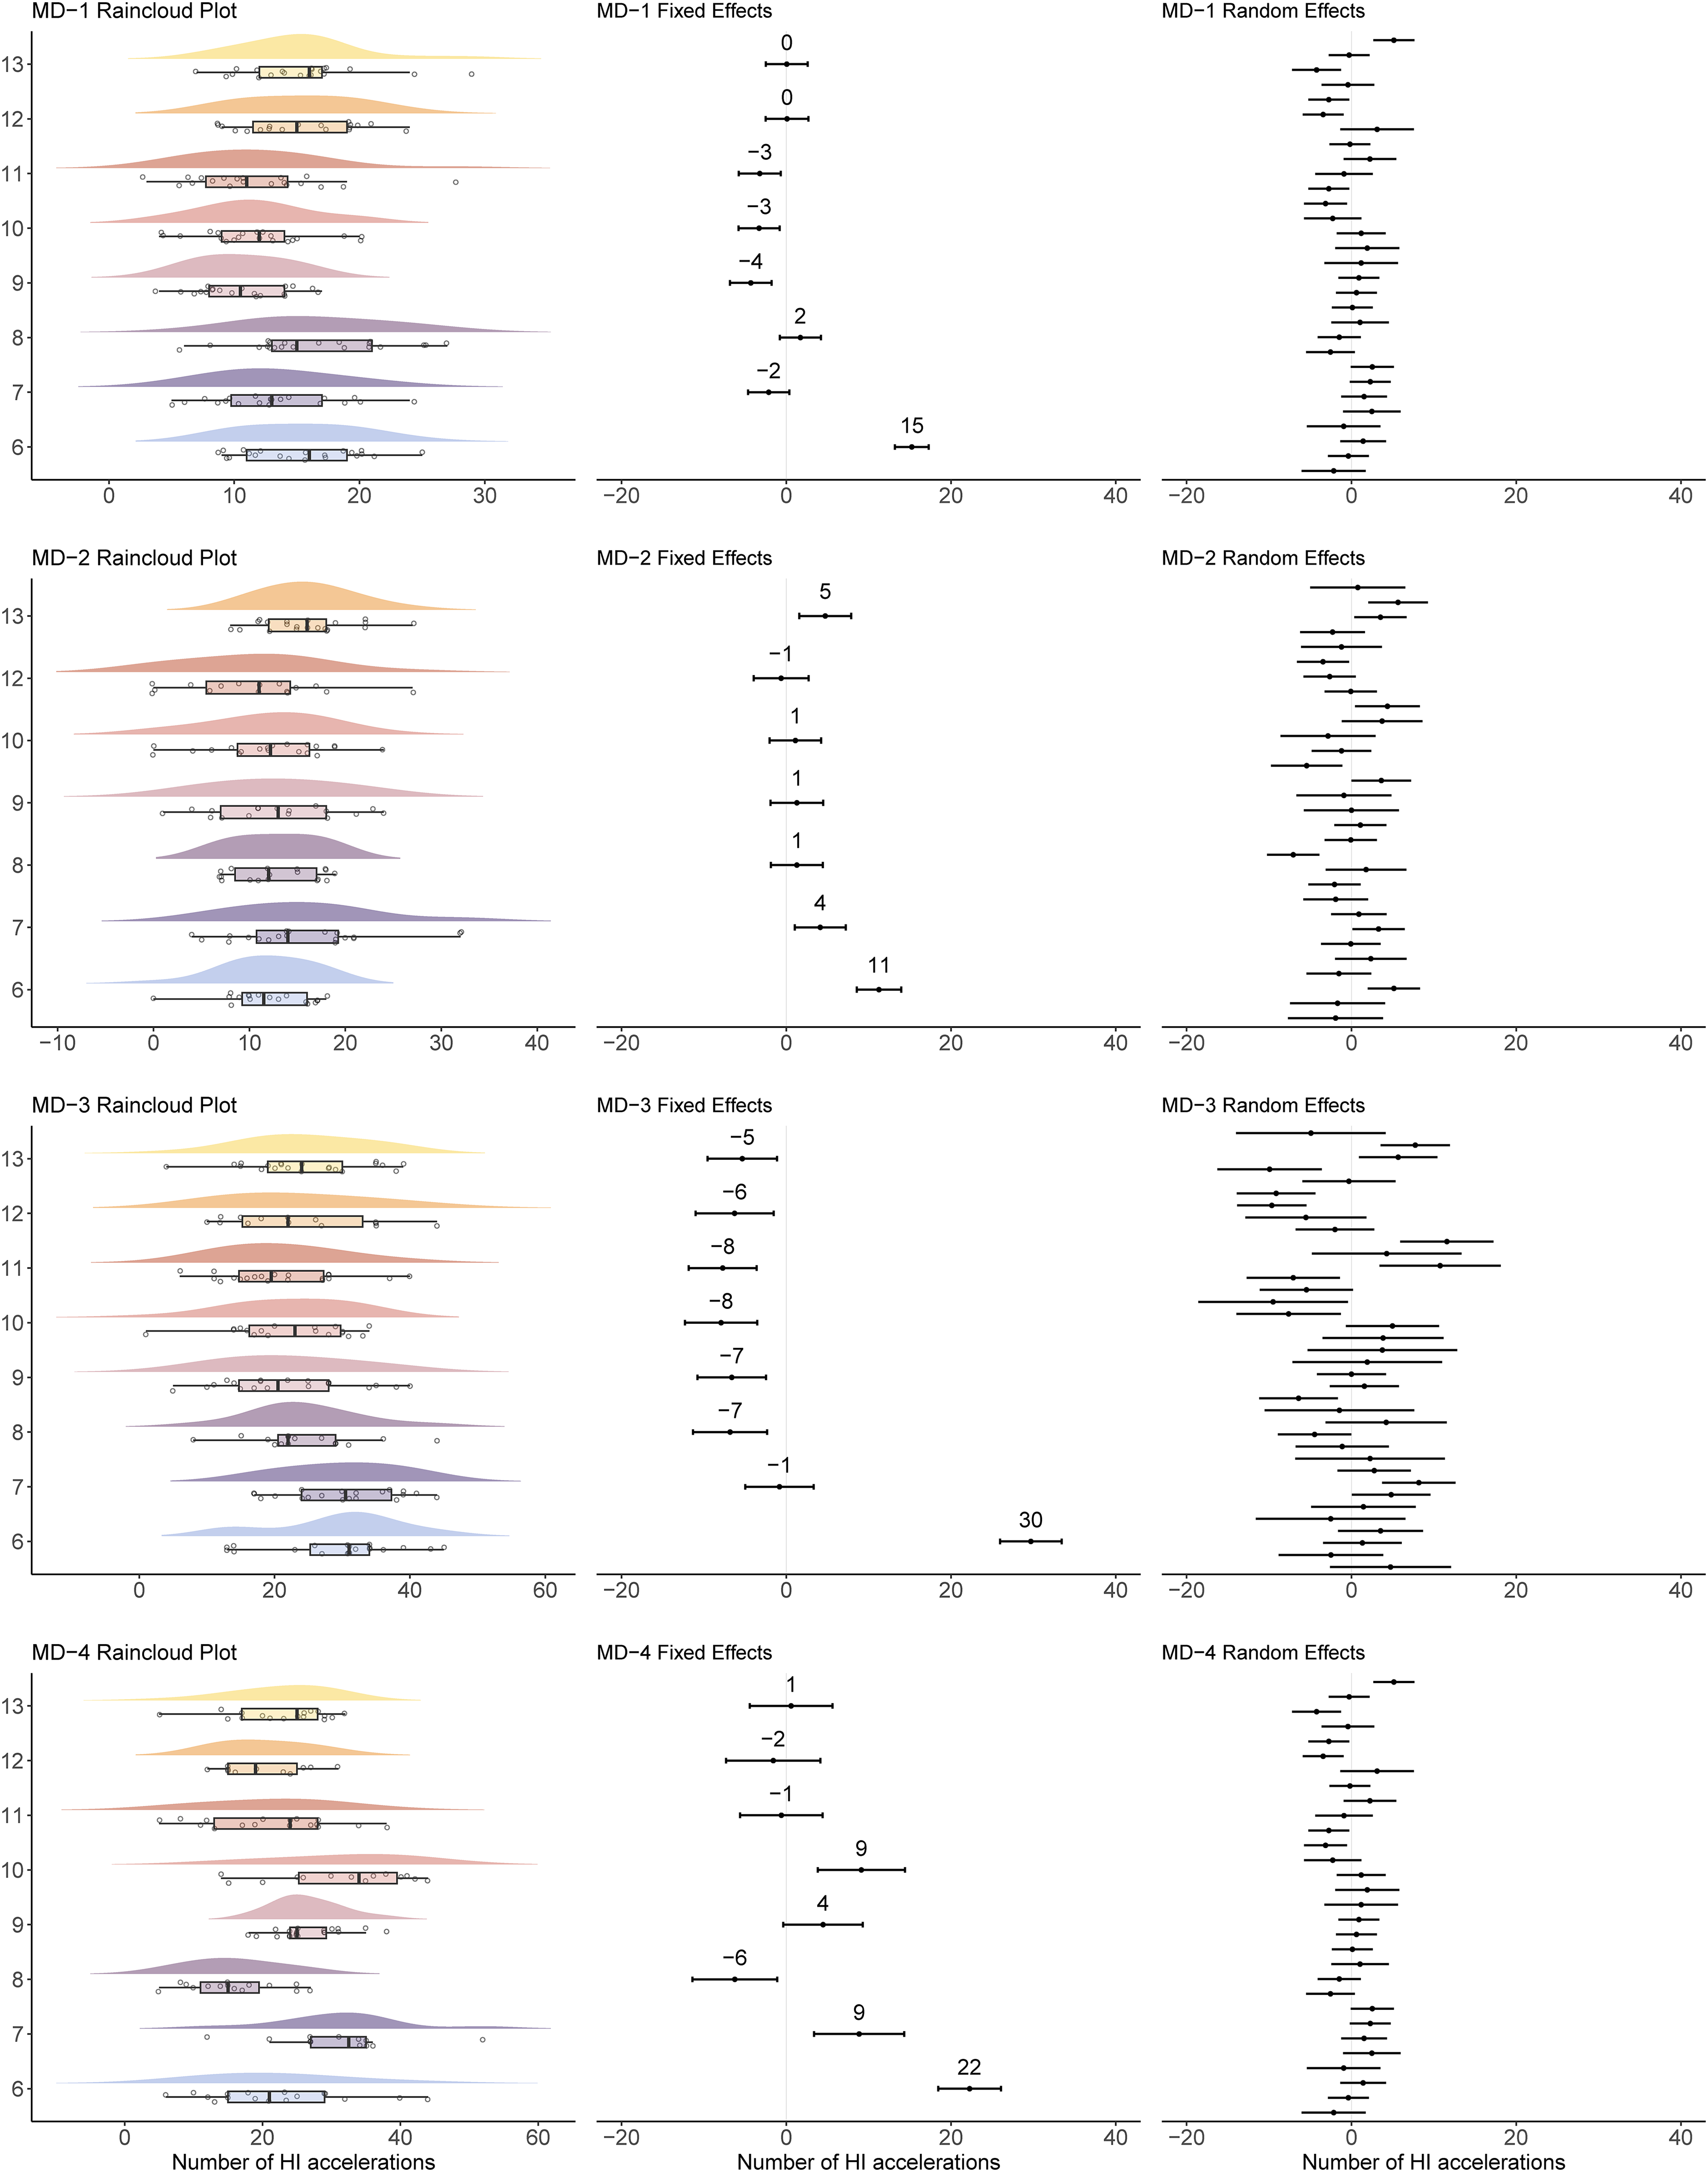
Raincloud plots (left panel), along with the fixed (middle panel) and random (right panel) effect estimates with uncertainty (95% confidence intervals) from the high-intensity accelerations mixed linear model.
% maximum speed
The lower to upper estimate limit for between-microcycle differences (Figure 5) spanned 10.2 percentage points, 15.3 percentage points, 13.7 percentage points, and 15.4 percentage points for MD-1, MD-2, MD-3, and MD-4, respectively. Random effect of player explained 2% to 30% of the variance in % maximal speed, and the within-player SD's ranged from 0.5 to 4.6 (Table 3).
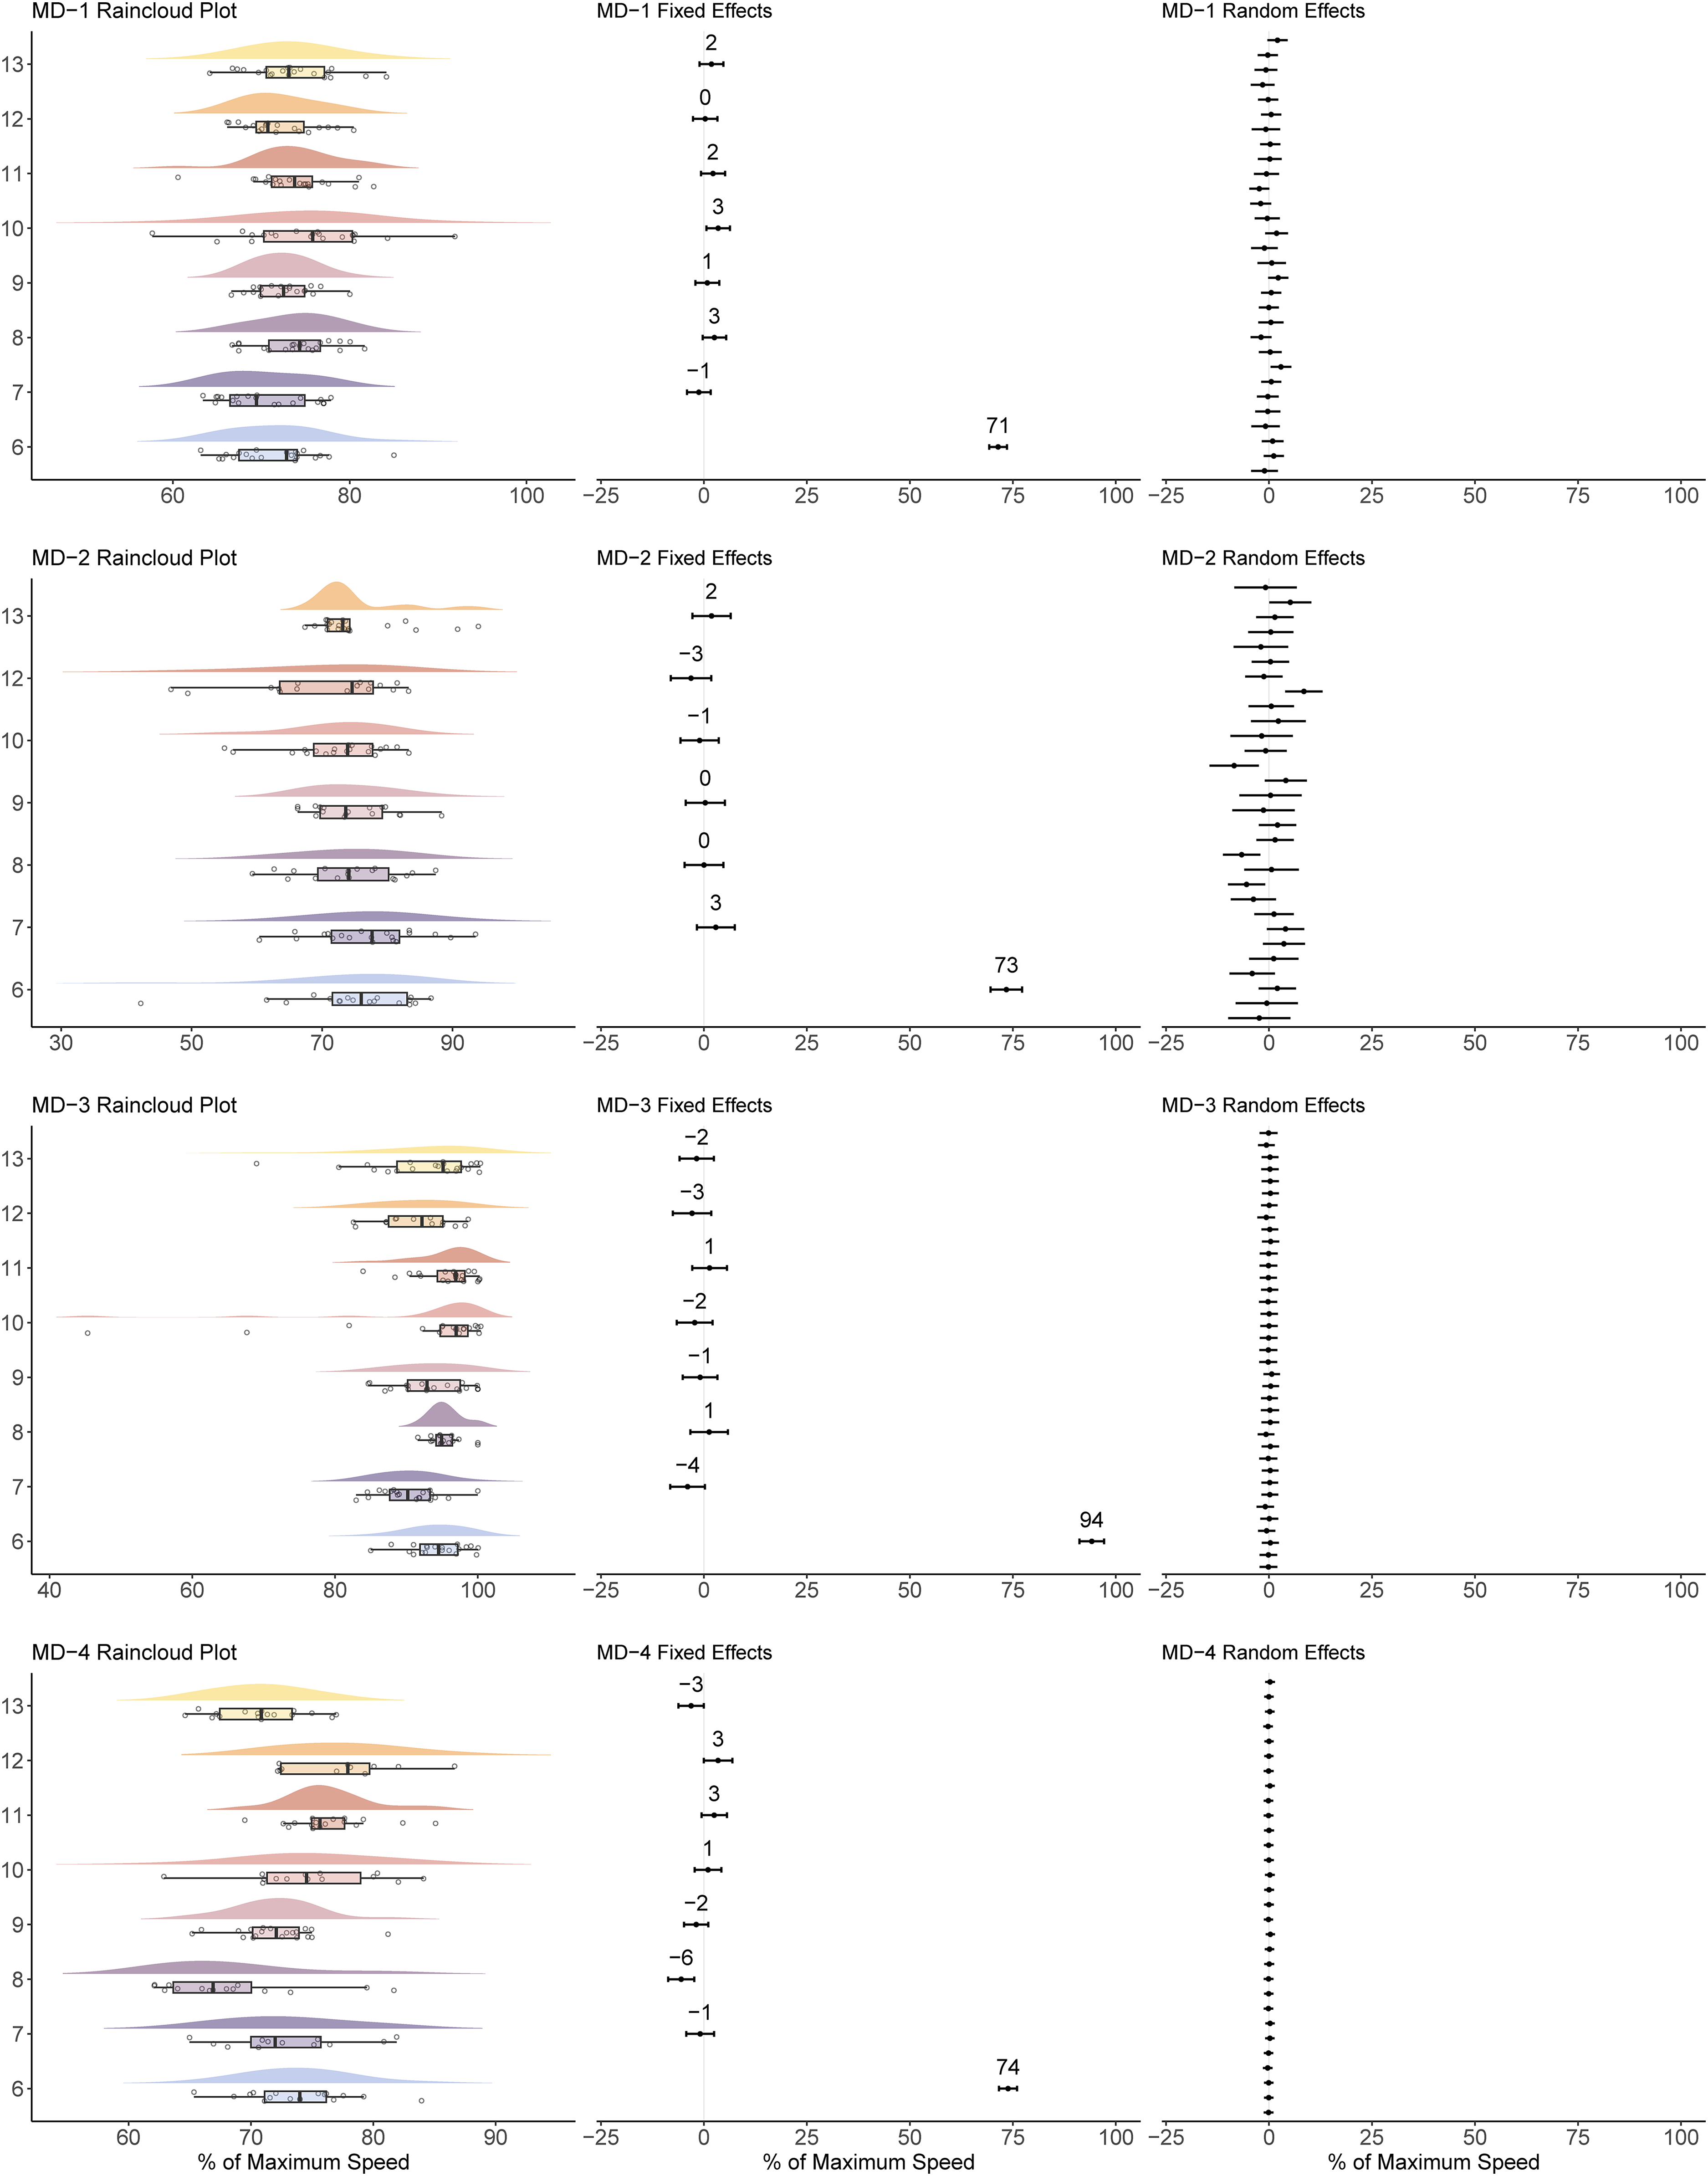
Raincloud plots (left panel), along with the fixed (middle panel) and random (right panel) effect estimates with uncertainty (95% confidence intervals) from the % of maximal speed mixed linear model.
Discussion
The main finding of this study was that for the ‘CUPs’ training methodology, week-to-week external load for each training session (classified by duration from matchday) varied substantially over an 8-week in-season training mesocycle. This finding was observed for each of the selected training load variables. Previously, planned fluctuations in training volume within the training microcycle have been outlined to avoid training monotony and fatigue.7,23 The current study was the first to examine week-to-week variability in training volume for the same matchday classified training session in senior professional players. While planned variation in training content as coaches deploy different tactical strategies game-to-game may lead to fluctuating patterns of physical stress, it may be desirable to regulate the limits of this variation to maintain stable training volumes (avoiding ‘spikes’) while maintaining an optimal balance of stress and recovery. To evaluate the influence of coaching methodology on the physical outcomes from each session, implications of variability between the same matchday classified training sessions across the mesocycle are discussed below.
MD-4
Within this periodisation model, MD-4 is based around smaller training session densities. Specifically, the ability to cover high distances and reach high velocities is directly limited by reduced player surface areas (40–60 m2 per active player) and SSGs. However, SSGs have been shown to drive explosive actions such as accelerations and decelerations, CODs and central cardiovascular loading. 7 The sessions’ technical coaching themes are based around ‘positional’ training principle's relating to pressing related actions and while minimal tactical information is provided there is always a tactical underlying principle. Variability of training stimulus on MD-4 (i.e. difference between the lower to upper estimate limit) for between-microcycle differences reached 2248 m for total distance, 197 m for high-intensity distance, 25 high-intensity accelerations, and 15.4 percentage points for % maximum speed (figures 2–5). These data highlight that, at the extremes, group mean variation between MD-4 sessions is large. Physiologically, given the strength/power emphasis of this training day, the lower ranges may indicate a threat to the development of neuromuscular adaptations such as peak force and rate of force development. In a practical sense, 25 high-intensity accelerations equate to 78% of a match volume for this variable (unpublished data) highlighting the magnitude of this variation. Large group variation between microcycles may be due to positional differences and changes in playing personnel across the mesocycle. Nevertheless, it was interesting to note that within-player SDs across the mesocycle for MD-4 were of smaller magnitude (25 m high-intensity distance, 4 high-intensity accelerations, and 0.5 maximum speed percentage points) (Table 3) indicating there was a higher degree of stability in player loading on an individual level. For example, within-player variation for accelerations only fluctuated by four accelerations across the mesocycle. Given the median on MD-4 was 27 accelerations, players received a consistently high volume of this variable on this relative training day. This may be indicative of physical targets being set for each session on an individual level and achieved through targeted conditioning drills within sessions.
MD-3
This training day is directly linked to the tactical-physical requirements of the chosen style of play, focussing on ‘collective’ or ‘team’ coaching principles which include large-sided games (LSGs) and possession drills with a higher playing density (>250 m2 per active player). Physically, MD-3 is characterised by high total distance and distance covered at high running velocities. Variability of training stimulus on MD-3 reached 1916 m for total distance, 375 m for high-intensity distance, 16 high-intensity accelerations, and 13.7 percentage points for maximum speed % (Figures 2–5). Again, these data highlights that at the extremes, group mean variation between MD-3 sessions is large for all variables. Physiologically, given the conditioning emphasis of this training day, the lower ranges may indicate a threat to the development of aerobic and anaerobic systems. Practically, 375 m high-intensity running distance equates to 54% of a match volume for this variable in this cohort (unpublished data) and 57% of a match volume in professional players reported elsewhere in the literature 24 highlighting the magnitude of this variation. These differences are likely a reflection of the adopted playing style in preparation for the upcoming fixture and may also be driven by differences in positional demands. Indeed, the use of LSGs as a conditioning stimulus will result in players conforming to their positional roles in the large density and numbered games. This directly links to the time motion analysis from competitive match play in that centre-backs cover less distance and less high-intensity distance compared to full-backs and wide midfielders. This is a good justification for the LSGs and practice design phase on this training day. Furthermore, based around the LSGs training format within the relative training day, tactical details added combined with the more reactive nature and lack of control based on the increased density of LSGs may have resulted in the variation of data on a MD-3. Again, the magnitude of the observed variation across the mesocycle on an individual level, as demonstrated by within-player SD, was smaller (381 m total distance, 106 m high-intensity distance, 7 high-intensity accelerations, and 1.1 maximum speed percentage points). Within-player variation for % maximum speed fluctuated by only 1.1 percentage points across the mesocycle and may reflect the conditioning drills selected to facilitate running velocities that exceeded 90% of maximum speed. Within this methodology, MD-3 is considered a high-volume conditioning day where there are targeted conditioning metrics to be met. Previous research has recommended that soccer players should be exposed to near maximal velocity as part of a wider injury reduction strategy. 25 The consistency of this stimulus on MD-3, where the median was >90% of maximum speed across the mesocycle, is important to avoid excessive fatigue to the posterior chain musculature which is associated with novel or unaccustomed exercise. 26 While a week-to-week swing of 20% in training volume appears large, the real-world impact of 106 m high-intensity distance on player fitness or fatigue status is debatable, especially when considering the variability in within-player match physical performance for this metric has been reported as 124 m and a CV of 23%. 24 Nevertheless, when considering the median values of this variable across the mesocycle alongside the observed weekly variable, MD-3 appears to have provided a high volume of high-intensity distance and exposures to near maximal running velocities.
MD-2
Due to the close proximity of the upcoming fixture, MD-2 was highly tactical with an emphasis on ‘Unit’ based coaching principles. Equally, given the previous day's high volume and the likelihood of associated fatigue, an emphasis on reducing high-intensity distance, repetitive explosive actions, and avoiding exposures to very high running velocities was adopted across the mesocycle. The latter is largely facilitated by increased coaching and tactical instruction leading to more frequent breaks in training drills and therefore a reduction in locomotor intensity and is indicative of an effective tapering strategy. Variability of training stimulus on MD-2 reached 1503 m for total distance, 86 m for high-intensity distance, 12 high-intensity accelerations, and 15.3 percentage points for % maximum speed, which is large and possibly driven by the tactically focussed nature of this training day. Additionally, the ‘unit coaching’ method requires a within training group split where players are grouped separately to rehearse specific tactical structures (defensive/offensive etc.). As such, depending on the requirements of the tactical focus per unit (determined by the upcoming fixture), variation in physical demand is likely to vary within the group week-to-week. As this is a unit focussed coaching day, the units perform different actions and positional requirements in the drills developed. It was interesting to note that within-player variation in % maximum speed was higher on this day than any other across the microcycle. Further analysis to establish whether this was more prevalent among certain positions is recommended.
MD-1
As demonstrated by the lowest external load volumes of the microcycle, training content on MD-1 is designed to minimise physical stress prior to matchday. Drill selection on this day is consistent so it was interesting to note large variability of training stimulus with variation in distance reaching 1244 m. The day prior to matchday is characterised by low volume with consistent training content to maximise performance capability on matchday. 7 As such, while the finding of variability on this day is somewhat surprising, total weekly training volume can exceed 30 kilometres per week 2 and the practical significance of the maximum variation observed across the mesocycle, equating to around 4% of total weekly volume, is questionable. Nevertheless, it may be speculated that variation in factors such as positional demands, tactical drills and player individual work may contribute to fluctuating training stimulus with the potential to drive symptoms of fatigue. Importantly, it was notable that when compared to the other days within the microcycle (MD-4, MD-3, MD-2) less variation in high-intensity distance, high-intensity accelerations and % maximum speed was observed indicating a more stable training stimulus for these more physically demanding training variables. This was demonstrated further by the within-player SD of only 19 m for high-intensity distance and 3 high-intensity accelerations across the mesocycle.
A limitation of this study is the small sample size, although this is common in studies involving professional-level soccer players.
Practical implications
Our data show week-to-week variation of external load between the same matchday classified training sessions across an in-season mesocycle. While these fluctuations are likely driven by planned and necessary factors relating to tactical preparation, there may be potential interference when seeking stability in chronic training loads during the in-season period. As such, practitioners should understand the normal ebb and flow of training demands across the microcycle in conjunction with recovery monitoring and open communication with players and coaches. Specifically, target thresholds may be set for key metrics on each training day (i.e. MD-4: high-intensity accelerations; MD-3: > 90% of maximum speed attained; etc.) to ensure consistency of external load volumes between weekly microcycles. In addition, our data show that the deployment of a planned periodisation model (CUPs) can mediate large fluctuations in training stimulus for key external load variables on given training days while positively exposing players to daily variation within the microcycle. Specifically, the integration of physical and tactical themes within this tapering strategy will allow key metrics to be hit consistently at the appropriate time within the weekly microcycle and can facilitate within-player variation that is below the realms of practical significance. As such, this model may be considered appropriate for adoption during the in-season maintenance and development period once high fitness levels have been acquired during the pre-season phase.
Conclusion
Our data show that despite training sessions having a consistency of planned training stimulus across an 8-week mesocycle, external training load on the same day relative to matchday varied between weeks. Using the ‘CUPs’ methodology, within-player variability on the same day relative to matchday indicated a more consistent stimulus for key training variables relevant to specific training days (i.e. MD-4: consistently high volume of high-intensity accelerations; MD-3: consistently high % of maximum speed attained). Lastly, high-intensity running, high-intensity accelerations, and % of maximum speed were found to be consistently low on MD-1 to control the risk of fatigue prior to matchday, as indicated by lower within-player variability on this day.
Footnotes
Declaration of conflicting interests
The authors declared no potential conflicts of interest with respect to the research, authorship, and/or publication of this article.
Funding
The authors received no financial support for the research, authorship, and/or publication of this article.