
Abstract
In training for many sports, balls of different masses are thrown. This study examined how ball mass influences distance thrown. Based on geometric scaling principles a relationship was derived between ball mass and throw distance: throw distance was inversely proportional to ball mass. This relationship was tested in two ways. The first approach was using athlete shot put throw distances with different shot masses, and hammer throws performed with different mass hammers. These experimental data were better represented by the non-linear relationship, derived from geometric scaling principles, than assuming a simple linear relationship. The second approach was to use a simulation model to predict throw distance for balls of different masses. The model contained realistic segmental inertial properties, activation dynamics, moment-joint angle properties, and moment-joint angular velocity properties. The non-linear relationship provided a better fit to the results of the simulations compared with a linear model. The experimental and modeling results support the theoretical relationship derived between distance thrown and ball mass. The relationship has utility for coaches monitoring and planning the training of athletes which incorporates throwing different mass balls.
Introduction
Throwing balls of different masses can be an integral part of the training of athletes. In sports where the task is throwing, over- and under-weight implements are often used in training. 1 In the preparation of athletes in other sports, medicine balls are often thrown in a variety of ways as a means to improve power development. 2 The use of under- and over-weight balls immediately before competition can positively impact performance 3 ; but how does throw distance vary with changes in the mass of the ball?
Throw distance in many sports determines the winner, for example, the throws in track and field. In other sports the ability to throw a ball a long distance is also of value, for example when fielding in baseball, softball, or cricket, and in soccer where the long throw-in comprises approximately 39% of all throw-ins in the English Premier League. 4 To make a long throw a high release velocity is required; so long throws have similar performance constraints to sporting tasks which require high ball velocity such as pitching a baseball or softball, or a shot at goal in handball. A common training method is to use of under- and over-weight throwing implements, for example, for high level hammer throwers,5,6 javelin throwers, 7 and baseball pitchers 8 all use under- and over-weight throwing implements. Handball coaches report throwing different weight balls is an important training component for increasing ball velocity in handball players. 9 For a coach to monitor athlete performance it would be useful if the relationship was established between ball mass and throw distance. Armed with such information, a coach could better tailor an athlete's training by being able to compare throw performance with under- and over-weight implements to performance with one another, and with the performance with the competition weight implement.
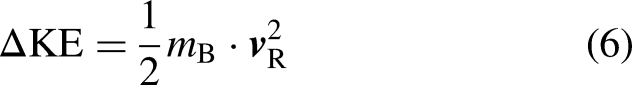
It has been demonstrated that as the velocity of shortening of a muscle increases the force it can produce decreases in a non-linear fashion. 10 Similar relationships have been measured at joints: as the joint angular velocity increases and the agonist muscles shorten the muscular moment decreases non-linearly. 11 Therefore, it would follow that as the mass of a ball increases the horizontal distance a person could throw the ball would decrease. Indeed, as the distance a ball travels is a function of the release velocity squared, a small decrease in release velocity produces a larger relative decrease in distance traveled. For a coach using variable mass ball throwing, athlete performance can be monitored by measuring distance thrown. The coach's monitoring of performance would be augmented if it was feasible to provide a guide on how distance thrown should change with ball mass. Given the non-linear relationship between joint angular velocity and joint moment, and the non-linear relationship between throw distance and ball release velocity, the relationship between ball mass and distance traveled is not immediately obvious.
It was the purpose of this study to examine how distance thrown scales with ball mass. A relationship between ball mass and throw distance was derived using geometric scaling principles. Two approaches were used to examine this scaling. The first used existing athlete performance data to examine the appropriateness of this relationship. The second approach examined the appropriateness of the relationship using a computer simulation model. Such a relationship, if confirmed, has utility for coaches monitoring and planning the training of athletes which incorporates throwing different mass balls.
Geometric scaling
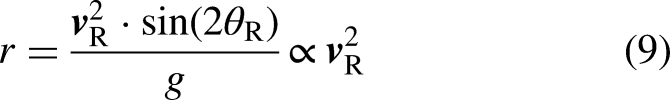
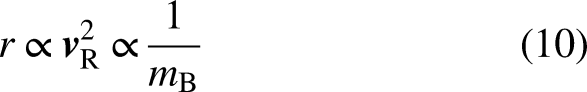
Geometric scaling has been successfully used to examine the influence of body size on athletic performance.12–14 The basic principles of geometric scaling mean that all body linear dimensions are directly proportional to one another, that cross-sectional areas are proportional to the linear dimensions squared, and volumes and masses are proportional to the linear dimensions cubed. These basic principles can be used to determine how horizontal throw distance scales with ball mass.
When a throw is executed the muscles do work to move the mass of the ball. The work done (


Athlete performance
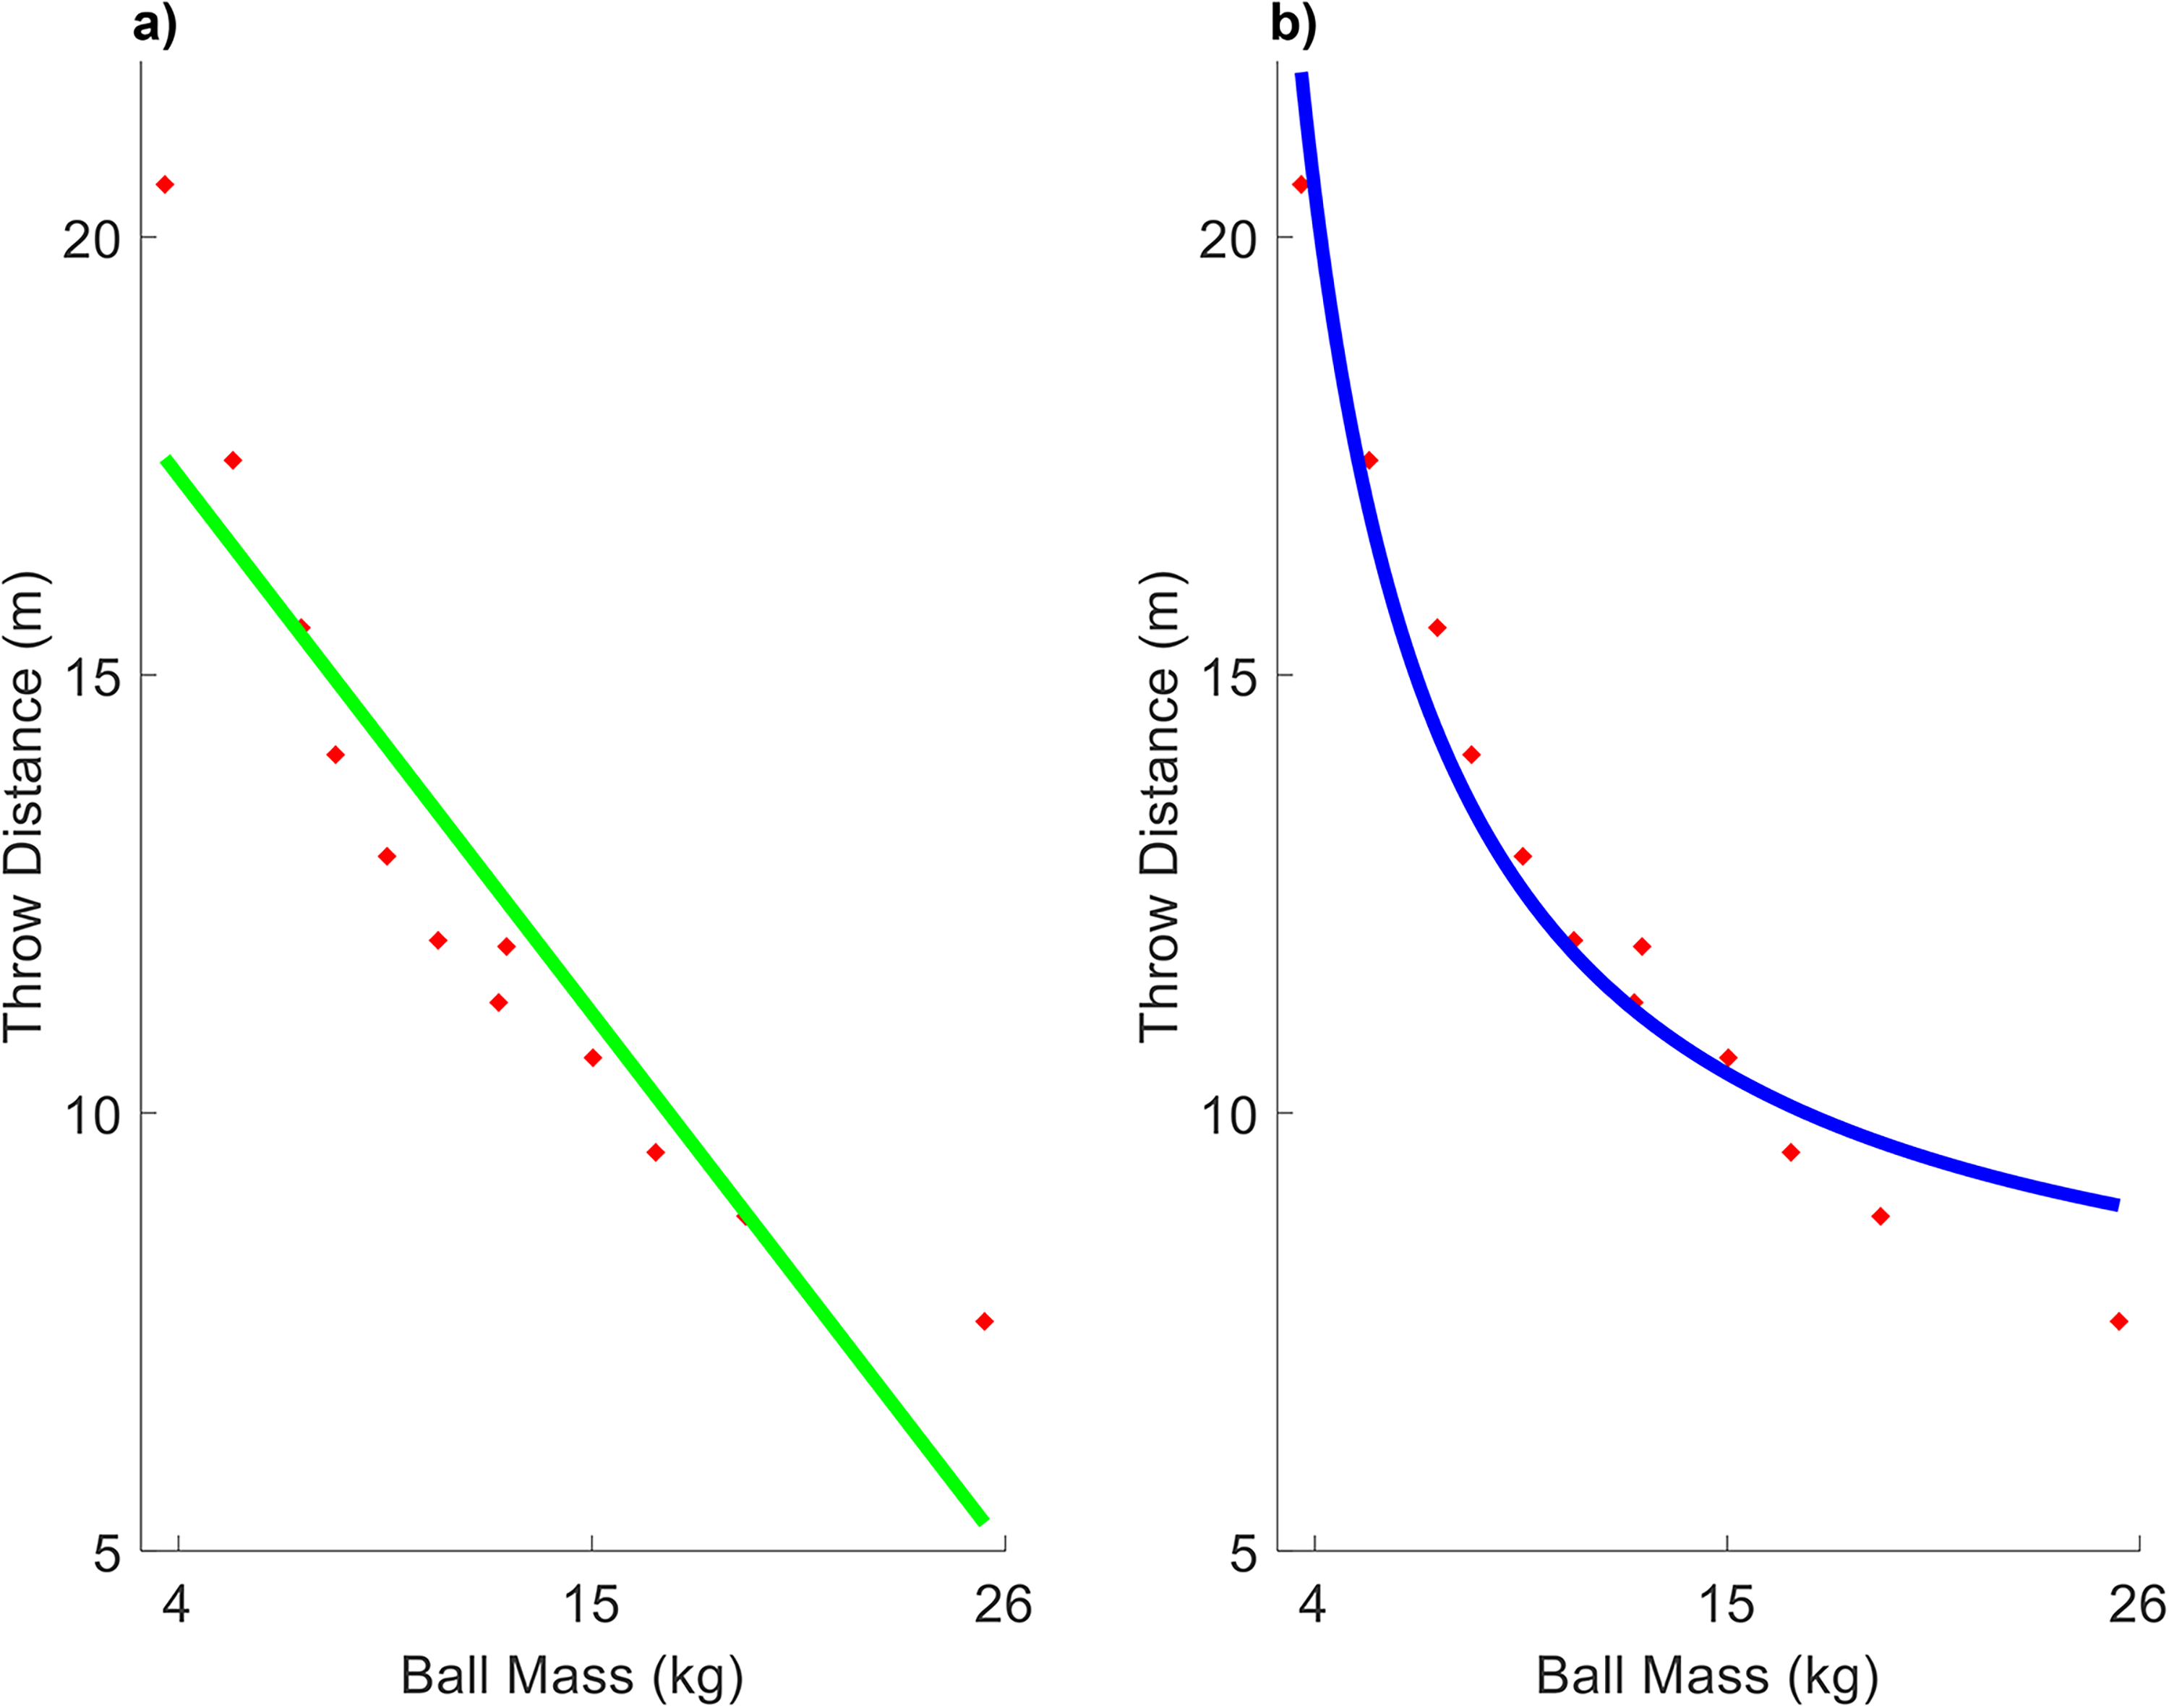
A standard mass shot was not adopted for male shot putters until the first modern Olympics was held in Athens in 1896. Before that a range of shot masses were used, competitions were still held using non-standard shot put masses into the early 20th century. The record distances for men, established prior to 1922, for shot masses ranging from 3.64 to 25.45 kg were compiled. 18 These 12-shot mass and corresponding throw distance data serve as a means of evaluating the relationship expressed in equation (10).
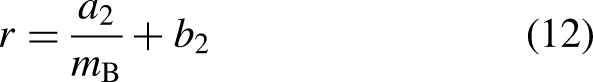
Two statistical models were used to estimate horizontal ball throw distance from ball mass. The first assumed a linear relationship between ball mass and throw distance,

Using the two statistical models, the capturing of the relationship between ball mass and distance thrown was better represented by the non-linear model (Figure 1). The percentage root mean square error from the cross-validation procedure produced an error of 15.3% for the linear model, and 10.3% for the non-linear model. These experimental results provide support for the theoretical relationship between ball mass and throw distance derived from geometric scaling principles. This relationship will be further examined in the next section using a simulation model.
The distances thrown (
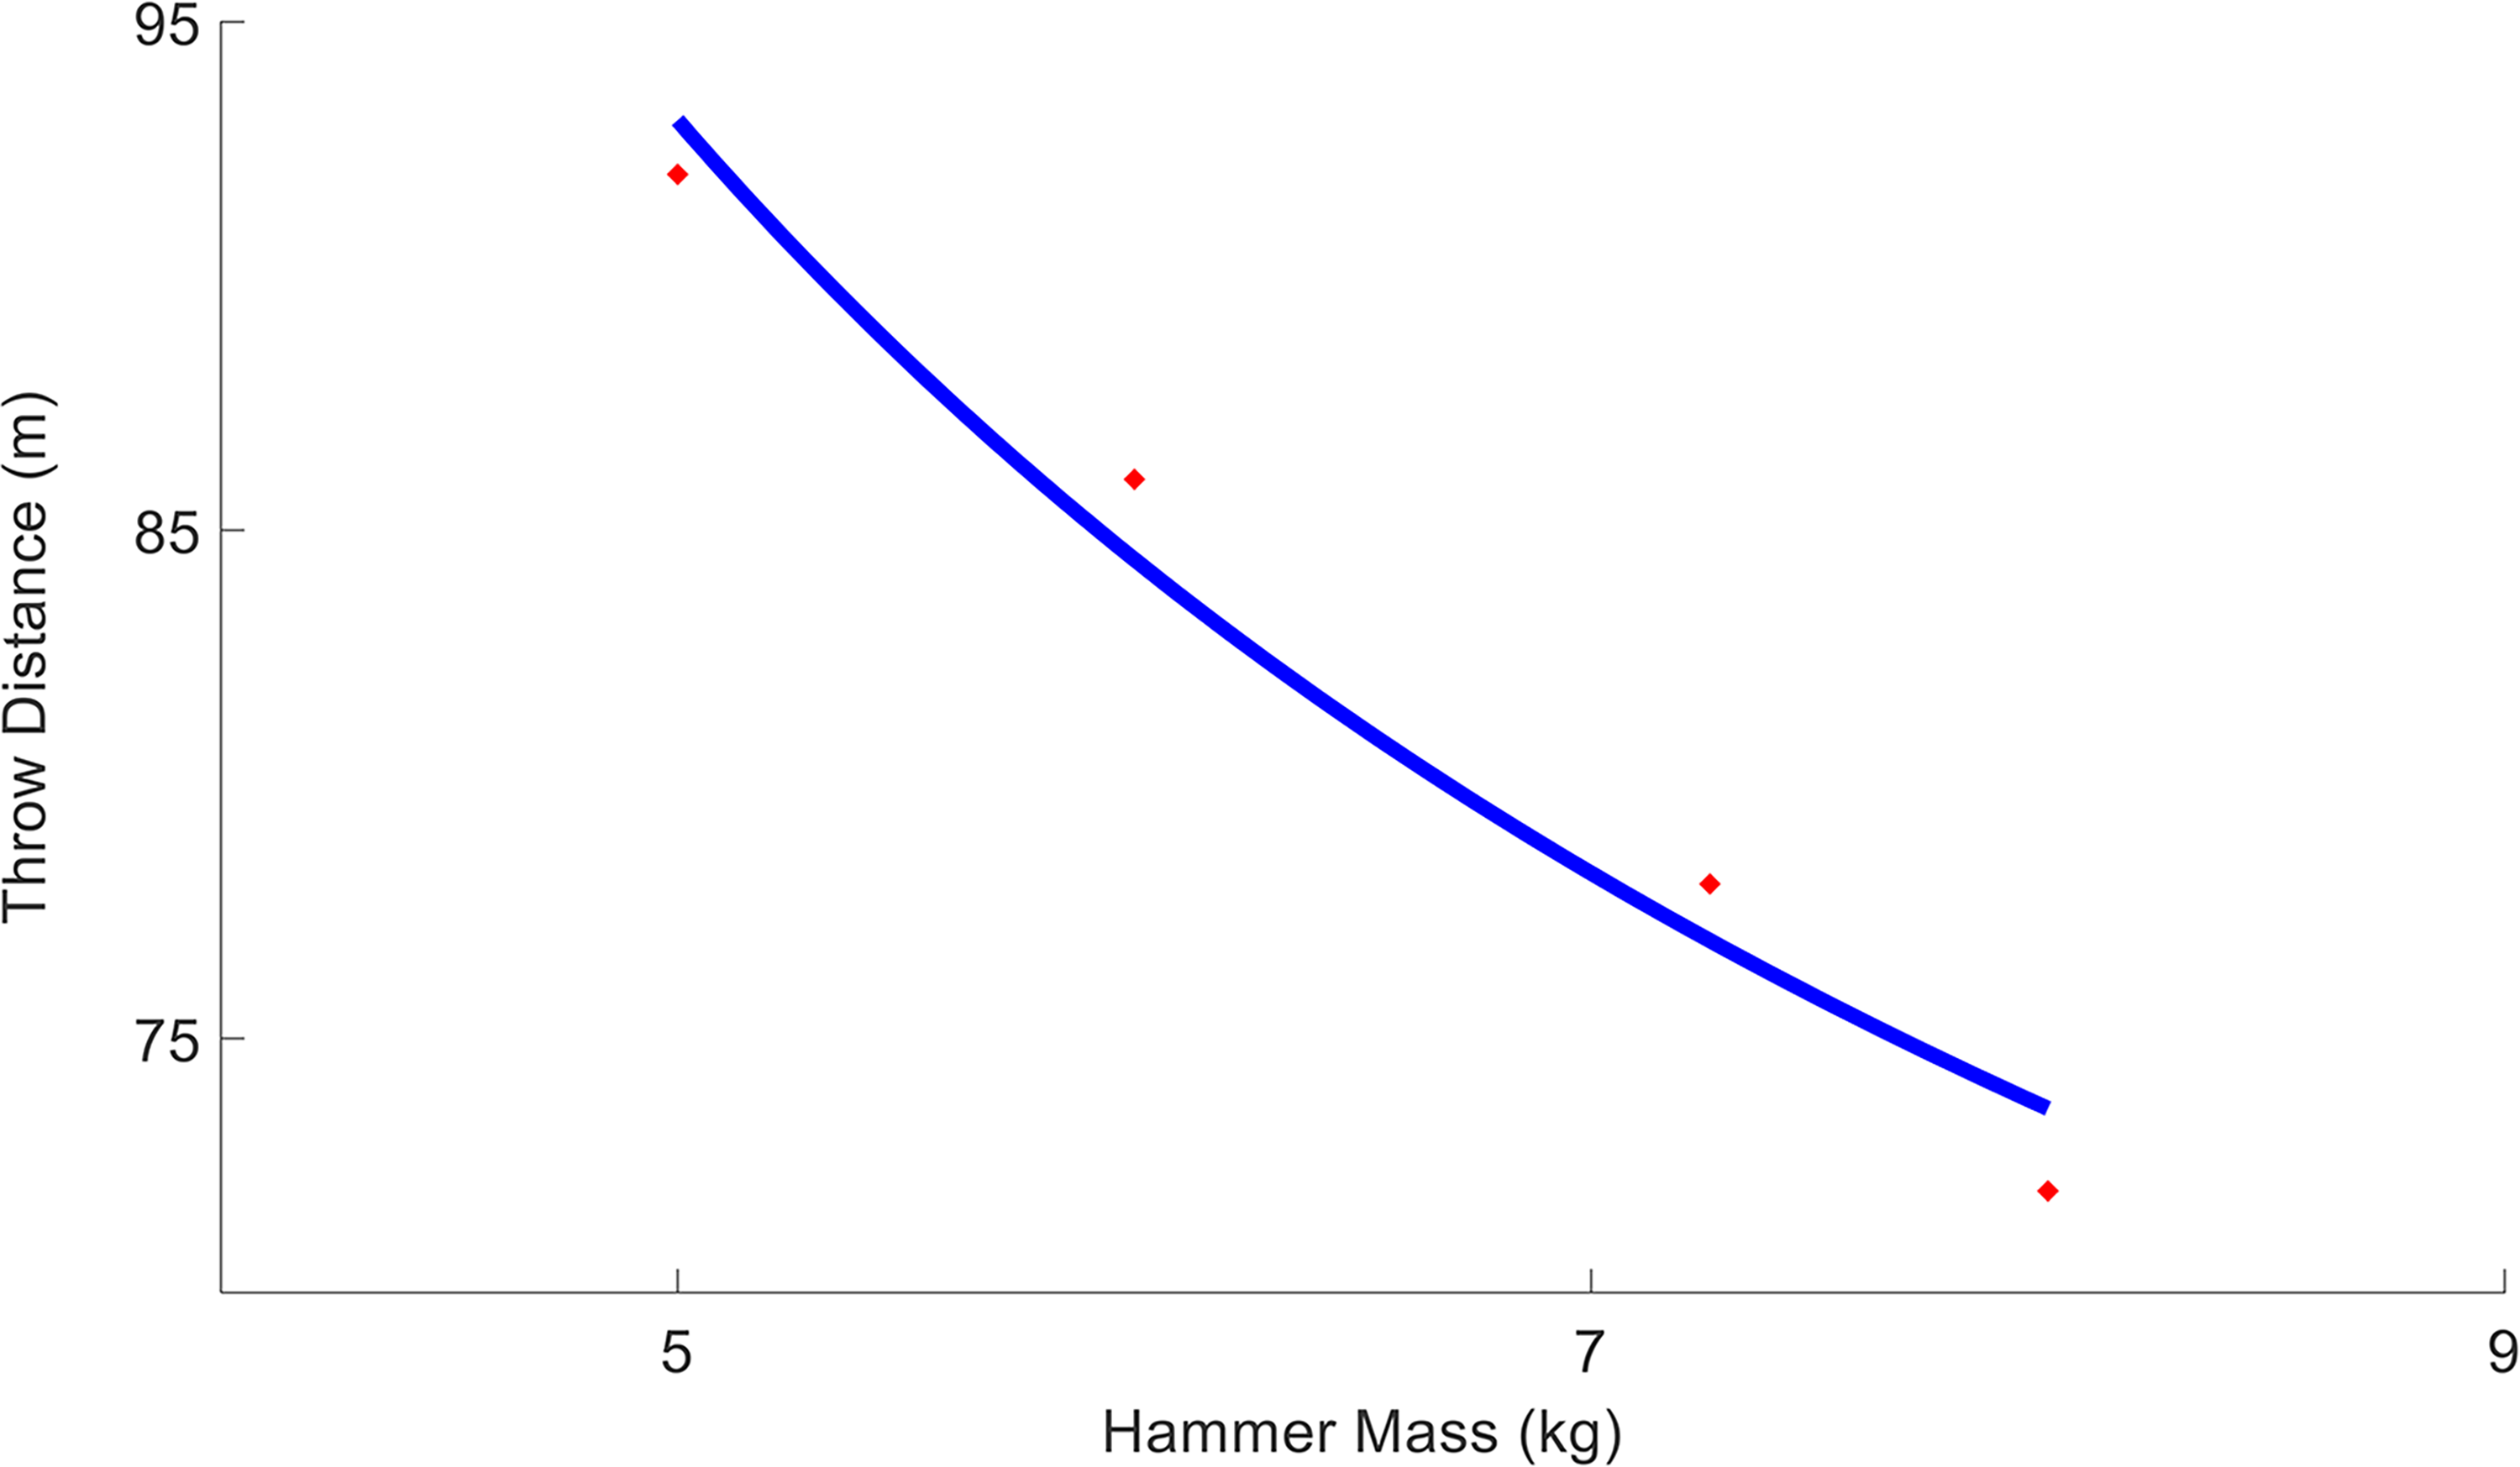
This shot put data set represents elite level performance albeit from over a century ago. Another more recent, albeit smaller, data set was also analyzed. It is common for hammer throwers in training to throw under-weight implements, to help to develop speed, and over-weight implements, to help develop strength. 1 Of the eight top male throwers of all-time four were coached by Anatoli Bondarchuk, including the current world record holder with these performances occurring in the 1980s. Bondarchuk presented the results of his hammer throwers throwing hammers of different mass (5, 6, 7.26, and 8 kg). 22 Both the linear and non-linear models were fit to the data and the cross-validation procedure produced an error of 4.2% for the linear model, and 1.3% for the non-linear model (Figure 2). Practically this means that the non-linear model can predict hammer throw performance with different mass hammers, for the coach deviation from the model fit can indicate strengths and weaknesses of the athlete.
The distances thrown (
Both the shot and hammer data sets are provided in Supplemental Materials.
Simulation model
A model was developed which simulated a simple throwing task. The model was used to examine the influence of ball mass on throw distance. The model had a single segment representing the forearm, hand, and ball (Figure 3). The throw was due to the rotation of the elbow joint, caused by the action of the elbow extensors. The task was to activate the elbow extensors to cause rotation of the segment to find release conditions which maximize distance thrown for balls of different mass. The distance thrown (
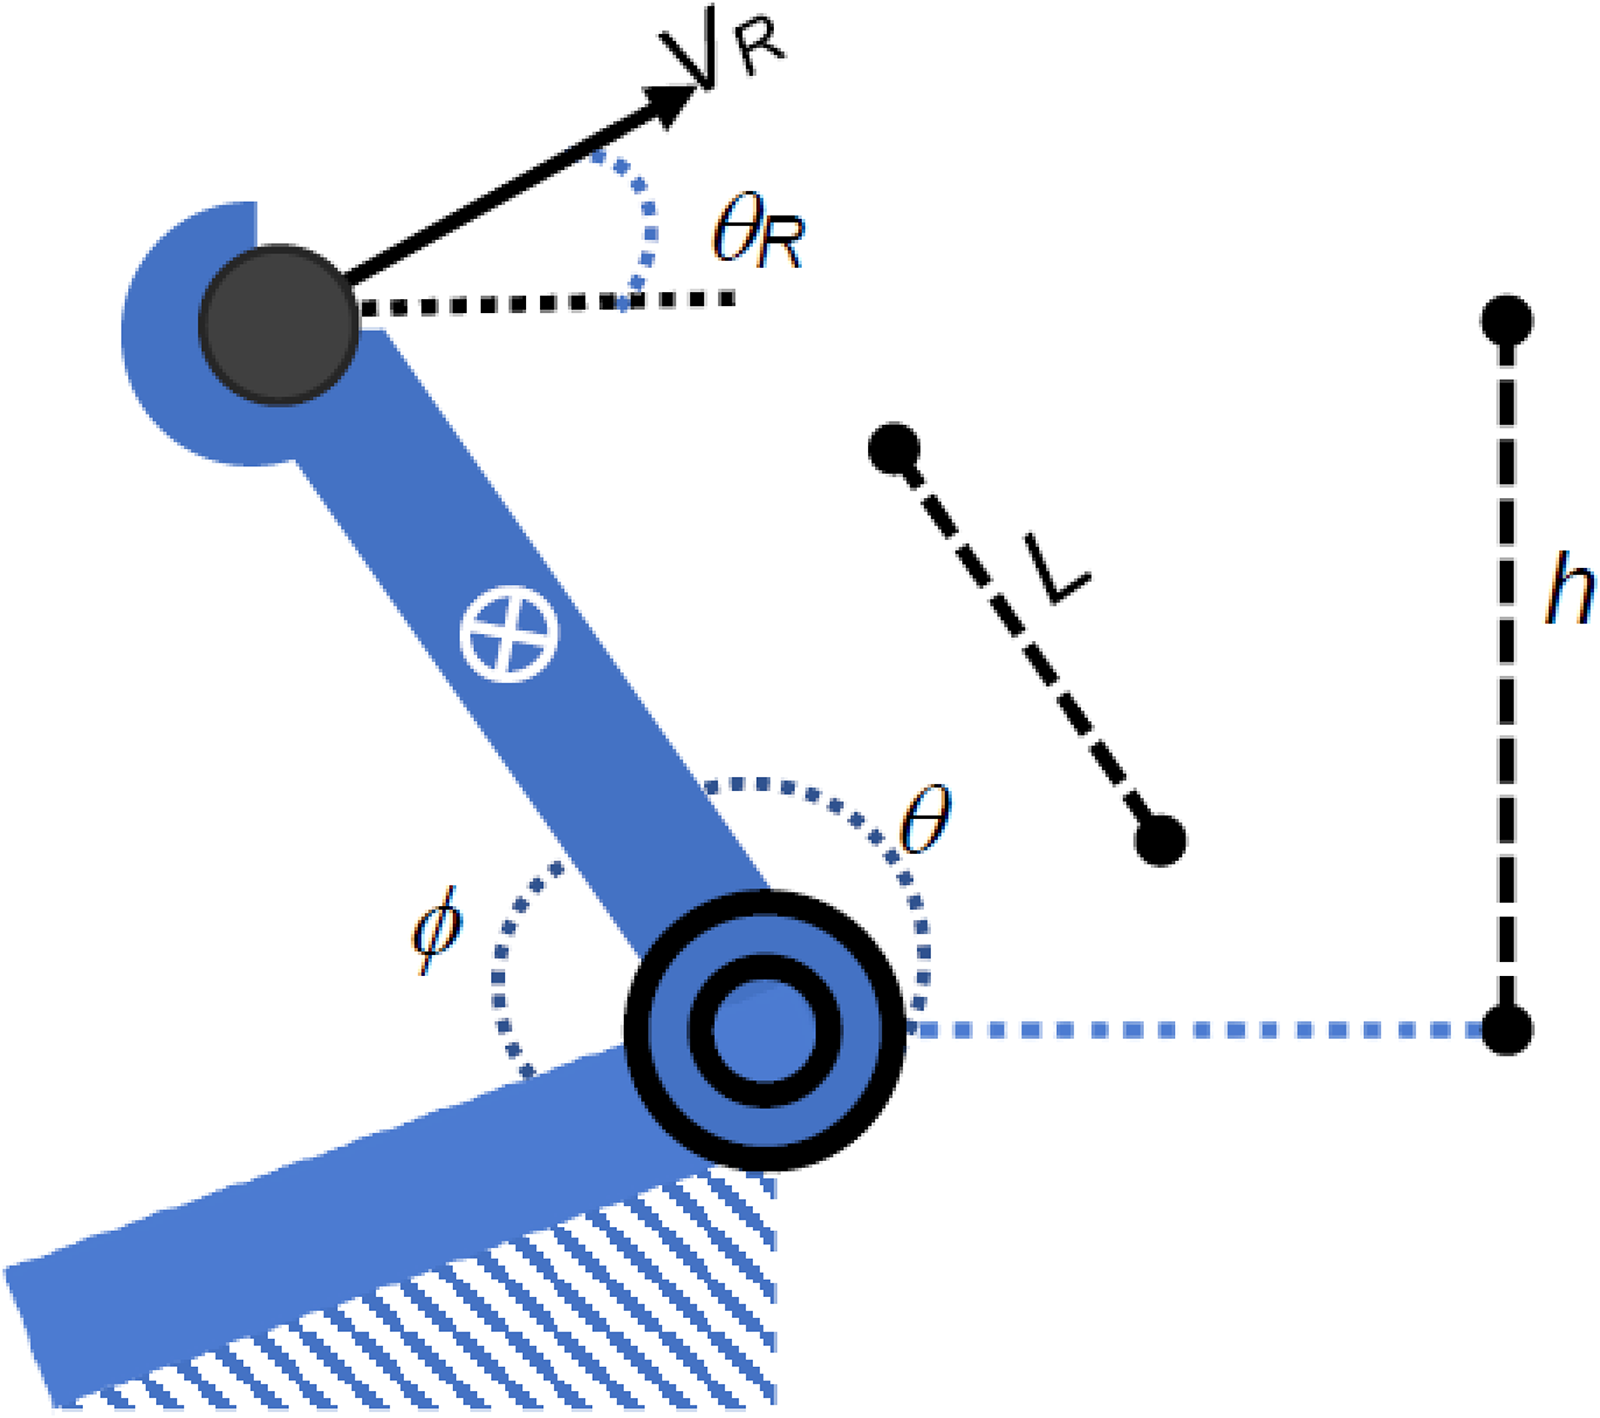
The model of a throw caused by rotation of the elbow joint, due to the action of the elbow extensors. In the figure
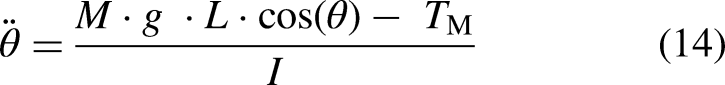
For the model of the system shown in Figure 3 the equation of motion describes the angular acceleration of the model as a function of the system moment of inertia, the influence of the moment caused by segment weight, and the muscular moment applied,
23
The moment produced at the joint was designed to represent the net effect of the elbow extensors. The moment was dependent on,

The active state is a function of the neural excitation of the muscle. The modeled muscle's active state represents the recruitment as well as the rate coding of the α-motor neurons. The neural excitations and active state are normalized so they could both be between zero and one. The neural excitation was assumed to be maximal for these simulations (
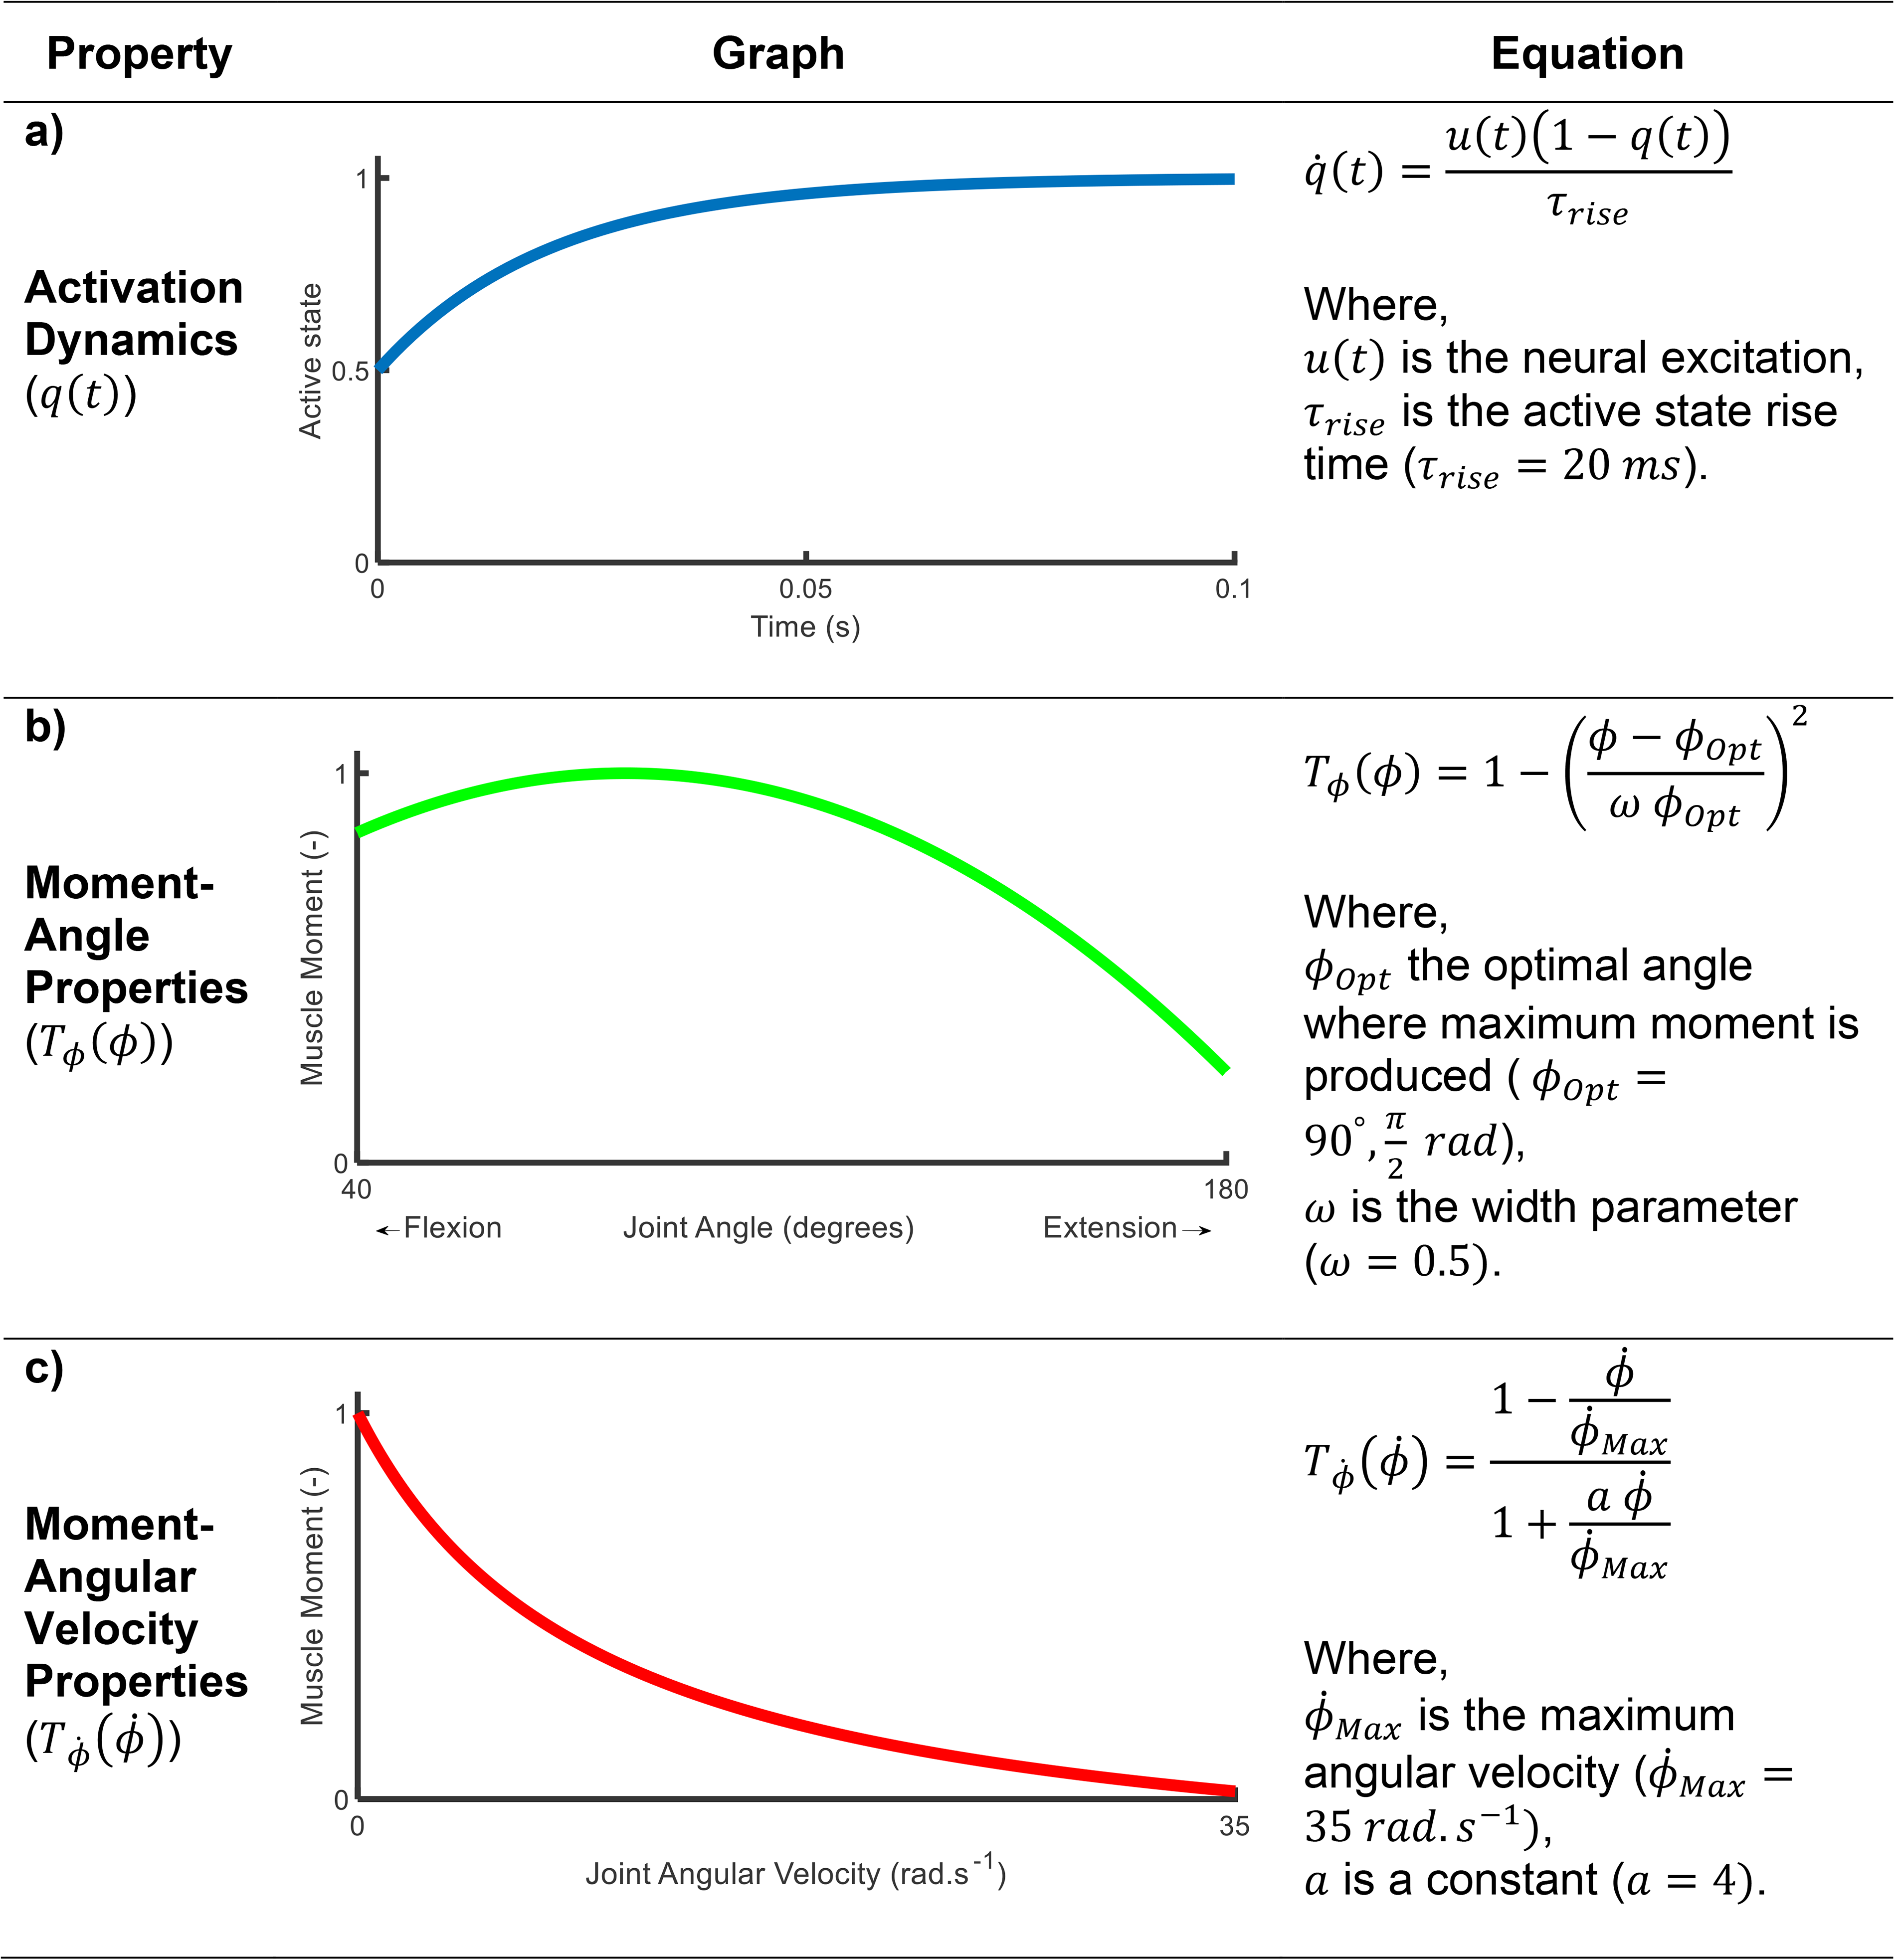
The moment at the elbow joint of the model is a function of (a) activation dynamics, (b) the moment-angle properties, and (c) the moment-angular velocity properties. For the moment-angle and moment-angular velocity properties the moments are normalized with respect to the maximum isometric moment.
The maximum isometric moment was set to represent the stronger of the 67 subjects in a study,
26
(
Throws were simulated by numerically integrating the ordinary differential equation, described in equation (14), forwards in time. For each integration time step the muscle model produces a moment at the model elbow joint, this causes an angular acceleration of the joint. At each time step the muscle moment at the elbow joint is computed using equation (15), accounting for the current active state, joint angle, and joint angular velocity. Note that for each time step the active state requires integration of the ordinary differential equation described in Figure 4(a). The simulations were started with an initial segment angle of 130°, which corresponds to an initial elbow joint angle of 40°. Throw distance is a function of ball release velocity, release angle, and the height of release (equation (13)), which are dependent on the model's joint angle and joint angular velocity. Therefore, for each ball mass the joint angle and corresponding joint angular velocity were determined which maximized throw distance.
Simulations were run for ball masses from 5.5 to 11.5 kg. The lower mass ensured the model had achieved maximum muscle active state before release, and the higher mass was close to the highest mass the model could throw. The linear model (equation (11)) fit to the simulation data gave a reasonable fit (Figure 5), with a percentage root mean square difference between the model output and the linear model of 5.8%. The fit of the non-linear model (equation (12)), based on geometric scaling principles, produced a superior fit to the simulation data with a percentage root mean square difference of 1.6%. These simulation results provide support for the theoretical relationship between ball mass and throw distance derived from geometric scaling principles.
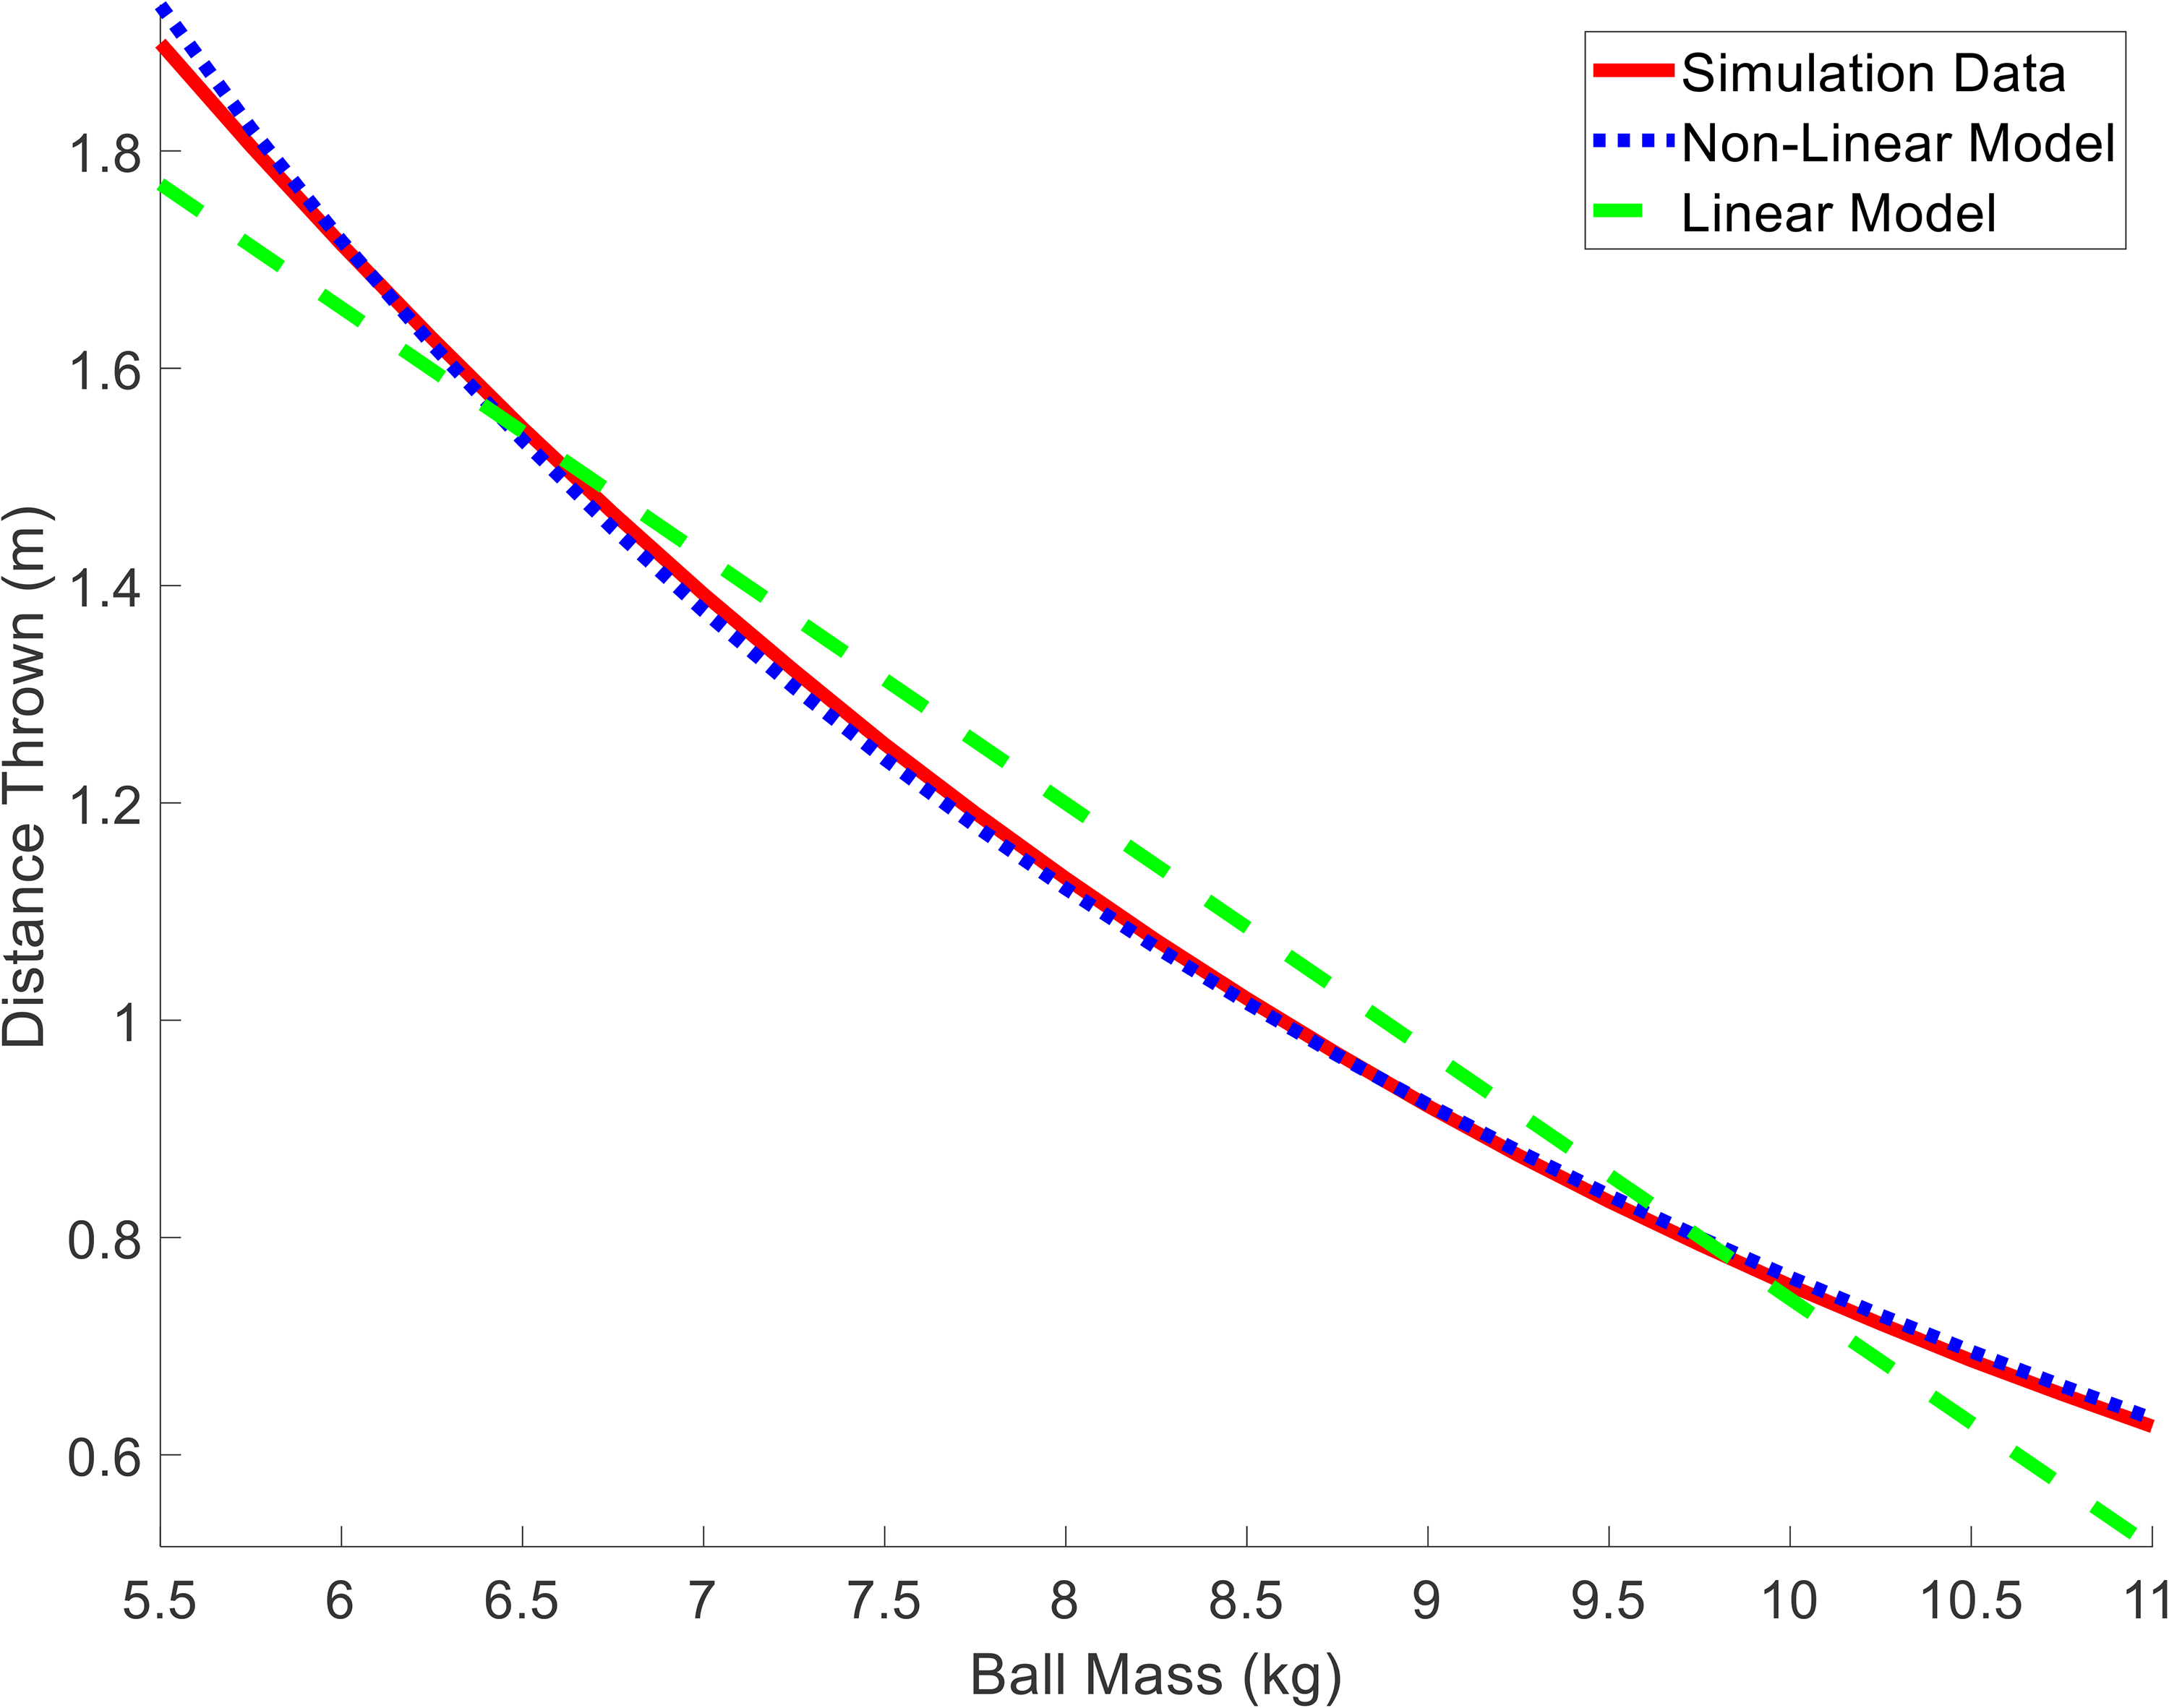
Comparison of throw distance (
Discussion
Throwing different mass balls is a training method used in the preparation for many sports.1,2 Here the relationship was examined between the ball mass and the distance the ball could be thrown. A relationship between ball mass and distance thrown was derived based on geometric scaling principles. This relationship produced a good fit to experimental data of shot putters throwing different mass shots, and hammer throwers throwing different mass hammers. The relationship was further evaluated using a simulation model, the output from which was also well predicted by the relationship derived from geometric scaling principles. These tests of the relationship indicated that predictions were better for the hammer and simulation data than for the shot put data, this likely arose because shot put data is of lower quality than the other two data sets. Overall, these results provide support for the relationship that throw distance is proportional to the inverse of ball mass. Practically, this means the coach has a tool for the assessment and comparison of athlete performance when throwing different mass balls.
Some previous studies have examined the relationship between ball mass and ball velocity.30,31 Those studies cannot be directly compared with this study as they measured ball velocity not distance thrown. In light of equation (10) a non-linear relationship between velocity and ball mass would be expected (
The experimental data used for the first evaluation of the scaling of ball mass to distance thrown was from world record shot put performances from track and field prior to 1922. These data reflect the performances of elite athletes in competitions, where different competitions used different mass shots. In modern track and field shot put, at the senior level the shot mass is fixed so equivalent modern data does not exist. The drawback of the data is that the 12 records come from six different athletes. Despite the limitations of the experimental data their analysis supports the veracity of the scaling relationship derived from geometric scaling principles; support reinforced by the good fit of the relationship to hammer throwing data.
The second evaluation of the scaling of ball mass to distance thrown used a simulation model of a simple throwing task. The model employed realistic inertial properties of the body segment and the ball. It was actuated by a muscle model which accounted for active state dynamics, elbow joint moment-angle properties, and moment-angular velocity properties. The throwing task simulated was simple but was used to confirm that it was the intrinsic properties of the system which were responsible for the observed phenomenon. The muscle model did not include a series elastic component, it was assumed that the tendon in series with the muscle fibers was inelastic. It has been demonstrated that such an assumption only has modest effects on model simulation accuracy.32,33 With any model the results could be a consequence of a fortuitous selection of model parameters. Model sensitivity analysis indicated that the pattern of model results obtained were not due to artifacts in the model parameter set. The model results had the same correspondence between ball mass and distance thrown as predicted by the relationship derived from geometric scaling principles.
The scaling of throw distance with ball mass was based on geometric scaling principles. Such principles have been successfully applied generally in biology, 34 and specifically for examining athletic performance.35,36 Such scaling principles are assumed to capture the essential features of the system but can be criticized because they ignore some properties of the system under study, for example the force-length properties of muscle. The two sets of evaluations, experimental and simulation based, of the scaling of ball mass to distance thrown indicate the relationship based on geometric scaling principles has captured the essential features impacting the task. The simplicity of the derived relationship between ball mass and throw distance augments its utility.
In training for sports in general weighted balls are often thrown as a means of training, 2 and are an important focus for those sports which involve throwing. 37 One means of monitoring the training of athletes is to measure the distance the balls are thrown. A complication is how to relate throw distance with one mass ball with the throw distance for another mass ball, for hammer throwers performance targets with different mass hammers have been presented. 22 In this study based on the principles of geometric scaling the relationship between ball mass and throw distance has been determined, and validated using both athlete performance data, and the results from a simulation model. A coach given an athlete's performance with different mass balls can then use the relationship presented here to evaluate the athlete. For example, if the athlete under performs relative to theory with under-weight balls, then speed is potentially an issue for the athlete, while if under performs with over-weight balls then strength is the potential issue.
Some data presented in the literature provide an illustration of the potential application of the geometric scaling relationship derived in this study. The bench press throw has been examined, where subjects performed a bench press with various percentages of their one repetition maximum lift, with the target of propelling the bar vertically away from the hands. 38 The authors measured the maximal vertical displacement of the bar after release from the hands. Linear and non-linear models were fit to the group mean data. The non-linear model, based on geometric scaling principles, produced a better fit to the experimental data (Figure 6). For the coach or performer, the utility of the geometric scaling model can be twofold. The first is given a new bar mass to throw the model results can give the athlete a target throw height to aim for. The second is as a way of analyzing an athlete's performance collectively across a range of bar masses. For example, an athlete whose performances are below predictions on the low end of the mass spectrum might need a different training prescription compared to an athlete who deviates below the predicted performances at the high end of the mass spectrum. This example illustrates that while reference has been made to ball mass, projectile mass is perhaps a better term as the relationship applies to any object being thrown for maximum distance.
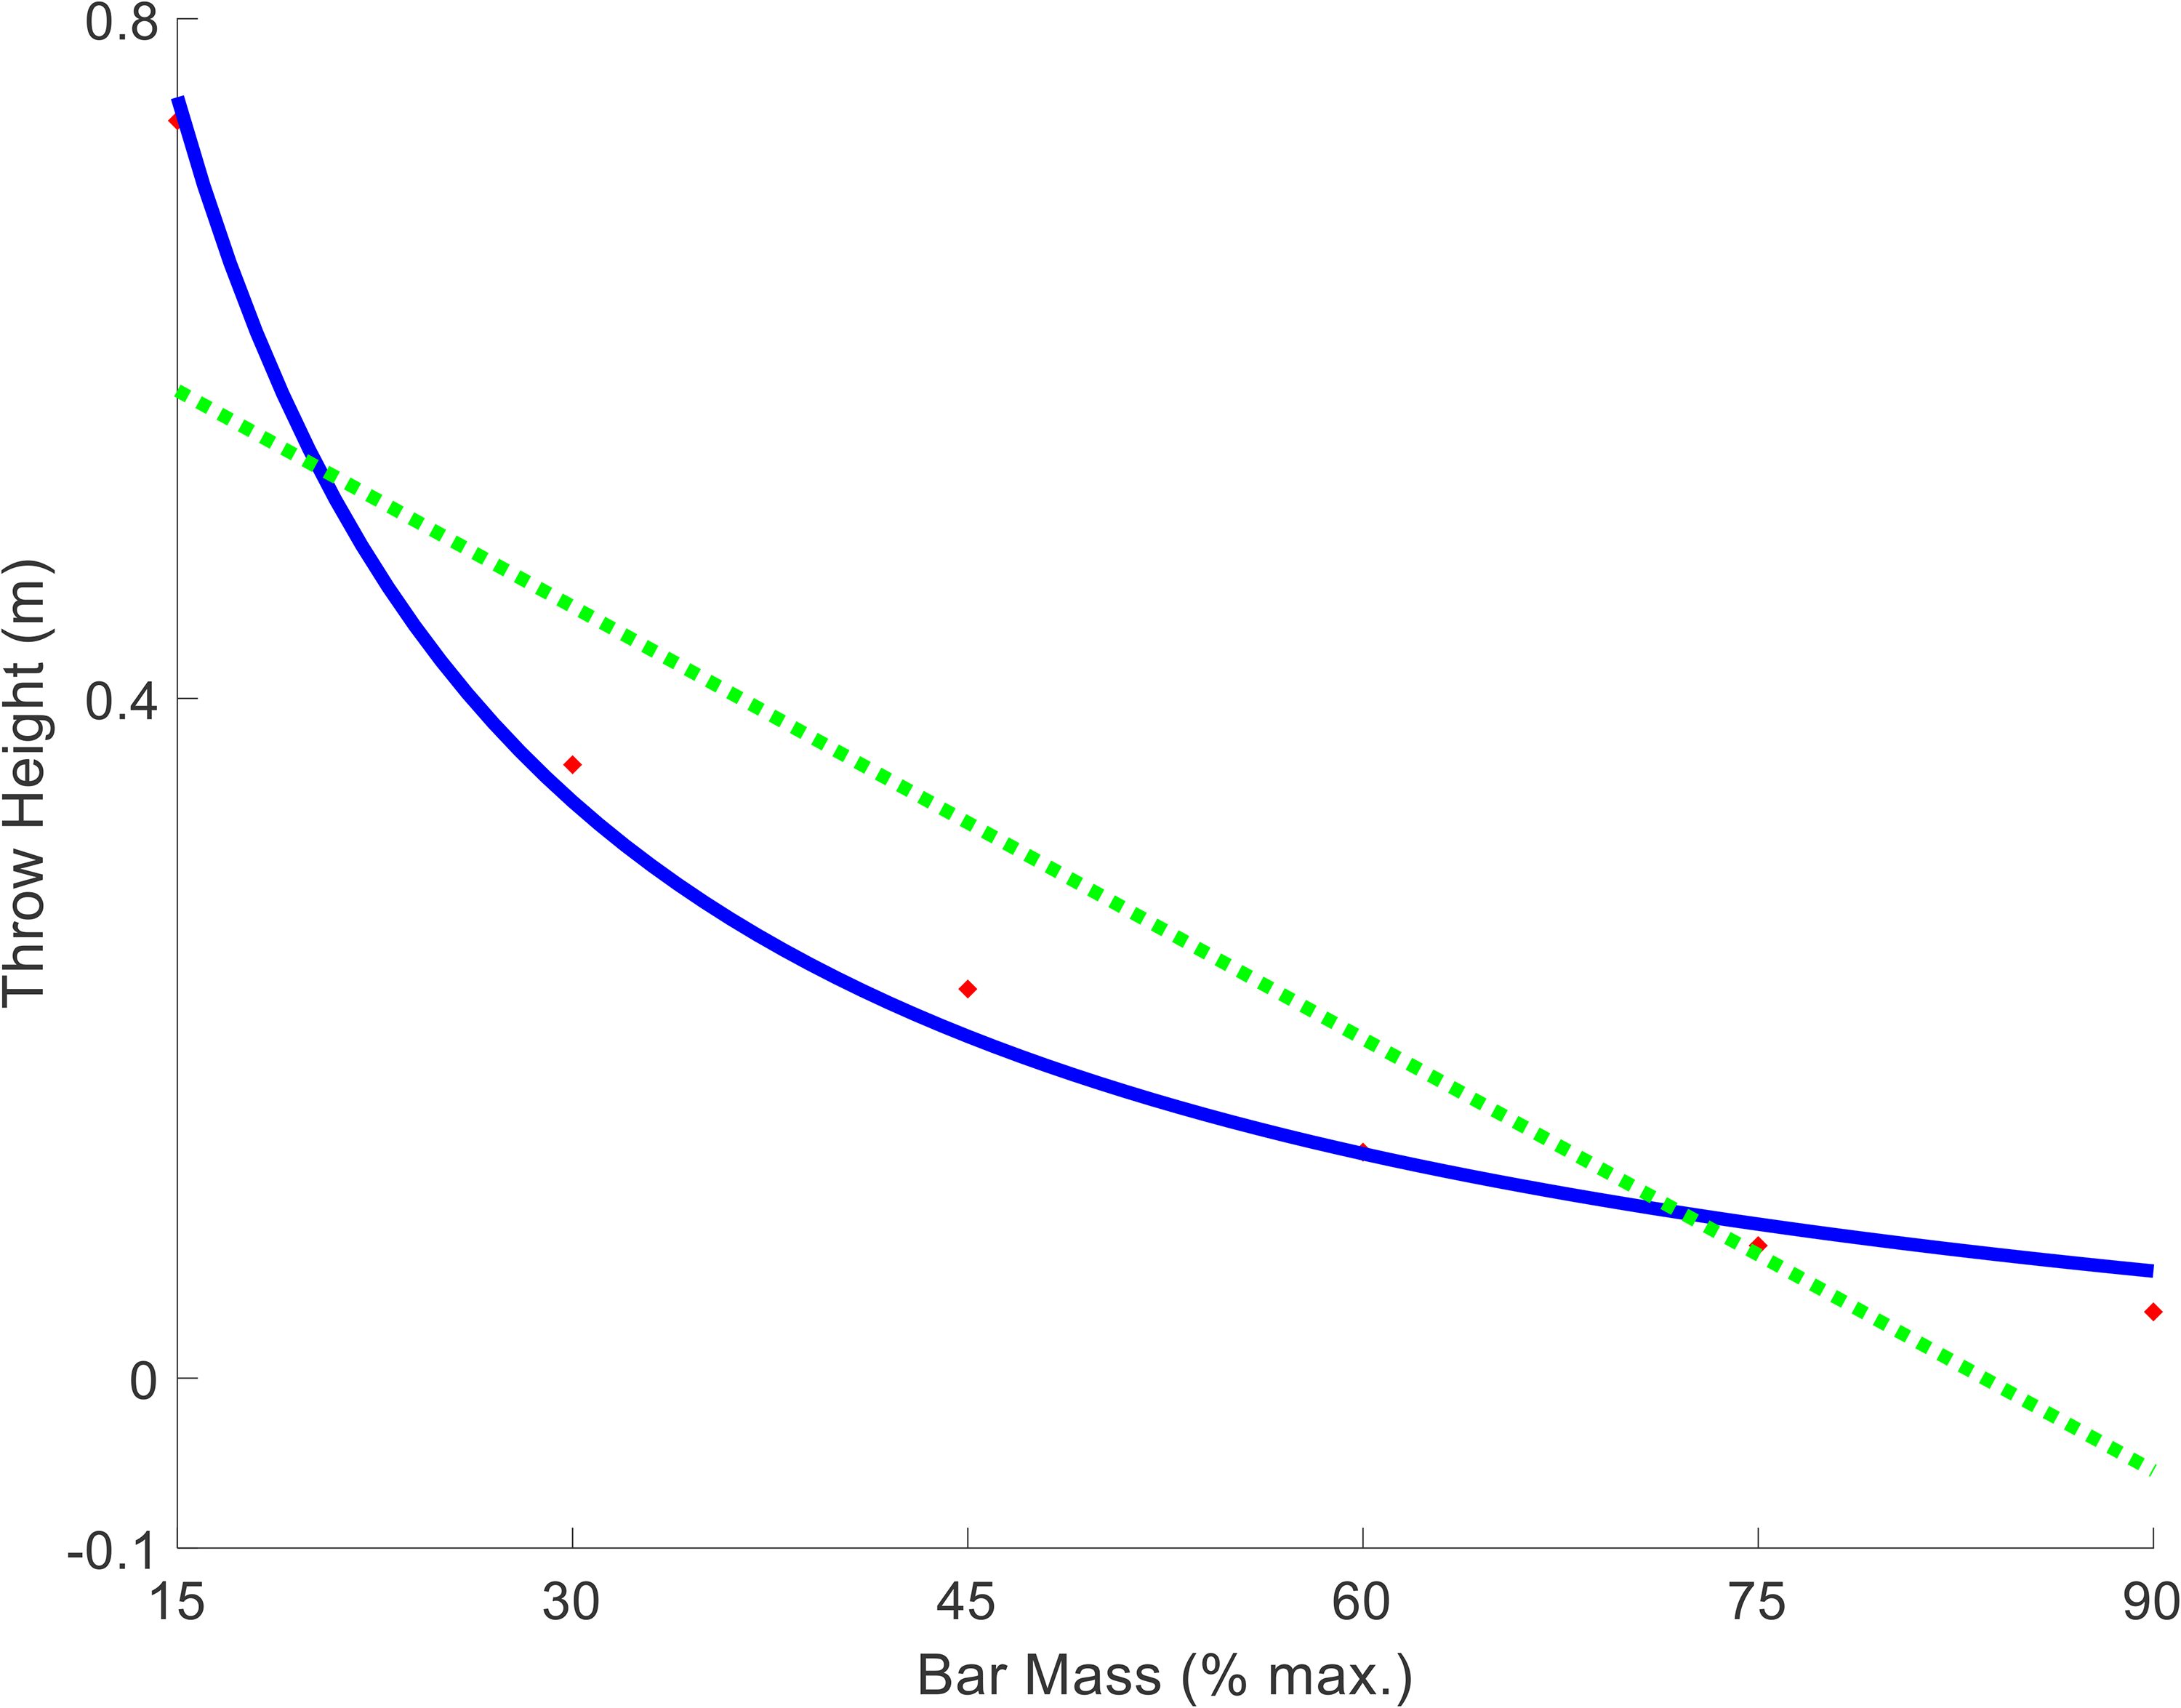
The vertical throw distance (
In conclusion, three different approaches (geometric scaling, experimental, and modeling), have been used to examine how throw distance decreases as ball or projectile mass increases. The experimental and modeling results support the theoretical relationship between distance thrown and ball or projectile mass, in effect throw distance is inversely proportional to ball or projectile mass. The relationship has utility for coaches monitoring and planning the training of athletes which incorporates throwing different mass balls and projectiles.
Supplemental Material
sj-pdf-1-spo-10.1177_17479541241247308 - Supplemental material for The relationship between ball mass and throw distance: Implications for coaching practice
Supplemental material, sj-pdf-1-spo-10.1177_17479541241247308 for The relationship between ball mass and throw distance: Implications for coaching practice by John H. Challis in International Journal of Sports Science & Coaching
Footnotes
Declaration of conflicting interests
The author declared no potential conflicts of interest with respect to the research, authorship, and/or publication of this article.
Funding
The author received no financial support for the research, authorship, and/or publication of this article.
Supplemental material
Supplemental material for this article is available online.
References
Supplementary Material
Please find the following supplemental material available below.
For Open Access articles published under a Creative Commons License, all supplemental material carries the same license as the article it is associated with.
For non-Open Access articles published, all supplemental material carries a non-exclusive license, and permission requests for re-use of supplemental material or any part of supplemental material shall be sent directly to the copyright owner as specified in the copyright notice associated with the article.