
Abstract
Understanding the factors that contribute to success or failure in Super Rugby is paramount for teams aiming to achieve positive results. This study compares winning and losing teams by analysing match-related performance indicators from 2017 to 2019, offering valuable insights for coaches, players, and performance analysts. Significantly, winning teams exhibited notable disparities in their attacking play, surpassing losing teams in total tries (4.5 vs. 2.4), offloads (12.5 vs. 11.2), number of kicks (22.2 vs. 19.4), and line breaks (3.1 vs. 2.2) (p < .0001 for all). Moreover, defensive performance emerged as a crucial factor, with winning teams demonstrating higher tackle completion rates (89.3 vs. 87.9) (p < .0001) and an increased number of breakdown turnovers won (0.8 vs. 0.6) (p = .0518) compared to losing teams. These findings illuminate distinct performance characteristics that can assist coaches, players, and analysts in optimising tactical analysis, player development, and overall performance. Despite the COVID-19 disruption in 2020 and teams transitioning to other competitions, the research remains relevant due to the expected persistence of fundamental game aspects and performance indicators. This adaptability enables informed decision-making, leading to improved performance and a competitive advantage in the current Super Rugby competition.
Introduction
Rugby Union (hereafter referred to as rugby) is widely recognised for its dynamic nature and the intricate ball skills required to excel in the sport. This inherent complexity creates a constantly evolving and challenging competitive landscape. 1 As a result, the utilisation of performance analysis (PA) has gained significant traction in professional sports, particularly in rugby. 2 Coaches now heavily rely on various PA sources to develop effective strategies and objectively evaluate team and player performance, moving beyond mere game review and result analysis. 1 The aim of PA is to understand and interpret data within the context of match preparation, providing coaches with valuable insights for optimising performance. 3
Analysing and comparing winning and losing teams in rugby is crucial for uncovering the factors that contribute to success or failure on the field. 4 This analysis goes beyond superficial observations and provides in-depth insights that enable coaches to devise effective strategies, evaluate player performance accurately, and set benchmarks for continuous improvement.5,6 Such analysis helps identify performance indicators (PIs) that differentiate between winning and losing teams, enabling coaches to develop tailored strategies, evaluate player effectiveness, and drive overall performance improvement. 7 Numerous studies have examined PIs while comparing winning and losing teams across prestigious tournaments like Rugby World Cups and Six Nations championships. In this context, Vaz et al. 8 emphasised the multifaceted nature of rugby and underscored the significant impact of contact interactions, such as scrums (winning = 10.63; losing 8.43), rucks (winning = 90.0; losing = 64.0) and tackles attempted (winning = 84.63; losing = 82.57), on performance outcomes. For instance, Hughes et al. 9 conducted a study analysing PIs during the knockout stages of the 2015 Rugby World Cup for men and the 2014 Rugby World Cup for women. The findings revealed notable differences between winning and losing teams in terms of kicking possession, possession-oriented attacking style, and lineout success rate. Similarly, Bunker and Spencer 10 focused on the 2019 Rugby World Cup and highlighted the significance of ball carry effectiveness, total meters gained, and adaptive playing strategies in determining success.
To gain a understanding of match play, the use of match data analysis and notational analysis has become indispensable.11,12 These analytical tools delve into intricate aspects of the game, including movement constructs, tactical approaches, and game plans. 13 By employing notational analysis, coaches and performance analysts can extract PIs that provide insights into the performances of individual players, different positions, and entire teams.7,13 Consequently, PA in rugby equips coaches and teams with valuable insights into the complexities of the sport, empowering them to analyse performance, make informed decisions, and optimise strategies to enhance team performance and achieve success.11,13 Such analysis helps identify PIs that differentiate between winning and losing teams, enabling coaches to develop tailored strategies, evaluate player effectiveness, and drive overall performance improvement. 7
At the time of the data collection and even with the change in format Super Rugby was the most important rugby competition outside Europe at a club level. The competition involved 15 teams from five different countries (Argentina, Australia, Japan, New Zealand, and South Africa) playing each other home or away during the season. 14 Studies on Super Rugby have also yielded valuable insights into PIs that differentiate between successful and unsuccessful teams. Schoeman and Schall 6 discovered that the 2017 Super Rugby tournament displayed a more running-oriented style of play, as evidenced by PIs such as tries scored (3.3), offloads (10.4), line breaks (5.7), tackles missed (13.1), tackle breaks (5.6), and turnovers conceded (13.5). Another study conducted by Schoeman et al. 5 spanning from 2011 to 2015 identified lineout success rates and successful tackle percentages, as key PIs that distinguished winning teams from losing teams. The study revealed that winning teams lost fewer lineouts between 2011 and 2015 (2011: 0.05, 2012: 0.05, 2013: 0.04, 2014: 0.06, 2015: 0.05) compared to losing teams (2011: 0.07, 2012: 0.06, 2013: 0.05, 2014: 0.06, 2015: 0.06). Winning teams also missed fewer tackles during the 2011, 2012 and 2014 seasons (2011: 0.45, 2012: 0.47, 2014: 0.53) compared to losing teams (2011: 0.48, 2012: 0.56, 2014: 0.55).
Despite changes in the Super Rugby competition, the studies conducted on team performance continue to hold significance. The fundamental aspects of the game and the PIs that impact success are expected to remain relevant, offering valuable insights for comprehending team dynamics and making strategic decisions. Notably, the PIs that consistently determine the difference between winning teams’ attack include tries scored, offloads, line breaks, and for defensive PIs, tackle completion rates. By analysing match-related PIs in Super Rugby seasons spanning from 2017 to 2019, a golden opportunity emerges to scrutinise and comprehend the performance profiles of both winning and losing teams. This further enriches the knowledge base accessible to coaches, performance analysts and players empowering them with data-driven approaches to improve team outcomes and enhance overall performance in the evolving landscape of the competition.
Research methodology
Research design
The study used a retrospective design to analyse performance. Historical records and existing data were utilised to examine performance outcomes, identify patterns, and gain insights into past performance trends and strategies within Super Rugby Competitions. Permission was obtained from the South African Rugby Union (SARU) to ensure ethical and legal data usage, following their guidelines. Ethical approval was granted by the Health Sciences Research Ethics Committee (HSREC) at the University of the Free State, under ethics clearance number UFS-HSD2020/2012/2411-0002.
Sample
A total of 396 televised matches played during the 2017 to 2019 Super Rugby seasons were included in this study. The dataset comprised 792 observations, representing the data for both teams involved in each game. One match was excluded from the analysis as it did not take place (it was deemed a draw by the competition organisers).
Data collection process
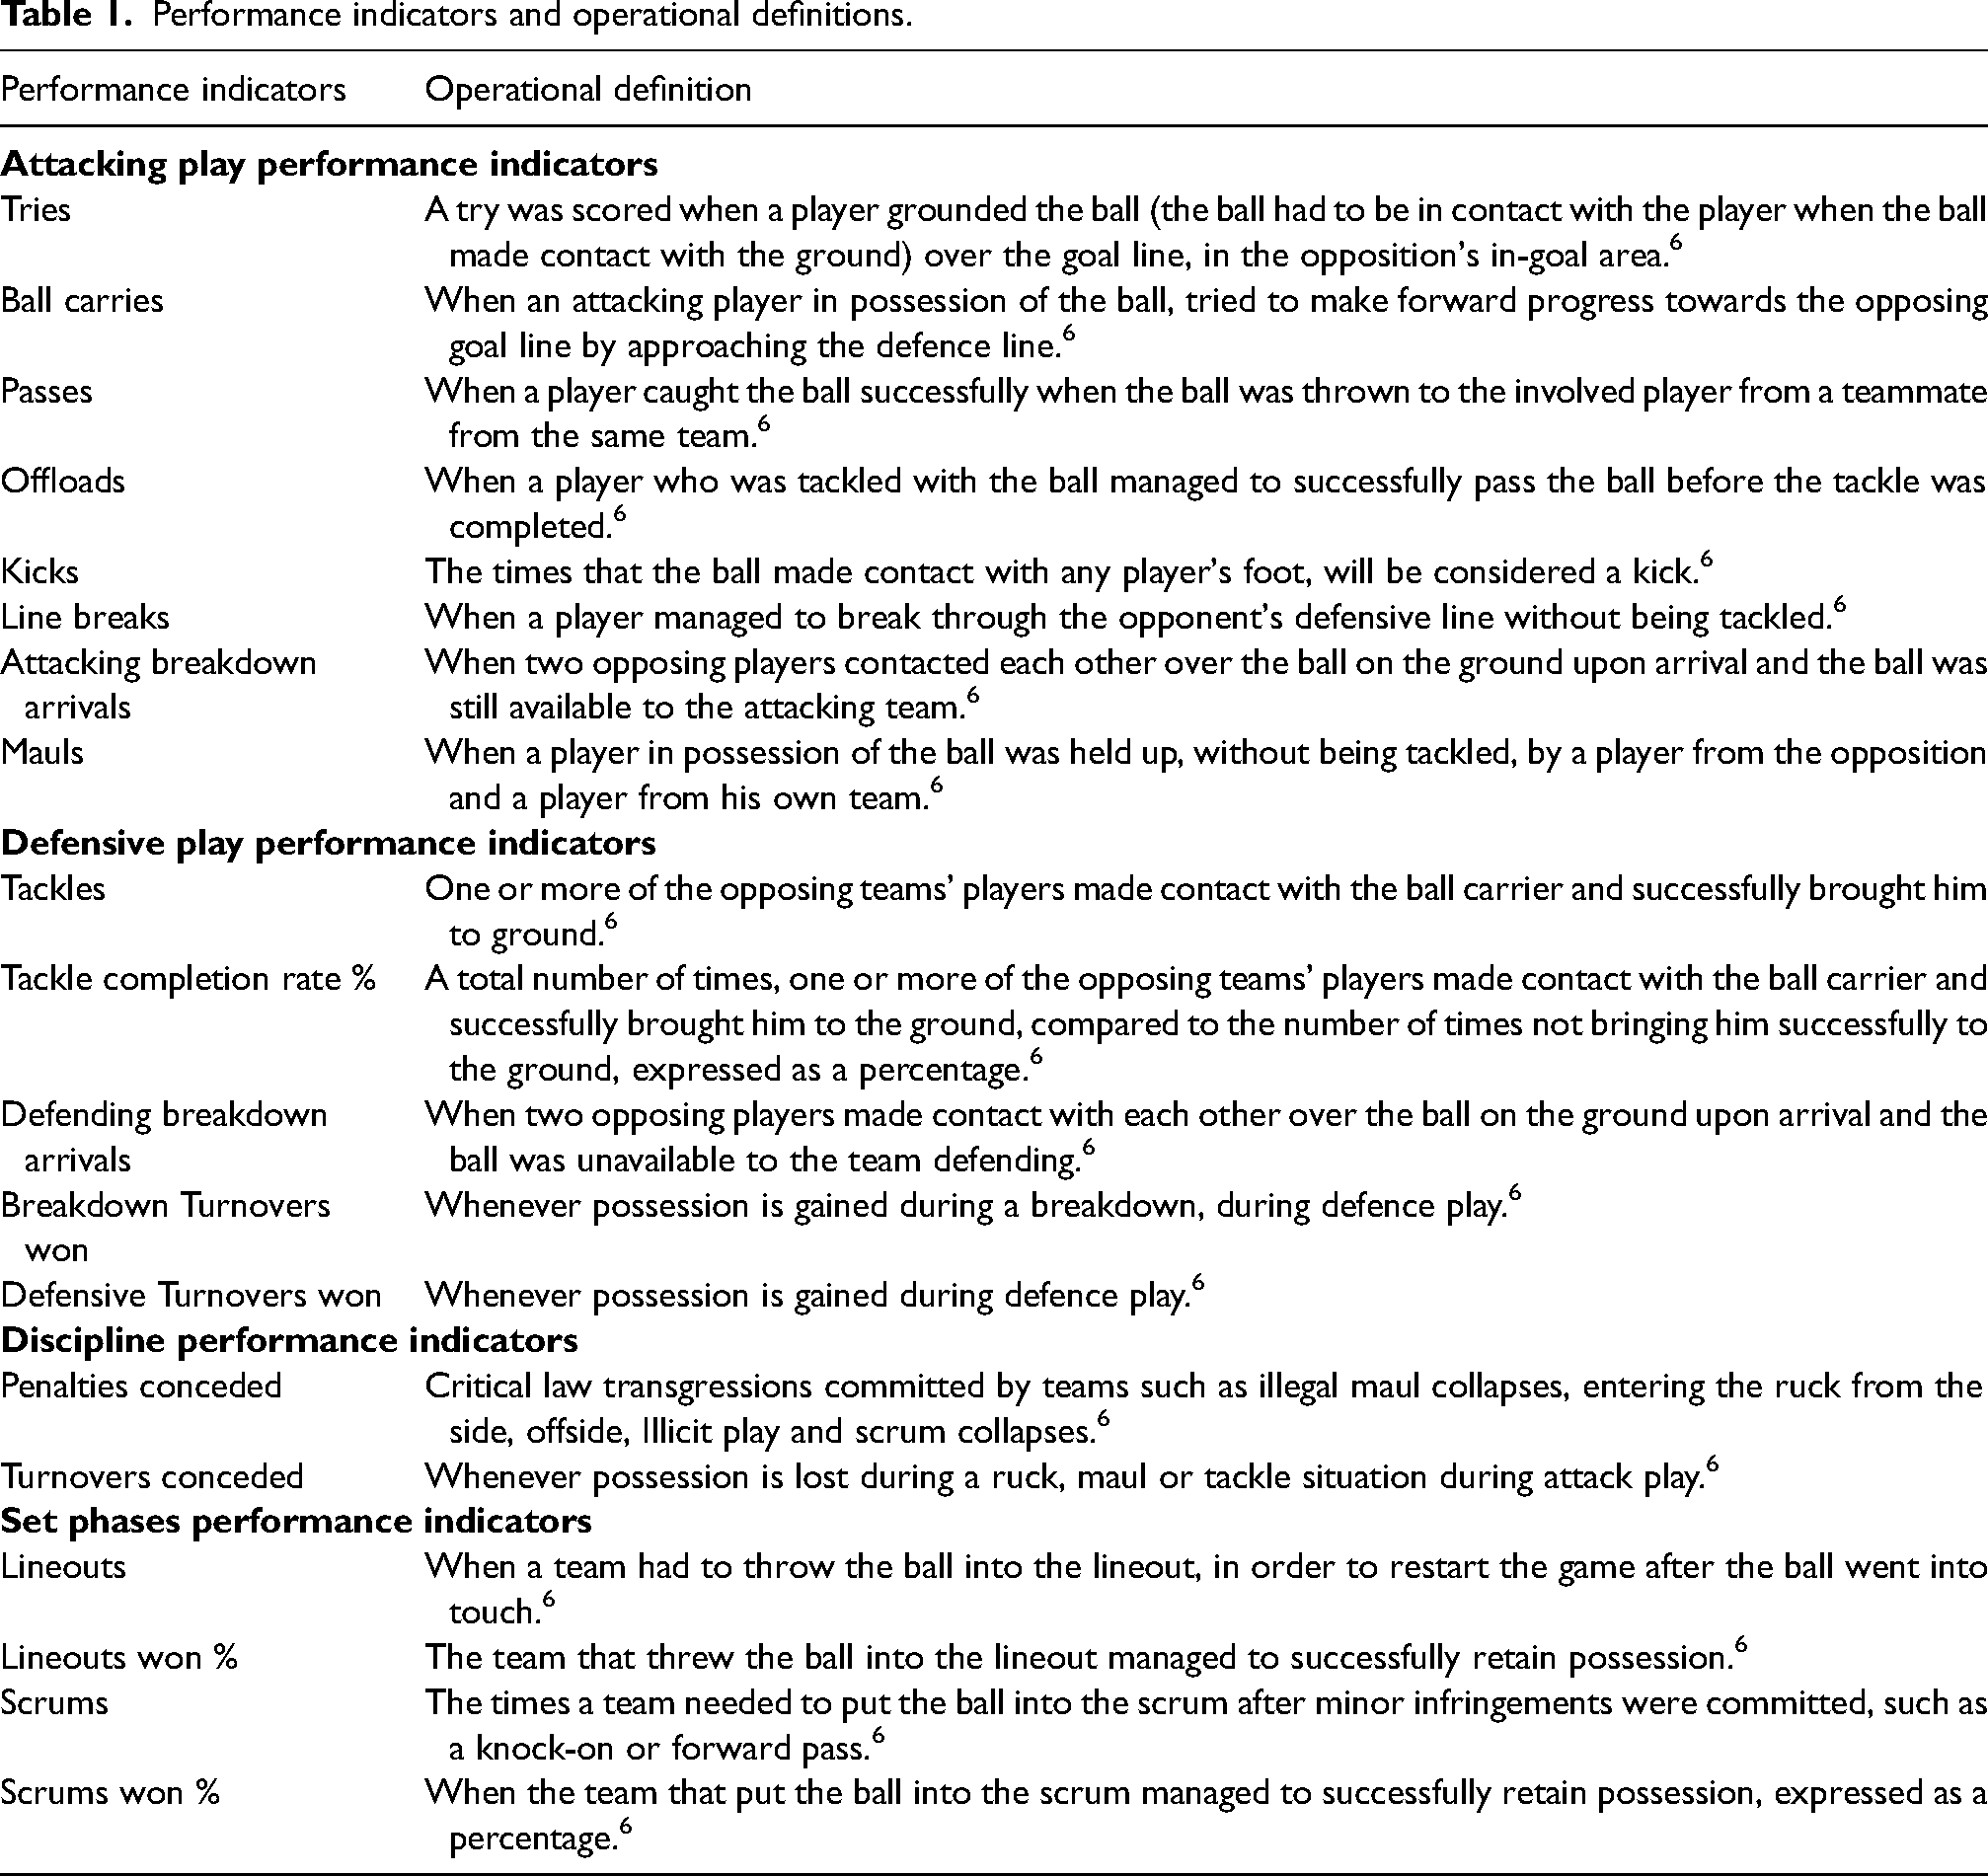
Match footage and match data for the study were provided from the SARU technical department, based in Cape Town, South Africa. SARU is a technical partner of the Super Rugby competition. Data were extracted using Stratus Mobii video analysis software, specifically developed for SARU in 2013. The PIs were coded and analysed according to the operational definitions provided by the technical department. These same PIs and operational definitions were used for the reliability testing (Table 1).
Performance indicators and operational definitions.
The SARU technical department's internal quality control measures have been thoroughly examined. Their methodology adheres to industry standards, and their expertise and experience in providing reliable data are well-regarded. They have established rigorous quality control measures, including data validation and outlier detection, to ensure accuracy. The department has implemented strategies to address potential sample biases and conducts data verification through cross-referencing, internal audits, and peer review processes. Robust data security measures, such as encryption and access controls, are in place to protect the integrity of the data. Overall, these comprehensive internal quality control measures instil confidence in the credibility and reliability of the collected data. To further enhance the reliability of the collected data, an inter-coder reliability test was conducted. This involved an experienced and proficient performance analyst at Stellenbosch University collaborating with the primary investigator. The reliability of coding was further confirmed by implementing a system of re-examining the data for inter-examiner reliability consistency, as suggested by James et al. A sample of 25% of the matches was selected to ensure unbiased evaluation. The inter-coder agreement was rated on a scale ranging from “poor” to “perfect,” with almost perfect reliability (r = 0.82) achieved. The data was deemed reliable and included in the study for analysis and reporting purposes.
Statistical analysis and interpretation of data
The statistical analysis was performed using the SAS software (see SAS, 2017). 15 The statistical analysis involved three steps.
Descriptive statistics
In the first step, mean incidence rates (count per game) were calculated for count PIs (number of kicks, tackles, etc.), while mean proportions (%) were calculated for variables such as tackles completed, lineouts won, and scrums won. These calculations were done separately for each season, considering match outcomes (draw, win, loss), overall, for each season, overall, by match outcome, and overall for all 792 observations. These averages allowed for comparisons between seasons and between winners and losers in terms of PIs. Additionally, separate averages were calculated for each team to facilitate comparisons among them.
In the second step, a two-way analysis of variance (ANOVA) was conducted. Here the PIs were the dependent variable, and “game” and “result” (win/loss) were independent variables. This analysis served as a screening process, and the effect size measure, partial omega squared (ω2), was calculated to evaluate the mean difference (MD) between winning and losing teams. PIs with an ω2 greater than or equal to 0.01 were selected for further analysis in step 3. Note that this screening process was performed on count data, which does not follow a normal distribution, and the data from different matches might not be independent due to team involvement in multiple matches. However, the large sample size allowed for a useful estimation of effect size to identify differentiating PIs. The analysis was conducted using SAS procedure GLM. In the next step, the selected PIs from Step 1 were analysed using a generalised linear mixed model (GLIMM; SAS procedure GLIMMIX) in Step 3. The GLIMM included match result (win/loss) as a fixed effect and team and game as random effects. Variance components and random effects were dropped from the model if they were zero or if the model fitting algorithm did not converge. The GLIMM used a Poisson error distribution with the natural logarithm as the link function and accounted for residual over-dispersion. The significance of the fixed effect (match result) was assessed to determine significant differences between winning and losing teams for each PI. The corresponding p-value, rate ratios, and 95% confidence intervals (CIs) for the rate ratios were reported for count PIs. For proportion-based PIs (e.g. tackles completed), a conventional linear mixed model was fitted using SAS procedure MIXED, and mean differences and 95% CIs for the mean differences were reported.
Results
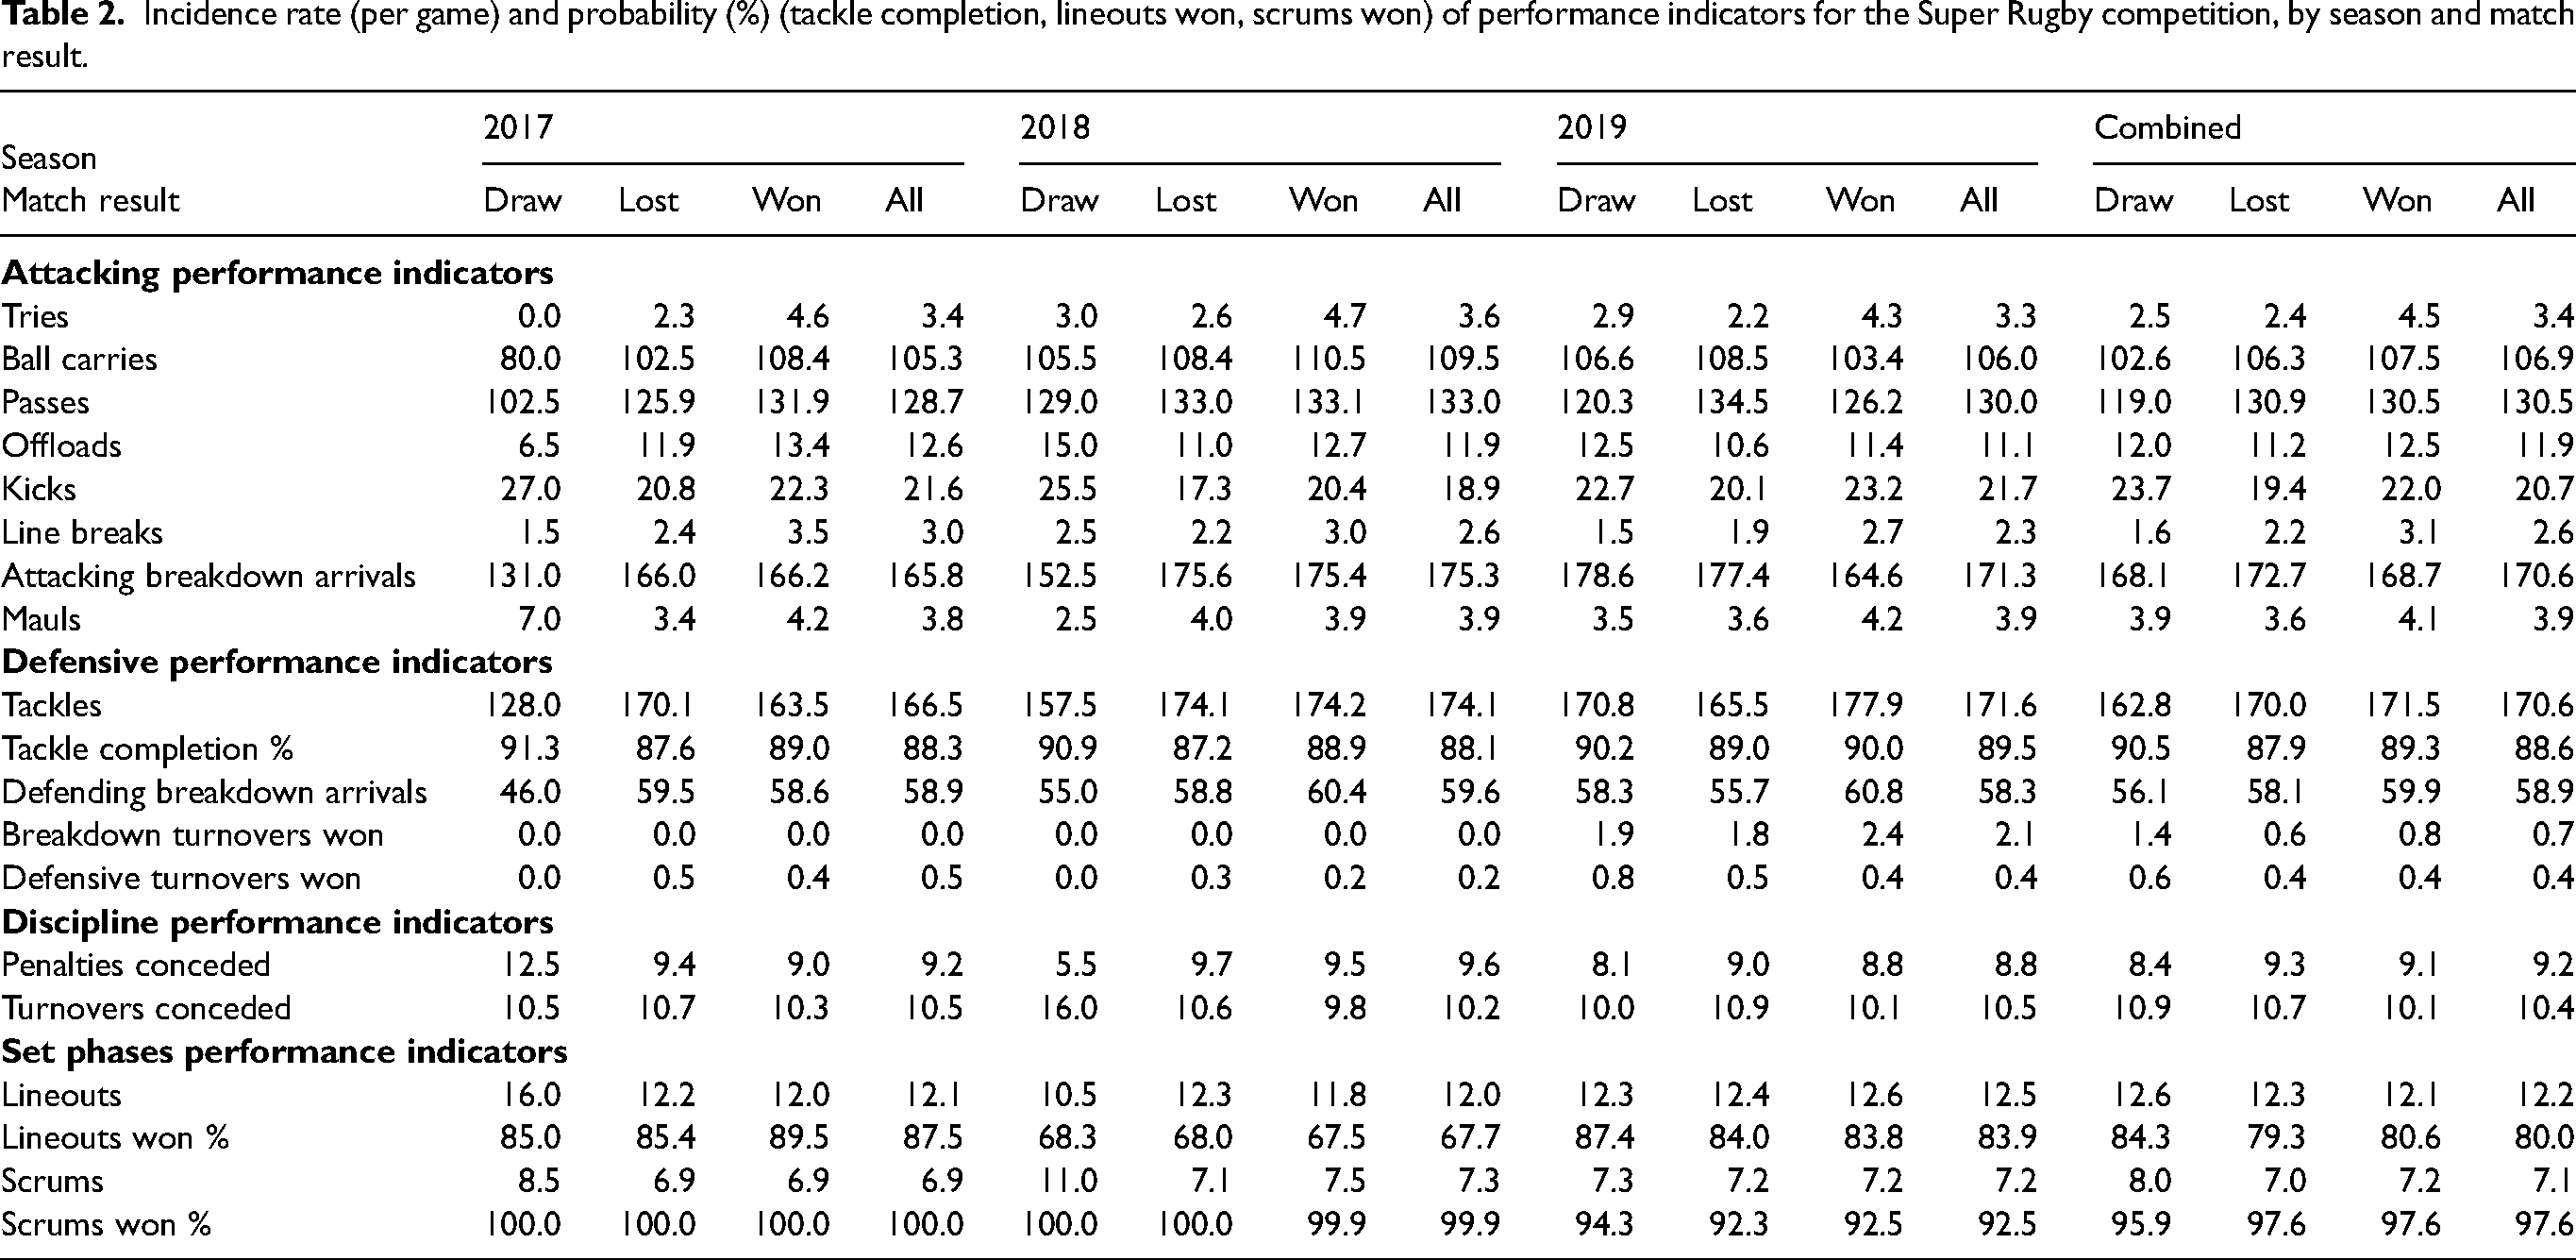
Table 2 provides estimates of incidence rates and probabilities for different PIs by season and match result. Table 3 presents the same estimates but categorised by team. Table 4 shows the association of PIs with match results, excluding data from drawn matches for this analysis. Figures 1 to 6 display the statistically significant differences in PIs related to attacking play and defensive play.
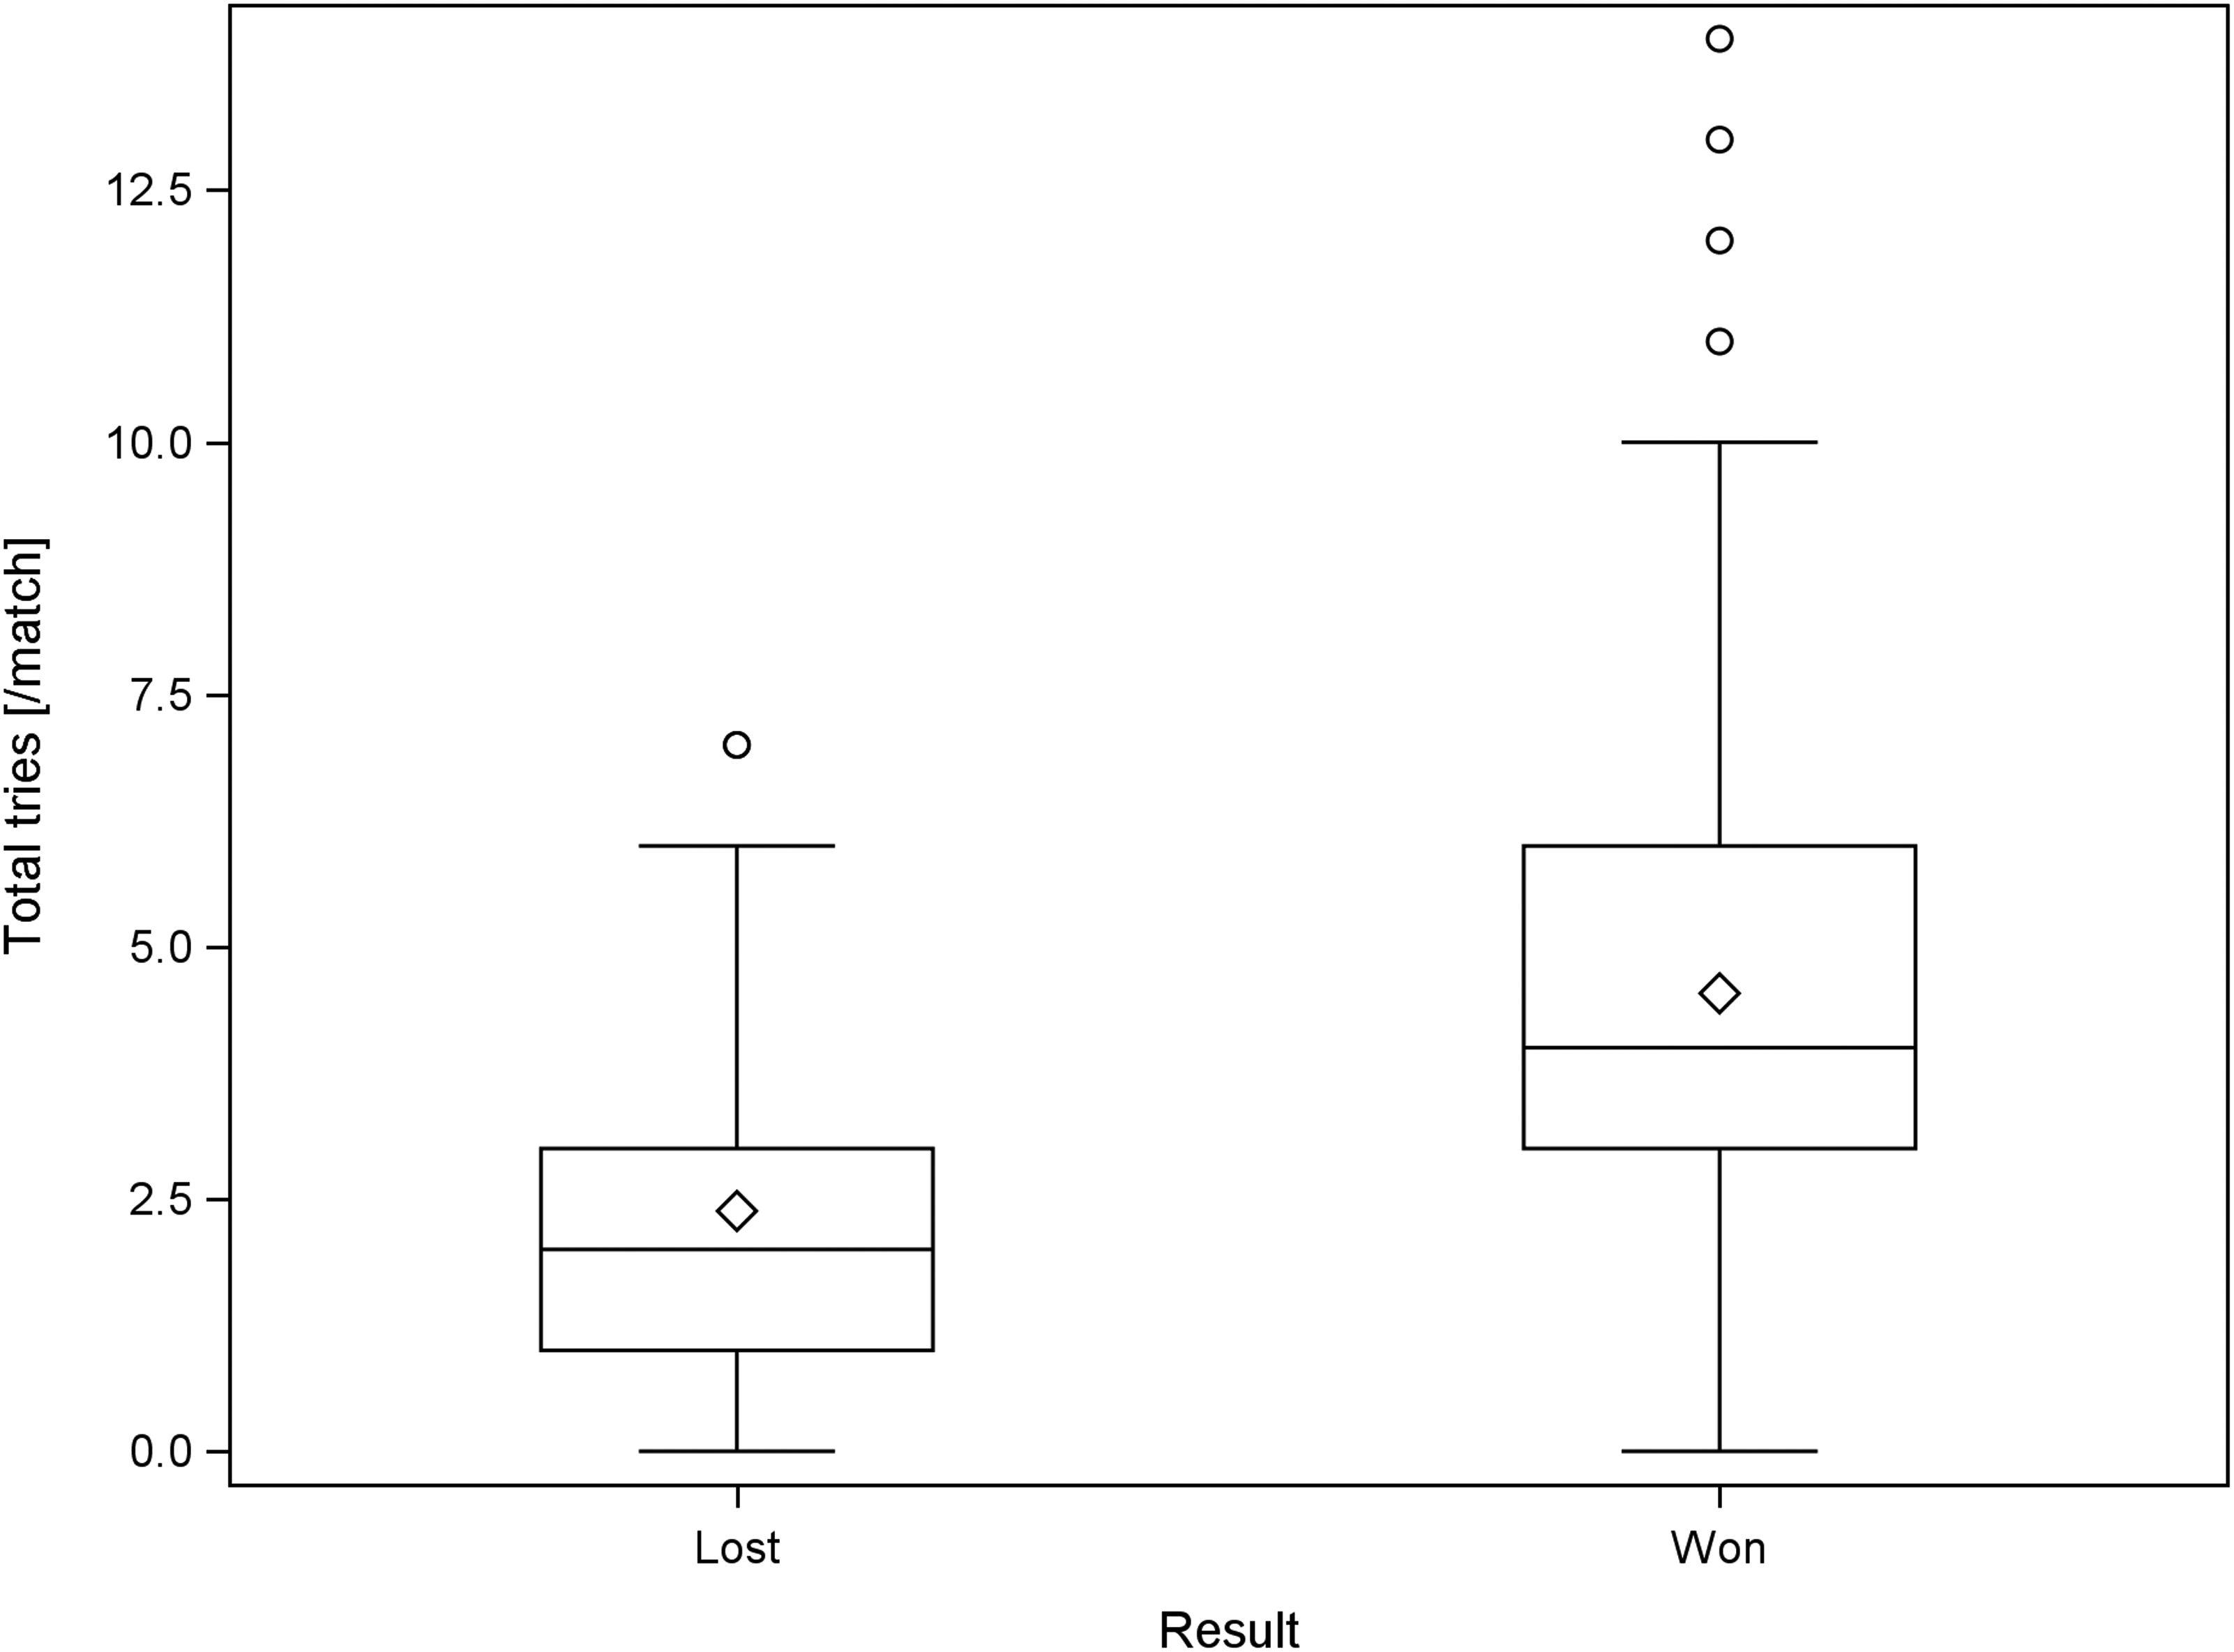
Mean number of total tries per match.
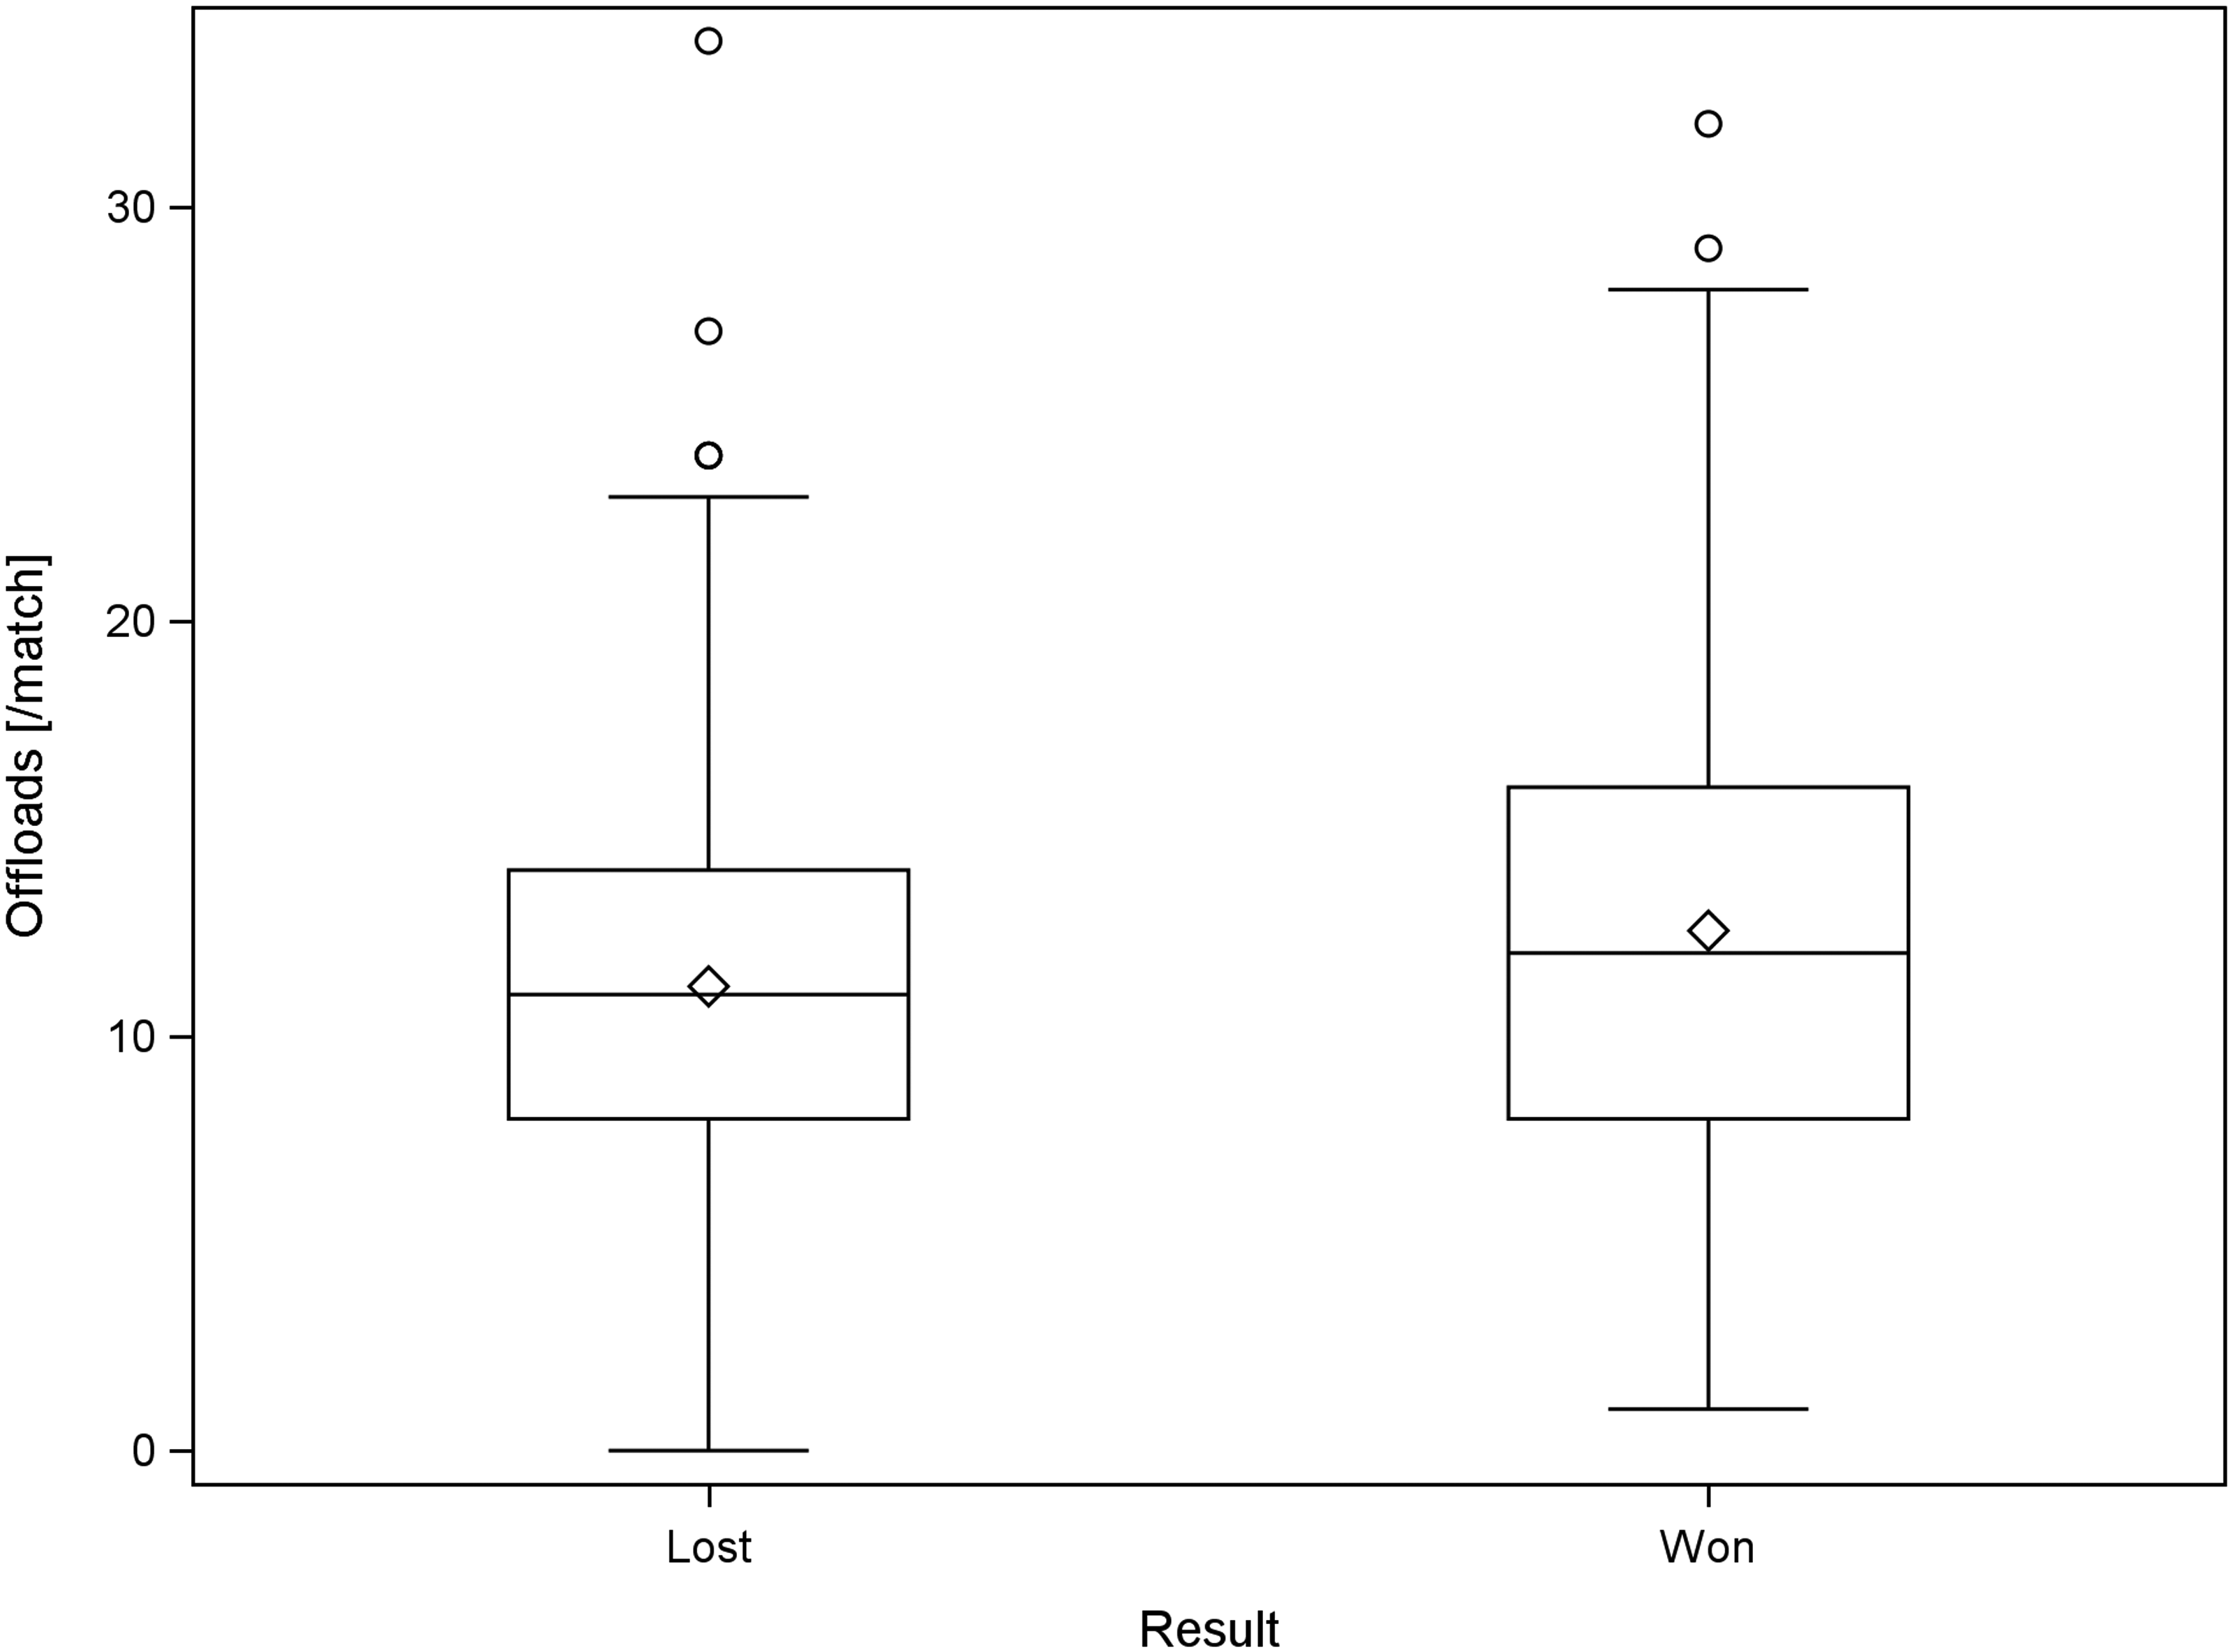
Mean number of offloads per match.
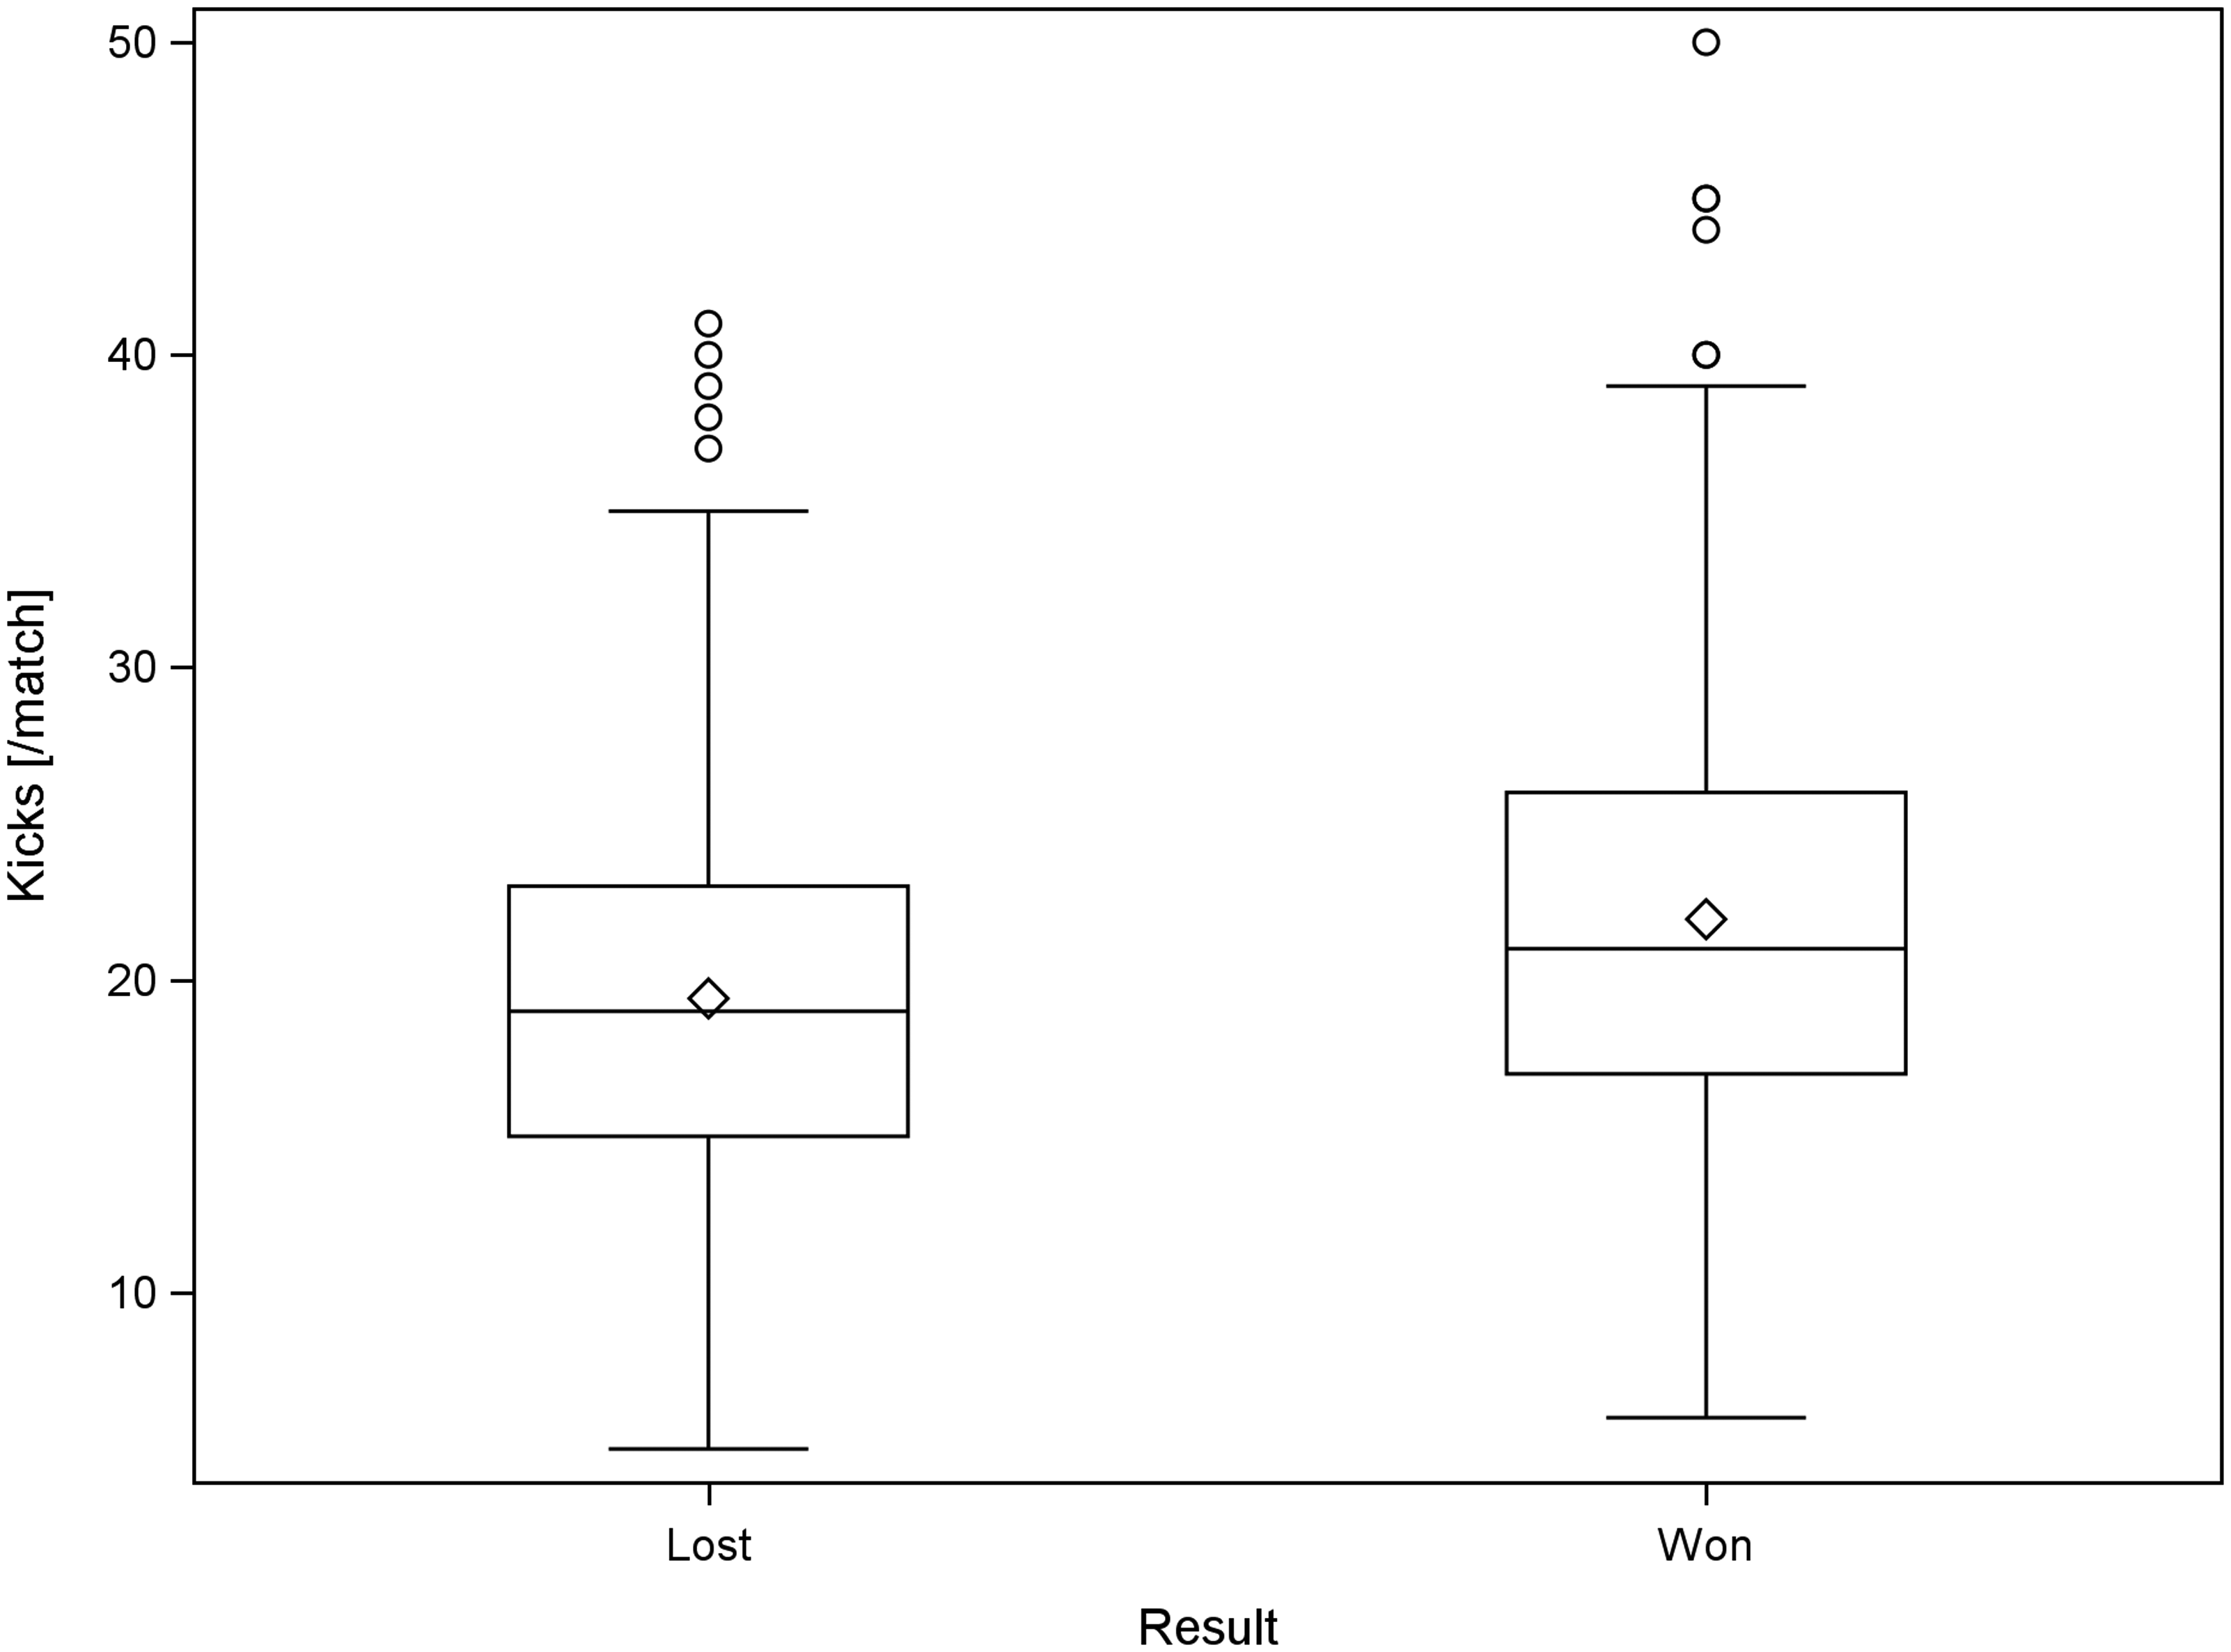
Mean number of kicks per match.
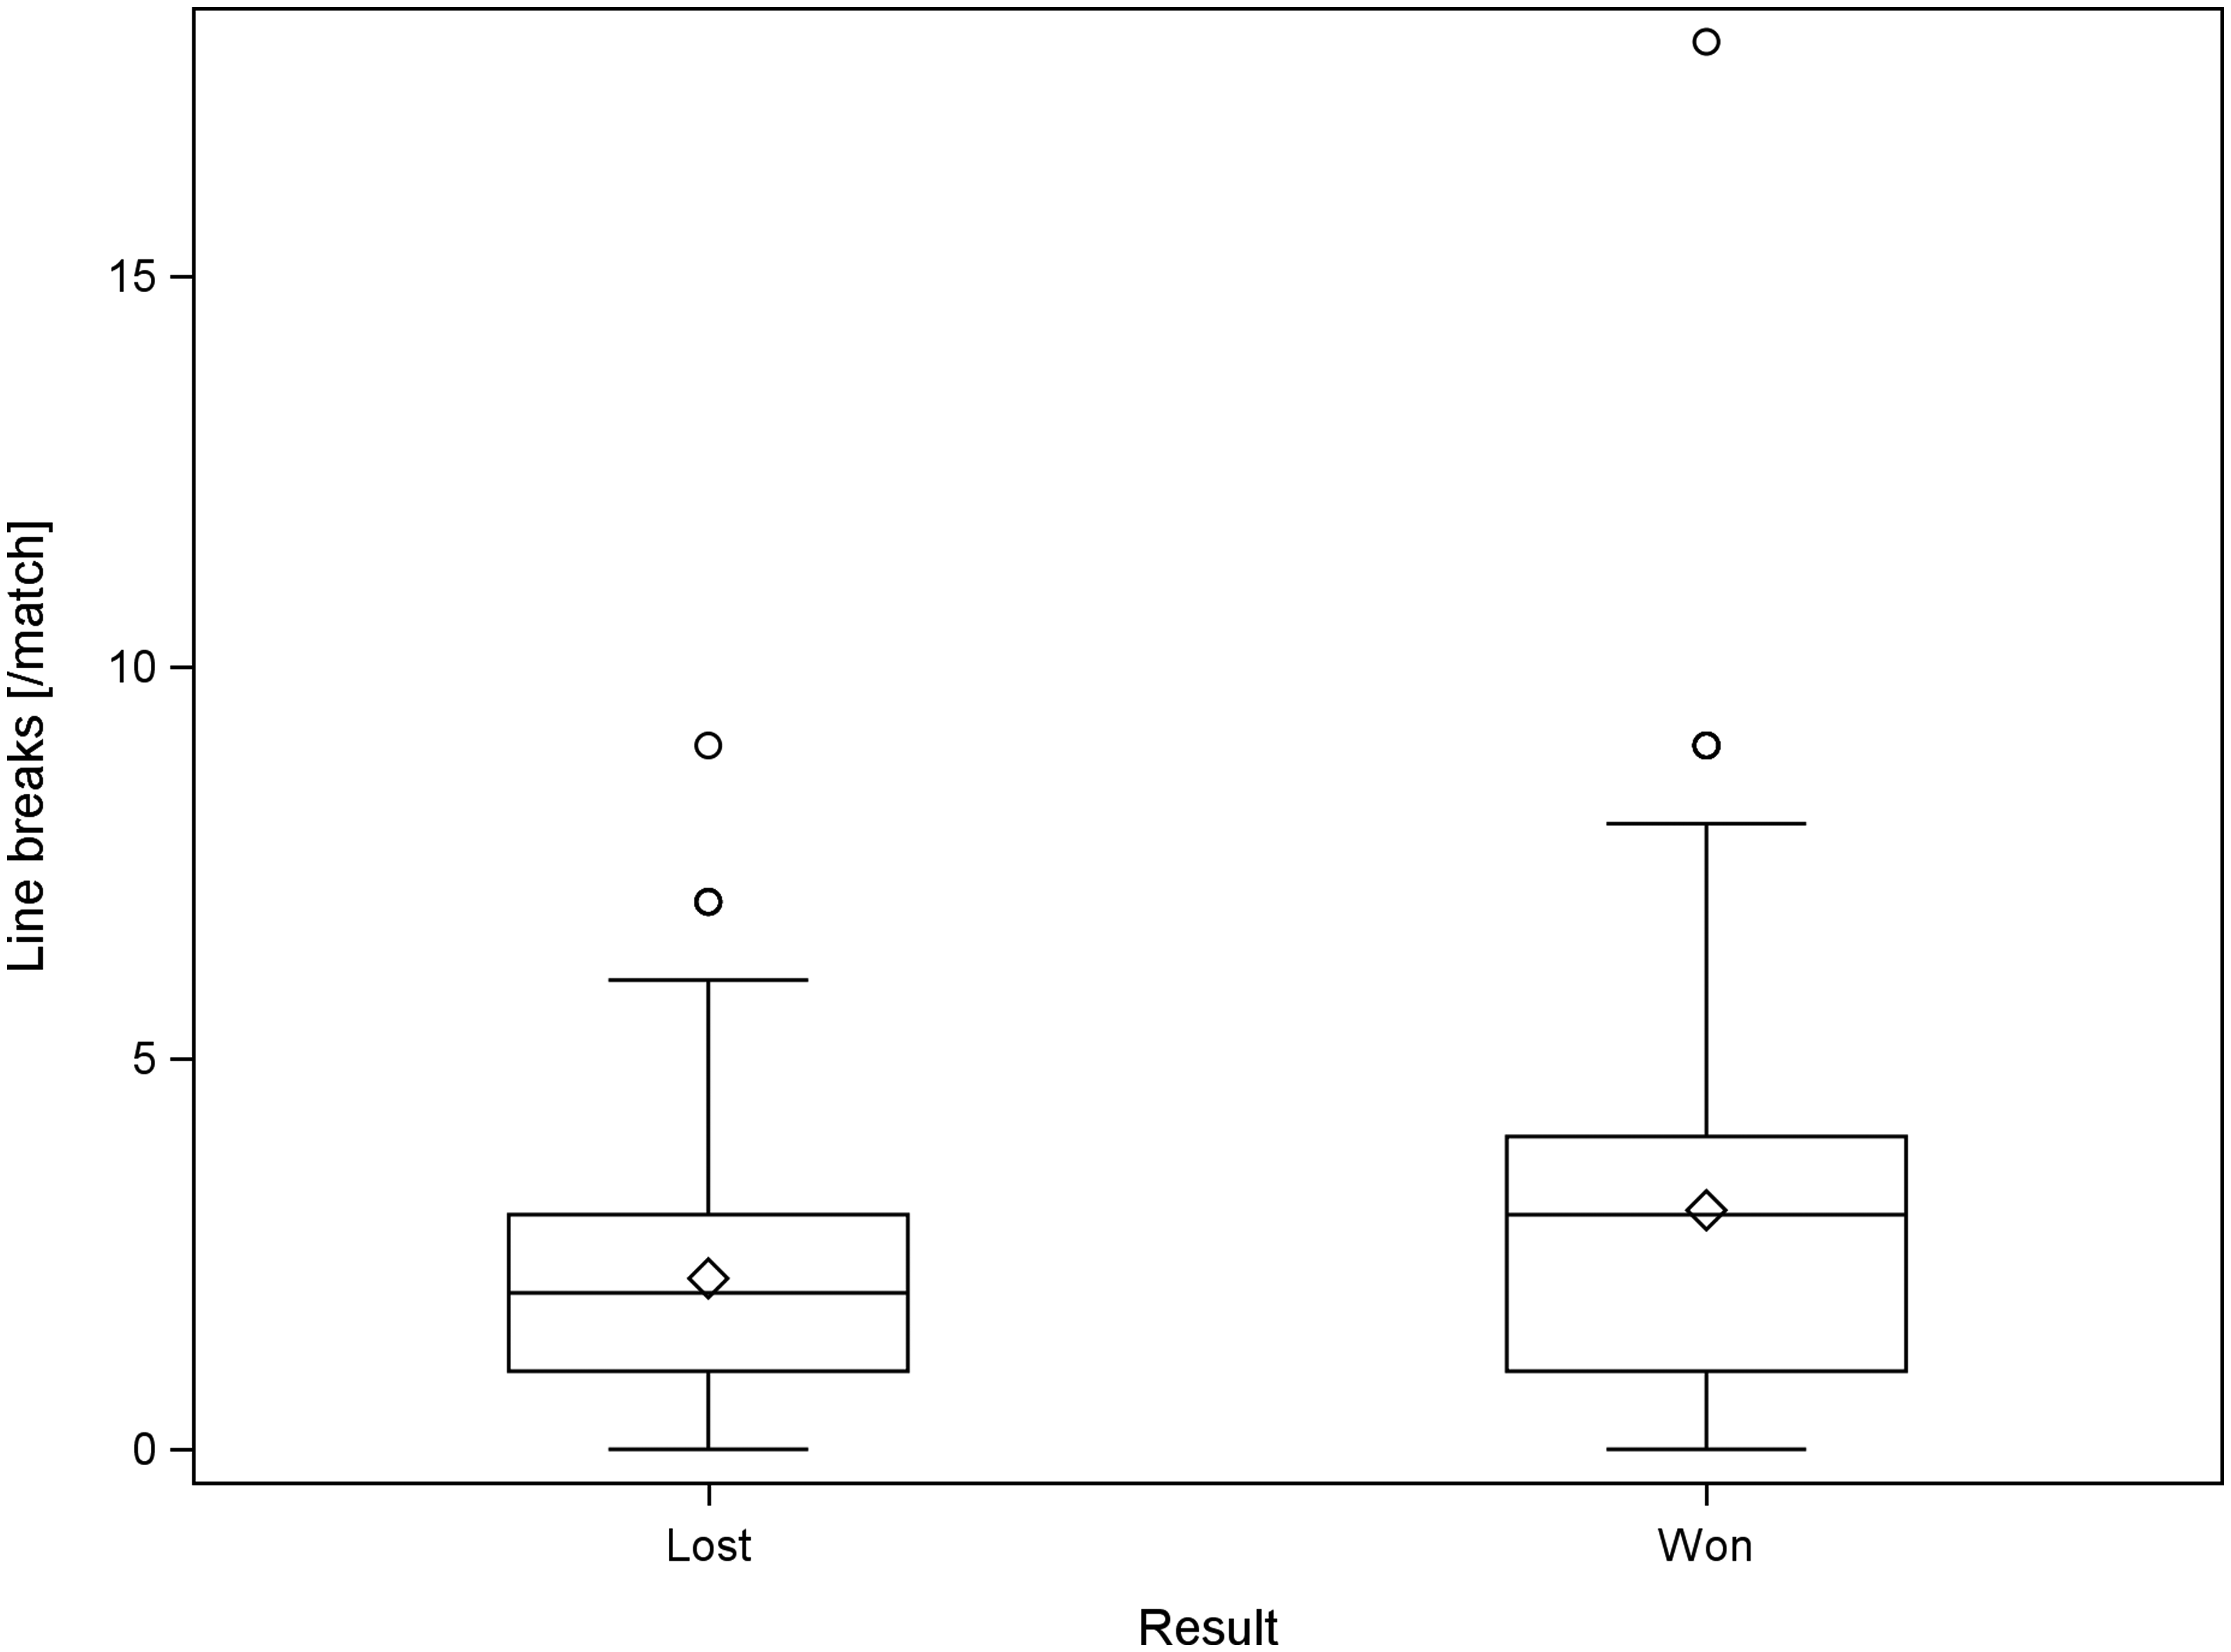
Mean number of line breaks per match.
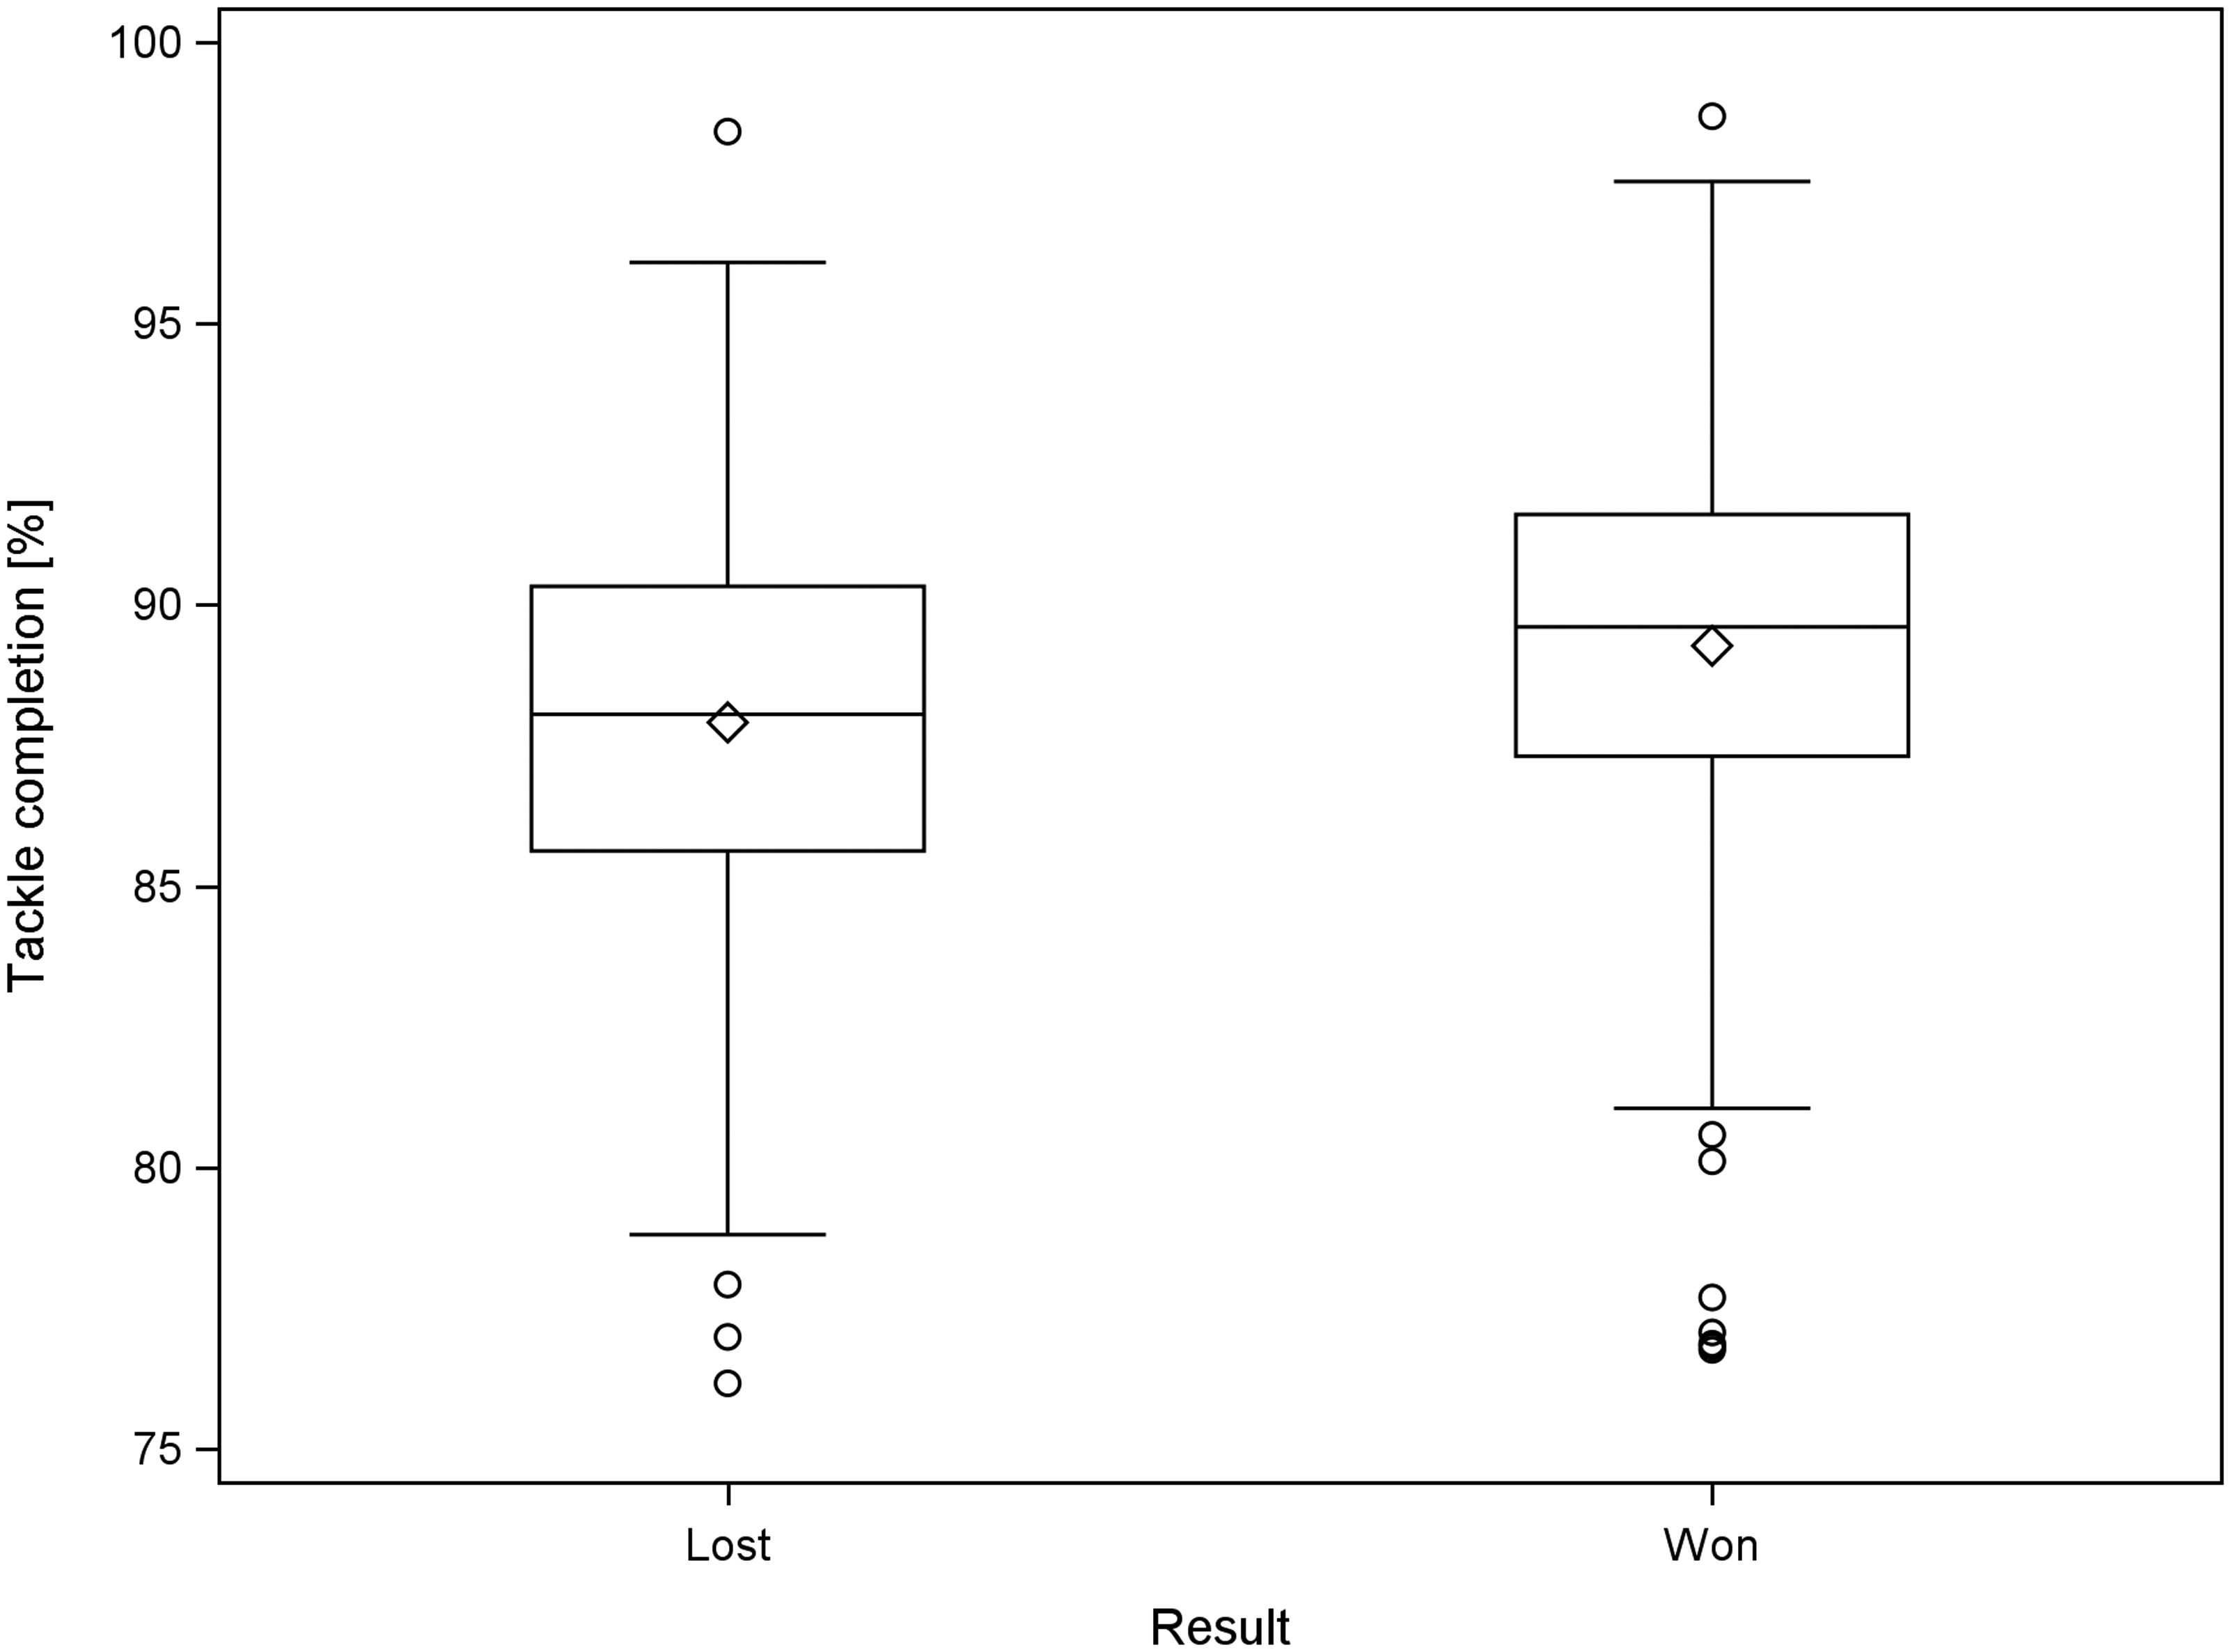
Mean tackle completion rate percentage per match.
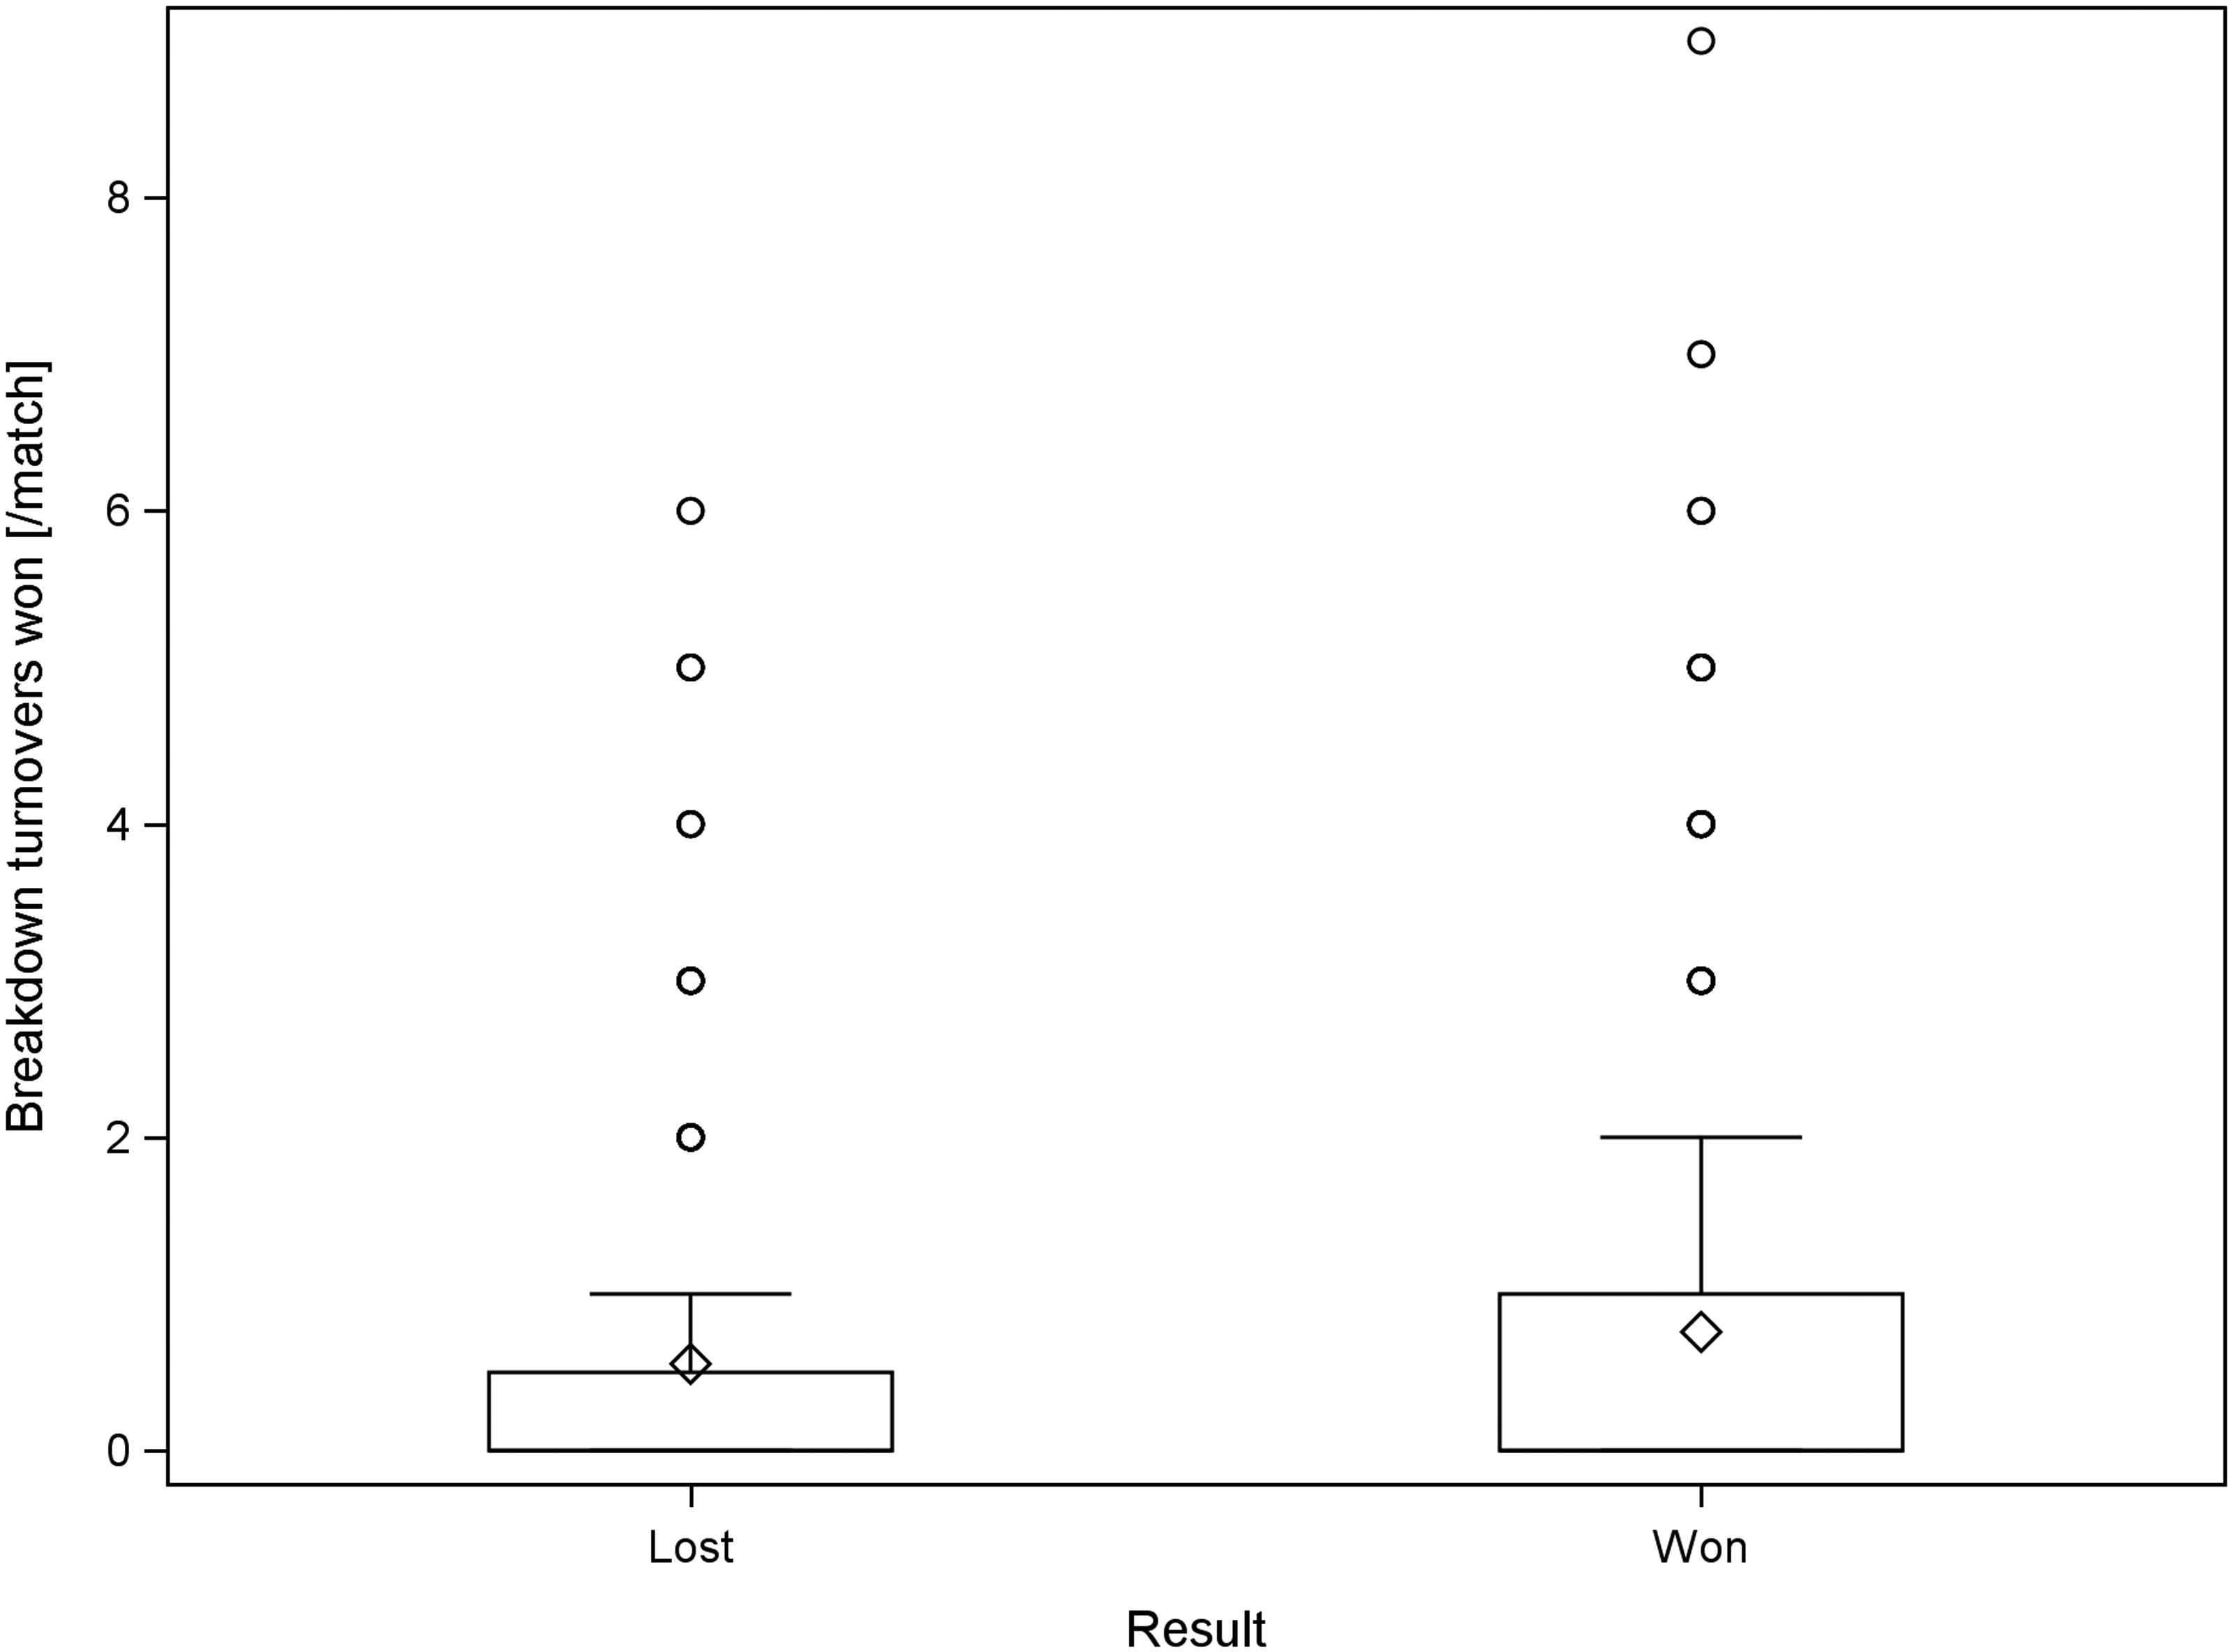
Mean number of breakdown turnovers won per match.
Incidence rate (per game) and probability (%) (tackle completion, lineouts won, scrums won) of performance indicators for the Super Rugby competition, by season and match result.
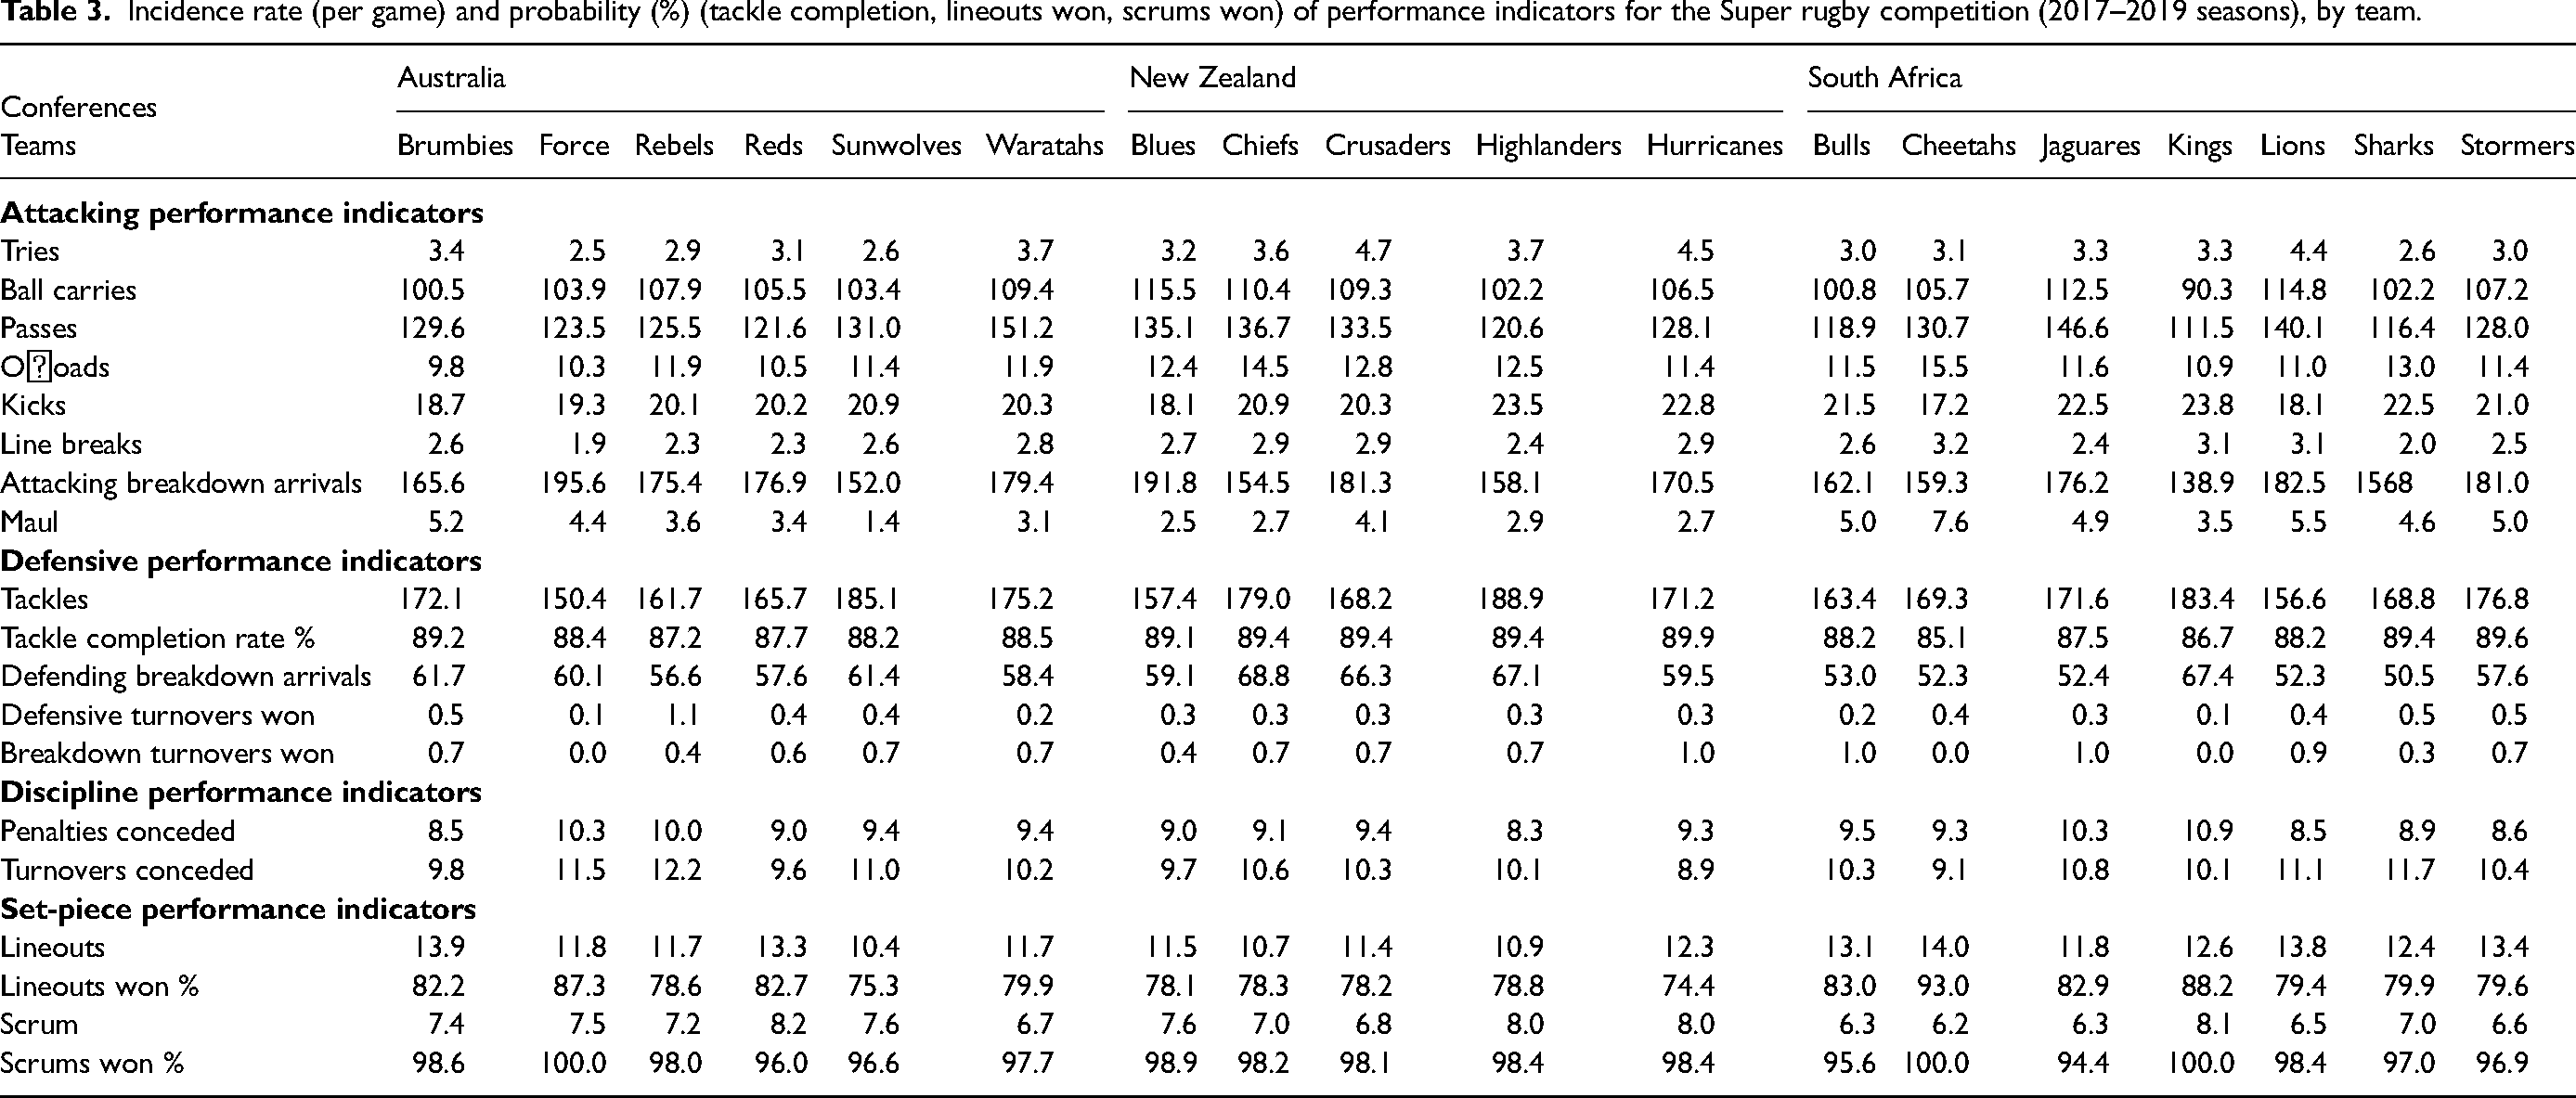
Incidence rate (per game) and probability (%) (tackle completion, lineouts won, scrums won) of performance indicators for the Super rugby competition (2017–2019 seasons), by team.
Association of performance indicators with match result.
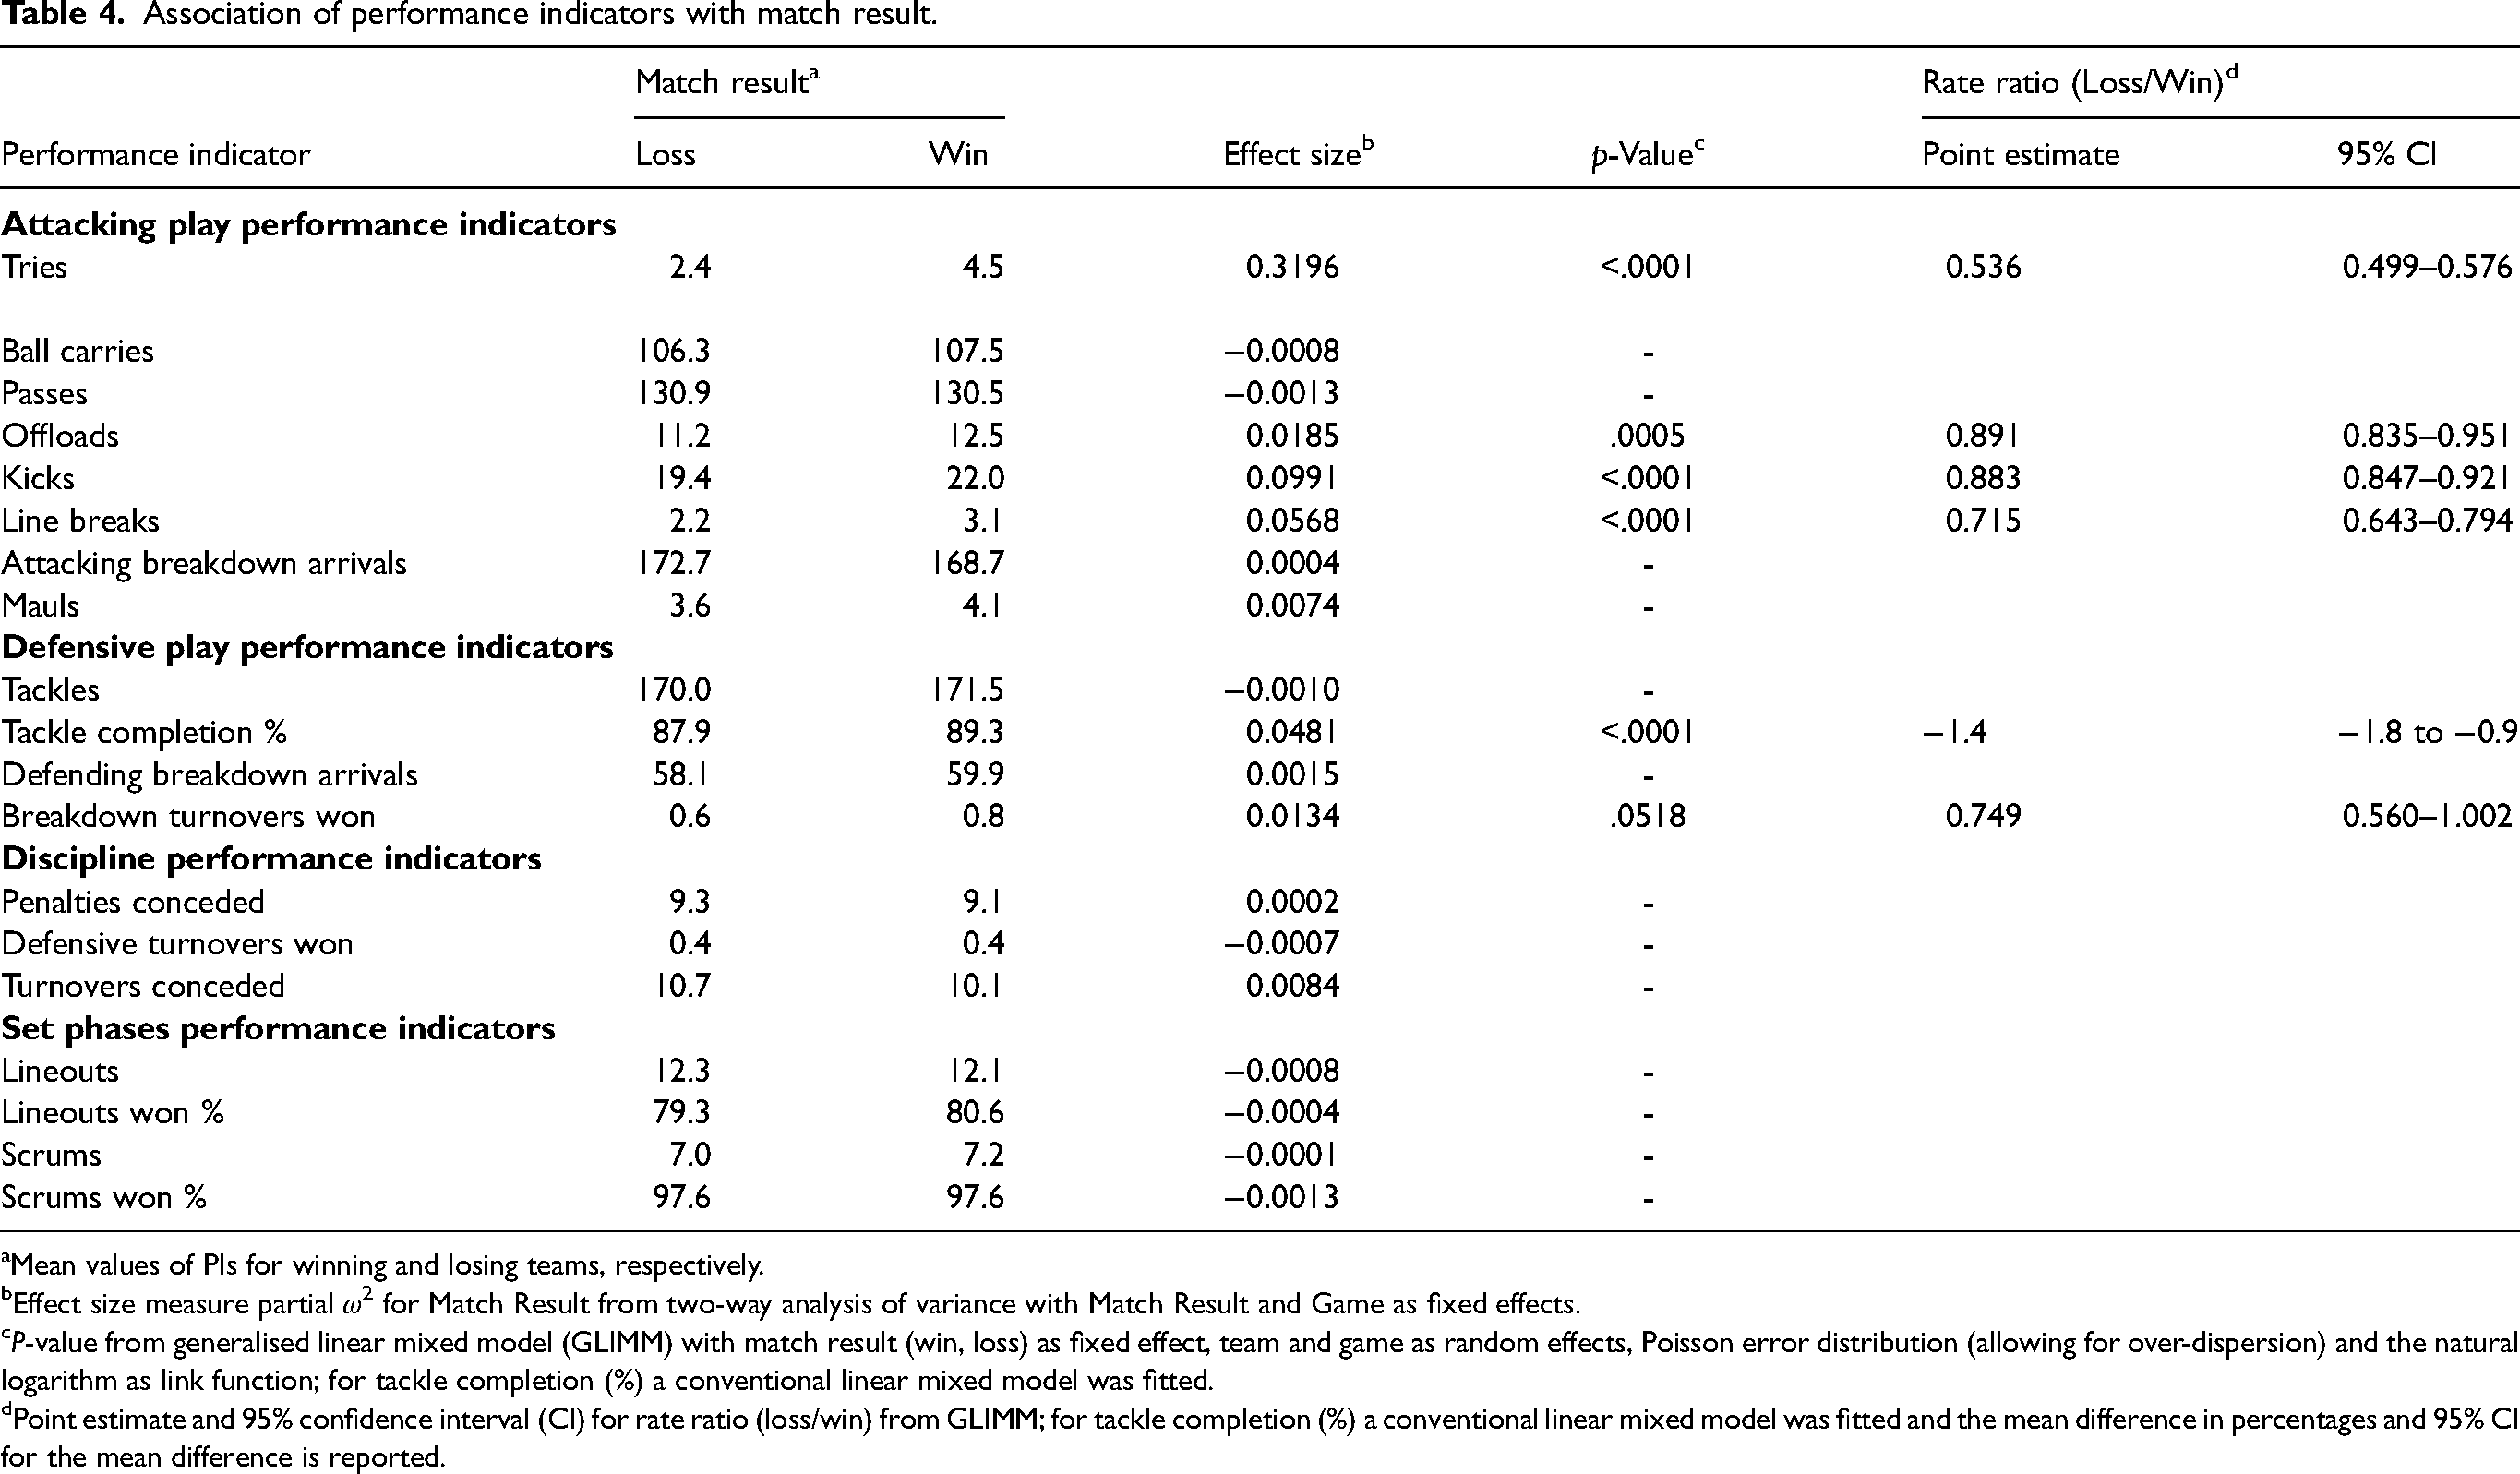
Mean values of PIs for winning and losing teams, respectively.
Effect size measure partial ω2 for Match Result from two-way analysis of variance with Match Result and Game as fixed effects.
P-value from generalised linear mixed model (GLIMM) with match result (win, loss) as fixed effect, team and game as random effects, Poisson error distribution (allowing for over-dispersion) and the natural logarithm as link function; for tackle completion (%) a conventional linear mixed model was fitted.
Point estimate and 95% confidence interval (CI) for rate ratio (loss/win) from GLIMM; for tackle completion (%) a conventional linear mixed model was fitted and the mean difference in percentages and 95% CI for the mean difference is reported.
Attacking play performance indicators
Losing teams in the Super Rugby competition between 2017 and 2019 had a significantly lower mean number of tries (p < .0001; rate ratio (RR) = 0.536; 95% CI 0.499–0.576) per game (2.4) compared to winning teams (4.5) (Table 4, Figure 1). There was also a significant difference in the mean number of offloads (p = .0005; RR = 0.891; 95% CI 0.835–0.951) per game, with winning teams (12.5) outperforming losing teams (11.2) (Table 4, Figure 2). Similarly, losing teams had a significantly lower mean number of kicks (p < .0001; RR = 0.883; 95% CI 0.847–0.921) per game (19.4) compared to winning teams (22.0) (Table 4, Figure 3). The mean number of line breaks (p < .0001) per game was significantly lower in losing teams (2.2) than in winning teams (3.1) (Table 4, Figure 4). The effect size of the difference between winning and losing teams for attacking breakdown arrivals and mauls was small (Table 4).
Defensive play performance indicators
Losing teams demonstrated a significantly lower mean tackle completion rate percentage (p < .0001; MD = −1.4%; 95% CI −1.8% to −0.9%) per game (87.9) compared to losing teams (89.3) (Table 4, Figure 5). Mean breakdown turnovers won per game (p = .0518; RR = 0.749; 95% CI 0.560–1.002) also showed a borderline significant difference, with losing teams (0.6) achieving fewer turnovers than winning teams (0.8) (Table 4, Figure 6).
Discipline performance indicators
No significant differences were found between winning and losing teams for penalties conceded per game and turnovers conceded per game (Table 4). In both cases, winning teams generally had lower numbers than losing teams across the three seasons studied (Table 4).
Set phases performance indicators
The mean scrums won percentage per game was similar for winning and losing teams (97.6) (Table 4).
Discussion
The findings of the current study examining PIs in the Super Rugby competition from 2017 to 2019 provide valuable insights into the significant differences observed between winning and losing teams, particularly in terms of their attacking and defensive play. Winning teams displayed notable differences in their attacking performance compared to losing teams, with higher numbers of tries, offloads, kicks, and line breaks. These findings suggest that winning teams possessed a superior ability to penetrate the opposition's defence, maintain fluid attacking movements, gain territorial advantage, and successfully breach the defensive line. Additionally, defensive ability emerged as a crucial factor distinguishing winning teams, as evidenced by their higher tackle completion rates and success in winning breakdown turnovers as the defending team.
Attacking play performance indicators
Winning teams consistently outperformed losing teams in PIs related to attacking play, such as the number of tries scored. This highlights their ability to breach the opposition's defence and capitalise on scoring opportunities. Studies have shown that teams with a higher number of tries are more likely to win matches, emphasizing the importance of effective attacking strategies and sustained attacking superiority.4,12 A key finding of this study by Coughlan et al. 16 was that the most frequent try-scoring playing pattern found from the cluster analysis was a lineout followed by a maul this trend is evident in modern rugby. The success or failure of an attacking team to break through the defensive line of their opposition in rugby union will to a great extent determine the outcome of a rugby match because this is how a try is scored. 17 Tries have repeatedly been shown to be a discriminating factor in the success of international rugby teams. 18 As expected from previous research the number of tries scored per game over the three seasons was significantly higher in winning teams than losing teams and is always considered a critical PI to winning and losing in Super Rugby.4,12
In addition to scoring more tries, winning teams in Super Rugby demonstrate a more dynamic and skilful style of play, as evidenced by their higher average number of offloads.6,19 The number of offloads per game across the three seasons also proved to be significantly higher in winning teams than losing teams leaning towards the attacking approach of teams in Super Rugby as supported by Pulling and Stenning 19 and Schoeman and Schall6,16 The inaugural World Cup saw 30 offloads per match – double the total of the 2019 tournament – and passes out of contact have declined almost every year, except for a slight resurgence in 2011.9,10 Offloads play a crucial role in creating opportunities for support play and maintaining continuity in the attacking phase. 19 According to Amayo and Tierney 20 by executing successful offloads, winning teams keep the defence off balance and catch opponents off guard, leading to increased scoring chances. Their proficiency in identifying and exploiting defensive gaps, manipulating the defensive line, and launching incisive attacks consistently put pressure on the opposition. 20 In an investigation by Hendricks et al. 21 found that fending and leg drive in the tackle increased the chance of offloading for the ball carrier, while tacklers executing a front-on-shoulder tackle with leg drive was the most effective way to decrease the chances of an offload. Strong fending strategies created opportunities to offload the ball during the tackle. 22 It was further found that an attacker using an evasive manoeuvre such as a fend or sidestep significantly decreased the chances of a defender stopping an offload. 22 The study by Amayo and Tierney, 20 revealed that tackling lower increased the chances of offload success for the ball carrier. The shift towards lower tackle heights is likely to result in an increased number of offloads and players, coaches and defensive systems must be able to adapt to this.
Furthermore, kicking is an important aspect of the game of rugby, and winning teams tend to make more kicks on average compared to losing teams. The significantly higher number of kicks by winning teams compared to losing teams (p < .0001) can be attributed to successful teams opting to gain a territorial advantage from which to launch scoring opportunities or an attempt to pressure the opposition teams into defence when teams might try to run the ball back at them.5,6,12,23 A study by Colomer et al. 24 presented the importance of an effective tactical kicking game in attacking strategies was highlighted, along with an adaptable defensive structure following a turnover. Unsuccessful performance behaviours in international rugby were reported to be connected with an irrational kicking game, a weak defensive line and losing possession off set-piece plays. 24 The effective use of kicking may provide a team with a territorial advantage, forcing opponents into less favourable positions and creating opportunities for turnovers and counterattacks. 24 By well-placed kicks, teams may find open spaces and initiate attacking moves.12,24 Kicking, therefore, plays a significant role in determining match outcomes and creating opportunities for success. This is revealed through the current study with winning teams having produced a significantly higher number of kicks per game throughout the three seasons compared to losing teams and this notion is supported by previous studies.6,12,25
Line breaks stand out as another important PI that significantly distinguishes between winning and losing teams.4,12 Line breaks indicate superior attacking skills, the ability to exploit defensive gaps and astute decision-making.12,17 Through precise running lines, intelligent positioning, and well-timed acceleration, teams penetrate the opposition's defensive line, creating scoring opportunities. 26 Effective support play and coordination between ball carriers and support runners further contribute to their success in sustaining attacking momentum.16,26 Therefore, from an attacking point of view, line breaks are useful in moving the ball closer to the opposition's try-line while maintaining possession. According to Den Hollander et al. 17 line breaks are associated with overall team success and try-scoring opportunities. The study further revealed that the top five teams in the competition created the most line breaks, compared to the middle five or bottom five teams. A study by Diedrick and van Rooyen 18 concluded that line breaks were an effective source of tries with an average of 2 tries per match being scored from a line break.
Defensive play performance indicators
In terms of defence, winning teams in Super Rugby displayed a higher tackle completion rate and potentially more breakdown turnovers. The higher tackle completion rate indicates a stronger defensive effort with fewer missed tackles, reducing the opposition's chances to exploit defensive weaknesses. Although not statistically significant, winning teams also averaged slightly more breakdown turnovers, demonstrating a more effective defensive presence and disrupting the opposition's attacking play. Overall, winning teams show a strong defensive performance characterised by a high tackle completion rate and the ability to secure turnovers during breakdown situations, thus minimising scoring opportunities for the opposition and maintaining control of the game. Previous research into Super Rugby has revealed that winning teams tend to make more tackles per game than losing teams. 5 The current study revealed the tackle completion rate percentage to be the only PI that significantly discriminated between winning and losing teams, with winning teams being superior regarding this PI in Super Rugby between 2017 and 2019. This is supported by Schoeman et al. 5 and Schoeman and Schall 6 that found that tackle completion rate percentage is a key PI in winning a game in Super Rugby. Mean breakdown turnovers won per game proved to be another PI related to defensive play that showed a significant difference between winning and losing teams in Super Rugby between 2017 and 2019. As mentioned before, this is probably due to this PI's relation to the acquisition of more ball possession that might play a role in presenting more scoring opportunities after successful repossession of the ball due to a more superior tackle completion rate percentage. This notion is supported by recent studies that highlight the importance of tackle rate completion percentage as an imperative indicator of winning games in Super Rugby.6,12,25
The discrepancies observed in these PIs between winning and losing teams emphasise the importance of excelling in the game's attacking and defensive aspects for success in the Super Rugby competition. Successful teams demonstrate an effective attacking style with higher rates of try-scoring, offloads, kicks, and line breaks. They also exhibit a stronger defensive effort with a higher tackle completion rate and potential breakdown turnovers. These findings underscore the significance of effective attacking strategies, skill execution, defensive organisation, and physicality in achieving success in Super Rugby. The study's findings highlight the significance of both attacking differences and defensive performance in distinguishing winning teams from losing teams in rugby. Coaches and teams can utilise these insights to refine their strategies, improve player skills, and enhance overall performance with the goal of achieving success on the rugby field.
It is essential to acknowledge the limitations of this study. Firstly, the examination of PIs was restricted to those provided by the SARU without considering their availability for different field positions. Additionally, the definitions of PIs used by SARU may not have been aligned with the framework developed by the rugby union video analysis consensus (RUVAC) group. The analysis of the current study data did not involve input from coaches and specialist rugby staff, which could have provided valuable insights. Furthermore, comparing selected PIs across different seasons of Super Rugby posed challenges in accounting for variations in team composition and rule changes over time. Future research can address these limitations by emphasising field positioning when examining PIs, actively involving coaches and on-field specialists in selecting and defining PIs and comparing newly established competitions with previous ones based on consistent PIs. By addressing these limitations, future studies can provide a more comprehensive understanding of the relationships between PIs and team success in rugby.
Practical implementation of the research findings
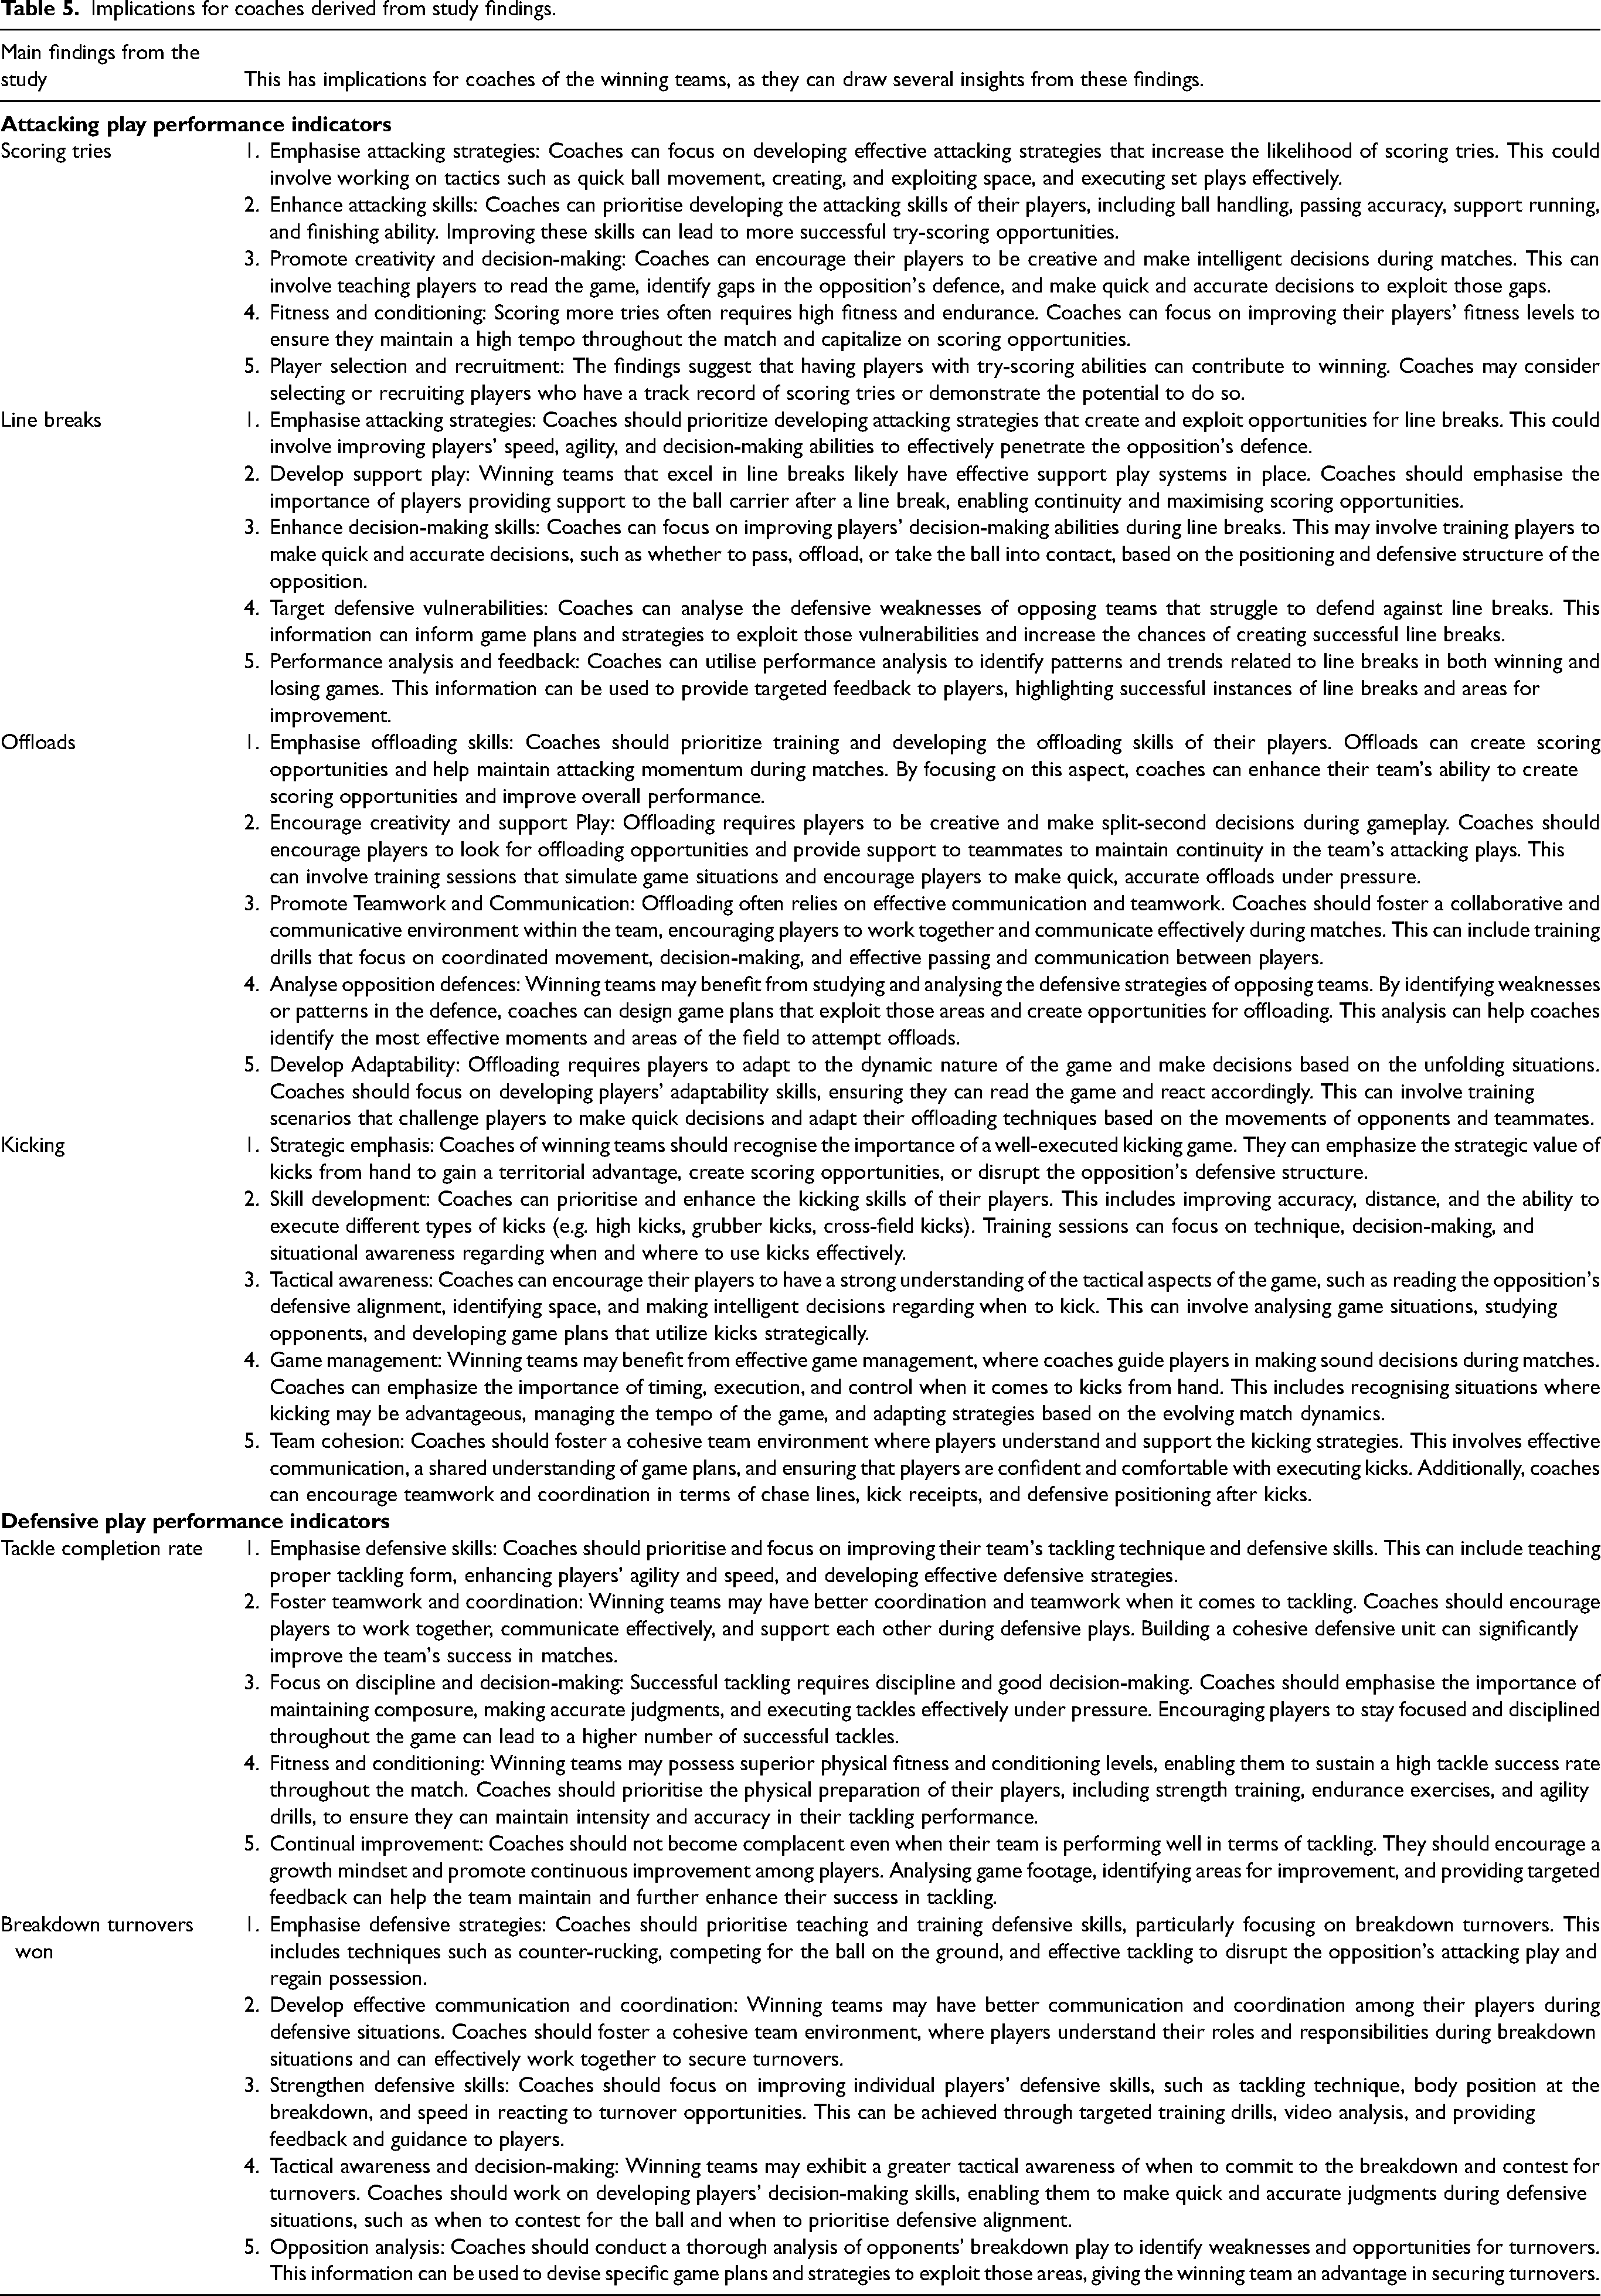
The findings from the comparison of winning and losing teams and the analysis of PIs in Super Rugby have significant implications for coaches, players, and performance analysts. These insights can be utilised to develop effective strategies that capitalise on the strengths observed in winning teams, such as their ability to score tries, execute offloads, make line breaks, and achieve high tackle completion rates. Table 5 presents the derived implications for coaches, encompassing of five key areas related to each key finding.
Implications for coaches derived from study findings.
These PIs serve as benchmarks for continuous improvement, allowing coaches and players to set specific goals and monitor progress over time. Performance analysts can utilise these indicators to assess team performance, track development, and make meaningful comparisons. Importantly, despite the changing landscape of teams and the impact of external factors like COVID-19, these findings remain relevant and adaptable to the current context, enabling informed decision-making and performance enhancement based on the characteristics of winning teams. In summary, these findings provide a solid foundation for deepening understanding, informing decision-making processes, and ultimately improving on-field performance.
Conclusion
In conclusion, this study highlights significant differences in PIs between winning and losing teams in Super Rugby from 2017 to 2019. These findings emphasise the importance of comparing winning and losing teams to understand the factors contributing to success and failure in rugby. Coaches can prioritise PIs and develop effective strategies, focusing on scoring tries, offloading, accurate tactical kicking, and a stronger defence system (see Table 5). Players can target individual development in crucial areas identified in winning teams. Performance analysts can utilise these PIs as benchmarks for evaluating team performance and identifying areas for improvement. In conclusion, this study provides valuable insights to guide coaches, players, and performance analysts in pursuing success in Super Rugby. By understanding the performance characteristics that differentiate winning teams, stakeholders can develop effective strategies, evaluate player performance, set meaningful benchmarks, and continuously strive for improvement, ultimately gaining a competitive advantage.
Footnotes
Declaration of conflicting interests
The authors declared no potential conflicts of interest with respect to the research, authorship, and/or publication of this article.
Funding
The authors received no financial support for the research, authorship, and/or publication of this article.