
Abstract
In 2020, Australia's elite-level netball league introduced the ‘Super Shot’ – an opportunity for teams to gain two versus one goal per shot during the final 5 minutes of each quarter (i.e. Power 5 period). In this study, we ran simulations of Power 5 periods to: (i) identify expected scoring outcomes from Super Shot selection strategies and (ii) examine how Super Shot selection strategies could impact the scoring margin between teams. We ran simulations emulating Power 5 periods with different Super Shot selection strategies for teams individually and when competing against one another, and examined the scoring outputs and margins. A greater tendency for attempting Super Shots was a high-risk: high-reward strategy, where this strategy could result in both high- and low-scoring outcomes (i.e. increased scoring volatility). Average margins were not largely affected by Super Shot selection strategy in simulations between teams, yet the more volatile scoring with a higher tendency for Super Shot attempts led to wider margin ranges. We propose that a singular ‘optimal’ Super Shot selection strategy does not exist and that the match scenario should be a key driver in determining a team’s strategy.
Introduction
Netball is a court-based team sport played predominantly among Commonwealth nations and has one of the highest participation rates for team sports in Australia. 1 As in many court-based team sports, the goal of netball is to score more than the opposition. Netball is, however, unique in that goals may only be scored by two players on each team from within the ‘shooting circle’ (i.e. a half circle around the goal with a 4.9 m radius) at their end of the court. 2 Traditionally, goals scored from within this circle result in one goal for the team. 2 In the 2020 season, Australia's national elite-level league (i.e. Super Netball) made the decision to introduce the ‘Super Shot’. 3 This was ‘in-play’ during the Power 5 period (the last 5 minutes of each quarter), providing an opportunity for teams to gain two goals from the ‘outer’ (i.e. 3.0 m–4.9 m) circle instead of only one goal as before from the inner (i.e. 0 m–3.0 m) circle. 3 The rule has remained in place over subsequent seasons since the 2020 inception.
Our analysis prior to the 2020 season 4 suggested that the added value of the Super Shot (i.e. two goals) aligned well with the elevated risk of shooting from long range, and that teams may have been able to maximise their scoring by taking a high proportion of Super Shots. These findings were, however, based on shooting statistics from a past season where the Super Shot rule was not in effect. Further investigation of netball competitions where a ‘two-goal rule’ was in place (i.e. international Fast5) resulted in a much higher risk of missing long-range goal attempts. 4 We hypothesised that the elevated risk of missing long-range goal attempts with a ‘two-goal rule’ in place stems from situational factors, whereby defensive strategies were likely altered to place a heavier emphasis on defending or preventing long-range attempts. 4 Data from the early years of the Super Shot in place provides an opportunity to re-evaluate the risk: reward value of taking Super Shots with more valid shooting statistics. These data can provide a better foundation for simulating Power 5 periods as a means to identify optimal shooting strategies which coaches/teams may use to develop match tactics. In the present study, we first ran simulations of the Power 5 period for each team individually in an attempt to identify expected scoring outcomes stemming from different Super Shot selection strategies. Second, we ran simulations of teams competing against one another during Power 5 periods to determine how varying the Super Shot selection strategy could impact the scoring margin.
Methods
Participants
Participants for this study included all players across the eight teams from the 2020–2022 seasons of the Australian national netball league (i.e. Super Netball). Our study included publicly available, preexisting data held at the Super Netball Match Centre. 5 An exemption from ethics review was granted by the Deakin University Human Research Ethics Committee.
Data collection
We used the {SuperNetballR} 6 package to extract match data from all regular season games during the 2020–2022 Super Netball Seasons via the Champion Data (official provider of competition statistics) Match Centre. 5 All goal attempts are labeled with identifiers that place them in the inner or outer circle, along with whether they were made or missed. Combined with the timestamp of these events within quarters, we extracted team-specific shooting statistics for: (i) the total number of goal attempts; (ii) the number of goal attempts from the inner and outer circle; and (iii) the number of made and missed goal attempts from the inner and outer circle from each of the four Power 5 period across matches.
Data analysis
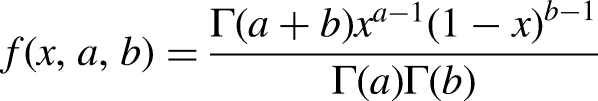
All analyses and simulations were conducted using custom scripts in Python (v 3.7.9). Our study required estimating the probability of making versus missing goal attempts from the inner versus outer circle across the different teams. We achieved this by defining a beta distribution in a probability density function for the different circle zones, specified by:
First – we ran a series of simulations (n = 1000 each) of the Power 5 period for each team, altering the ‘tendency’ for each shot to be taken as a Super Shot. Across each individual simulation, the total number of goal attempts the team received was driven by their expected number of goal attempts in a Power 5 period based on the three seasons worth of data. Specifically, the mean and standard deviation (SD) of goal attempts from a team during Power 5 periods was used to create a truncated normal distribution (upper and lower limits set at ±95% confidence intervals [CIs]) – of which the number of goal attempts for a team in an individual simulation were randomly sampled from. Within each simulation, whether an individual shot was taken as a standard or Super Shot was dictated by the current tendency being simulated. We repeated each simulation across five tendencies towards taking Super Shots, those being: (i) ‘zero’ (0% chance of Super Shot being taken); (ii) ‘low’ (25% chance of Super Shot being taken); (iii) ‘moderate’ (50% chance of Super Shot being taken); (iv) ‘high’ (75% chance of Super Shot being taken); and (v) ‘all out’ (100% chance of Super Shot being taken). For each individual shot during the simulation, a random number between zero and one was generated from a uniform distribution – and a Super versus standard shot was taken depending on if this was lower versus higher, respectively, than the chance of taking a Super Shot (e.g. a random value of 0.45 within a ‘high’ tendency simulation would result in a Super Shot being taken). The success (i.e. make vs. miss) of each individual standard or Super Shot within the simulation was then determined by generating a random value between zero and one from a uniform distribution, alongside a value sampled from the teams relevant probability density function of making a shot from the relevant location (i.e. inner or outer circle). If the value sampled from the probability density function was greater versus lower than the random value – the shot was considered successful versus unsuccessful, respectively. After all individual goal attempts were simulated, the total team score was summed given the value of the made standard and Super Shots. We calculated the scores achieved with the varying Super Shot tendencies relative to the ‘zero’ tendency (mean ± SD, range) to examine the expected increase or decrease in scoring with altered Super Shot selection strategies.
A similar approach was taken in simulating teams competing against one another during Power 5 periods. A series of simulations (n = 1000) of Power 5 periods were ran between all combinations of teams. We once again used the probabilities of making versus missing goal attempts from within and outside the outer circle during the Power 5 period from each team to estimate scoring. To determine the number of goal attempts each team received in a simulation, we created two truncated normal distributions based on the mean and SD of total goal attempts and the proportion of these attempts by each team in Power 5 periods (upper and lower limits set at minimum and maximum values). The number of goal attempts the first team received (i.e. Team A) was determined by the product of values randomly sampled from the two distributions (e.g. values of 12 and 0.75 would result in nine attempts to Team A) of total goal attempts. The number of goal attempts the second team received (i.e. Team B) was then determined by allocating those remaining from the total goal attempts (e.g. in the aforementioned example Team B would receive the remaining three attempts). As part of this approach, we ensured that there was an appropriate balance between the disparity of goal attempts each team received (i.e. each team received an even amount of simulations where they had the same amount of more vs. less attempts). The series of 1000 simulations was repeatedly run between all combinations of teams and the aforementioned Super Shot selection tendencies. Standard versus Super Shot selection and shot success within simulations were determined in the same manner described earlier (i.e. random number generator vs. chance of Super Shot being taken and value sampled from the teams shot success probability distribution). At the end of each simulation, the teams’ scores were summed and the subsequent margin was determined. The mean ± SD and range for margins between each team across the various Super Shot tendency combinations were then calculated. We also inspected the proportion of simulations each team won versus lost across simulations and the mean ± SD margin in these cases.
Results
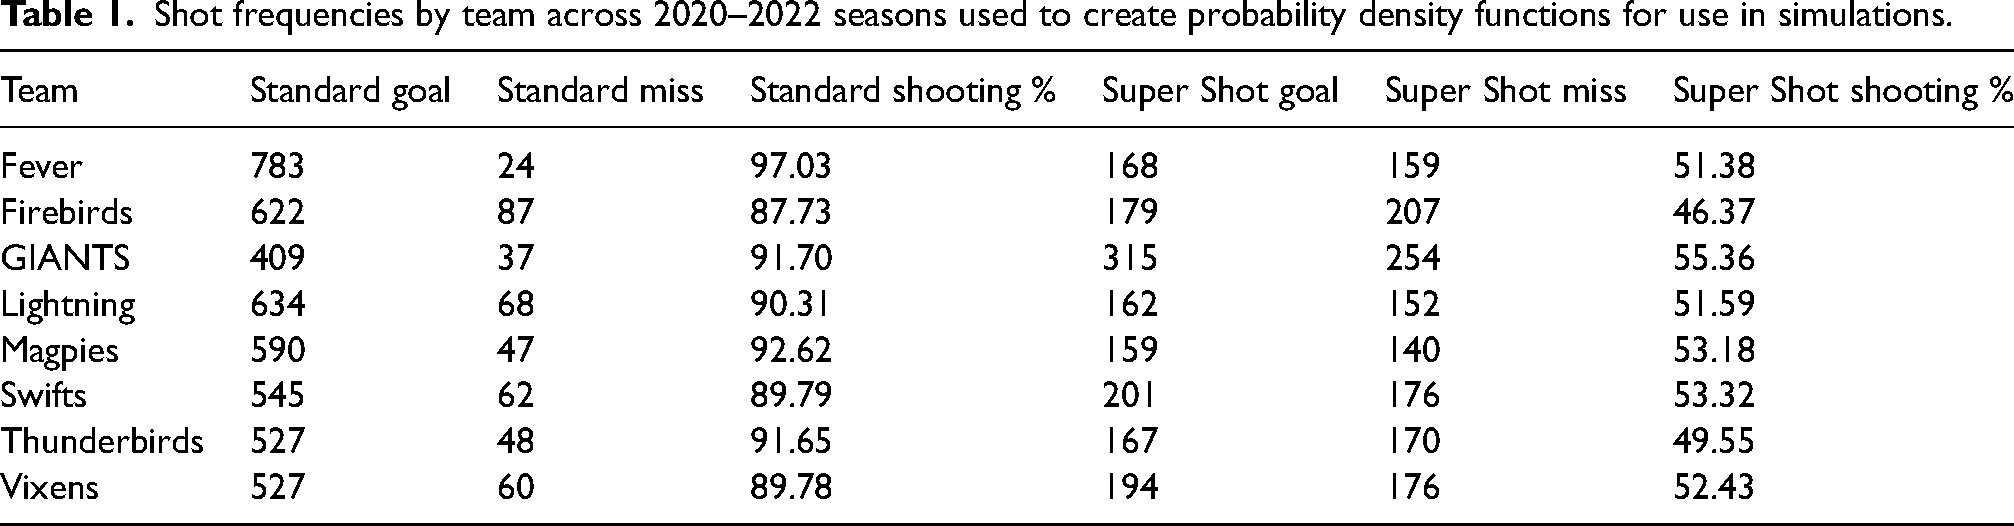
The shot frequencies for each team used to create probability density functions for use in simulations are displayed in Table 1.
Shot frequencies by team across 2020–2022 seasons used to create probability density functions for use in simulations.
Our initial simulations of individual team scoring within Power 5 periods using variable Super Shot selection tendencies found a small increase in mean scoring relative to the ‘zero’ Super Shot tendency. Across all teams, the mean (±SD) goals scored relative to the ‘zero’ tendency were 1.03 (± 0.21), 1.07 (± 0.30), 1.10 (± 0.37) and 1.14 (± 0.43) across the ‘low’, ‘moderate’, ‘high’ and ‘all out’ strategies, respectively. Alongside the mean increase in relative goals scored, we observed a corresponding widening of the variance (i.e. SD) and range of scoring values with higher tendencies to take Super Shots – with these observations consistent across teams (see Figure 1).
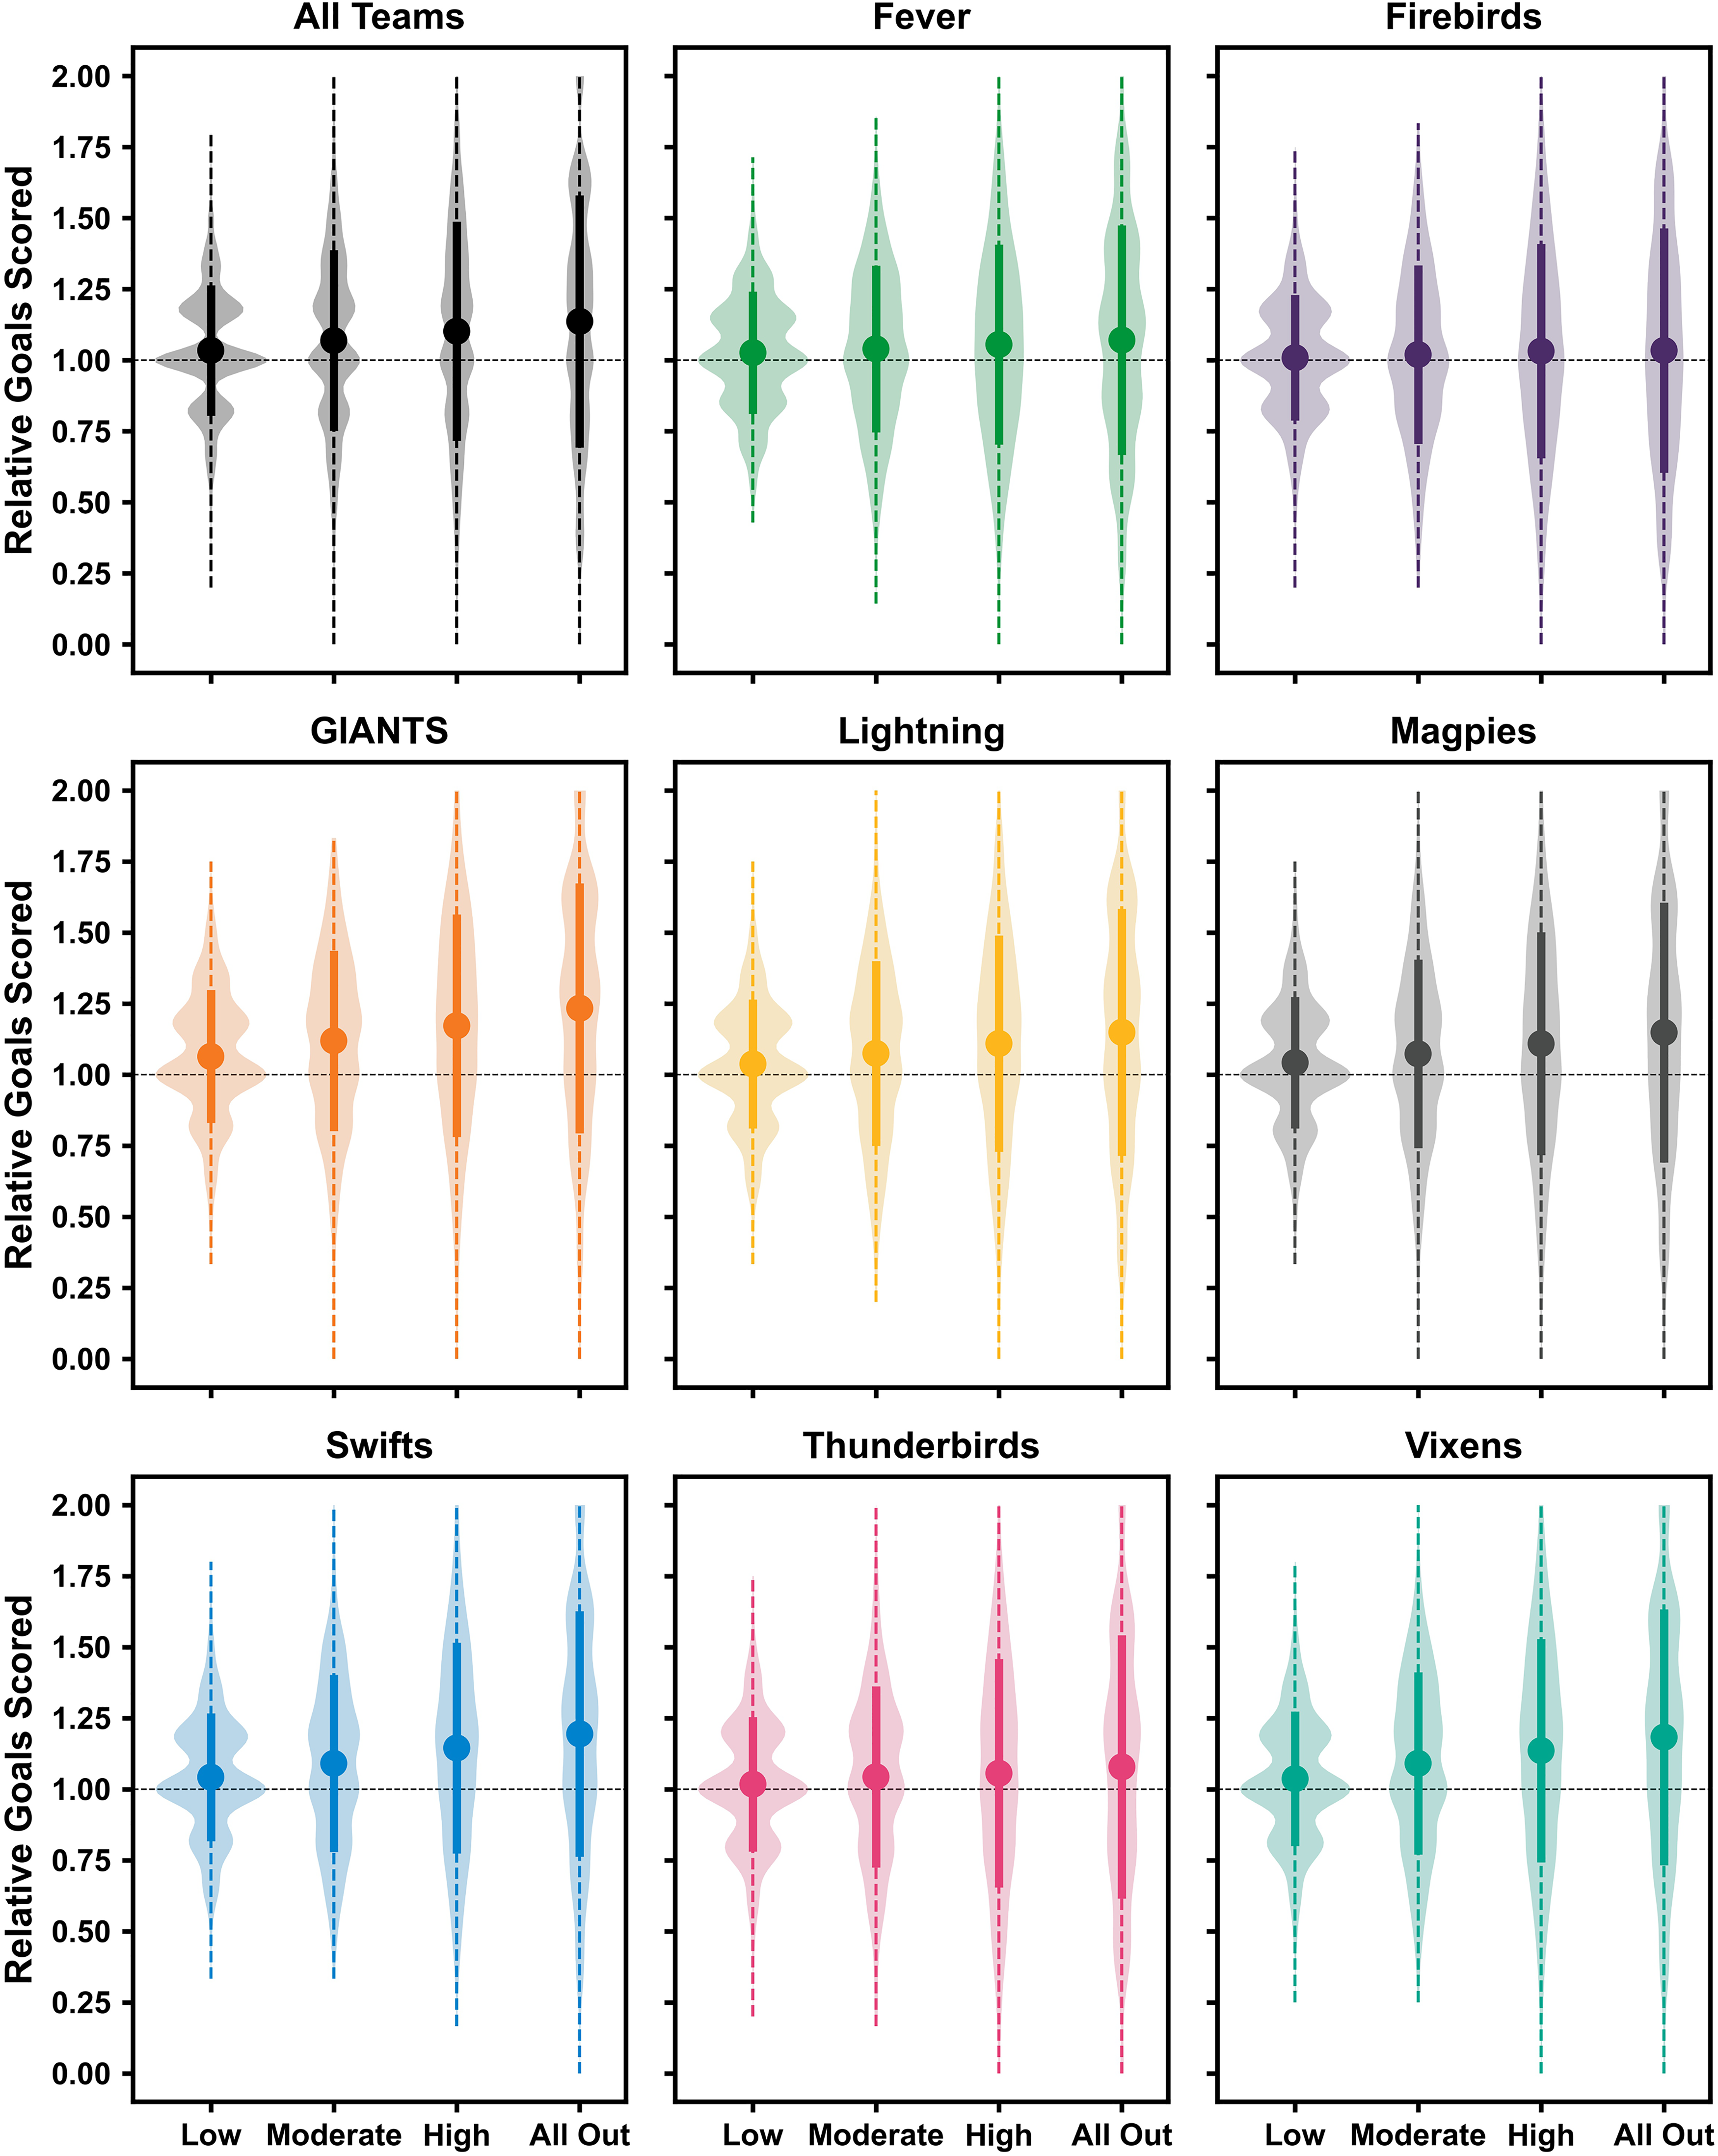
Total goals scored by teams across simulations (n = 1000) with different super shot selection tendencies relative to the ‘zero’ super shot tendency. Point and solid lines represent mean ± standard deviation. Dashed line represents a range of data. Shaded violin represents the distribution of data.
Our simulations of competitive Power 5 periods between teams found that on average the margins between the two teams remained close to zero, irrespective of the Super Shot tendency used or team involved (see Figure 2; note that only even-numbered margins are possible in the ‘all out’ vs. ‘all out’ strategy).
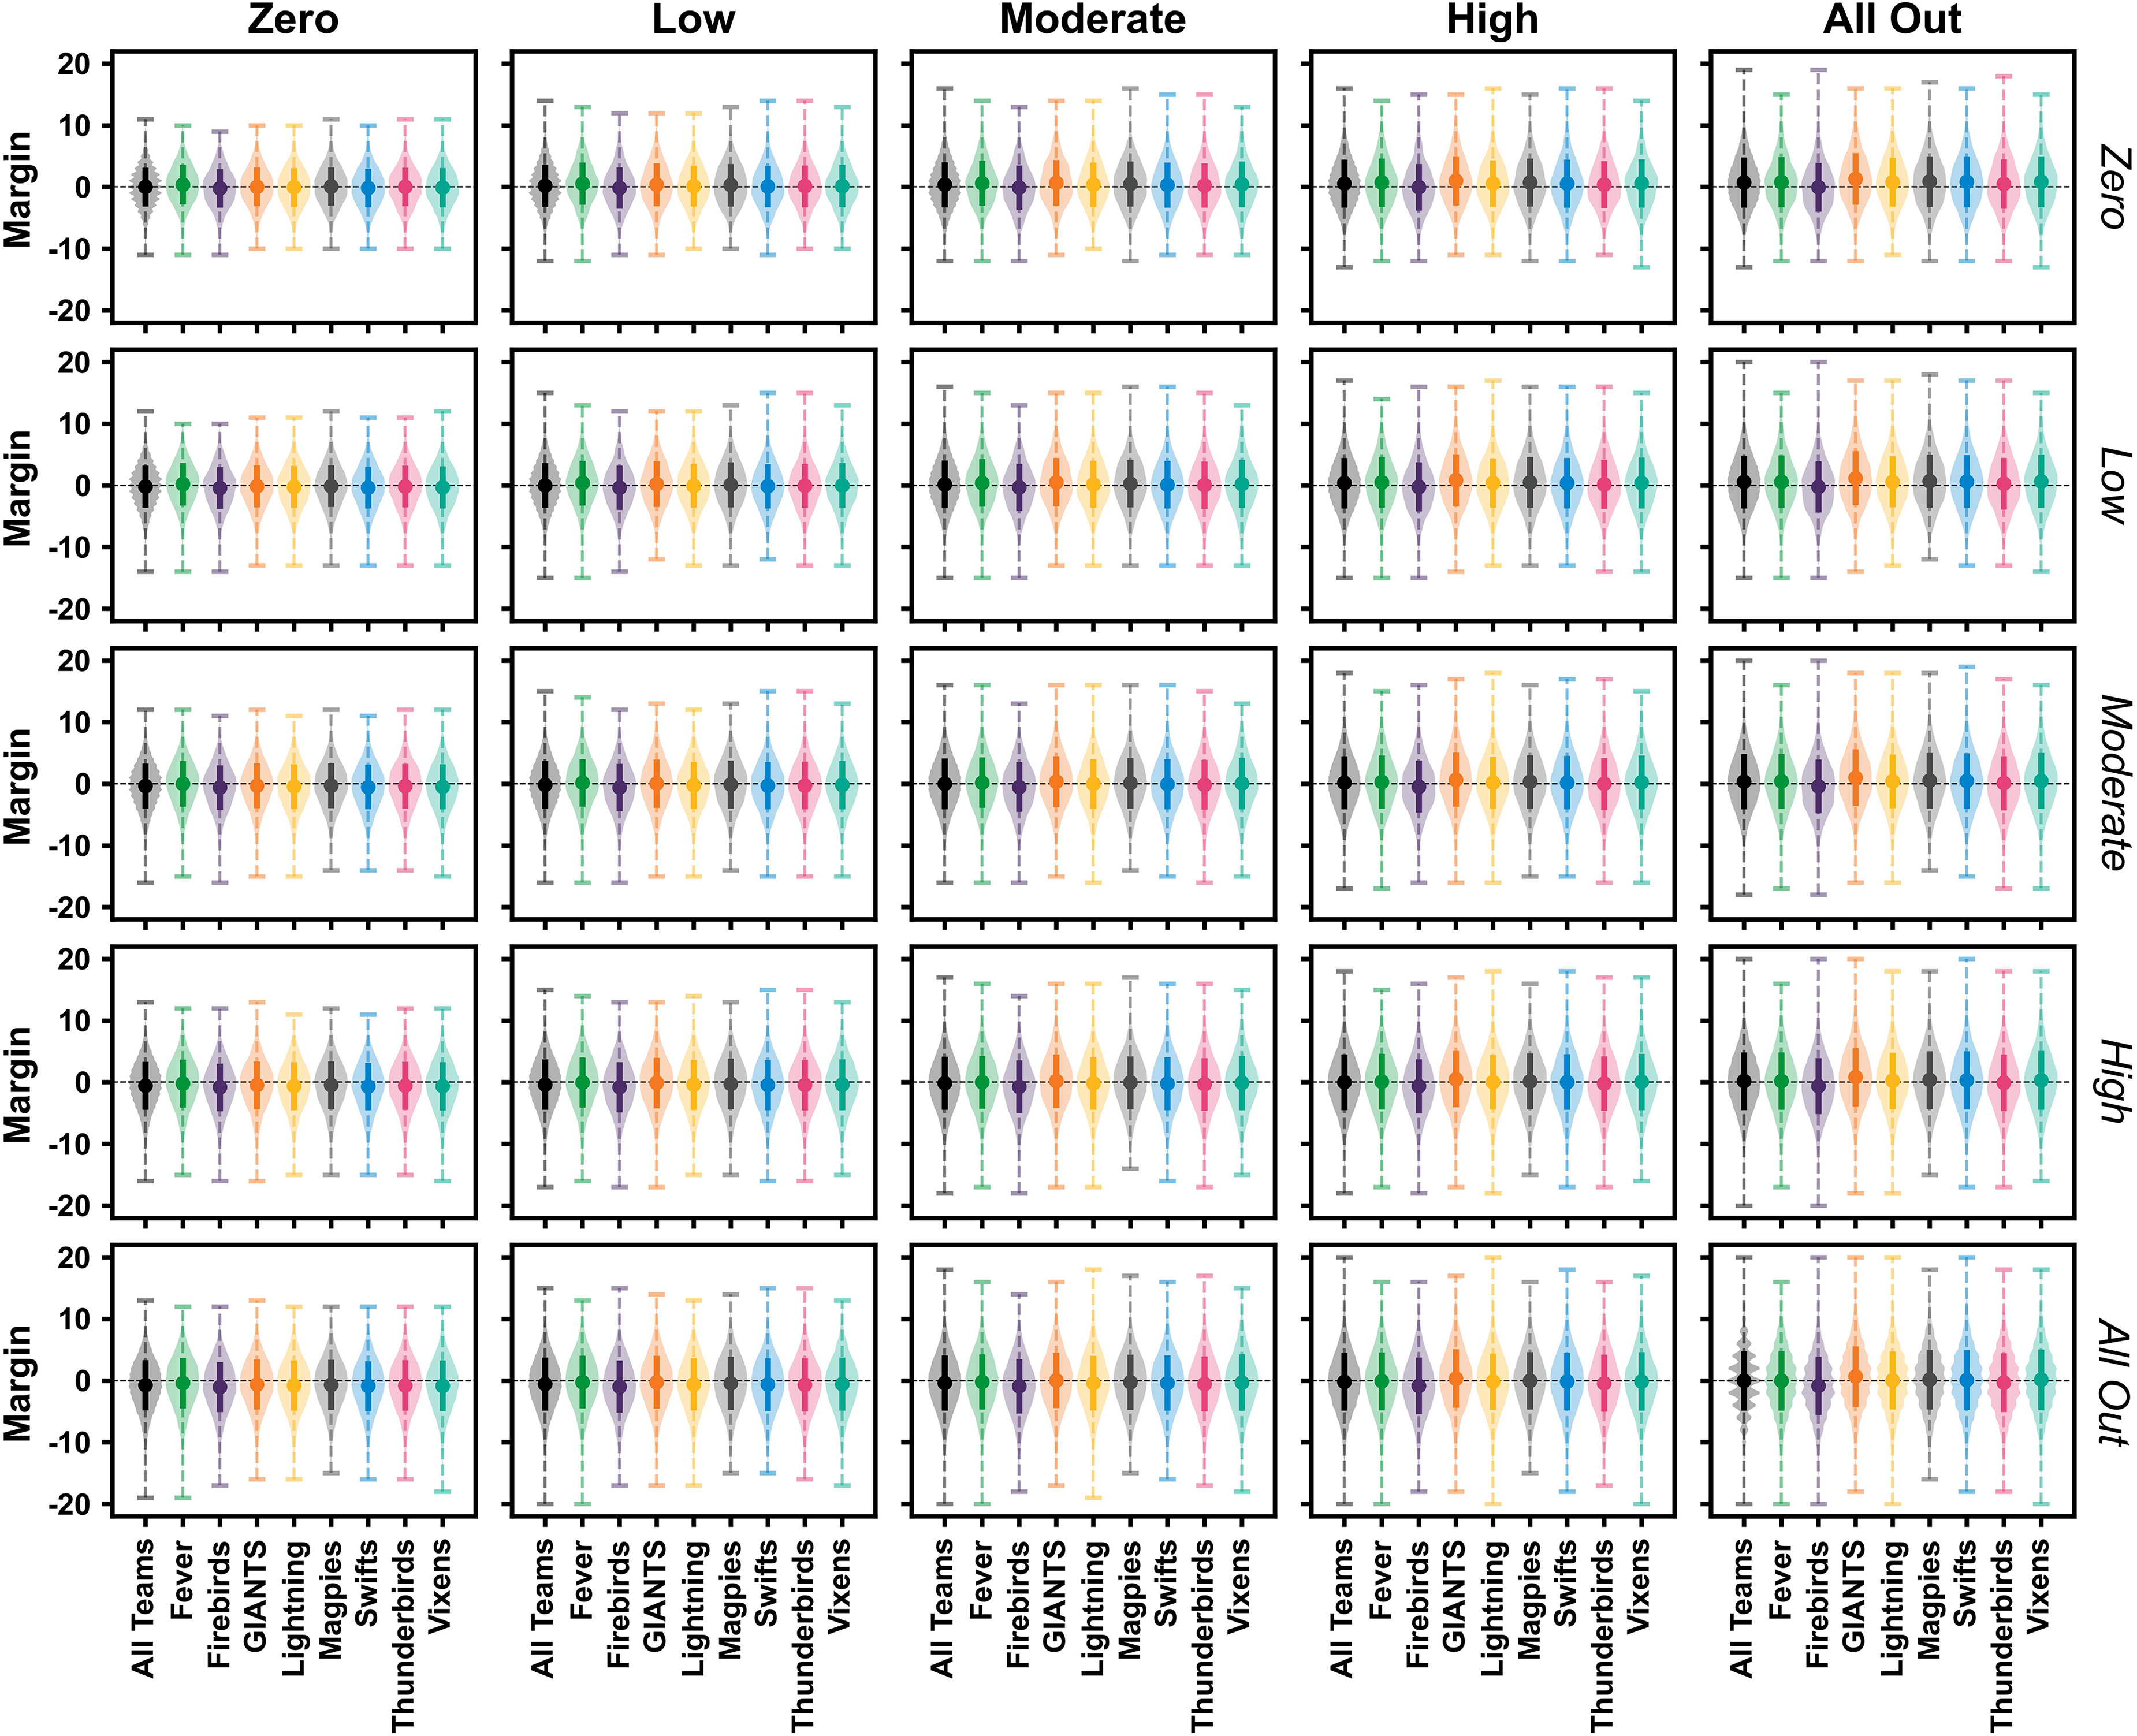
Power 5 period margin between teams during simulations (n = 1000) using different super shot tendencies. Positive and negative margins reflect the period being won by the column-listed strategy (i.e. bolded) versus row-listed strategy (i.e. italicised), respectively. Point and solid lines represent mean ± standard deviation. Dashed line represents a range of data. Shaded violin represents the distribution of data.
Inspecting the outcomes of individual teams’ competitive simulations revealed that the proportion of Power 5 periods won and average margin came with differing Super Shot selection strategies across the various teams (see Supplementary Material 1).
Discussion
The introduction of the Super Shot to Australia's national elite-level league (i.e. Super Netball) presented a dramatic change to the league's scoring rules. Teams are now offered an opportunity to double the value of a successful shot (i.e. two goals) by taking the shot from within the ‘outer’ shooter circle (i.e. 3.0 m–4.9 m range) in the final five minutes of each quarter (i.e. Power 5 period). Using data from the first three seasons with the rule in place, we sought to use a numerical simulation approach to understand the potential scoring outcomes within and between teams during the Power 5 periods when adopting different Super Shot selection strategies. We found that teams can increase their average scoring within Power 5 periods by adopting a higher tendency for taking Super Shots (and typically attempting a greater number of Super Shots) relative to taking none at all. However, this average increase in score came with greater volatility (i.e. increases in the variance and range of relative scoring) – with teams scoring between zero to two times as many goals under the ‘high’ (i.e. 75% chance of selecting a Super Shot) and ‘all out’ (i.e. 100% chance of selecting a Super Shot) tendencies. Our simulations of competitive Power 5 periods between teams found that the average margin between teams remained relatively close to zero across all the simulated combinations of Super Shot selection tendencies. However, the added volatility of scoring with higher tendencies for selecting Super Shots led to increasingly wider margin ranges in both positive and negative directions when these shot selection strategies were implemented. Inspecting the outcomes of individual teams from these competitive simulations, we observed that variable Super Shot selection strategies gave teams the greatest chances of outscoring their opponent. Overall, our findings suggest that adopting a high tendency for Super Shots in the Power 5 period presents a potentially volatile high-risk scenario – whereby teams should expect considerable variation in their scoring outcomes.
Our findings suggest that adopting a higher tendency (and typically attempting a greater number of Super Shots) to take Super Shots can elevate a team’s average scoring in the Power 5 period. This effect was, however, more pronounced across certain teams. For example, data from the GIANTS, Swifts, and Vixens resulted in the highest average increase for relative scoring with a greater tendency to select Super Shots; whereas a much smaller effect was observed with data from the Fever and Firebirds (see Figure 1). These variable effects are most likely driven by each team’s probability of success when taking Super Shots, whereby those teams who experienced greater versus lesser effects exhibit higher versus lower shooting percentages from Super Shot range (see Table 1). A team’s shooting circle personnel and their ability to make long-range goal attempts is therefore an important factor in whether an aggressive Super Shot selection strategy is likely to be more effective. Despite the differing changes in average relative scoring, each team experienced a similar widening in the potential variability and range of scoring with higher tendencies for selecting Super Shots (see Figure 1). Under the ‘high’ and ‘all out’ tendencies – every team experienced simulations where scoring reached zero or two times that when no Super Shots were selected, while this same outcome occurred for some teams under the ‘moderate’ tendency. Restricting Super Shot attempts (i.e. ‘none’ or ‘low’ tendencies) is a safe, but likely limiting strategy for scoring in the Power 5 period. The high probability of standard shot success (see Table 1) is the likely driving factor behind more consistent scoring with lower tendencies for selecting Super Shots. Conversely, higher tendencies for selecting Super Shots presents a riskier strategy. Teams adopting such a strategy likely expose themselves to more volatile scoring (i.e. decreased floor, higher ceiling), effectively ‘living or dying by the sword’ that is the Super Shot. There are certain match scenarios where such an approach becomes an attractive option or appropriate risk. When trailing by a large margin with minimal time remaining, the one goal on offer for a standard shot may present very little value to the trailing team. In this scenario, the Super Shot potentially becomes the only or default option (i.e. emulating the ‘all out’ tendency). Conversely, the leading team would likely adopt a ‘safe’ approach and minimise their Super Shot attempts.
Examining the ‘typical’ margins within the simulated competitive Power 5 periods (i.e. mean ± SD) between teams revealed that average margins remained close to zero (i.e. rarely exceeding two to four goals) irrespective of the Super Shot tendencies used (See Figure 2 and Supplementary Material 1). These findings suggest that, on average, the Super Shot selection strategy of a team may not be a predominant factor in deciding the outcome of a match. Despite this overall finding, we observed scenarios where much larger (i.e. > 5 goals) margins occurred. Much like the individual team scoring simulations, the variation and range in margins during the simulated Power 5 periods increased with greater tendencies to select Super Shots. The widest margins likely occurred in scenarios where a team: (i) received a greater number of goal attempts than their opponent and (ii) had either very high or very low shooting success, particularly with respect to Super Shots. Irrespective of the Super Shot selection strategy, the basic premise of generating more scoring opportunities (e.g. via generating opposition turnovers) alongside a high shooting percentage will typically equate to success. Investigating these additional factors individually was outside the scope of this investigation, but a greater focus on controlling and manipulating these parameters (i.e. number of goal attempts and shooting percentage) could be included in subsequent work using a similar simulation framework. The simulations where we observed large margins could nonetheless have a significant impact within an individual match. The closeness in scoring with which netball is typically played means a yield or loss of greater than five to 10 goals in the Power 5 of a single quarter could dictate the match outcome. These findings therefore emphasise the notion of an aggressive Super Shot selection strategy being a high-risk:high-reward proposition. Teams adopting such a strategy could either win or lose a match within a short time-frame.
Our competitive simulations revealed the potential for team-specific optimal strategies regarding both using and defending the Super Shot. For example, certain teams (e.g. Fever, GIANTS) had their highest proportion of Power 5 period wins when employing the ‘all out’ against the ‘zero’ strategy while other teams (e.g. Swifts, Thunderbirds, Vixens) experienced the opposite with this same comparative strategy (see Supplementary Material 1). The balance between each team’s probability of scoring from the different ranges (i.e. shooting percentages for standard and Super Shot ranges) would be a driving factor behind these results. Teams with a high probability of success from Super Shot range competing against teams with a lower probability of success from standard shot range would likely fare better with this ‘all out’ versus ‘zero’ strategy. This finding perhaps empahises the notion that teams should play to their strengths when it comes to Super Shot selection strategy (i.e. strong standard vs. Super Shot range shooters), while attempting to force their opponent away from their scoring strengths. It is also plausible that teams have variable performance when it comes to defending the Super Shot. A limitation of this study was that we did not include team-specific defensive characteristics (i.e. probability of shot success from standard vs. Super Shot range when playing against certain teams) when conducting these competitive simulations. Including such parameters within a similar simulation design may reveal further details on the optimal team-specific strategies with regard to Super Shot selection.
Limitations
First, our simulations were driven by the global probability of standard and Super Shot success from each team across three seasons. While certain teams may have maintained a consistent group of shooting circle players over this time, it is unlikely that these global statistics represent a specific combination of shooting circle players that would take to the court during a given Power 5 period. Similarly, these global team statistics ignore the potential that teams may preferentially feed a specific shooter to take their Super Shots during Power 5 periods (e.g. emphasis may be given to a specialist long-distance shooter). Incorporating more individualised factors into our simulation design may further the understanding of what constitutes a team’s optimal Super Shot selection strategy. Second, we considered each individual shot within simulations as an independent entity, whereby the outcome of prior goal attempts had no impact on the success probability of later attempts. There is weak evidence to support the ‘hot-hand’ premise in shooting sports, 9 hence this was not a consideration for inclusion in our simulations. Nonetheless, the presence of a ‘hot-hand’ within a given Power 5 period could have a small effect on consecutive Super Shot success. Third, our simulations did not consider any adaptation of strategy within the Power 5 period. It is plausible that teams may move away from an ‘all out’ Super Shot selection strategy midway through a Power 5 period if it fails early on. Conversely, early success with respect to Super Shots may encourage teams to shift from a low to high proportion of Super Shots. Understanding how these decisions impact scoring would provide further evidence around optimal Super Shot selection strategies. Fourth, our simulations did not consider any strategic changes (either by attacking or defensive teams) that would impact the ability to set-up shots in the inner versus outer circle in the Power 5 period. It is plausible that teams would adapt their defensive strategy to limit the higher-value two-goal Super Shots during the Power 5 period, thus making it more difficult for shooting circle players to obtain good positions in the outer circle. This may have a secondary effect of teams requiring more time to set up Super Shot opportunities, potentially reducing the total number of shots taken in the Power 5 period. Understanding the potential secondary effects of the Power 5 period is an avenue for future work in the area.
Conclusion
We found that employing a more aggressive Super Shot selection strategy is a high-risk: high reward proposition, where teams open themselves up to more volatile scoring by taking a high proportion of Super Shots (i.e. chance of scoring very high or low during Power 5 periods). Our simulations of competitive Power 5 periods between teams found that average margins were not largely affected by Super Shot selection, yet the added volatility of scoring with a higher proportion of Super Shots led to potentially wider margin ranges. These simulations also found that certain teams had higher probabilities of outscoring their opponents in Power 5 periods with different combinations (i.e. theirs vs. their opponents) of Super Shot selection strategies. Based on these findings, we propose that the optimal choice of Super Shot selection strategy is situational whereby: (i) teams may be more inclined to adopt an aggressive Super Shot selection strategy in scenarios where high-scoring is a necessary option (e.g. when needing to cut into an opponent’s large lead); and (ii) teams may adapt both their attacking and defensive strategies around Super Shots depending on their own and opponents strengths.
Supplemental Material
sj-pdf-1-spo-10.1177_17479541231181975 - Supplemental material for Simulating shot selection strategies and scoring outcomes in Super Netball’s ‘Power 5’ period
Supplemental material, sj-pdf-1-spo-10.1177_17479541231181975 for Simulating shot selection strategies and scoring outcomes in Super Netball’s ‘Power 5’ period by Aaron S Fox and Lyndell Bruce in International Journal of Sports Science & Coaching
Footnotes
Author contribution statement
Aaron S. Fox: conceptualisation, data curation, formal analysis, writing – original draft, and writing – review and editing; Lyndell Bruce: conceptualisation, and writing – review and editing.
Declaration of conflicting interests
The author(s) declared no potential conflicts of interest with respect to the research, authorship, and/or publication of this article.
Funding
The author(s) received no financial support for the research, authorship, and/or publication of this article.
Supplemental material
Supplemental material for this article is available online.
References
Supplementary Material
Please find the following supplemental material available below.
For Open Access articles published under a Creative Commons License, all supplemental material carries the same license as the article it is associated with.
For non-Open Access articles published, all supplemental material carries a non-exclusive license, and permission requests for re-use of supplemental material or any part of supplemental material shall be sent directly to the copyright owner as specified in the copyright notice associated with the article.